Impact Factor ISSN: 1449-2288

 Global reach, higher impact
Int J Biol Sci 2007; 3(4):251-256. doi:10.7150/ijbs.3.251 This issue Cite
Research Paper
A polychromator-based microspectrophotometer
Valter Evangelista, Mauro Evangelisti, Laura Barsanti, Anna Maria Frassanito, Vincenzo Passarelli, Paolo Gualtieri ![]()
Istituto di Biofisica via Moruzzi 1 56124 Pisa, Italy
Received 2007-2-20; Accepted 2007-4-1; Published 2007-4-1
Abstract
A microspectrophotometer is a digital microscope used to measure absorption and fluorescence spectra. In this paper we describe a polychromator-based microspectrophotometer that performs in vivo absorption or emission measurements at the same time on different subcellular compartments such as photoreceptive and photosynthetic structures of algal cells. In this system, a flat field imaging concave grating polychromator is connected to the slit-shaped exit pupil of a light-guide probe mounted onto a microscope equipped with an epifluorescence module.
The subcellular components, on which the spectra will be measured, are placed in the microscope field and finely adjusted. The outer bundle of the probe is used for centering the objects, while the central bundle of the probe, containing 19 light guides, is used for acquiring either transmitted or emitted light (i.e. fluorescence). The light transmitted or emitted by the subcellular components is collected by the probe mounted in the back focal plane of the ocular. The exit pupil of this probe, connected to a flat field imaging concave grating polychromator, produces a dispersion image that in turn is focused onto a digital slow scan cooled CCD camera. Absorption and emission spectra of algal subcellular compartments are presented
Keywords: Microspectroscopy, algae, chromophores, absorption spectra, emission spectra.
1. Introduction
Nature evolved a very limited number of chromophores in the different evolutionary branches of the tree of life because of the similar needs of the most diverse organisms for both the detection of the external world and the interaction with it. The study of these chromophores and their distribution inside cellular structures is usually based on extractive procedures, followed by biochemical or spectroscopic assays. Extractive techniques often include disadvantages: they can modify the nature of the components and they are not successful in isolating the chromophores. Direct investigation by means of microspectrophotometry of on intact samples has the advantage of preserving the integrity of biological structures or substructures. A microspectrophotometer is a simple apparatus consisting of a modified microscope that can measure absorption or emission spectra of very small areas inside a cell [1].
A high quality microscope is equipped with a polychromator, i.e. a flat field concave grating, which is connected to the slit-shaped exit pupil of a 19 light-guides probe. The dispersion image of the exit pupil produced by the polychromator is focused onto a digital slow scan cooled CCD camera. The main feature of this instrumentation is the possibility to measure in vivo absorption or emission spectra at the same time on different sub-cellular compartments using extremely low light intensities. This set-up represents a better strategy with respect to traditional instruments, since it eliminates errors typical of microspectrophotometry, such as photobleaching, distributional errors, the Schwarzschild-Villiger effect, and allows in vivo reliable spectroscopic investigations [2, 3].
The photosynthetic and the photoreceptive compartments are the main location of chromophores inside algal cells. Absorption and emission spectra measured in vivo on these compartments can provide very precise and accurate information about the spectral range in which chromophore molecules capture photons in their natural environment and their de-excitation pathways [4].
We tested our apparatus by measuring absorption spectra on the eyespot and chloroplast of the unicellular alga Dunaliella and emission spectra on the photoreceptor and chloroplast of the unicellular alga Euglena gracilis.
2. Materials and Methods
Cultures. Euglena gracilis strain Z (Sammlung Von Algenkulturen Göttingen, 1224-5/25) cells were grown axenically in Cramer-Myers medium 0.025 M in sodium acetate (pH 6.8) [5]; cultures of Dunaliella spp. (Sammlung Von Algenkulturen Göttingen, 19-5) were grown axenically in Johnson's medium [6]. Both cultures were kept under constant temperature (24 °C) and continuous illumination (2x10² µmol photons m-2 sec-1). Cells were not dark adapted before the measurements.
Hardware. The hardware platform consists of a Zeiss Axioplan microscope (Zeiss, Oberkoken, DE), equipped with an epifluorescence system, 100x (N.A. 1.3) and 40x (N.A. 0.75) planapochromatic objectives, and a 100 W high-pressure Mercury lamp. The emission spectra were acquired with a combination of a UV-blue filter set (8 nm band pass excitation filter, 365 nm; chromatic beam splitter, 395 nm; barrier filter, 397 nm; irradiance 800 µW/cm2), and a blue-violet filter set (8 nm band pass excitation filter, 436 nm; chromatic beam splitter, 460 nm; barrier filter, 470 nm; irradiance 1100 µW/cm2).
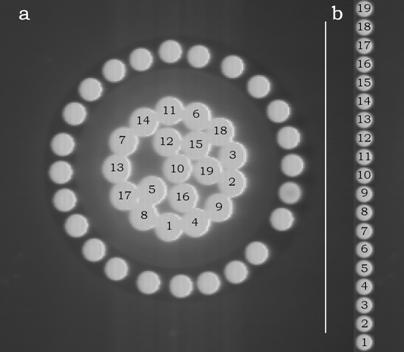
A high quality inspection reflectance probe (mod. 77423 Oriel, Stratford, Connecticut, USA) connected to a Schott KL 1500 probe illuminator system (Schott Corporation, Mainz, DE) was mounted in the back focal plane of the ocular of the microscope (Figure 1). This probe consists of an outer bundle of 24 light-guides and a central bundle of 19 light-guides (Figure 2a). The outer bundle is used for centering the objects, while the central bundle of the probe is used for acquiring transmitted or emitted light. The sub-cellular components on which the spectra have to be measured, are placed in the microscope field and finely adjusted. The exit pupil of the probe (Figure 2b) is connected to a flat field imaging concave grating polychromator (mod. 52300070, Jobin Yvon, Longjumenau, France) that produces a dispersion image of the probe. This image is in turn focused onto a digital slow scan cooled CCD camera (DTA Discovery DS260E, Pisa, Italy), and it consists of 19 multi-lines strips showing the distribution of light intensity according to the wavelength. All the spectra were recorded with a step size of 0.5 nm.
Set-up of the polychromator-based microspectrophotometer
Entrance (a) and exit (b) pupils of the light guide probe
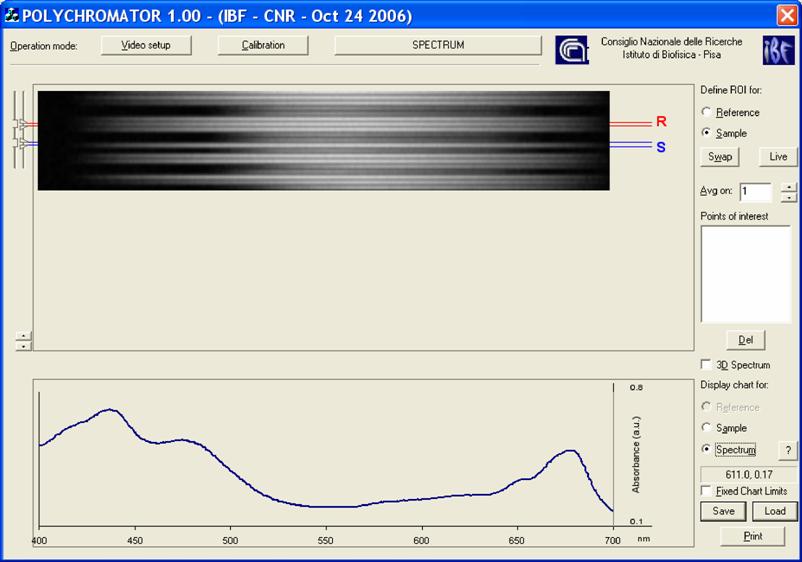
Software. The microspectophotometer instrumentation possesses a graphical interface that allows the set-up of both the optics and the frame grabber (Scion Corporation, Frederick, Maryland, USA) and controls the measurements. Once the instrumental has been set-up, the operator, on the basis of the light guide positions upon the cell, selects the zones of the dispersion image displayed on the top of the graphical layout (in the layout R stands for Reference, and S for Sample). The resulting spectrum is displayed at the bottom of the graphical layout, (Figure 3). All the procedures are written in C++.
Layout of the software interface
Absorption Microscopy. Absorption measurements are based on the comparison of two radiant fluxes density Is and Ir. Is results from the interaction of light with the sample (it is related to absorption cross section of the molecules and the number of absorbing molecules) [7], while Ir results from the interaction of light with the reference material. Therefore, we can consider the absorbance of a sample (As) as derived from the measures as follows:
As=log(Ir)-log(Is) (1)
This equation is known as the Lambert-Beer's law.
For the discussion on the theoretical aspects of image formation and the light transmission in microspectrophotometry see Barsanti et al. 2007 [8].
Absorption spectra were performed on both the eyespot (screening device) and the chloroplast (photosynthetic apparatus) of the unicellular alga Dunaliella. The central bundle of the probe was centered on both the structures in the apical portion of the cell (Is), in such a way that some light-guides were located outside the cell; these guides measure Ir.
Fluorescence Microscopy. Measurements of emission microspectroscopy are based on the radiant flux density Fλ. This density is given by:
Fλ=IAΦFZ (2)
where IA is the amount of light absorbed by the chromophores; ΦF is their fluorescence quantum yield and Z represents the fraction of fluorescence collected by the objective, [9].
Emission spectra were performed on both the photoreceptor and chloroplast of the photosensitive alga Euglena gracilis. The outer bundle of the probe was used for centering the photoreceptor and the chloroplast in the apical portion of the cell, while the central bundle of the probe was used for acquiring light emitted by the two structures.
Photography. Photographs were taken with an Olympus Camedia C-30303 digital camera (Olympus, Tokyo, Japan) mounted onto the microscope.
3. Results and Discussion
Figure 4a shows a bright field image of Dunaliella. The eyespot is recognizable as a the bright orange spot located on the left side of the cell in the apical portion. The other absorbing structures are the green chloroplasts or thylakoids. The size of the eyespot is about 3 μ and the size of the chloroplast is about 10 μ; the probe is superimposed on the structures in order to show their relative position (Figures 4b). Figure 5a shows the absorption spectrum of the eyespot of Dunaliella. This spectrum closely resembles the spectrum obtained by Batra and Tollin [10] on a suspension of eyespot granules, and the other in vivo spectra previously recorded by Strother and Wolken [11], by Benedetti et al. [12] and Gualtieri [13], but it has a better resolution. Major peaks are due to lutein whose bands are centered at 410, 479.5, and 510 nm and β-carotene whose bands are centered at 455.5, 481.5, and 510.5 nm (not shown).
a) Bright field image of Dunaliella. b) Position of the probe upon Dunaliella
Absorption spectra of the eyespot (a) and a chloroplast (b) of Dunaliella


Figure 5b shows the absorption spectrum of the thylakoid compartment of Dunaliella. It clearly shows that Dunaliella belongs to the green lineage of eukaryotic algae since only chlorophylls a and b and carotenoids are present in this spectrum. Gaussian bands decomposition of this spectrum is easily explained as a combination of chlorophyll a bands centered at (410, 435, 444, 585, 615, 626, 634.5, 663, 672, 678, 683, 695 nm, chlorophyll b bands centered at 412, 428.5, 445, 452, 582, 594, 607, 621.5, 652 nm, and carotenoids lutein and bands centered at 410, 479.5, and 510 nm, (not shown), [14].
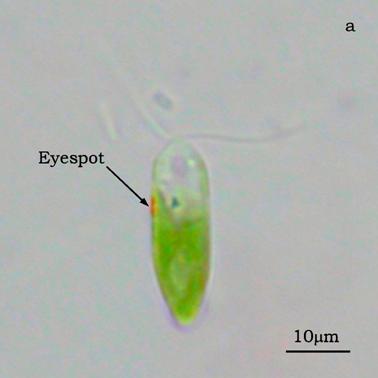
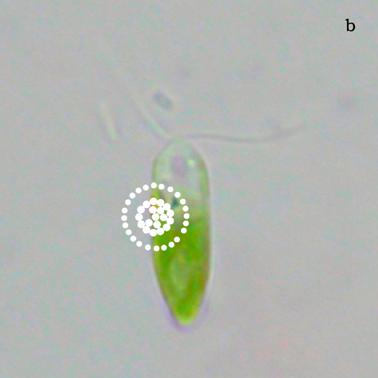
Figure 6a shows a fluorescent image of Euglena. The photoreceptor is recognizable as a the bright green spot located in the apical portion of the cell. The red emitting structures are the chloroplasts. The size of the photoreceptor is about 2 μ and the size of the chloroplast is about 10 μ; the probe is superimposed on the structures in order to show their relative position (Figure 6b).
a) Fluorescent image of Euglena gracilis; b) Position of the probe upon Euglena gracilis
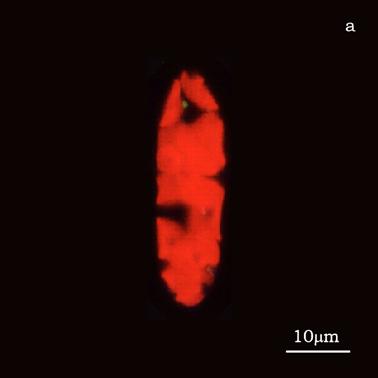
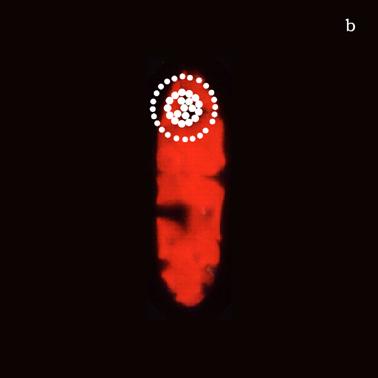
Figure 7a shows the emission spectrum of a single photoreceptor under 436 nm excitation light, after 10 seconds of excitation with the 365 nm light. Gaussian bands decomposition of the emission spectrum reveals 3 bands with different intensity centered at about 500 nm, 525 nm, and 556 nm (not shown). The bands obtained by the Gaussian decomposition indicate the presence of a mixture of very similar conformers in the photoreceptor, each one capable of photocycling between a non-fluorescent parent species and a fluorescent excited species [15]. The presence in the photoreceptor of Euglena of a photochromic chromophore, which undergoes light-driven reversible photochromism has been well established by means of digital and fluorescence microscopy [16]. The photoreceptor possesses optical bistability, i.e. upon photoexcitation the ground state generates a stable excited state, which can be photochemically driven back to the ground state. The 27 kDa protein extracted from the photoreceptor shows a similar behavior, the photochromic reaction cycling between two different stable conformers, the parent and the excited conformers [17].
Emission spectra of the photoreceptor (a) and a chloroplast (b) of Euglena gracilis
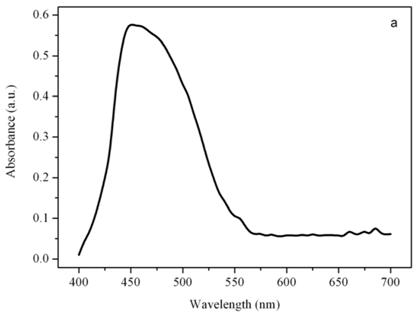
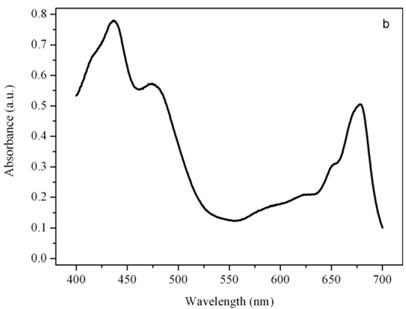
Figure 7b shows the emission spectrum of the thylakoid compartment of Euglena gracilis excited at 463 nm. It is the typical emission spectrum of a chloroplast that contains only chlorophyll a and b whose bands are centered at 685 for the photosystem II and at 725 nm for the photosystem I, [18].
Conflict of interest
The authors have declared that no conflict of interest exists.
References
1. Barsanti L, Gualtieri P. Algae, Anatomy, Biochemistry, and Biotechnology. Boca Raton: Taylor & Francis. 2005
2. Piller H. Microscope photometry. Berlin: Springer-Verlag. 1977
3. Gualtieri P. Microspectroscopy of photoreceptor pigments in flagellated algae. Critical Rev. Plant Sci. 1991;9(6):474-495
4. Millie D, Evens TJ. Using absorbance and fluorescence spectra to discriminate microalgae. Eur. J. Phycol. 2002;37:313-322
5. Cramer M, Myers J. Growth and photosynthetic characteristics of Euglena gracilis. Arch Mikrobiol. 1952;17:384-402
6. Johnson MK, Johnson RD, MacElroy RD, Speer HL, Bruff BS. Effects of salts on the halophilic alga Dunaliella viridis. J Bacteriol. 1968;95:1461-1468
7. Cantor CR, Schimmel PR. Biophysical chemistry, part II. New York: Freeman New York. 1980
8. Barsanti L, Evangelista V, Frassanito AM, Vesentini N, Passarelli V, Gualtieri P. Absorption Microspectroscopy, theory and applications in the case of the photosynthetic compartment. Micron. 2007;38:197-213
9. Barsanti L, Passarelli V, Walne PL, Gualtieri P. In vivo photo-cycle of the Euglena gracilis photoreceptor. Biophys J. 1997;72:545-553
10. Batra PP, Tollin G. Phototaxis in Euglena. I - Isolation of the eyespot granules and identification of the eyespot pigments. Biochim Biophys. Acta. 1964;79:371-378
11. Strother GK, Wolken JJ. Microspetrophotometry of Euglena chloroplast and eyespot. Nature. 1960;188:601-602
12. Benedetti P.A, Bianchini G, Chiti G. Fast scanning microspectroscopy: an electrodynamic moving-condenser method. Appl. Opt. 1976;15:2554-2558
13. Gualtieri P, Passarelli V, Barsanti L. A simple instrument to perform in vivo absorption spectra of pigmented cellular organelles. Micron Microsc. Acta. 1989;20:107-110
14. Evangelista V, Frassanito AM, Passarelli V, Barsanti L, Gualtieri P. Microspectroscopy of the photosynthetic compartment of algae. Photochem. Photobiol. 2006;82:1039-1046
15. Evangelista V, Passarelli V, Barsanti L, Gualtieri P. Fluorescence behavior of Euglena photoreceptor. Photochem. Photobiol. 2003;78:93-97
16. Passarelli V, Barsanti L, Evangelista V, Frassanito AM, Gualtieri P. Euglena gracilis photoreception interpreted by microspectroscopy. Eur. J. Protistol. 2003;39:404-408
17. Barsanti L, Passarelli V, Walne PL, Gualtieri P. The protein of Euglena gracilis Photoreceptor. FEBS Letters. 2000;482:247-251
18. Pancaldi S, Baldisserotto C, Ferroni L, Bonora A, Fasulo AM. Room temperature microspectrofluorometry as a useful tool for studying the assembly of the PSII chlorophyll-protein complex in Euglena gracilis. J of Exp. Botany. 2002;53:1753-1763
Author contact
![]() Correspondence to: Gualtieri Paolo, Tel.: +39 050 3153026; fax: +39 050 3152760 E-mail: paolo.gualtieriibf.cnr.it
Correspondence to: Gualtieri Paolo, Tel.: +39 050 3153026; fax: +39 050 3152760 E-mail: paolo.gualtieriibf.cnr.it