Impact Factor ISSN: 1449-2288
- Issue 12; 2026
- Issue 11; 2026
- Issue 10; 2026
- Issue 9; 2026
- Issue 8; 2026
- Volume 22; 2026
- Past Issues
- Advance Articles
- Editorial Board
- Cover Images
- Index & Coverage
- Cover Suggestion
- Special Issues
1. Introduction
2. Material and Methods
3. Results and Discussion
4. Conclusions
Acknowledgements
References

 Global reach, higher impact
Int J Biol Sci 2007; 3(5):274-280. doi:10.7150/ijbs.3.274 This issue Cite
Research Paper
Development of a highly sensitive and selective microplate chemiluminescence enzyme immunoassay for the determination of free thyroxine in human serum
Xu Wang1, Hui Chen1, Jin-Ming Lin1, Xitang Ying2 ![]()
1. The Key Laboratory of Bioorganic Phosphorus Chemistry & Chemical Biology, Department of Chemistry, Tsinghua University, Beijing, 100084, China
2. Beijing Chemclin Biotech Co., Ltd., Beijing Academy of Science and Technology, Haidian, Beijing, 100094, China
Received 2007-3-29; Accepted 2007-4-17; Published 2007-4-20
Abstract
A microplate chemiluminescence enzyme immunoassay (CLEIA) with high sensitivity, selectivity and reproducibility was developed for the determination of free thyroxine (FT4) in human serum. A competitive assay has been utilized with horseradish peroxidase (HRP) labeled thyroxine analog in the chemiluminescence (CL) detection. The CL signal produced by the emission of photons from luminol was directly proportional to the amount of analyte. The linear range was 0.45-7.5 ng dL-1 and the detection limit was 0.09 ng dL-1. Experimental conditions, such as temperature, pH, incubation time, titration level and other relevant variables upon the CL signal have been examined and optimized. A coefficient of variance of less than 16% was obtained for intra- and inter-assay precision. The present method has been successfully applied to the analysis of FT4 in human serum. The positive and negative coincidence ratios are satisfactory. Good correlations were obtained between the results by the proposed method and radioimmunoassay (RIA), as well as a Bayer ACS-180SE detection system.
Keywords: Free thyroxine (FT4), horseradish peroxidase (HRP), chemiluminescence enzyme immunoassay (CLEIA)
1. Introduction
Thyroxine (3,5,3',5'-tetraiodothyronine, T4) is an important hormone secreted by the thyroid gland. It has a molecular mass of 777 Dalton and is involved in regulating many biological functions, such as oxygen consumption, growth, development and protein synthesis. More than 99.9% of the T4 in blood is bound to carrier proteins, specially to thyroxine-binding globulin (TBG), and the free fraction of T4 (free T4, FT4) just accounts for ∼0.03% [1]. But the FT4 represents the biologically active form of this compound. It is believed that FT4 could cross cell membranes and interacts with receptors [2], showing metabolically active and clinically relevant effect. Therefore, measurement of FT4 is of value in assessing thyroid function.
Various methods have been employed to the determination of FT4 in serum, such as equilibrium dialysis [3-7], ultrafiltration [8], chromatography on polyacrylamide gel [9, 10] or Sephadex [11] , radioimmunoassay (RIA) by use of the radioactive isotope 125I [12-14], enzyme immunoassay [15-17], time-resolved fluorescence [18], bioluminescent immunoassay [19], fluoroimmunoassay [20-23], ,chemiluminescence immunoassay [24, 25], electrochemiluminescence immunoassay [26, 27], and mass spectrometry [28, 29]. These methods have disadvantages. Direct methods are complex and time consuming. RIA uses radioactive labels and is harmful to the operators. ELISA has low sensitivity. Immunoassay with chromatography needs a lengthy procedure of column preparation and expensive instrumentation. Electrochemical method requires preparation of working electrodes and complicated operation.
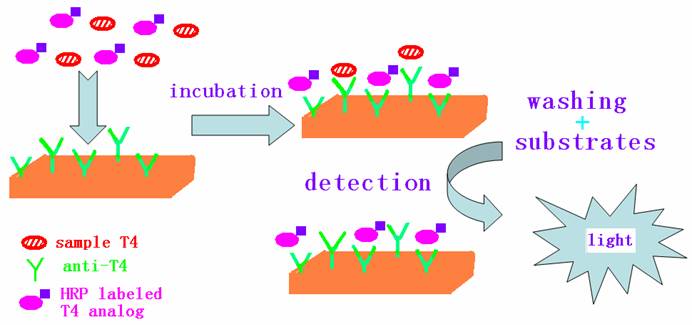
Chemiluminesence enzyme immunoassay (CLEIA) has high sensitivity and specificity. It has been widely used in clinical and biomedical researches due to such advantages as no radioactive waste, relatively simple and inexpensive instrumentation, low detection limit and wide dynamic range. Generally, chemiluminesence detection techniques use horseradish peroxidase (HRP) or alkaline phosphatases (ALP) as label for enzyme immunoassay. These enzymes are labeled to the antibody or antigen molecules. The chemiluminesence substrates undergo a peroxidase-catalyzed oxidation in the presence of a suitable oxidant. After the immunological reaction, the chemiluminesence intensity of the label is detected for the quantitative analysis of antibody or antigen. In this paper, a chemiluminesence enzyme immunoassay for the determination of FT4 is proposed. FT4 presenting in a patient's serum competes with enzyme-T4 analog conjugate for anti-T4 antibodies attached to a solid phase. The amount of enzyme-T4 analog conjugate binding to the solid phase varies inversely with the concentration of FT4 in the serum, constituting the estimation of FT4 concentration in the serum. The competitive reaction principle is shown in Figure 1. It is based on the HRP-T4 analog conjugate and the chemiluminesence reaction between the enzyme substrate of luminol and hydrogen peroxide.
Principle of the chemiluminescence enzyme
2. Material and Methods
Chemicals
T4 standard was obtained from Sigma (St. Louis, USA). Goat anti-T4 polyclonal antibody was purchased from Si Chuan Zheng Long Company (Si Chuan, China). HRP-T4 analog conjugate was obtained from BAHT Co., Ltd. (Beijing Atom High Tech Co., China). Human sera samples were purchased from Beijing 301 Hospital (Beijing, China). The coating buffer is citrate acid (0.06 mol L-1, pH 4.8). The blocking solution was 0.02 mol L-1 phosphate buffer containing 1% (w/v) BSA and 5% glucose, pH 7.4. The washing solution was 0.01 mol L-1 Tris-HCl buffer containing 0.05% Tween-20, pH 7.5. Dilution solution for HRP-labeled T4 analog was Tris-HCl buffer, pH 6.5. The chemiluminescence substrate were luminol in 0.1 mol L-1 Tris-HCl of pH 8.5 and H2O2 in citrate buffer of pH 4.5.
Apparatus
A chemiluminescence microplate reader (BHP9504 from Hamamatsu Co., China) was used. A microplate mixer (WZ-2A, Beijing Haidian Medical Instrument Factory, Beijing, China) was employed to blend the solutions in microwells. The incubation procedures were carried out using constant temperature incubator (PYX-DHS, Shanghai Medical Instrument Factory, Shanghai, China). An automatic plate washer was used to wash the microplates (DEM-III, Tuopu Analysis Instrument Company, Beijing, China).
Immunoassay procedure
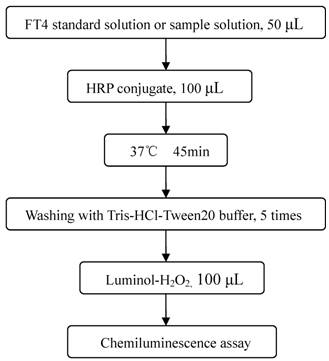
Immunoassay procedures were presented in Figure 2 [30]. The microplates were coated with 100 μL of T4 antibody (2.5 μg mL-1) each well in citrate buffer (pH 4.8). The plates were allowed to stand sealed at 4 ℃ overnight. Then, the plates were decanted (tapped and blotted) and post-coated with 300 μL blocking buffer for 1 h at 37 ℃. The blocking solution was discarded before assay. In each reaction, 50 μL T4 standard solutions or serum samples and 100 μL diluted HRP-T4 analog conjugate were added and incubated for 45 min at 37 ℃. After the competitive reaction, the plates were washed five times and 100 μL chemiluminescence substrate solution was added, and the emitted photons were measured.
Schematic of chemiluminescence enzyme immunoassay procedures
Data analysis
Standards and samples were run in double wells, and mean chemiluminescence intensity values were used. Standard curves were obtained by plotting chemiluminescence intensity against the logarithm of analyte concentration. It was fit to the equation of logitY-logx, in which the value of logitY was calculated according to the following formula:
LogitY = ln

B- CL intensity of FT4 standard or sample
B0- CL intensity of zero standard
3. Results and Discussion
Physicochemical parameter optimization
Effects of temperature and pH
The equilibrium between bound T4 and FT4 is dependent on the temperature. It has been shown that when the temperature increases from 20 ℃ to 37 ℃, the concentration of FT4 is doubled [31]. pH seems to influence the equilibrium between the bound T4 and the FT4 too [32-34]. The immunoassay reaction was performed at 37 ℃ and room temperature, respectively. At 37℃, the detection limit was lower and the R (linear correlation coefficient) was higher than those at room temperature. Thus 37 ℃ incubation time was used. The effects of pH on the assay performance on the assay performance parameters, including R, RLUmax (maximal relative light unit), IC50 (the T4 concentration causing 50% inhibition of RLUmax), RLUmax/IC50 was also studied (Table 1). It showed that IC50 value reached a maximum and the correlation coefficient was better at pH 6.5. Thus pH 6.5 was chosen.
Effect of pH on the immunoassay
| pH | 6.5 | 7.5 | 8.5 |
|---|---|---|---|
| R | 0.9984 | 0.9904 | 0.9898 |
| RLUmax | 40140 | 45759 | 48862 |
| IC50 | 0.66 | 0.54 | 0.52 |
| RLUmax/IC50 | 60818 | 84738 | 93965 |
Effect of Tween-20
Surfactants were commonly used in ELISA to reduce nonspecific interaction. The influence of Tween-20 on assay performance was examined and the results were shown in Table 2. Tweeen-20 could interfere with the active sites of reactant molecules which had an impact on the CL signal [35]. The RLU is so high in the absence of Tween-20 that the sample with low, medium, and high concentration can not be distinguished. In the presence of 0.05% Tween-20, the three samples could be distinguished well. Therefore, 0.05% Tween-20 was selected.
Effect of Tween-20 on immunoassay RLU and sample determination
| performance parameters | without Tween-20 | 0.05 % Tween-20 | |
|---|---|---|---|
| RLU | S0 | 1107747 | 232260 |
| S1 | 705427 | 102804 | |
| S2 | 536491 | 56047 | |
| S3 | 305467 | 17510 | |
| S4 | 240786 | 11549 | |
| sample concentration (ng dL-1) | low | N/A | 2.73 |
| medium | N/A | 3.78 | |
| high | N/A | 6.25 | |
| R | 0.9996 | 0.9995 | |
Effect of Inhibitors
Adding analyte analog to the sample could influence the equilibrium between the free and protein-bound fractions of T4, bringing bad assay reproducibility. Thus inhibitors of sodium salicylate and sodium trichloroacetate were tested. Samples with low, medium, and high concentration were chosen to evaluate the effect of the inhibitors. Compared with sodium trichloroacetate, the correlation coefficient was better and stable, and the low and high sample concentration could be distinguished well in the presence of 0.01% sodium salicylate, thus 0.01% sodium salicylate was selected in the subsequent work. The results were shown in Table 3.
Optimization of inhibitors on the immunoassay
| Inhibitors (g mL-1) | R | FT4 determined (ng dL-1) | |||
|---|---|---|---|---|---|
| U1 | U2 | U3 | |||
| C7H5NaO3 | 1.0×10⁻³ | 0.9956 | N/A | 0.68 | 1.22 |
| 3.0×10⁻⁴ | 0.9989 | N/A | 1.32 | 2.09 | |
| 1.0×10⁻⁴ | 0.9993 | 0.35 | 3.40 | 1.79 | |
| 1.0×10⁻⁵ | 0.9992 | 0.60 | 3.74 | 1.62 | |
| 1.0×10⁻⁶ | 0.9942 | 0.67 | 1.62 | 1.69 | |
| CCl3COONa | 1.0×10⁻² | 0.9596 | 0.62 | 0.55 | 2.27 |
| 5.0×10⁻³ | 0.9905 | 0.44 | 0.95 | 2.50 | |
| 2.50×10⁻³ | 0.9762 | 0.91 | 1.80 | 3.22 | |
| 5.0×10⁻⁴ | 0.9605 | 1.10 | 2.40 | 5.15 | |
| 2.0×10⁻⁴ | 0.9641 | 1.13 | 3.16 | 5.00 | |
| 1.0×10⁻⁴ | 0.9732 | 0.99 | 3.35 | 5.60 | |
| 4.0×10⁻⁵ | 0.9927 | 0.86 | 2.50 | 1.23 | |
| 4.0×10⁻⁶ | 0.9972 | 0.95 | 2.43 | 1.31 | |
| 4.0×10⁻⁷ | 0.9991 | 0.96 | 2.75 | 1.49 | |
Titration level of HRP labeled T4 analog
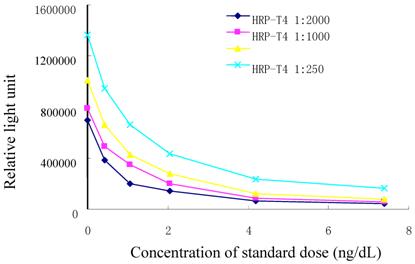
Titer levels of labeled T4 analog were determined. Upon every dilution we monitored the RLU of T4 standard. When the titration was higher than 1:500, the sensitivity was not satisfied. While the titration was lower than 1:2000, the signal was decreased rapidly. The results were shown in Fig. 3. Therefore, titration level of 1:500 was set.
Titration curves of HRP-T4 analog conjugate
Effect of incubation time
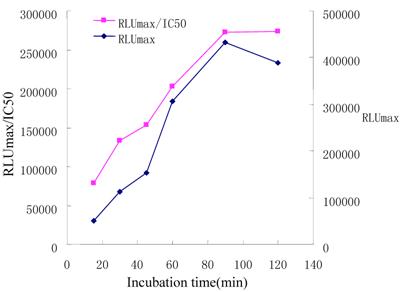
In a competitive ELISA, the interact time between immunoreagents may have a direct effect on the sensitivity of the immunoassay [36]. We varied the incubation time from 15, 30, 45, 60, 90 to 120 min, and assessed the variations of RLUmax and RLUmax/IC50. Results were shown in Figure 4. The RLUmax increased with longer incubation time in the range of 15~120min. After 90min, the RLUmax did not change evidently. This means the immunoassay reached an equilibrium. RLUmax/IC50 ratio reached a maximal value at incubation time of 90 min. In order to achieve an appropriate sensitivity suitable for clinical application, an incubation time of 45min was set.
Influence of the length of the competitive step on immunoassay
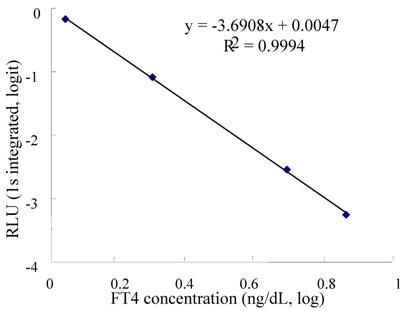
Calibration and sensitivity
Under the optimal conditions, the standard curve obtained with the chemiluminescence detection of enzyme activity was presented in Fig. 5. The linear rang was 0.45-7.5 ng dL-1. The sensitivity, defined as the minimal does that can be distinguished from zero, the minimum detected concentration (mean-2S.D. of zero standard, 10 replicates) of FT4 was 0.09 ng dL-1.
Calibration graph of microplate chemiluminescence enzyme immunoassay for FT4
Precision
The intra- and inter-assay precisions, calculated by measuring FT4 concentration in three different samples, were performed. Good precisions were obtained. The intra- and inter-assay coefficients of variation (CV) varied from 5.3 to 15.6%.
Specificity
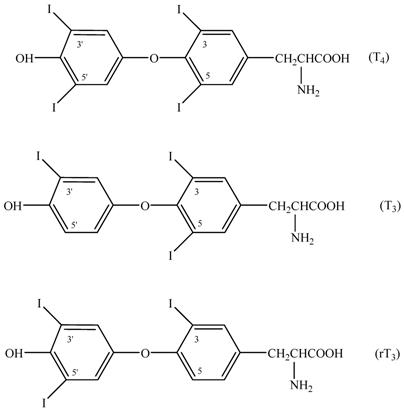
Effect of disrupting compounds
The specificity of the immunoassay was dependent on the antibody's specificity [37]. The cross-reactivity of the anti-T4 antibody was evaluated using several T4 disrupting compounds. 3,5,3'-triiodothyronine (T3) and 3,3',5'-triiodothyronine (reverse T3, rT3) were the structurally related compounds of T4 (Figure 7) and were tested in this work. The cross-reactivity was calculated by deriving a ratio between does of interfering substance to does of thyroxine needed to displace the same amount of the conjugate. The results were shown in Table 4. The antibody exhibited cross-reactivity all less than 0.01%. Therefore, effects of T3 and rT3 in serum on FT4 determination could be neglected.
Cross-reactivity for FT4 in the present assay
| cross-reactive substance | cross-reactive substance added (ng mL-1) | FT4 determined (ng dL-1) | Cross-reactivity (%) |
|---|---|---|---|
| rT3 | 0.8 | 0.01 | 0.001 |
| FT3 | 25 | 0.26 | 0.010 |
Interferences
Amount of the interfering substances were added to a serum matrix. The effects of some potential interferences on the determination were shown in Table 5. Sodium citrate and heparin enhanced the CL signal and others inhibited the reaction. The method was simple and sensitive, but these substances need to be removed before it could be used for FT4 determination in blood samples.
Effects of interfering substances on FT4 determination
| Interfering substances | Matrix | Triglyceride (mmoL L-1) | Sodium citrate (g L-1) | Heparin (mg L-1) | Hemoglobin (μmoL L-1) | Sodium oxalate (g L-1) | EDTANa2 (g L-1) | Bilirubin (μmoL L-1) |
|---|---|---|---|---|---|---|---|---|
| Conc. of Interfering Substance | 0 | 1.0 | 5.0 | 40 | 0.16 | 1.25 | 1.25 | 0.332 |
| Total determined ( ng dL-1 ) | 0.90 | 0.25 | 1.77 | 0.94 | 0.65 | 0.80 | 0.75 | 0.77 |
| Interfering substance determined ( ng dL-1 ) | 0 | -0.65 | 0.87 | 0.04 | -0.25 | -0.10 | -0.15 | -0.13 |
Analysis of serum samples
Expected ranges of values
A study of 70 normal human sera were undertaken to determine expected values. The results were presented in Table 6. It can be seen that the correlation coefficient was 0.9988, Ū presenting mean sample values was 1.043 ng dL-1, and standard deviation (SD) was 0.370. The expected values (Ū+2SD) ranged from 0.303 ng dL-1 to 1.783 ng dL-1.
Determination of FT4 in normal serum (ng dL-1)
| U1 | 0.75 | U11 | 1.45 | U21 | 0.74 | U31 | 0.76 | U41 | 1.34 | U51 | 1.05 | U61 | 0.81 |
|---|---|---|---|---|---|---|---|---|---|---|---|---|---|
| U2 | 0.98 | U12 | 2.06 | U22 | 1.12 | U32 | 0.80 | U42 | 0.60 | U52 | 1.01 | U62 | 0.66 |
| U3 | 0.92 | U13 | 1.79 | U23 | 1.77 | U33 | 0.71 | U43 | 1.57 | U53 | 0.70 | U63 | 1.00 |
| U4 | 1.60 | U14 | 1.01 | U24 | 0.81 | U34 | 1.34 | U44 | 1.97 | U54 | 0.66 | U64 | 0.84 |
| U5 | 0.99 | U15 | 0.87 | U25 | 0.83 | U35 | 0.74 | U45 | 1.24 | U55 | 0.76 | U65 | 0.79 |
| U6 | 1.25 | U16 | 1.79 | U26 | 1.34 | U36 | 1.07 | U46 | 0.80 | U56 | 1.47 | U66 | 0.88 |
| U7 | 0.71 | U17 | 1.17 | U27 | 0.76 | U37 | 1.01 | U47 | 1.29 | U57 | 0.83 | U67 | 0.86 |
| U8 | 0.86 | U18 | 0.84 | U28 | 0.85 | U38 | 0.73 | U48 | 0.80 | U58 | 0.71 | U68 | 0.93 |
| U9 | 0.81 | U19 | 1.17 | U29 | 1.02 | U39 | 0.74 | U49 | 0.85 | U59 | 0.63 | U69 | 0.81 |
Clinical sample examination
Serum samples of normal people and hypothyroid or hyperthyroid patients collected from 301 Hospital were examined. The results were shown in Table 7. The positive and negative samples could be distinguished well and the coincidence ratios were 98% and 97.5% for positive and negative samples, respectively.
Clinical sample examination results
| Hyperthyroid serum (n=47) | Normal serum (n=80) | Hypothyroid serum (n=51) | Positive coincidence ratio (%) | Negative coincidence ratio (%) | |||
|---|---|---|---|---|---|---|---|
| Positive | Negative | Positive | Negative | Positive | Negative | 98.0 | 97.5 |
| 47 | 0 | 2 | 78 | 49 | 2 | ||
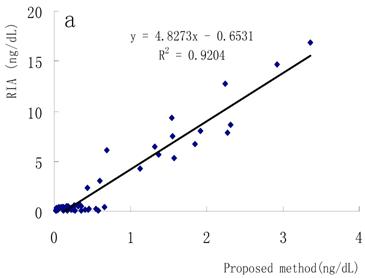
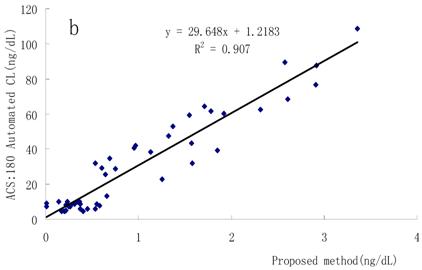
Correlation with other methods
FT4 concentrations in the sera were simultaneously determined using the present method, a conventional RIA method and a Bayer ACS-180SE detection system. Good relationships were obtained as shown in Fig. 6a and Fig. 6b, which means this method has great potential in the clinical diagnosis.
Correlation between the proposed method and other methods. (a) Proposed method and RIA method, (b) proposed method and Bayer ACS-180SE detection system
Structures of T4, T3 and rT3
4. Conclusions
A highly sensitive and selective microplate CLEIA demonstrated for the determination of FT4 in serum samples has been developed and optimized. The proposed method comprises anti-T4 antibody coated microplate, HRP-labeled T4 analog and a CL detection system. With the assay, FT4 can be reproducibly detected in human serum at a concentration as low as 0.09 ng dL-1. A stable calibration curve was also established with the linear correlation coefficient of 0.9997. Data from the developed method highlights the acceptable intra-assay (less than 11%) and inter-assay (less than 16%) precision. In summary, this assay provides apparent advantages and shows great potential in the clinical diagnosis.
Acknowledgements
The authors gratefully acknowledge financial support of the National Natural Science Foundation of China (20437020, 20575008) and the Program for Changjiang Scholars and Innovative Research Team in University (IRT0404).
Conflict of interest
The authors have declared that no conflict of interest exists.
References
1. Ekins R. Analytic measurements of free thyroxine. Clin Lab Med. 1993;13:599-630
2. Bouknight AL. Thyroid physiology and thyroid function testing. Otolaryngol Clin North Am. 2003;36:9-15
3. Victor SF, Herbert AS. Determination of free thyroxine in serum by low-temperature equilibrium dialysis. Clin Chem. 1970;16:185-190
4. Jerald CN, Wilcox RB, Pandian MR. Dependence of free thyroxine estimates obtained with equilibrium tracer dialysis on the concentration of thyroxine-binding globulin. Clin Chem. 1992;38:1294-1300
5. Helenius T, Liewendahi K. Improved dialysis method for free thyroxin in serum compared with five commercial radioimmuno assays in NOnthyroidal Illness and subjects with abnormal concentrations of thyroxin-binding globulin. Clin Chem. 1983;29:816-822
6. Re´my Sapin, Miche`le d'Herbomez. Free thyroxine measured by equilibrium dialysis and nine immunoassays in sera with various serum thyroxine-binding capacities. Clin Chem. 2003;49:1531-1535
7. Okabayashi T, Takeda K, Kawada M, Kubo Y, Nakamura S, Chikamori K, Terao N, Hashimoto K. Free thyroxine concentrations in serum measured by equilibrium dialysis in chronic renal failure. Clin Chem. 1996;42:1616-1620
8. Sophianopoulos J, Jerkunica I, Lee CN, Sgoutas D. An improved ultrafiltration method for free thyroxine and triiodothyronine in serum. Clin Chem. 1980;26:159-162
9. McDonald LJ, Robin NI, Siegel L. Free thyroxine in serum as estimated by polyacrylamide gel filtration. Clin Chem. 1978;24:652-656
10. Lewis M. Relationship between TBG concentration and %FT4 as estimated by dialysis and by polyacrylamide gel filtration. Clin Chem. 1979;25:1181-1183
11. Levinson SS, Rieder SV. Parameters affecting a rapid method in which Sephadex is used to determine the percentage of free Thyroxine in serum. Clin Chem. 1974;20:1568-1572
12. Wilke TJ. Five kits for estimating free thyroxin concentration in serum evaluated, and correlated with other indices to thyroid status. Clin Chem. 1982;28:2051-2056
13. Bayer MF, McDougall IR. Radioimmunoassay of free thyroxinein serum: comparison with clinical finding sand results of conventional thyroid-function tests. Clin Chem. 1980;26:1186-1192
14. Georgiou S, Christofidis I. Radioimmunoassay of free thyroxine (T4) using 125I-labeled T4-IgG complex with very large molecular weight. Clin Chim Acta. 1996;244:209-220
15. Ito M, Miyal K, Mizuta KDH, Amino N. Enzyme immunoassay of free thyroxin in serum. Clin Chem. 1984;30:1682-1685
16. Kuns A, Seldenschwarz E, BUrk H, Schauer S, Haug H, Lehmann P, Ehrhardt Volker. New one-step enzyme immunoassay for free thyroxin. Clin Chem. 1988;34:1830-1833
17. Weetali HH, Herti W, Ward FB, Hersh LS. EnzymeImmunoassay for free thyroxin. Clin Chem. 1982;28:666-671
18. Khosravi MJ, Papanastasiou-Diamandi A. Hapten-heterologous conjugates evaluated for application to free thyroxine immunoassays. Clin Chem. 1993;39:256-262
19. Frank LA, Petunin AI, Vysotski ES. Bioluminescent immunoassay of thyrotropin and thyroxine using obelin as a label. Anal Biochem. 2004;325:240-246
20. Maria P. Oxytocin decreases plasma levels of thyroid-stimulating hormone and thyroid hormones in rats. Regulatory Peptides. 2002;108:83-87
21. Stevenson HP, Archbold GPR, Johnston P, Young IS, Sheridan B. Misleading serum free thyroxine results during low molecular weight heparin treatment. Clin Chem. 1998;44:1002-1007
22. Reichborn-Kjennerud T, Haug E, Lingjzerde O. Thyroid function in seasonal affective disorder. J Affect Disorders. 1995;33:39-45
23. Zurakowski D, Canzio JD, Majzoub JA. Pediatric reference intervals for serum thyroxine, triiodothyronine, thyrotropin, and free thyroxine. Clin Chem. 1999;45:1087-1091
24. Dhatt GS, Jayasundaram R, Wareth LA, Kerke NN, Jayasundaram K, Darwish EA, Lewis A. Thyrotrophin and free thyroxine trimester-specific reference intervals in a mixed ethnic pregnant population in the United Arab Emirates. Clin Chim Acta. 2006;370:147-151
25. Docter R, Toor HV, Krenning EP, Jong MD, Hennemann G. Free thyroxine assessed with three assays in sera of patients with nonthyroidal illness and of subjects with abnormal concentrations of thyroxine-binding proteins. Clin Chem. 1993;39:1668-1674
26. Navarro MA, Palencia T, Bonnín MR, Rosel P. Daily blank cell procedure in elecsys 2010 improves the reproducibility of thyrotropin, free thyroxine, and triiodothyronine. Clin Chem. 1998;44:1772-1773
27. Forest J-C, MEasse J. Evaluation of the analytical performance of the Boehringer Mannheim lecsysT 2010 Immunoanalyzer. Clin Biochem. 1998;31:81-88
28. Soldin SJ, Soukhova N, Janicic N, Jonklaas J, Soldin OP. The measurement of free thyroxine by isotope dilution tandem mass spectrometry. Clin Chim Acta. 2005;358:113-118
29. Stöckl D, Thienpont LMR, Leenheer APD. Towards a reference method for serum free thyroxine based on isotope dilution mass spectrometry. Immunoassay Biol Spec. 2000;15:311-317
30. Zhao LX, Lin J-M. Development of a microplate magnetic chemiluminescence enzyme immunoassay (MMCLEIA) for rapid- and high-throughput analysis of 17-estradiol in water samples. J Biotech. 2005;118:177-186
31. Weeke J, Boye N, Örskov H. Ultrafiltration method for direct radioimmunoassay measurement of free thyroxine and free triiodothyronine in serum. Scand J Clin Lab Invest. 1986;46:381-389
32. Holm SS, Hansen SH, Faber J, Staun-Olsen P. Reference methods for the measurement of free thyroid hormones in blood evaluation of potential reference methods for free thyroxine. Clin Biochem. 2004;37:85-93
33. Veer C van der SV, Vermes I, Bonte HA, Hoorn RKJ. Temperature effects on free-thyroxine measurements: analytical and clinical consequences. Clin Chem. 1992;38:1327-1331
34. Ross HA, Benraad TJ. Is free thyroxine accurately measurable at room temperature? Clin Chem. 1992;38:880-886
35. Botchkareva AE, Eremin SA, Montoya A, Manclus JJ, Mickova B, Rauch P, Fini F, Girotti S. Development of chemiluminescent ELISAs to DDT and its metabolites in food and environmental samples. J Immunol Meth. 2003;283:45-47
36. Zhao LX, Lin J-M, Li ZJ. Comparison and development of two different solid phase chemiluminescence ELISA for the determination of albumin in urine. Anal Chim Acta. 2005;541:199-207
37. Zhao LX, Lin J-M, Li ZJ, Ying XT. Development of a highly sensitive, second antibody format chemiluminescence enzyme immunoassay for the determination of 17β-estradiol in wasterwater. Anal Chim Acta. 2006;558:290-295
Author contact
![]() Correspondence to: Prof. Dr. Jin-Ming Lin, Department of Chemistry, Tsinghua University, Beijing, 100084, China. Tel/Fax: +86-10-62792343. E-mail address: jmlintsinghua.edu.cn.
Correspondence to: Prof. Dr. Jin-Ming Lin, Department of Chemistry, Tsinghua University, Beijing, 100084, China. Tel/Fax: +86-10-62792343. E-mail address: jmlintsinghua.edu.cn.