Impact Factor ISSN: 1449-2288

 Global reach, higher impact
Int J Biol Sci 2008; 4(6):422-432. doi:10.7150/ijbs.4.422 This issue Cite
Research Paper
Post-Weaning Protein Malnutrition in the Rat Produces Short and Long Term Metabolic Impairment, in Contrast to Earlier and Later Periods
María del Carmen Miñana-Solis, Carolina Escobar ![]()
Departamento de Anatomía, Facultad de Medicina, Universidad Nacional Autónoma de México
México, D. F. 04510
Received 2008-9-26; Accepted 2008-11-14; Published 2008-11-19
Abstract
Malnutrition during gestation and lactation modifies metabolic strategies and leads to metabolic disease in adult life. Studies in human populations suggest that malnutrition during infancy may also induce long term metabolic disorders.
The present study investigated if post-weaning and a late period of development might be sensitive for long term metabolic impairment. Hereto male Wistar rats were malnourished with a low protein diet (6%), during gestation and lactation (MGL), from weaning to 55 days (MPW) or during adulthood from 90 to 120 days (MA). Control rats (C) were fed with a regular diet (23% protein). We determine plasma concentrations of insulin, glucagon, triacylglycerols (TAG), free fatty acids (FFA), and liver glycogen after a Glucose Tolerance Test (GTT).
Independent of the age of onset, malnutrition induced low body weight. Early and post-weaning malnutrition produced impaired glucose tolerance and low values of TAG, also in MPW induced low values of insulin and glucagon. At 90 days, after balanced diet rehabilitation, the MGL group showed a similar glucose tolerance test as the controls but display low values of insulin, while the MPW group exhibited high levels of glucose and TAG, and low values of insulin, glucagon, FFA and hepatic glycogen. At 180 days, after balanced rehabilitation only MPW rats showed metabolic alterations. Malnutrition during adult life (MA) did not produce metabolic disturbances. Surprisingly the results uncover the post-weaning stage as a vulnerable period to malnutrition that induces long lasting metabolic alterations and deficiency in pancreatic function.
Keywords: development, critical period, nutritional rehabilitation, insulin, metabolic disease, pancreas.
INTRODUCTION
Obesity, diabetes mellitus type II and metabolic syndrome, are important modern life style health problems related to early malnutrition as a possible predisposing factor [1-3]. Several studies have reported that during gestation and lactation considered as a critical periods of development [4], malnutrition induces anatomical and physiological adaptations in order to allow survival in poor nutritional conditions [5-7].
Early low protein malnutrition produces a decrease of vascularization in the pancreas [8], reduced number of islets and β cells, and decrease of insulin production [9]. In the liver low protein in the diet induces a decrease in the production of glucokinase and increase in phosphoenolpyruvate carboxykinase, two enzymes involved in the glycolytic and gluconeogenic functions, respectively, resulting in a higher level of continuous endogenous glucose production by the liver [10]. Malnutrition during gestation and lactation modify the insulin sensitivity in muscle leading to impaired glucose uptake [11], while in adipose tissue early malnutrition increased number of glucose transporters and insulin receptors which promote high glucose storage [12, 13] . Also, insulin, leptin, glucagon, and metabolites like free fatty acids are modified by malnutrition [14, 15].
Such adaptations are thought to enable the organism to survive under detrimental nutritional conditions. This process is known as the “foetal programming hypothesis” [16].
Experimental and epidemiological studies have focused on the effects of early malnutrition, however recently, some studies in human populations' postulate infancy as a vulnerable period in which malnutrition can permanently modify the metabolism and result in metabolic diseases later in life [17, 18].
The possibility of nutritional rehabilitation of foetal programming has been explored in studies performing a cross-fostered paradigm and leptin injection during lactation [19], as well as using either a balanced or hypercaloric diet [10].
Consequently, for determining with more accuracy the vulnerable period of development in the present study we investigated in rats the effects of low protein malnutrition at three different stages of life: gestation and lactation (critical period), for 30 days after weaning (day 25- 55) or in adulthood at 90 to 120 days also the effects of nutritional rehabilitation were tested on a short and a long term basis (90 and 180 days).
The effects of malnutrition and rehabilitation on metabolism were determined after a glucose tolerance test (GTT) on serum metabolites and hormones. Present data show deleterious acute effects by low protein malnutrition during gestation and lactation and after weaning, but not in adult life. The effects of early malnutrition were partially reversed by the period of nutritional rehabilitation, while surprisingly nutritional rehabilitation did not reverse deleterious effects of post-weaning malnutrition indicating a vulnerable stage of development in which metabolism is permanently affected and may lead to metabolic disease in adult life.
MATERIALS AND METHODS
ANIMALS AND GENERAL CONDITIONS
All animal procedures were approved by the Biosecurity and Bioethics Committee, Faculty of Medicine, UNAM, according to the Mexican Laws for Animal Care [20], which comply with the Guide for the Care and Use of Laboratory Animals (NIH publication 80-23, revised 1996). Control and malnourished offspring were born to female Wistar rats (Rattus norvegicus) obtained from the general bioterium of the Faculty of Medicine of Universidad Nacional Autónoma de México.
Breading females as well as the offspring after weaning were housed in groups of 3-4 animals in transparent acrylic cages (40 X 50 X 20 cm) and were maintained in a light-dark cycle 14:10 h (lights on 6:00h), with controlled temperature of 22-24ºC, 40-50% humidity, food and water ad libitum.
NUTRITIONAL CONDITIONS
Rats were born to 3 month-old primiparous females exposed to an isocaloric (4 kcal/ g) low protein diet (6% of protein Harlan TD 92090) or to a balanced regular chow diet (23% protein Purina chow 5001). The balanced and low protein diets have been employed by previous studies and produce reproducible nutritional states [21-23].
For mating, females were exposed for one week to males (2 females and 1 male). Pregnancy was confirmed by abdominal palpation and weight increase. Date of parturition was estimated 22 days after the introduction of the males into the females' cage. Three days before expected parturition, females were placed in individual cages (30 X 40 X 20 cm) with sufficient wood shavings for nesting and were maintained in individual conditions until weaning (for details see Miñana and Escobar [22].
On post-natal (P) day 1, litters were standardized to 8 pups (4 females and 4 males). On day P25 litters were weaned and only males were used for all experiments according to the indicated ages and nutritional protocols.
GROUPS
Nutritional controls (C) were born from females fed the balanced diet and continued to be fed the same regular diet along their life.
Rats for the gestation and lactation malnutrition (MGL) group were born from female rats exposed to the low-protein diet for two weeks prior to mating, during gestation and lactation.
Rats for post-weaning malnutrition (MPW) group were born to females fed the balanced diet during gestation and lactation; at weaning (P25) offspring were switched to the 6% low-protein diet for 30 days until day 55 of age.
Rats for adult malnutrition (MA) group were switched to the low-protein diet at 90 days of age for 30 days.
In order to determine acute effects of malnutrition a first set of rats (n = 7) for each group was tested and sacrificed immediately at the end of the low protein interval: For the MGL this represented P25; for MPW at P55 and for MA at P120. A second set of rats (n = 7) for each malnourished group was rehabilitated by providing a balanced diet until 90 or 180 days of age in order to determine short and long term effects of nutritional recovery.
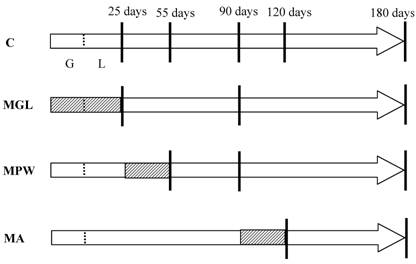
The groups and nutritional conditions are represented in figure 1.
Schematic representation of the experimental groups. Arrows represent the life span of rats with G = gestation and L = lactation. Day of birth is indicated by the short dotted line. Striped areas represent the intervals in which rats of different groups were exposed to the 6% protein diet, while white areas represent exposure to the 23% protein balanced diet. Vertical lines represent selected ages for GTT and blood sampling.
METABOLIC DETERMINATIONS
To unmask acute effects of malnutrition, as well as short and long term effects of nutritional rehabilitation rats were tested with an oral glucose tolerance test (GTT) as described previously [24, 25]. Briefly, rats were weighed and were fasted for 16 h (food was removed the previous day at 18:00 h), between 09:30 and 10:00 h rats were anaesthetized with an intraperitoneal injection of chloral hydrate (1g/ 25mL: 1mL/ 100g) to avoid pain and stress during the GTT. This anaesthetic was chosen over others due to its minimal effects on glucose metabolism [26]. For a base line, before glucose administration, a small drop of blood was obtained from a small incision in the tail and glucose was measured with a glucometer (Ascencia ELITE of Bayer). Then, an orogastric catheter was introduced to the stomach and glucose was delivered in a concentration of 200g/ L dose 2g/ kg [25]. Following samples of blood were obtained from the same incision in the tail at 15, 30, 60 and 120 min after glucose administration.
At the end of the GTT and still under anaesthesia the thoracic cavity was opened and a blood sample of 3mL was obtained from the cava vein for quantification of insulin, glucagon triacylglycerols (TAG) and free fatty acids (FFA). Also the main liver lobule was frozen at -45ºC for subsequent determination of hepatic glycogen.
Blood was collected in 5mL test tubes containing a clot-forming gel (Vacutainer, Becton Dickinson) and centrifuged at 2500 rpm for 15 minutes to obtain plasma. Aliquots of 200μL were coded and frozen at -45ºC for subsequent determinations. Serum insulin and glucagon were determined in duplicate with a standard 125I radioimmunoassay kit (Diagnostic Products Corporation; TKIN1 and KGND1). For insulin assays were performed with a sensitivity of 1.2 μIU/ mL, with intra- and interassay coefficients of variation of 5.1% and 7.1% respectively. For glucagon the sensitivity was 13 pg/ mL, with intra- and interassay coefficients of variation of 3.2 and 8% respectively. TAG were determined with a standard enzymatic kit (Bayer SERA-PACK ® Plus No B-014551-0). FFA were determined with an enzymatic method according to Nóvak [27], and hepatic glycogen was assayed using 1g of tissue, according to the extracting method of Hassid and Abraham [28]. The extracted glucose was determined using a standard enzymatic kit (Hycel de México No 70408).
STATISTICAL ANALYSIS
Data are reported as the mean ± standard error of the mean (SEM). Body weight along time for the three groups was analyzed with a two way ANOVA for repeated measures for the factors group and time.
Blood glucose values during the GTT are represented as absolute increase (mg/ dL) as compared to the basal value considered starting point = 0. Data were compared among groups with a two way ANOVA for the factors groups and time. ANOVA tests were followed by a post hoc Tukey multicomparison test with α set at p < 0.05. Student “t” test for independent samples were used for compared the metabolites and hormones between C and malnourished or rehabilitated groups. The statistical analysis was performed using the program Statistica (version 4.5, 1993) and graphics were elaborated using Sigma Plot 2001.
RESULTS
BODY WEIGHT
At the end of the low protein period all rats of the three groups had significantly lower body weight (p ≤ 0.04) than their age paired controls (fig. 2).
Body weight of A) rats malnourished during gestation and lactation and rehabilitated from weaning to 180 days (MGL group; n = 7) B) rats malnourished from weaning to 55 days and rehabilitated until 180 days (MPW group; n = 7) and C) rats malnourished from 90 to 120 days and rehabilitated (MA group; n = 7). Control rats are represented with the black continuous line, while malnourished groups are represented with dotted line. The striped box represents the malnutrition interval. Values are given as means ± SEM. * show statistical difference (p ≤ 0.05), only males were used for the experiment.
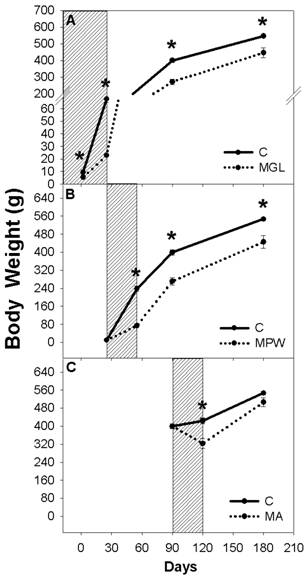
On day P2 the MGL group weighed 59% and at weaning (P25) 34% of the controls' body weight (fig. 2A). Likewise in the MPW group after the 30 day period of malnutrition (25-55 days) the growth rate had slowed down resulting that MPW rats weighed 31% of the controls (fig. 2B). Adult low protein malnutrition from 90-120 days resulted in a loss of body weight leading MA rats to weight 76% of the controls (fig. 2C).
In spite of short or long term balanced diet rehabilitation, the MGL and MPW malnourished groups were not able to catch up to reach the C group body weight (fig. 2 A and B) thus at 90 and 180 days the MGL group reached 67% and 81% of their controls' body weight, respectively (p ≤ 0.02; fig. 2A) while the MPW group reached 68% and 82% at 90 and 180 days, respectively (p ≤ 0.02; fig. 2B). In contrast, the MA group recovered to 93% of the C group body weight (fig. 2C).
GLUCOSE TOLERANCE TEST
Before glucose administration MGL and MA groups displayed similar blood glucose concentrations as their C groups, while the MPW group exhibited lower concentration as their controls (p = 0.04; table 1).
Blood glucose levels obtained before and after an oral glucose tolerance test in mg/ dL.
| Groups | Acute effect | Short term | Long term | |||
|---|---|---|---|---|---|---|
| basal | final | basal | final | basal | final | |
| C | 82.5 ± 7.9 | 134 ± 10.2 | 80.1 ± 5.7 | 120.7 ± 4.6 | 100.7 ± 3.7 | 134.1 ± 10.7 |
| MGL | 63.8 ± 8.9 | 182.2 ± 20.9 * | 80.4 ± 5.8 | 110.5 ± 6.9 | 98.2 ± 9.7 | 119 ± 10.6 |
| C | 106.7 ± 5.2 | 116.1 ± 12.2 | 80.1 ± 5.7 | 120.7 ± 4.6 | 100.7 ± 3.7 | 134.1 ± 10.7 |
| MPW | 55 ± 5.1 * | 137.2 ± 21.8 | 84 ± 7.0 | 168.4 ± 10.9 * | 93 ± 7.9 | 158 ± 16.8 |
| C | 92.4 ± 2.4 | 167.1 ± 7.6 | 100.7 ± 3.7 | 134.1 ± 10.7 | ||
| MA | 93.8 ± 11.6 | 197.7 ± 21.9 | 95.4 ± 8.5 | 173 ± 29.2 | ||
Values are represented ± SEM; (n = 7); * denoted differences between C and MGL or MPW groups (p ≤ 0.01).
After oral glucose administration Control groups showed a peak of blood glucose values between 30 to 60 minutes and thereafter values decreased to near basal levels towards the end of the GTT. In contrast 2h after glucose administration, MGL and MPW rats still exhibited high levels of glucose at the end of the GTT but only MGL rats displayed significantly high levels (p = 0.01; table 1; figure 3 A and D). The two way ANOVA indicated statistical difference between C and MGL (F (4, 60) = 2.59; p = 0.04) and between C and MPW (F (4, 60) = 3.71; p = 0.009).
The absolute glucose increase (mean ± SEM) during Glucose Tolerance Test. Left column represents groups after an acute stage of malnutrition; A) MGL at 25 days; D) MPW at 55 days and G) MA at 120 days. The middle column represents the GTT values after short term rehabilitation: B) MGL and E) MPW rats evaluated at 90 days and H) MA rats evaluated at 180 days. The right column represents the glucose values after long term rehabilitation C) MGL and F) MPW at 180 days of age. * indicates statistical difference (p ≤ 0.003); n = 7 for all groups.
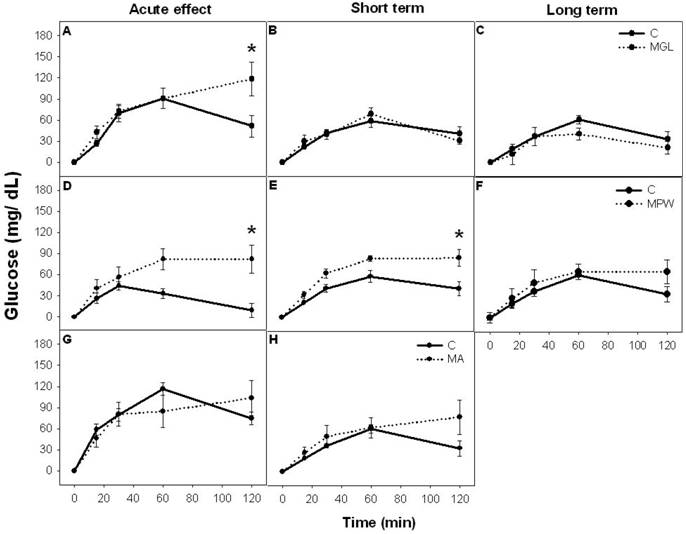
The MA group displayed after malnutrition and after balanced diet rehabilitation the same GTT as their controls (table 1 and fig. 3G, H).
In the MGL group, balanced diet rehabilitation reversed the response in the GTT to control levels in a short and in a long term (table 1 and fig. 3B and C); however in the MPW group at 90 the response to a glucose bolus was still deficient and different from the controls (p = 0.01; table 1 and figure 3E). ANOVA indicated statistical difference (F (4, 60) = 3.09; p = 0.02). After a long term rehabilitation (180 days) the MPW rats exhibited a similar response as their controls (figure 3F).
PLASMA DETERMINATIONS
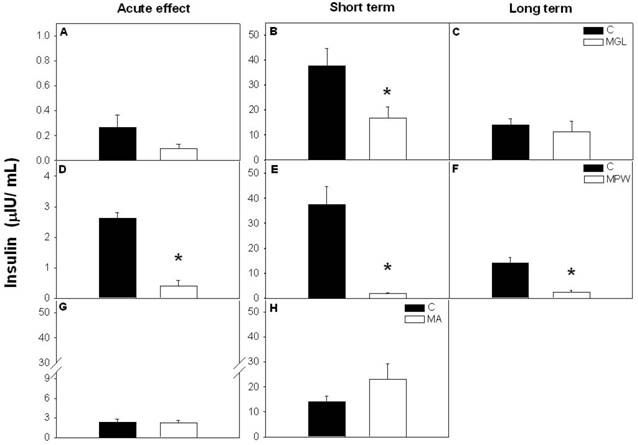
After the GTT insulin levels were not affected in the MGL and MA groups with respect to the controls (fig. 4 A and G respectively), while the MPW rats exhibited low insulin values compared with their controls (p = 0.001; fig. 4D). After short term rehabilitation (at 90 days) both MGL and MPW groups exhibited low insulin levels as compared with their controls (p ≤ 0.001; fig. 4B and E) and such effects persisted in the MPW group in a long term (p = 0.001; fig. 4F). MGL and MA groups did not show a difference at 180 days (fig. 4C and H).
Plasma insulin concentration after GTT. Values are presented as mean ± SEM; n = 5-7. Left panel of graphics represent the values at the end of malnutrition stage for A) MGL, D) MPW and G) MA groups. Central panels showed the hormone concentration after short term rehabilitation; B) MGL, E) MPW and H) MA groups; the right graphics represents the insulin values after long term balance rehabilitation for C) MGL and F) MPW groups. Statistical difference between the control (black bars) and the malnourished groups (white bars) is indicated * p ≤ 0.05.
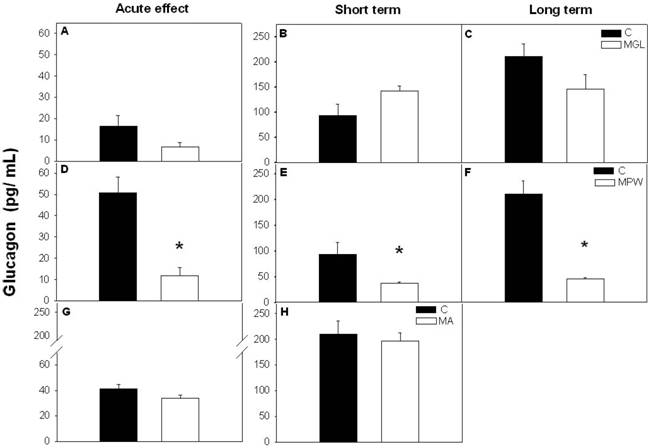
Like wise plasma glucagon levels were not affected by early malnutrition (MGL) or by late malnutrition (MA) in the acute test or after balance rehabilitation (fig. 5 A, B, C and G, H). However, in the MPW group glucagon was significantly decreased at 55 days and was not restored after nutritional rehabilitation at 90 and 180 days (fig. 5 D, E, F). Student “t” test indicated statistical difference between the C and the MPW group (p = 0.001 for acute effects; p = 0.03 for short and p = 0.001 for long term rehabilitation).
Mean ± SEM of plasma glucagon concentration after GTT. Asterisk indicates statistical difference between C and MPW groups (p ≤ 0.03; n = 5-7). For other indications see Fig. 3 and 4.
At the end of the GTT the MGL and MPW groups exhibited low plasma concentration of TAG as compared with their controls (MGL, p = 0.002 and MPW, p = 0.001; fig. 6 A and D respectively), while malnutrition in adult life did not alter plasma TAG (fig. 6G).
Plasma concentration of triacylglycerols (TAG) after GTT. Values are presented as mean ± SEM, n = 7. Statistical difference between the control (black bars) and the malnourished groups (white bars) is indicated * p ≤ 0.05. For details see fig. 3 and 4.
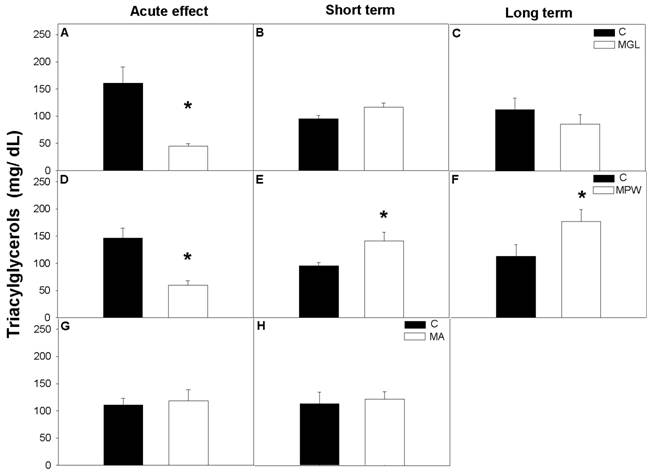
After the balanced diet rehabilitation TAG levels in the MGL and MA groups were similar to control values (see figures 6 B, C and H) while the MPW group showed short and long term TAG alteration with significantly increased values as compared to the controls (p = 0.02 and p = 0.05, respectively; figures 6 E, F).
No significant effects were observed in FFA after the three different stages of malnutrition (fig. 7A, D and G), likewise after the interval of nutritional rehabilitation MGL and MA groups maintained similar values as their controls (fig. 7 B, C, and G, H respectively).
Plasma concentration of free fatty acids (FFA) in control and malnourished rats at the end of GTT are presented as mean ± SEM (n = 7). Indications as in figure 3 and 4. Statistical difference is indicated by * p ≤ 0.03.
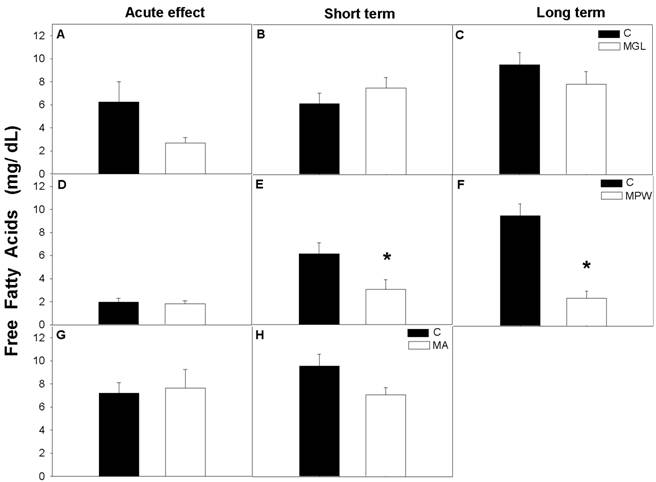
However, low FFA levels were detected in the MPW group after short and long term nutritional rehabilitation (p = 0.03; at 90 days and p = 0.001; at 180 days; figures 7 E and F).
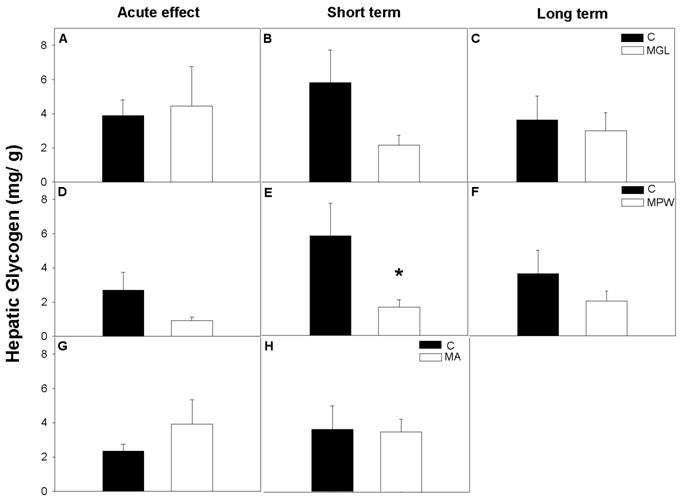
The nutritional status of the rats had no effect on the hepatic glycogen levels in MGL and MA groups either under acute effects of malnutrition nor after nutritional rehabilitation periods, (fig. 8 A, B, C and G, H). In the MPW group hepatic glycogen was similar to the C group immediately after the malnutrition period and at 180 days (fig 8D and F), while at 90 days MPW rats displayed lower glycogen concentration than the C group (p = 0.05; fig. 8E).
Hepatic glycogen concentration per gram of tissue (mean ± SEM; n = 7) after GTT. Indications as in Fig. 3 and 4. * denoted statistical significance p = 0.05.
DISCUSSION
In the present study malnutrition during three different periods in life was compared. The results show that malnutrition early in life, mainly during the post-weaning period produces deleterious effects on the glucose tolerance test and related metabolic parameters. For the first time malnutrition during the post-weaning period is shown to be the most vulnerable period for the development of later life metabolic disturbances. These results may explain why up till now substantial controversy exists about the recovery of early malnutrition; it might be the result of slight differences in the length of the post-natal treatment period.
The present results show that malnutrition during gestation and lactation interfered with the general growth of the pups resulting in a lower body weight than their controls. These findings agree with those reported by other authors [23, 29] who have shown a similar proportion of slow growth rate and low body weight in malnourished rats compared with a well nourished control group. Interestingly malnutrition after weaning exerted a similar effect as early malnutrition leading to similar deficit of body weight. Many studies have focused on analyzing the effects of malnutrition during gestation and lactation [15, 30, 31] but have not explored the effects of protein malnutrition in later periods of accelerated growth, like the immediately post-weaning period. During this interval from weaning to 55 days, rats still undergo a fast growth spurt and our results show that during this period the young rats are most vulnerable to the effects of malnutrition. This agrees with other studies who have indicated the relevance of this interval for bone and reproductive development [32-33].
With the balanced diet rehabilitation both MGL and MPW groups were able to grow at a faster rate, however could not reach similar values as the C rats. These data are also in agreement with results from other groups indicating that early malnourished animals do not completely catch up in spite of nutritional rehabilitation [34, 35]. Adult rats exposed to malnutrition, significantly lost body weight during this interval, but were able to catch up after 30 days of rehabilitation.
Malnutrition during gestation and lactation as well as after weaning produced in a short term glucose intolerance, while malnutrition during adult life did not produce alteration in glucose metabolism in spite of 30 days of low protein diet. Such observations agree with earlier studies in malnourished animals during gestation and lactation that have reported decreased vascularization of the pancreas and number of islets of Langerhans, and reduced number of β cells which all together results in deficient secretion of insulin [8, 25, 36] especially in response to a glucose stimulus [37, 38].
After long term balanced diet rehabilitation the three experimental groups showed the same glucose response as the C groups in the GTT. Interestingly early glucose impairment observed in MGL and MPW groups were reverted by nutritional rehabilitation in spite of low insulin production at least in MPW rats. Changes in insulin sensitivity can influence plasma glucose levels as a response to a glucose administration. For example an increased sensitivity to insulin in the muscle has previously been observed by Hales et al [39] in early malnourished-rehabilitated rats. This can explain why the MGL and MPW groups under short and long rehabilitated periods were able to decrease the glucose levels during the GTT in spite of low insulin production, suggesting an alteration in insulin sensitivity and production, which in a long term can lead to insulin resistance, visceral obesity and diabetes.
In spite of the widely studied effects of malnutrition on β cells and insulin production by the pancreas, only a few studies have explored the effects of malnutrition on α-cells and glucagon production [40, 41]. Our present data show that early malnutrition does not exert any affect on glucagon values however; post-weaning malnutrition decreases the glucagon levels for more than 50% compared to controls, even after short and long term nutritional rehabilitation. It is important to point out that at all three ages on acute effect of malnutrition was a low glucagon concentration as compared with the intervals when rats were rehabilitated with a balanced diet. This effect is possibly related with the age as well as with negative metabolic state associated to the low protein diet, since low glucagon levels allow energy storage and may be a relevant adaptive strategy during malnutrition [42, 43].
The most remarkable finding in this study is the severe alterations observed in the MPW rats in blood glucose, insulin and glucagon levels. This finding suggest that after weaning the pancreas is vulnerable to a nutritional insult, probably because it is still undergoing adjustments in its anatomical and functional organization. According to Fowden [44] the main phase or remodeling of the pancreas occurs around weaning (2-3 weeks of post-natal age) and is associated with a wave of islet cell apoptosis. Data obtained with the MPW group indicate the need to study the vulnerability of the pancreas and metabolic functions in later stages of development as a possible cause for metabolic diseases. The present data suggest that even after weaning pancreas islets, vascularization and β cells may be modified by a nutritional insult.
The possibilities of achieving rehabilitation after early malnutrition are controversial; one study reported that during intraperitoneal GTT malnourished-rehabilitated animals are less glucose tolerant with a tendency to higher plasma insulin concentrations than controls [39], while another study showed a normal oral GTT with a blunted insulin response [45]. Several factors may be responsible for these contradictory results: the difference in the time and type of rehabilitation, which can be provided by either a balanced or a hypercaloric diet [10]; the method for glucose administration for the GTT can influence the time of absorption, which for our study was infused orally to the stomach, while other studies have administered the glucose via intraperitoneal injection [39, 46]. Nonetheless, the present results are in agreement with Bieswal et al, [45] who found an altered response to glucose administration after an acute interval of malnutrition, but not after nutritional rehabilitation.
Malnutrition induced low levels of TAG in MGL and MPW groups, while free fatty acids were not affected by malnutrition. The fact that MPW rats show increased levels of TAG and decreased levels of FFA even after long term rehabilitation emphasizes the long term effect of MPW on many metabolic parameters. Since increased levels of TAG are also associated with diabetes type 2 and cardiovascular disease [47, 48] this observation only emphasizes the risk of late malnutrition for metabolic disease.
Previous studies have reported that early malnutrition promotes hepatic glycogen storage [49, 50] due to adaptation of hepatic enzymes [10]. In contrast we observed in general no significant changes in malnourished groups while in MPW group after short term rehabilitation showed significant low concentrations of glycogen.
In conclusion our results show that the interval after weaning is a relevant developmental period in which metabolism can be affected by malnutrition. Our results also indicate that during this period the pancreas is vulnerable for malnourishment. With the employed rehabilitation diet the induced metabolic changes by malnutrition are reversible at early stages, while they are irreversible for the period after weaning. We provide evidence that the later stage of development encompassing puberty is a vulnerable period in which severe malnutrition can lead to permanent metabolic disturbances in adult life. Such findings are relevant because they point out an additional stage in life in which diet can influence metabolism in a permanent manner, and give support to previous observations in human populations [17, 18] that indicate infancy as the most vulnerable period that can predispose to metabolic disease similar to diabetes mellitus type II and metabolic syndrome.
Acknowledgements
The authors thank PhD Laura Ongay, Instituto de Fisiología Celular UNAM for support in RIA evaluations, Biol. Teresa Solis-Salazar for technical assistance and Dr. Ruud Buijs for comments and corrections of the English grammar. This work was funded by PAPIIT UNAM IN-203803 and IN-203907. MCMS received PhD fellowship by CONACyT and DGEP, posgrado en ciencias biomédicas, Facultad de Medicina, Universidad Nacional Autónoma de México.
Conflict of Interest
The authors have declared that no conflict of interest exists.
References
1. Aerts L, Van Assche FA. Intra-uterine transmission of disease. Placenta. 2003;24:905-11
2. Vickers MH, Brier BH, Mc Carthy D. et al. Sedentary behavior during postnatal life is determined by the prenatal environment and exacerbated by postnatal hypercaloric nutrition. Am J Physiol Regul Integr Comp Physiol. 2003;285:R271-3
3. Phillips D. Birth weight and the future development of diabetes: A review of the evidence. Diabetes Care. 1998;21(2s):150B-5B
4. Pryor G. Malnutrition and the “critical period” hypothesis. In James W. Prescott; Merril S Read and David B. Coursin, editor. Brain Function and malnutrition neuropsychologic methods of assessment, New York: John Wiley and SONS. 1975:103-112
5. Boxwell J, Ayson P, Ramenofsky M. Growth and metabolic parameters in pups of undernourished lactating rats. Physiol Behav. 1995;57:469-5
6. Dabelea D, Pettitt D, Hason R. et al. Birth weight, Type 2 diabetes, and insulin resistance in Pima Indian children and young adults. Diabetes Care. 1999;22:9440
7. Ozanne SE, Wang CL, Petry CJ. et al. Ketosis resistance in the male offspring of protein-malnourished rat dams. Metabolism. 1998;47:1450-4
8. Snoeck A, Remacle C, Reusens B. et al. Effect of a low protein diet during pregnancy on the fetal rat endocrine pancreas. Biol Neonate. 1990;57:107-8
9. Garofano A, Czernichow P, Breant B. In utero undernutrition impairs rat beta-cell development. Diabetologia. 1997;40:1231-4
10. Desai M, Byrne Ch D, Meenan K. et al. Regulation of hepatic enzymes and insulin levels in offspring of rat dams fed a reduced-protein diet. Am J Physiol. 1997;273:G899-4
11. Holness MJ, Langdown ML, Sugden MC. Early-life programming of susceptibility to dysregulation of glucose metabolism and the development to type 2 diabetes mellitus. Biochem J. 2000;349:657-5
12. Holness MJ. Enhanced glucose uptake into adipose tissue induced by early growth restriction augments excursions in plasma leptin response evoked by changes in insulin status. Int J Obes. 2001;25:1775-1
13. Shepherd PR, Crowther NJ, Desai M. et al. Altered adipocyte properties in the offspring of protein malnourished rats. Br J Nutr. 1997;78:121-9
14. Dollet JM, Beck B, Villaume Ch. et al. Progressive adaptation of the endocrine pancreas during long-term protein deficiency in rats: Effects on blood glucose homeostasis and on pancreatic insulin, glucagons and somatostatin concentrations. J Nutr. 1985;115:1581-8
15. Latorraca MQ, Carneiro EM, Boschero AC. et al. Protein deficiency during pregnancy and lactation impairs glucose-induced insulin secretion but increase the sensitivity to insulin in weaned rats. Br J Nutr. 1998;80:291-7
16. Lucas A. Programming by early nutrition in man. Ciba Foundation Symposium. 1991;156:380
17. Gonzalez-Barranco J, Ríos-Torres JM, Castillo-Martìnez L. et al. Effect of malnutrition during the first year of life on adult plasma insulin and glucose tolerance. Metabolism. 2003;52:1005-1
18. Yajnik CS. Early life origins of insulin resistance and Type 2 diabetes in India and other Asian countries. J Nutr. 2004;134:2050
19. Vickers MH, Gluckman PD, Coveny AH, Hofman PL, Cutfield WS, Gertler A, Breier BH, Harris M. Neonatal leptin treatment reverses developmental programming. Endocrinology. 2005;146:4211-6
20. Gaceta Oficial del Distrito Federal. Decreto ley de protección a los animales del Distrito Federal, 26/02/02. Gaceta Oficial del Distrito Federal. 2002
21. Aguilar-Roblero R, Salazar-Juarez A, Rojas-Castaneda J. et al. Organization of circadian rhythmicity and suprachiasmatic nuclei in malnourished rats. Am J Physiol. 1997;273:1321-1
22. Miñana-Solis MC, Escobar C. Increased susceptibility to metabolic alterations in young adult females exposed to early malnutrition. Int J Biol Sci. 2006;3:12-9
23. Resnick O, Morgane RH, Miller M. Overt and hidden forms of chronic malnutrition in the rat and their relevance to man. Neurosci Biobehav Rev. 1982;6:55-5
24. Lopez-Soldado I, Munilla MA, Herrera E. Long-term consequences of under-nutrition during suckling on glucose tolerance and lipoprotein profile in female and male rats. Br J Nutr. 2006;96:1030-7
25. Latorraca MQ, Reis MAB, Carneiro EM. et al. Protein deficiency and nutritional recovery modulate insulin secretion and the early steps of insulin action in rats. J Nutr. 1998;128:1643-9
26. Field KJ, White WJ, Lang CM. Anaesthetic effects of chloral hydrate, pentobarbitone and urethane in adult male rats. Lab Anim. 1993;27:258-9
27. Nóvak M. Colorimetric ultramicro method for the determination of free fatty acids. J Lipid Res. 1965;6:431-3
28. Hassid WZ, Abraham S. Chemical procedures for analysis of polysaccharides. In: (ed.) Colowick SP, Kaplan C. Methods in enzymology, vol 3. New York: Academic Press. 1957:34-50
29. Marin MC, Se Tomàs ME, Serres C. et al. Protein-energy malnutrition during gestation and lactation in rats affects growth rate, brain development and essential fatty acid metabolism. J Nutr. 1994;125:1017-4
30. Gamallo JGT, Perry MLS, Trindade VMT. et al. Effect of pre-and postnatal protein undernutrition on glycemia, ketonemia and liver glycogen concentration in suckling rats. Ann Nutr Metab. 1989;33:2660
31. Rees WD, Hay SM, Brown DS. et al. Maternal protein deficiency causes hypermethylation of DNA in the livers of rat fetuses. J Nutr. 2000;130:1821-6
32. Pucciarelli HM, Goya RG. Effects of post-weaning malnutrition on the weight of the head components in rats. Acta Anat. 1983;115:231-7
33. Reichling TD, German RZ. Bones, muscles and visceral organs of protein-malnourished rats (Rattus norvegicus) grow more slowly but for longer durations to reach normal final size. J Nutr. 2000;130:2326-2
34. Holness MJ. Impact of early growth retardation on glucoregulatory control and insulin action in mature rats. Am J Physiol. 1996;270:E946-4
35. Ozanne SE, Wang CL, Coleman N. et al. Altered muscle insulin sensitivity in the male offspring of protein-malnourished rats. Am J Physiol. 1996;271:E1128-4
36. Martin JF, Johnson CS, Han CT. et al. Nutritional origins of insulin resistance: A rat model for diabetes-prone human populations. J Nutr. 2000;130:741-4
37. Bertin E, Gangnerau MN, Bellon G. et al. Development of beta-cell mass in fetuses of rats deprived of protein and/or energy in last trimester of pregnancy. Am J Physiol Regul Integr Comp Physiol. 2002;283:R6230
38. Blondeau B, Avril I, Duchene B. et al. Endocrine pancreas development is altered in foetuses from rats previously showing intra-uterine growth retardation in response to malnutrition. Diabetologia. 2002;43:394-1
39. Hales CN, Desai M, Ozanne SE. et al. Fishing in the stream of diabetes: from measuring insulin to the control of fetal organogenesis. Biochem Soc Trans. 1996;24:3410
40. Alvarez E, Fernández S, Blazquez E. Effect of maternal food restriction on circulating insulin and glucagon levels and on liver insulin and glucagon binding sites of fetal and suckling rats. Diabete Metab. 1986;12:123-2
41. Berney DM, Desai M, Palmer DJ. et al. The effects of maternal protein deprivation on the fetal rat pancreas: major structural changes and their recuperation. J Pathol. 1997;183:109-5
42. Navarro-Tableros V, Fiordelisio T, Hernández-Cruz A. et al. Physiological development of insulin, calcium channels, and GLUT2 expression of the pancreatic rat beta-cells. Am J Physiol Endocrinol Metab. 2007;292:E1018-1029
43. Tovar AR, Ascencio C, Torres N. Soy protein, casein, and zein regulate histidase gene expression by modulating serum glucagon. Am J Physiol Endocrionol Metab. 2002;283:E1016-1022
44. Fowden AL, Hill DJ. Intra-uterine programming of the endocrine pancreas. Br Med Bull. 2001;60:123-2
45. Bieswal F, Ahn MT, Reusens B. et al. The importance of catch-up after early malnutrition for the programming of obesity in male rat. Obesity. 2006;14:1330-3
46. Picarel-Blanchot F, Alvarez C, Bailbe D. et al. Changes in insulin action and insulin secretion in the rat after dietary restriction early in life: Influence of food restriction versus low-protein food restriction. Metabolism. 1995;44:1519-6
47. Holness MJ, Fryer LG, Priestman DA, Sugden MC. Moderate protein restriction during pregnancy modifies the regulation of triacylglicerol turnover and leads to dysregulation of insulin's anti-lipolitic action. Mol Cell Endocrinol. 1998;142:25-3
48. Ginsberg HN, Zhang YL, Hernandez-Ono A. Regulation of plasma triglycerides in insulin resistance and diabetes. Arch Med Res. 2005;36:2320
49. Claeyssens S, Lavoinne A, Vaillant C. et al. Metabolic changes during early starvation in rats fed a low-protein diet in the postweaning growth period. Metabolism. 1992;41:722-7
50. Gosby AK, Maloney ChA, Phuyal JL. et al. Maternal protein restriction increases hepatic glycogen storage in young rats. Pediatric Research. 2003;54:413-8
Author contact
![]() Correspondence to: Carolina Escobar, Departamento de Anatomía, Edificio B 4o piso, Facultad de Medicina, UNAM, México, D. F. 04510. Tel: (525) 56-23-24-22; Fax: (525) 56-23-24-25; Email: minanafacmed.unam.mx
Correspondence to: Carolina Escobar, Departamento de Anatomía, Edificio B 4o piso, Facultad de Medicina, UNAM, México, D. F. 04510. Tel: (525) 56-23-24-22; Fax: (525) 56-23-24-25; Email: minanafacmed.unam.mx