Impact Factor ISSN: 1449-2288
- Issue 12; 2026
- Issue 11; 2026
- Issue 10; 2026
- Issue 9; 2026
- Issue 8; 2026
- Volume 22; 2026
- Past Issues
- Advance Articles
- Editorial Board
- Cover Images
- Index & Coverage
- Cover Suggestion
- Special Issues
1. Introduction
2. Materials and Methods
3. Results
4. Discussion
Abbreviations
Acknowledgements
References

 Global reach, higher impact
Int J Biol Sci 2009; 5(1):1-12. doi:10.7150/ijbs.5.1 This issue Cite
Research Paper
Genome-wide Analysis of BP1 Transcriptional Targets in Breast Cancer Cell Line Hs578T
Yongchun Song1, Chengxue Dang1, Yebo Fu2, Yi Lian3, Jenny Hottel3, Xuelan Li4, Tim McCaffrey3, Sidney W. Fu3 ![]()
1. Department of Tumor Surgery, the First Affiliated Hospital, Xi'an Jiaotong University College of Medicine, 277 W. Yanta Road, Xi'an, Shaanxi 710061, China
2. Marriotts Ridge High School, 12100 Woodford Drive, Marriottsville, MD 21104, USA
3. Department of Biochemistry and Molecular Biology, The Catharine Birch McCormick Genomics Center, George Washington University Medical Center, 2300 I Street, Washington DC 20037, USA
4. Department of OB & GYN, the First Affiliated Hospital, Xi'an Jiaotong University College of Medicine, 277 W. Yanta Road, Xi'an, Shaanxi 710061, China
Received 2008-11-24; Accepted 2008-12-2; Published 2008-12-3
Abstract
Homeobox genes are known to be critically important in tumor development and progression. The BP1 (Beta Protein 1) gene, an isoform of DLX4, belongs to the Distal-less (DLX) subfamily of homeobox genes and encodes a homeodomain-containing transcription factor. Our studies have shown that the BP1 gene was overexpressed in 81% of primary breast cancer and its expression was closely correlated with the progression of breast cancer. However, the exact role of BP1 in breast has yet to be elucidated. Therefore, it is important to explore the potential transcriptional targets of BP1 via whole genome-scale screening. In this study, we used the chromatin immunoprecipitation on chip (ChIP-on-chip) and gene expression microarray assays to identify candidate target genes and gene networks, which are directly regulated by BP1 in ER negative (ER-) breast cancer cells. After rigorous bioinformatic and statistical analysis for both ChIP-on-chip and expression microarray gene lists, 18 overlapping genes were noted and verified. Those potential target genes are involved in a variety of tumorigenic pathways, which sheds light on the functional mechanisms of BP1 in breast cancer development and progression.
Keywords: BP1, homeoprotein, ChIP-on-chip, breast cancer, ER
1. Introduction
BP1 (GenBank accession no.: AF254115) sequence analysis has revealed that it belongs to the Distal-less (DLX) subfamily of homeobox genes [1], which encodes a homeodomain-containing transcription factor. BP1 is an isoform of DLX4, which has two functionally distinctive splice variants including DLX7 [2]. BP1 and DLX7 are apparent isoforms expressed either as splice variants transcribed from a single gene or driven by different promoters. The sequence similarity extends to nucleotide 565 of BP1 where upstream sequences begin to diverge. Furthermore, using FISH (Fluorescence In Situ Hybridization) and PCR, BP1 was mapped to chromosome 17q21-22, the same region to which DLX7 was localized [1].
BP1 gene expression was absent or very low in normal mammary tissue, but was overexpressed in 81% of primary breast cancer. In addition, BP1 was expressed in a series of breast cancer cell lines and high levels of BP1 expression in breast cancer cell lines strongly correlates with its tumorigenic potential [3]. BP1 expression was closely correlated with the progression of breast cancer [4]. Furthermore, increased BP1 may impart a survival advantage to breast cancer cells, which could be a cause of therapeutic resistance in cancer treatment [5]. Through electrophoretic mobility shift assays (EMSA), site-directed mutagenesis and luciferase reporter assays, it was found that BP1 contributes to the inhibition of apoptosis in MCF7 breast cancer cells challenged with TNFα and that the bcl-2 gene is a direct target of BP1 protein [5].
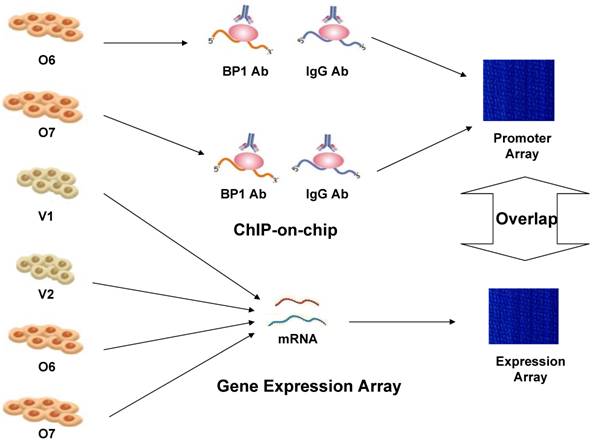
Therefore, experimental whole genome-scale screening is needed to unveil the potential target genes for BP1 homeoprotein. The recently developed protein-DNA binding assay technique, commonly named ChIP-on-chip, is able to produce comprehensive genome-wide location information for specific transcription factors. Identifying the BP1 targets would provide new information of regulatory roles of BP1 in breast cancer and potential novel targets for early detection and intervention. But ChIP-on-chip based evidence for transcription factor binding does not always correlate with the actual transcriptional regulation of the target genes. Thus, we applied this method in conjunction with expression microarray and BP1 motif analysis of the promoter region, to identify candidate target genes that are directly regulated by BP1 in breast cancer cell line Hs578T. The overall scheme is depicted in Figure 1.
Overall experimental design scheme to identify targets of BP1 in Hs578T breast cancer cells. ChIP-on-chip was performed on BP1-overexpressing Hs578T cell lines, O6 and O7. Specific target genes were identified by comparing with IgG-pulled DNA. Affymetrix Human Genome Focus arrays were used to identify differentially expressed genes associated with BP1 overexpression using BP1 overexpressors, O6 and O7 and empty vector controls, V1 and V2. Overlapping target genes between ChIP-on-chip and expression array analysis were identified for further analysis.
2. Materials and Methods
2.1. Cell Culture / Cell Morphology and MTT assay
Two Hs578T stable cell lines transfected with pcDNA3.2/BP1 (O6 and O7) were used, along with two controls containing vector pcDNA3.2-DEST alone (V1 and V2). Cells were maintained in DMEM supplemented with 10% fetal bovine serum, penicillin/streptomycin, 400μg/ml G418 antibiotics, and 2mM glutamine. The BP1 expression level of mRNA and protein was confirmed by QPCR and Western Blot assay (Rabbit Polyclonal anti-BP1, NB100-481, NOVUS, Taiwan).
In order to determine cell proliferation rate, the Thiazolyl Blue Tetrazolium Bromide (MTT, Sigma, USA) metabolic assay was employed. Cells were seeded in a 24-well microplate at a concentration of 10,000cells/well. The medium was changed at 12h. Survival was evaluated by replacing the culture media with 200μl of 0.5mg/ml MTT-media solution after 24h, 48h and 72h incubation. The followed by 4h of incubation at 37ºC, the MTT reagent was removed before adding 200μl of DMSO. The absorbance was determined at 560 nm with a microplate reader (Molecular Devices).
Cell images were taken by a Nikon Eclipse TE3000 inverted microscope with 40× and 100× magnification (Nikon, Inc., Melville, NY) and MagnaFire software. For the ChIP-on-chip experiment, cells were cultured in a T-150 flask for 24h before harvest.
2.2. Chromatin Immunoprecipitation (ChIP)
The ChIP-on-chip experiments were performed on two BP1-overexpressing cell lines, O6 and O7. ChIP was carried out using the Upstate kit (New York, USA). The number of cells used was about 5×10⁷ for each sample. Protein-DNA cross-links were formed by incubating the cells in 1.42% (V/V) formaldehyde at room temperature for 15 min. Glycine was then added, yielding a final concentration of 0.125M, for 5 min to stop the cross-linking. Sonication (Sonifier Cell Disrupter 350 model, Branson Ultrasonics Corporation, USA) was performed 11 times, 15 seconds per sonication, to generate 200-500bp fragments. The lysate was pre-cleared with a protein G/A beads (Calbiochem, USA) slurry for 2h. A 120 µg aliquot of the clear lysate was saved as an “input” control. The remaining lysate was split into 2 eppendorf tubes, and incubated individually with 15µg of specific antibody against BP1 (Rabbit Polyclonal anti-BP1, NB100-481, NOVUS, Taiwan) and 15µg of rabbit IgG (sc-2027, Santa Cruz, USA) at 4ºC overnight. Next, salmon sperm DNA/protein G/A beads were added to each tube for 2h and the beads were pelleted, then eluted. Before phenol-chloroform DNA extraction, the protein-chromatin cross-linking was reversed by proteinase K for the immunoprecipitated samples and incubated at 65ºC overnight.
2.3. Amplification and microarray assay
The whole-genome amplification (WGA, Sigma) method was used to amplify sufficient amounts of DNA for hybridization to the promoter arrays. The standard protocol for WGA using the GenomePlex® WGA2 kit (Sigma-Aldrich, St. Louis, MO, USA) was adapted with modification of omitting the initial random fragmentation step because ChIP DNA sample is fragmented after sonication. A 10µl ChIP DNA samples (IgG and BP1) were amplified. The concentration of the amplified DNA was detected by the nanodrop spectrophotometer. A total of 10.8µg of BP1-pulled DNA and 8.5 µg IgG-pulled DNA was amplified.
The microarray chips used for ChIP analysis were GeneChip® Human Promoter 1.0R Array (Affymetrix, USA). The fragmentation and labeling was performed with the GeneChip® Terminal Labeling Kit (Affymetrix, USA) according to the manufacturer's recommendations. The final amount of DNA used in hybridization was 7.5µg for each sample. Four GeneChip® Human Promoter 1.0R Array (Affymetrix, USA) chips were used for the analysis. The washing, staining, and scanning were performed as specified by the manufacturer, using the GeneChip® Hybridization Wash and Stain Kit, GeneChip® Hybridization Oven 640, GeneChip® Fluidics Station 450 and GeneChip® Scanner 7G (Affymetrix, USA).
2.4. Data analysis and verification
Partek Genomics Suite 6.3 software was used to analyze the data. ChIP-on-chip CEL files were input into the software along with the following parameters: segmentation parameter with three consecutive probes for minimum probe sets, 0.001 for P-value threshold, 1.5 for fold change and 0.5 for signal to noise. One-way ANOVA was used as the statistical method and Affymetrix U133 2.0 Plus Bed file was used to perform a region overlap. A total of 303 significant enrichment binding sites, associated with 259 relevant genes, between BP1 and IgG IP DNA were revealed. For the Human Genome Focused expression array analysis, the One-way ANOVA was used with the parameters of 0.001 for P-value threshold and 2 for fold change, resulting 306 differentially expressed genes. The overlap of the gene lists between the ChIP-on-chip and expression arrays is shown in Figure 4.
To verify the accurate rate for the BP1 binding site that is shown in the ChIP-on-chip list, an independent cell culture and ChIP assay were performed, in the same manner as described above. After precipitation and purification, 25µl dH2O was used to resolve the ChIP DNA. The 3µl of diluted input DNA (100 times dilution) and 3µl of ChIP DNA were used for PCR amplification, in order to verify BP1 binding sites in the IP DNA.
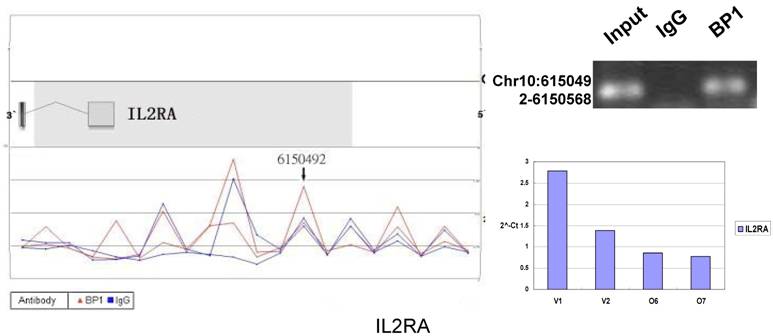
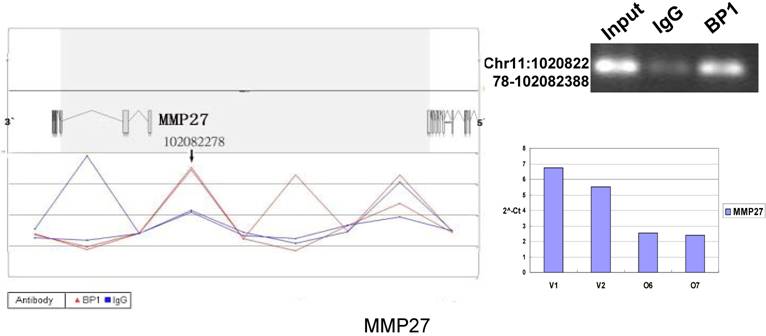
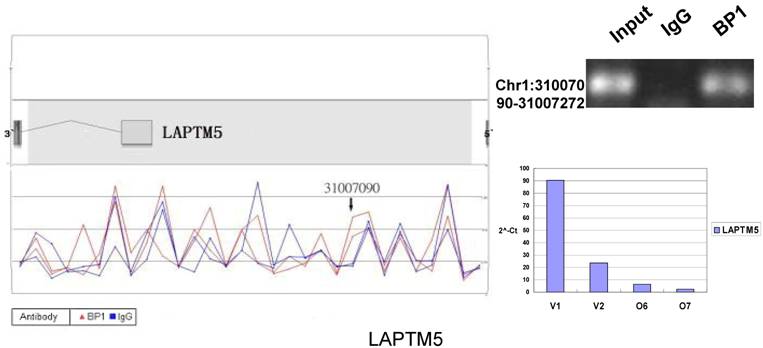
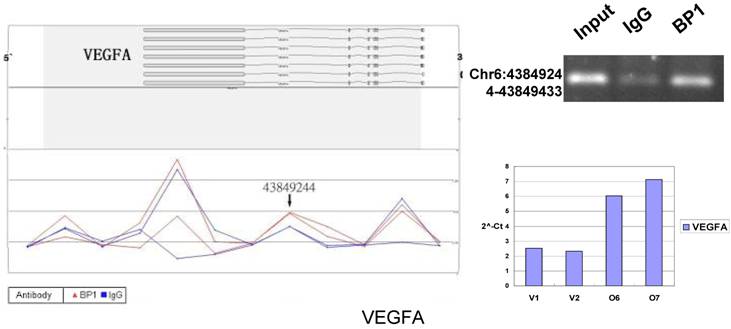
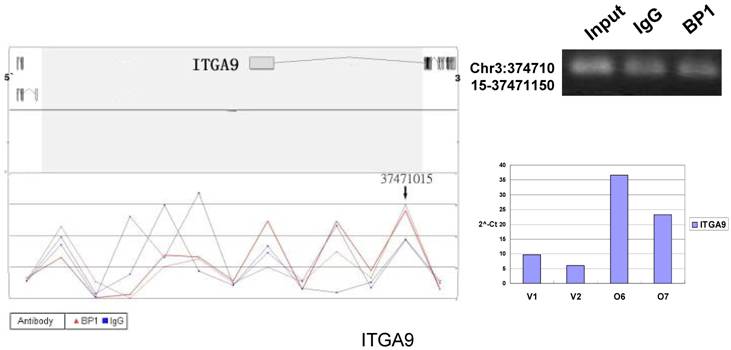
Ten binding sites, whose target genes are relevant to cancer, were selected for verification. RefSeq mapping data was collected from the UCSC Genome Browser's RefFlat table (The UCSC genome browser database: update 2007). As previously described [6], the closest RefSeq 5` end for each ChIP region was identified, regardless of whether the cluster was upstream or downstream of the 5` end. The distance was calculated from the start of each cluster (Tab. 2 and Fig. 6). The Primer3 (v.0.4.0) was used to design the primers that amplifies the binding sites. At the same time, the target gene QPCR primers for mRNA expression analysis were designed to verify the microarray results. The PCR results for ChIP DNA and QPCR results of gene expression were shown in Figure 6.
2.5. Promoter Sequence, Gene Ontology and cascade analysis
A motif-finding algorithm (MDScan) [7] was utilized to uncover motifs that are highly represented in the set of the promoter sequences. The logo pictured in Figure 3 was generated by WEBLOGO (http://weblogo.berkeley.edu/logo.cgi). Functional categories were assigned using both the Genespring GX 9.0.5 (Agilent, USA) and manual inspection using the Gene Ontology (GO) (www.fatigo.org). In order to predict the relationship between BP1 direct targets and the cell character, Pathway Studio 5.0 (Ariadne, USA) was used to discover the cascades from BP1 direct targets to indirect changed genes.
3. Results
3.1. Cell proliferation and morphology assay
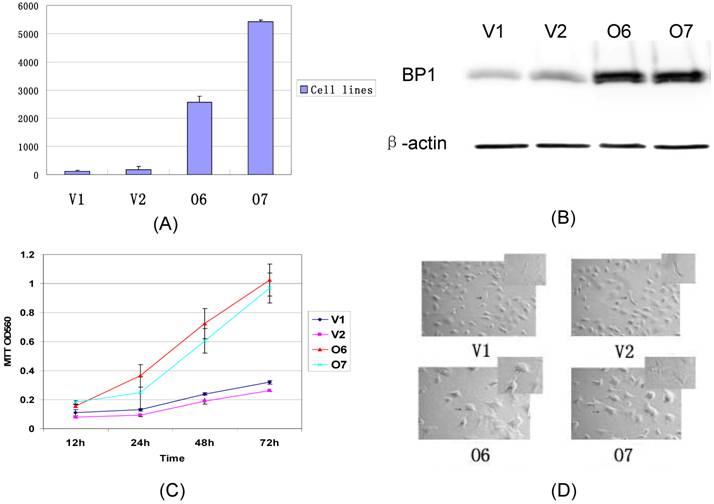
The BP1 transfected Hs578T cells were established in our lab. The expression of BP1 mRNA was confirmed by QPCR and Western Blot assays (Fig. 2A, 2B). After Hs578T cells were stably transfected by BP1, the cell proliferation ability was detected by the MTT assay. There was significantly more increasing proliferation ability in BP1 transfected Hs578T cells than in vector transfected Hs578T cells (Fig. 2C). During the same time, it was ascertained the cell morphology in BP1 transfected Hs578T cells was changed. The cells became bigger, polygon, and had more antennae in BP1-overexpressing cells. The cells changed from a spindle form to a circular shape (Fig. 2D).
Comparison of the expression, proliferation, and cell morphology between BP1 overexpressing cells and controls in Hs578T cells. (A) QPCR analysis of BP1 expression. BP1 mRNA was expressed more than 100 fold in O6 and O7 cells in comparison to the controls, V1 and V2 (P<0.01). (B) Western blot Analysis showing that BP1 protein levels are 5-fold higher in O6 and O7 cells than the controls, V1 and V2. β-actin was used as an internal control. (C) MTT assay for cell proliferation analysis. At 24h, 48h and 72h, the proliferation rate in O6 and O7 cells was significantly higher than that in V1 and V2 cells (P<0.01). The experiments were repeated 3 times. (D) The cell morphology analysis showing the difference between the O6, O7 (Circular) and V1, V2 cells (Spindle).
3.2. ChIP-on-chip analysis of BP1 binding sites
To identify targets of BP1 in an unbiased genome-wide manner, the Affymetrix GeneChip® Human Promoter 1.0R Array, containing the region spanning approximately 7.5kb upstream through 2.45kb downstream of 5' transcription start sites of 25,500 human genes, was employed. The 10kb tiling array around the transcription start site (TSS) was chosen because more and more evidence has shown the transcription factor bound to the big gap from TSS also modulates the gene expression [8-10].
In order to accurately locate the DNA binding sites of BP1, the experiment was performed with two BP1-overexpressing cell lines. A total of 153 promoters (P<0.001), bound by BP1 in Hs578T cells (Supplementary Table S1, which is published as supporting information on the web site), were identified. Binding by BP1 to a subset of targets was confirmed using conventional ChIP assays and PCR for 10 binding sites. The rate of false positives was <20% when previously established threshold criteria were used (Fig. 6). The distance from binding start site to 5` transcription start site was derived from the UCSC Genome Browser. The primers used in 10 binding sites are available online (Table 1).
Primers used for binding site identification and expression verification.
| Gene Symbol | Binding Site Identification | Expression Verification |
|---|---|---|
| VEGFA | GAAGGTGCCCAGGTGAGAG | CTACCTCCACCATGCCAAGT |
| CAAATCTCTCCAGAGCCTCAA | GCAGTAGCTGCGCTGATAGA | |
| STAT1 | TCTCACAAGAGGCTGGAGGT | CTTGTTGGGGCACAAGGT |
| GGCTCTGCTCGCCTACTCT | CCATGGGAAAACTGTCATCA | |
| EIF4E | TACAGTCGGGGAAGGAAGTG | TCGATCTAAGATGGCGACTG |
| ACAGAACTGACCAGAAACCATC | CTGGGTTAGCAACCTCCTGA | |
| MEIS1 | TCTTTTCCCAGGCTGTCTTC | CATGGGAGGTTTCGTAATGG |
| TGATATCAATCATAGGTGTATAGCTCA | CCTTGCTTTGCGATTGGTTA | |
| MSR1 | AGGGTGATGAGATGACAGAAA | TGCAGTTCTCATCCCTCTCA |
| TCAAGGTTAATTTGTTGGGAAC | CCTTTTCCCGTGAGACTTTG | |
| ITGA9 | GAGCTCAAAAGTGCCCTCTC | GAAGACCGCGATGATGAGT |
| TGAGGGAGGAAAAAGAAGCA | GGATGTGGTCGGCTTCATAG | |
| HPSE2 | GGCAAGTTGGATCGGAGTTA | GGCCCGGATTACTATCTCAA |
| CGCAGGAGATTTAAGGAGGA | GGAGCTCCAGCATAACATCAG | |
| IL2RA | CATGTGGTGCCAGCGTATAG | CCACAGAAATGCAAAGTCCA |
| GACGCTCACAGTCTCCTCAA | CCCCACCACGAAATGATAAA | |
| LAPTM5 | ACCAGCTGTGTGTCTTGCAG | CTGATCTCCAGCTTCCTGCT |
| TCCTGTCCTTTAAACCCTTTCTC | CCATGATTTGCAGGGACAG | |
| MMP27 | TTCCAGTCAGGCCAGATTTC | CCCTGGGTGGAGAAAATACA |
| GCTCTGGGTTTTGGAGAATG | TTGCTCCACACTTCTAAACCTC |
The results of the genome location experiment of BP1 were further analyzed using a motif-finding algorithm (MDscan), which examines the ChIP-on-chip selected sequences and searches for DNA sequence motifs representing the protein-DNA interaction sites [7]. The consensus sequence derived from the most frequent motifs found in the BP1-bound promoters corresponds to a perfect BP1 response element (G/C)CTGCATG(T/C), which is visually represented in Figure 3. This sequence will be used to predict the binding site of BP1 protein in the genome.
Genome-wide location analysis of direct BP1 transcriptional targets in Hs578T breast cancer cells. Motif-finding algorithms identify the consensus BP1 sequence (G/C)CTGCATG(T/C) as the most common transcription factor-binding motif, which presents in 60% of the promoters used for the analysis.

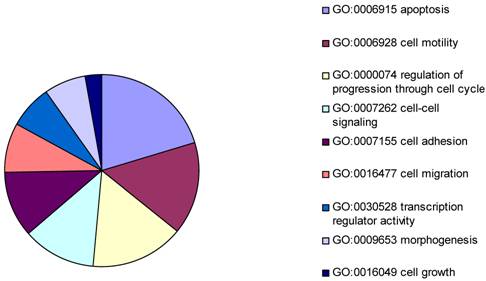
Pie chart representing major biological functions and processes associated with BP1 overexpression. The resulting 306 differentially expressed genes were intensely analyzed by Gene Ontology. In cellular physiological process classification, the major part was apoptosis followed by cell motility, cell cycle, cell-cell signaling, cell adhesion, cell migration, transcription regulator activity, morphogenesis, and cell growth.
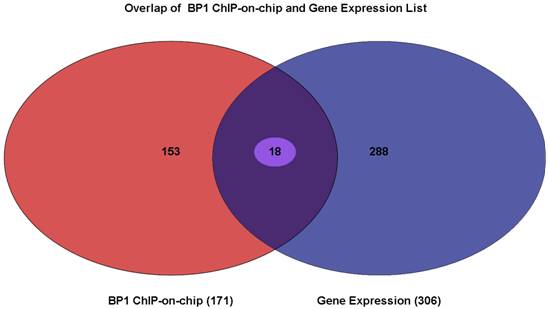
Venn Diagram showing the overlapping genes between gene lists from BP1 ChIPon-chip and expression microarray. Of 171 genes from the BP1 ChIP-on-chip data and the 306 genes that were differentially expressed, there were 18 of them overlapping. The intersecting region represents 18 genes whose promoter region may be bound by BP1 and that are deregulated when BP1 is overexpressed.
3.3. Gene expression microarray analysis
The gene expression microarray assay was performed to generate a differentially expressed gene list to identify the potential targets in common with that from the ChIP-on-chip assays. Levels of mRNA expression for each target were compared between vector transfected Hs578T cells and BP1 transfected Hs578T cells. The data from the Human Genome Focused arrays were analyzed using the Partek with strict thresholds (p<0.01, Foldchange>2). The resulting 306 differentially expressed genes were intensely analyzed by Gene Ontology. Because our experiment was performed in cancer cells, the focus was on cellular physiological processes (GO: 50875). According to the biology function classification, 42 of 306 genes were associated with apoptosis, 32 were related to cell cycle progress, and 17 were involved in cell migration. It was shown that the mechanism of BP1 enhancing proliferation maybe because BP1 effects the apoptotic factors [2].
3.4. Identification of direct gene targets that are expressed significantly different when BP1 is overexpressed
To elucidate which gene BP1 binds to and deregulates, the Venn Diagram analysis through Partek was performed. There were 18 overlapping genes. The list for these 18 genes is shown in Table 2. The distance in the table represents the number of bases that use 5` transcription start site of the gene minus the binding start site. If this number is positive, the binding site is in front of the TSS, possibly in the promoter or enhancer region. If it is negative, the binding site maybe in the intron or exon of the target gene.
Overlapping genes between BP1 ChIP-on-chip data and the microarray results
| Gene Symbol | GenBank ID | Binding Site Distance (bp) | Fold Change | Gene Function |
|---|---|---|---|---|
| ADAM21 | NM_003813 | 4280 | -2.12012 | proteolysis |
| CASQ1 | NM_001231 | 3641 | -1.77249 | mitochondrion |
| CBR1 | NM_001757 | 2651 | -2.15584 | carbonyl reductase (NADPH) activity |
| CCL4 | NM_002984 | -13867 | -1.78511 | cell adhesion |
| CSF2RB | NM_000395 | -690 | -2.24506 | signal transduction |
| HPSE2 | NM_021828 | -1075 | -1.53345 | hydrolase activity |
| HTR1B | NM_000863 | 2552 | -2.0201 | signal transduction |
| IL2RA | NM_000417 | 6214 | -2.42635 | positive regulation of apoptosis |
| ITGA9 | NM_002207 | -2198 | 3.26587 | Cell adhesion |
| LAPTM5 | NM_006762 | 3836 | -2.24236 | integral to plasma membrane |
| LGALS13 | NM_013268 | -248 | -1.93361 | lipid degradation |
| LSM7 | NM_016199 | -3962 | 2.32186 | mRNA metabolism |
| MMP27 | NM_022122 | 600 | -1.53542 | proteinaceous extracellular matrix |
| OR1A1 | NM_014565 | 504 | -2.81835 | signal transduction |
| PTPRE | NM_006504 | -137517 | -1.79625 | protein amino acid dephosphorylation |
| SELE | NM_000450 | 1369 | -1.61012 | cell adhesion |
| TAC3 | NM_013251 | 31955 | -1.68822 | neuropeptide signaling pathway |
| VEGFA | NM_001025370 | -3313 | 2.55763 | angiogenesis, differentiation |
* Distance was calculated between the positions of 5` transcription start site and potential binding site, which were obtained from UCSC Genome Browser. Positive numbers signify the binding sites are in front of the TSS, and negative ones indicate they are located in the exon or intron regions.
3.5. Verification by ChIP and QPCR
Since the amount of genomic DNA obtained from the ChIP is limited, amplification is essential to generate sufficient DNA for microarray hybridization. The method previously used was random primer amplification, which is recommended by Affymetrix (http://www.affymetrix.com/products/arrays/specific/human_promoter.affx). The method chosen in this study was WGA (Whole Genome Amplification). There are many labs now using this method and reporting very consistent data with low bias effects, and large quantities of DNA produced [11].
To verify the potential binding sites from the ChIP-on-chip data, PCR was performed using primers flanking the region of interest; QPCR was also used for the verification of the microarray expression data. Ten sets of primers were designed for both ChIP-on-chip and expression analysis using the Primer3 (v.0.4.0). The UCSC Genome Browser analysis for binding sites prediction, PCR binding site verification and the corresponding QPCR expression analysis is shown in Figure 6. In those 10 conventional ChIP assays, 9 of them were consistent to the ChIP-on-chip assay. The data for ITGA9 shows the same level of DNA recruitment in both BP1 and IgG immunoprecipitated samples, which suggest there might be a weak binding. The QPCR showed all of them had the same gene expression trend as the gene expression array.
Schematic representations of the enrichment analysis and experimental verification of target genes. For each composite figure, left panel indicates the enrichment analysis using UCSC Genome Browser. The red peaks represent the enrichment of DNA immunoprecipitated with BP1 antibody, while the blue peaks represent that with the IgG antibody from the BP1 transfected Hs578T cells. The binding sites are indicated with arrows. Upper right agarose gel picture is the PCR amplification of a specific genomic region for binding site verification using BP1 and IgG immunoprecipitated DNA as template, with input DNA as a positive control. Lower right graph represents quantitative mRNA expression comparison between BP1-overexpressing cells, O6, O7 and V1, V2 by real-time RT-PCR.
3.6. Pathway analysis
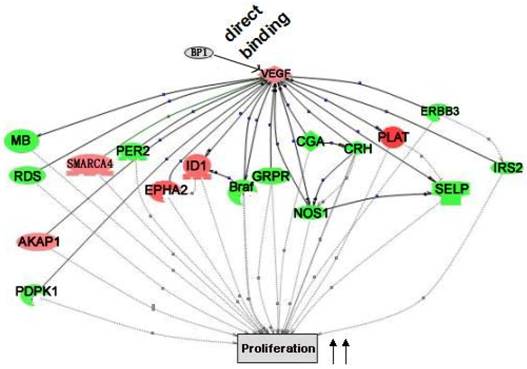
Pathway Studio 5.0 was used to extensively analyze the data from both promoter and expression arrays. It is found that multiple differentially expressed genes from the expression array analysis are the targets of the genes that are directly regulated by BP1. Logically, it is believed that the reason BP1 induces cell proliferation and enhances tumor metastasis is the result of direct or indirect downstream regulation. The cascade between VEGFA up-regulation and cell proliferation was shown in Figure 7.
Cascade between VEGFA, a direct target of BP1, and its downstream target genes in cell proliferation. VEGFA functional cascades were analyzed by the Pathway Studio 5.0. Genes in the network, red for upregulated and green for down-regulated ones, are the targets of VEGFA, which collectively promote cell proliferation.
4. Discussion
Breast cancer is one of the most common malignancies affecting women and is expected to be diagnosed in approximately 184,450 cases in the United States in 2008, and about 40,480 women will die from the disease this year alone [12]. Homeobox genes are known to be critically important in the normal development of organisms from Drosophila to humans [13]; and cancer is a consequence of normal development gone awry. It is logical to hypothesize that aberrant expression of these genes may contribute to cancer [14]. Actually, a lot of evidence has shown homeobox genes that are upregulated in cancer normally show expression patterns that are restricted to undifferentiated or proliferative cells [15]. Conversely, homeobox genes that are downregulated in cancer are normally expressed in differentiated tissues. Homeobox genes can be re-expressed in the tumorigenic cells that are derivatives of embryonic cells in which the particular homeobox gene is normally expressed during development [16].
The deregulated expression of homeobox genes has been described in many solid tumors and derivative cell lines. Among these, HOX, HSIX1, PAX have been shown to promote cellular transformation in breast cancer[17-19]. The human homologue HOXA1 has been detected in breast cancer lesions and adjacent tissues [20]. HOXA1 mRNA expression is also modulated by retinoic acid, a common differentiation agent in MCF7 cells [21]. In addition, overexpression of murine Hoxb7 in SkBr3 breast adenocarcinoma cells caused increased proliferation and decreased growth factor dependency [22].
It was previously shown that the BP1 gene was overexpressed in 81% of primary breast cancer [3] and was closely correlated with the progression of breast cancer [4]. Furthermore, in order to elucidate the mechanism of BP1 function, it was discovered that the bcl-2 gene is a direct target of BP1 protein in MCF-7 cells, and contribute to the inhibition of apoptosis challenged with TNFα [5]. Our previous studies have shown that overexpression of BP1 presents a more aggressive phenotype in breast cancer cells (unpublished). The reasons for choosing the Hs578T cell line as a model are because: 1) Hs578T cells are estragon-receptor(ER) negative. There are no effective treatments for ER- breast cancer and often the prognosis is poor; 2) Hs578T cell line expressed low or barely detectable BP1 [3]. Therefore, it is important to identify potential downstream targets of BP1 to elucidate its biological functions in breast tumorigenesis and progression. Homeobox genes usually work as vital genes in embryogenesis and development [23]. Due to the fact that homeobox genes encode transcription factors which typically switch on cascades of other genes, and that BP1 belongs to the DLX family of homeobox genes, it is believed that BP1 regulates its target genes via direct binding to its corresponding promoter or enhancer. Hence, the ChIP-on-chip strategy was used to identify the potential binding targets for BP1 homeoprotein.
The antibody is one of the most important factors for the ChIP-on-chip experiment. Western blot was performed on the ChIPed lysate to verify the specificity of BP1 immunoprecipitation. The result of the Western Blot showed BP1 protein was bound by this particular BP1 antibody not only in vivo and but also following formaldehyde treatment. Therefore, we believe this antibody is suitable for the identification of BP1 target genes.
The accuracy rate of microarray data depends on the threshold chosen for the analysis. Although the p value in our analysis was 0.001, we can still identify 10 potential binding sites, of which 9 of them were verified by a conventional ChIP assay. Therefore, the false positives rate was 10% using our threshold criteria (see Materials and Methods). False positives can occur for a number of reasons in ChIP-on-chip experiments. Therefore, it is recommended to perform independent ChIP experiments when ChIP-on-chip results are intended for further analysis.
New target genes, within the functional categories, that are involved in cell proliferation and other important functions of cancer were identified. Given the known property of BP1 to stimulate cell proliferation and change cell morphology, it was surprising that only a few key genes were obtained in our location analysis, for example, VEGFA and HPSE2.
Binding of BP1 to the promoter regions of target genes is a vital step of BP1 function as a transcription factor. However, the binding of BP1 in the promoter region may not necessarily function as a transcriptional activator or repressor depending on the molecular context. By comparing the expression microarray and binding sites target gene lists, 18 overlapping genes were obtained. Interestingly, most of these genes were down-regulated by BP1, showing that BP1 works as an inhibitor in most situations. Due to our luciferase assay system not working well with down-regulated genes, they could be a subject of future study using a more amenable reading system.
Many predictions can be generated from the established VEGFA cascade network. For example, BP1 directly up-regulates VEGFA expression according to ChIP and QPCR assay (Fig. 6). As reported previously, VEGF enhances the expression of ID [24], which can promote cell proliferation[24-27]. VEGF and ID1 both induce EPHA2 expression[27, 28], which also promote cell proliferation[29, 30]. This demonstrates that BP1 is an upstream regulator in the VEGF pathway.
Despite the stringency of the integrated analysis of ChIP-on-chip and microarray data, we found a number of novel BP1 target genes, some of which are vital to cell proliferation and tumorigenesis. Of note, further analysis of the BP1 regulatory networks in tumorigenesis is warranted. Take note that the gene expression microarrays used only represent about 9,000 genes, therefore whole genome arrays for gene expression and higher density tiling arrays for ChIP-on-chip assays would permit comprehensive target gene screening. Furthermore, BP1, as a homeoprotein, it may not affect the gene expression for some targets by itself alone, which is probably why the expression of ITGA9 was not changed even though there is clear evidence that BP1 binds to its promoter.
The results of these studies provide new information of regulatory roles of BP1 in breast cancer and potential new targets for early detection and intervention, which call for in depth research using patient samples for biomarker and new drug discovery.
Abbreviations
DLX: Distal-less gene; BP1: Beta Protein 1; ER: Estrogen Receptor; ChIP: Chromatin Immunoprecipitation; EMSA: Electrophoretic Mobility Shift Assay; QPCR: Quantitative Polymerase Chain Reaction; MTT: 3-(4,5-dimethylthiazol-2-yl)-2,5-diphenyl tetrazolium bromide; WGA: Genome-wide Amplification; TSS: Transcription Start Site.
Acknowledgements
This work was supported by NIH grant CA102928 (SWF) and the McCormick Genomics Grant (SWF). The authors would like to thank Dr. Allan L. Goldstein for his support and the technical assistance from the Genomics Core Facility at GW.
Conflict of Interest
The authors have declared that no conflict of interest exists.
References
1. Chase MB, Fu S, Haga SB, Davenport G, Stevenson H, Do K. et al. BP1, a homeodomain-containing isoform of DLX4, represses the beta-globin gene. Mol Cell Biol. 2002;22:2505-2514
2. Fu S, Stevenson H, Strovel JW, Haga SB, Stamberg J, Do K. et al. Distinct functions of two isoforms of a homeobox gene, BP1 and DLX7, in the regulation of the beta-globin gene. Gene. 2001;278:131-139
3. Fu SW, Schwartz A, Stevenson H, Pinzone JJ, Davenport GJ, Orenstein JM. et al. Correlation of expression of BP1, a homeobox gene, with estrogen receptor status in breast cancer. Breast Cancer Res. 2003;5:R82-87
4. Man YG, Fu SW, Schwartz A, Pinzone JJ, Simmens SJ, Berg PE. Expression of BP1, a novel homeobox gene, correlates with breast cancer progression and invasion. Breast Cancer Res Treat. 2005;90:241-247
5. Stevenson HS, Fu SW, Pinzone JJ, Rheey J, Simmens SJ, Berg PE. BP1 transcriptionally activates bcl-2 and inhibits TNFalpha-induced cell death in MCF7 breast cancer cells. Breast Cancer Res. 2007;9:R60
6. Gao H, Falt S, Sandelin A, Gustafsson JA, Dahlman-Wright K. Genome-wide identification of estrogen receptor alpha-binding sites in mouse liver. Mol Endocrinol. 2008;22:10-22
7. Liu XS, Brutlag DL, Liu JS. An algorithm for finding protein-DNA binding sites with applications to chromatin-immunoprecipitation microarray experiments. Nat Biotechnol. 2002;20:835-839
8. Melnikova L, Biryukova I, Kan T, Georgiev P. Long-distance interactions between regulatory elements are suppressed at the end of a terminally deficient chromosome in Drosophila melanogaster. Chromosoma. 2008;117:41-50
9. Sipos L, Gyurkovics H. Long-distance interactions between enhancers and promoters. FEBS J. 2005;272:3253-3259
10. Spirito F, Bossi L. Long-distance effect of downstream transcription on activity of the supercoiling-sensitive leu-500 promoter in a topA mutant of Salmonella typhimurium. J Bacterio. 1996;178:7129-7137
11. O'Geen H, Nicolet CM, Blahnik K, Green R, Farnham PJ. Comparison of sample preparation methods for ChIP-chip assays. BioTechniques. 2006;41:577-580
12. American Cancer Society. http://www.cancer.org/downloads/STT/2008CAFFfinalsecured.pdf
13. Krumlauf R. Hox genes in vertebrate development. Cell. 1994;78:191-201
14. Abate-Shen C. Deregulated homeobox gene expression in cancer: cause or consequence? Nat Rev Cancer. 2002;2:777-785
15. Nunes FD, de Almeida FC, Tucci R, de Sousa SC. Homeobox genes: a molecular link between development and cancer. Pesqui Odontol Bras. 2003;17:94-98
16. van Agthoven T, van Agthoven TL, Portengen H, Foekens JA, Dorssers LC. Ectopic expression of epidermal growth factor receptors induces hormone independence in ZR-75-1 human breast cancer cells. Cancer Res. 1992;52:5082-5088
17. Ford HL, Kabingu EN, Bump EA, Mutter GL, Pardee AB. Abrogation of the G2 cell cycle checkpoint associated with overexpression of HSIX1: a possible mechanism of breast carcinogenesis. Proc Natl Acad Sci U S A. 1998;95:12608-12613
18. Peverali FA, D'Esposito M, Acampora D, Bunone G, Negri M, Faiella A. et al. Expression of HOX homeogenes in human neuroblastoma cell culture lines. Differentiation. 1990;45:61-69
19. Silberstein GB, Van Horn K, Hrabeta-Robinson E, Compton J. Estrogen-triggered delays in mammary gland gene expression during the estrous cycle: evidence for a novel timing system. Journal Endocrinol. 2006;190:225-239
20. Chariot A, Castronovo V. Detection of HOXA1 expression in human breast cancer. Biochem Biophys Res Commun. 1996;222:292-297
21. Chariot A, Moreau L, Senterre G, Sobel ME, Castronovo V. Retinoic acid induces three newly cloned HOXA1 transcripts in MCF7 breast cancer cells. Biochem Biophys Res Commun. 1995;215:713-720
22. Care A, Silvani A, Meccia E, Mattia G, Peschle C, Colombo MP. Transduction of the SkBr3 breast carcinoma cell line with the HOXB7 gene induces bFGF expression, increases cell proliferation and reduces growth factor dependence. Oncogene. 1998;16:3285-3289
23. Boncinelli E. Homeobox genes in development. Adv Neurol. 1999;79:81-94
24. Sakurai D, Tsuchiya N, Yamaguchi A, Okaji Y, Tsuno NH, Kobata T. et al. Crucial role of inhibitor of DNA binding/differentiation in the vascular endothelial growth factor-induced activation and angiogenic processes of human endothelial cells. J Immunol. 2004;173:5801-5809
25. Chaudhary J, Sadler-Riggleman I, Ague JM, Skinner MK. The helix-loop-helix inhibitor of differentiation (ID) proteins induce post-mitotic terminally differentiated Sertoli cells to re-enter the cell cycle and proliferate. Biol Reprod. 2005;72:1205-1217
26. Harper EG, Alvares SM, Carter WG. Wounding activates p38 map kinase and activation transcription factor 3 in leading keratinocytes. J Cell Sci. 2005;118:3471-3485
27. Straume O, Akslen LA. Strong expression of ID1 protein is associated with decreased survival, increased expression of ephrin-A1/EPHA2, and reduced thrombospondin-1 in malignant melanoma. Br J Cancer. 2005;93:933-938
28. Jiang P, Li JH, Luo GQ, Liu J. [Effect of EphA2 protein on the expression of VEGF and MMP9 proteins in HCT116 cells]. Zhong Nan Da Xue Xue Bao Yi Xue Ban. 2007;32:679-683
29. Liu F, Park PJ, Lai W, Maher E, Chakravarti A, Durso L. et al. A genome-wide screen reveals functional gene clusters in the cancer genome and identifies EphA2 as a mitogen in glioblastoma. Cancer Res. 2006;66:10815-10823
30. Nasreen N, Mohammed KA, Antony VB. Silencing the receptor EphA2 suppresses the growth and haptotaxis of malignant mesothelioma cells. Cancer. 2006;107:2425-2435
Author contact
![]() Correspondence to: Sidney W. Fu, M.D., Ph.D., Associate Professor, Director, The Genomics Core Facility, Dept. of Biochemistry and Molecular Biology, and of Surgery, Catharine Birch McCormick Genomics Center, The George Washington University Medical Center, 2300 I Street, N.W. Room 536, Washington, DC 20037. Email: sfuedu; Tel: 202-994-4767 (Office), 202-994-0691 (Lab); Fax: 202-994-2487
Correspondence to: Sidney W. Fu, M.D., Ph.D., Associate Professor, Director, The Genomics Core Facility, Dept. of Biochemistry and Molecular Biology, and of Surgery, Catharine Birch McCormick Genomics Center, The George Washington University Medical Center, 2300 I Street, N.W. Room 536, Washington, DC 20037. Email: sfuedu; Tel: 202-994-4767 (Office), 202-994-0691 (Lab); Fax: 202-994-2487