Impact Factor ISSN: 1449-2288

 Global reach, higher impact
Int J Biol Sci 2009; 5(6):528-542. doi:10.7150/ijbs.5.528 This issue Cite
Research Paper
Discovery of novel genetic networks associated with 19 economically important traits in beef cattle
Zhihua Jiang1, ![]() , Jennifer J. Michal1, Jie Chen1, Tyler F. Daniels1, Tanja Kunej1, Matthew D. Garcia2, Charles T. Gaskins1, Jan R. Busboom1, Leeson J. Alexander3, Raymond W. Wright Jr. 1, Michael D. MacNeil3
, Jennifer J. Michal1, Jie Chen1, Tyler F. Daniels1, Tanja Kunej1, Matthew D. Garcia2, Charles T. Gaskins1, Jan R. Busboom1, Leeson J. Alexander3, Raymond W. Wright Jr. 1, Michael D. MacNeil3
1. Department of Animal Sciences, Washington State University, Pullman, WA 99164-6351, USA;
2. School of Animal Sciences, Louisiana State University, Baton Rouge, LA 70803, USA;
3. USDA-ARS, Fort Keogh Livestock and Range Research Laboratory, Miles City, MT 59301, USA
Received 2009-6-5; Accepted 2009-7-16; Published 2009-7-29
Abstract
Quantitative or complex traits are determined by the combined effects of many loci, and are affected by genetic networks or molecular pathways. In the present study, we genotyped a total of 138 mutations, mainly single nucleotide polymorphisms derived from 71 functional genes on a Wagyu x Limousin reference population. Two hundred forty six F2 animals were measured for 5 carcass, 6 eating quality and 8 fatty acid composition traits. A total of 2,280 single marker-trait association runs with 120 tagged mutations selected based on the HAPLOVIEW analysis revealed 144 significant associations (P < 0.05), but 50 of them were removed from the analysis due to the small number of animals (≤ 9) in one genotype group or absence of one genotype among three genotypes. The remaining 94 single-trait associations were then placed into three groups of quantitative trait modes (QTMs) with additive, dominant and overdominant effects. All significant markers and their QTMs associated with each of these 19 traits were involved in a linear regression model analysis, which confirmed single-gene associations for 4 traits, but revealed two-gene networks for 8 traits and three-gene networks for 5 traits. Such genetic networks involving both genotypes and QTMs resulted in high correlations between predicted and actual values of performance, thus providing evidence that the classical Mendelian principles of inheritance can be applied in understanding genetic complexity of complex phenotypes. Our present study also indicated that carcass, eating quality and fatty acid composition traits rarely share genetic networks. Therefore, marker-assisted selection for improvement of one category of these traits would not interfere with improvement of another.
Keywords: Quantitative traits, quantitative trait modes, genetic networks, beef cattle.
Introduction
The beef industry is a major component of the U.S. agricultural economy. Statistics show that the United States has the largest fed-cattle industry in the world, and is the world's number one producer of beef for domestic and export use (http://www.ers.usda.gov). Basically, cattle are raised in all 50 states and the industry has huge impact on economic development in nearly every county in the nation. Beef is one of the preferred protein sources in American diets and demand continues to grow. However, the U.S. beef industry has also been facing some challenges. For example, the ten greatest quality challenges identified by National Beef Quality Audit of 2005 include insufficient marbling and low quality grades, lack of uniformity in cattle, inadequate meat tenderness, high yield grades, low cutability, heavy carcass weights, injection-site lesion, inadequate flavour, inadequate muscling and excess fat cover (http://www.bifconference.com/bif2006/pdfs/Morgan.pdf). All of these areas need to be addressed by beef producers in order to provide consumers with a high quality, acceptable product.
Eating healthy foods is a popular topic of our everyday life, and doing so aids in the maintenance of a healthy body weight, enhances general wellbeing and reduces the risk of a number of diseases such as obesity, heart disease, stroke, cancer and diabetes. Evidence has shown that a diet high in saturated fats tends to increase blood cholesterol levels while diets high in unsaturated fats tend to lower blood cholesterol levels. Heart diseases are favorably affected by the consumption of certain unsaturated fatty acids because they lower plasma total cholesterol and low-density lipoproteins or “bad” cholesterol levels. Unfortunately, since biohydrogenation occurs in the rumen, beef contains more saturated fatty acids than meat of monogastric animals [1]. Therefore, these challenges require the beef industry to deliver products that meet consumer needs and satisfaction in terms of both nutrition and health.
Wagyu cattle were developed in Japan by crossing native Asian breeds with British and European breeds in the late 1800s. Breeding stock was closed to outside bloodlines in 1910. Generally speaking, meat from Japanese Wagyu contains more intramuscular fat (marbling) and has more unsaturated fat than meat from other breeds of cattle. Specifically, meat from Wagyu contained 4.5% intramuscular fat compared to 3.1% in meat from Limousin cattle and the melting point of Wagyu fat was 40.2oC compared to 37.8oC for fat from Limousin [2]. In addition, Wagyu fat has considerably less saturated and more unsaturated fatty acids resulting in much higher unsaturated/saturated ratios (1.9) compared to fat from other breeds (1.0) [3]. These data indicate that the Japanese Black (Wagyu) has a genetic predisposition to produce lipids with higher unsaturated fat concentrations than other breeds.
Identification and utilization of candidate genes for economically important traits is one of the most important long-term goals to improve production efficiency, product quality and animal health in the United States livestock industry. In the past, three ways were used to choose candidate genes as targets [4]. The physiological approach is to choose genes with known biological functions and actions involved in the development or physiology of the trait of interest. The positional cloning approach considers genes that are located in the neighborhood of previously identified QTL regions. The third approach is the comparative transfer approach, which takes loci where polymorphisms are known to have a phenotypic effect in one species and explores them as candidates for similar variation in other species. Certainly, the current advance of bovine genome sequencing and annotation will further help us select the candidate genes. The objective of the present study is, therefore, to take advantage of bovine gene/genome annotations and various candidate gene selection approaches to discover genetic networks associated with carcass traits, eating quality and fatty acid composition in beef cattle. We hypothesize that these economically important traits or complex phenotypes result from combined effects of many loci. In particular, detection of gene-gene combinations on complex traits would help understand their genetic complexity, thus providing molecular tools for the beef industry to address the challenges they have been facing.
Materials and Methods
Gene selection. All three approaches described above, including the physiological approach, the positional cloning approach and the comparative transfer approach were used to target various gene families for discovery of gene networks associated with economically important traits in beef cattle. A total of 71 genes that had mutations detected and genotyped successfully in our beef reference population (see Animals, Phenotypes and Statistical Analysis) are illustrated in Figure 1. In a broad sense, most of these genes can be classified into five gene families.
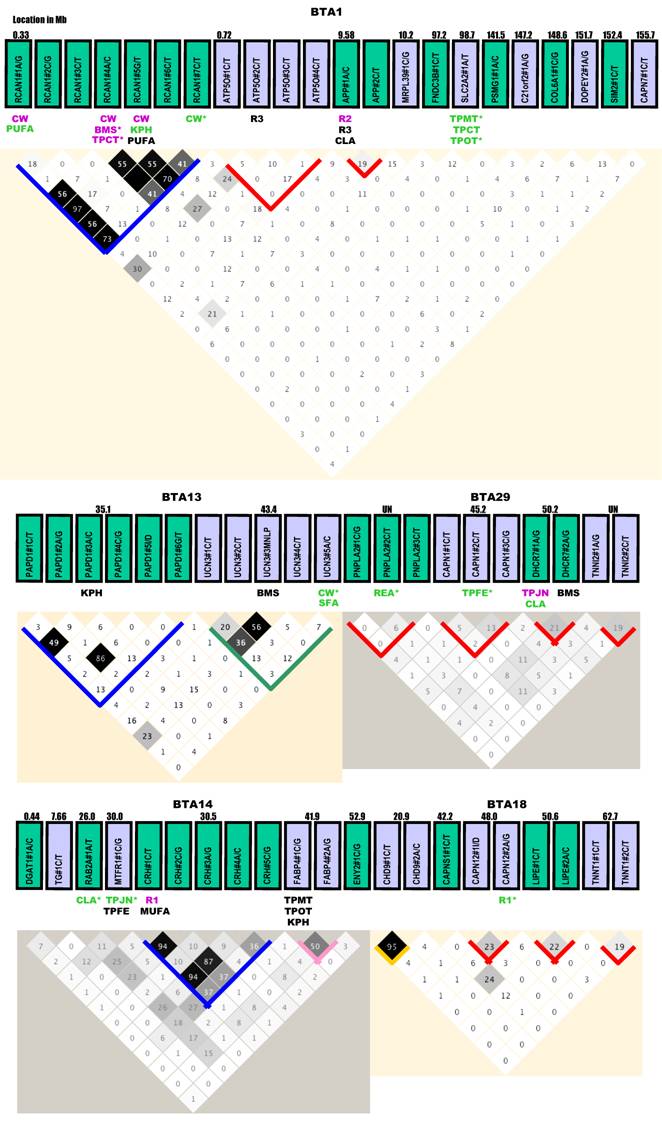
Gene locations, genetic markers, haplotypes and single marker-trait associations with 19 economically important traits in a Wagyu x Limousin reference population. Pairwise linkage disequilibrium relationship for both within-gene (with blocks) and between-gene mutations (without blocks) are illustrated based on r2 measurements. Blue block: r2 ranges from 0% to 100%; Green block: r2 varies from 0% to 80%; Gold block: r2 ≥ 80%; Rose block: r2 varies from 50% to 100%; and Red block: r2 ≤ 40% between different pairs of markers within a gene. Markers with additive, dominant and overdominant QTMs are presented in pink, green and black color, respectively. BMS: beef marbling scores; CHOL: cholesterol/100 g dry meat; CLA: conjugated linoleic acid/100 g dry meat; CW: carcass weight; KPH: percentage of kidney, pelvic and heart fat; MUFA: relative amount of monounsaturated fatty acids; PUFA: relative amount of poly unsaturated fatty acids; Δ9 desaturase activity - R1 = 14:1 to 14:0, R2 = 16:1 to 16:0 and R3 = 18:1 to 18:0; REA: ribeye area; SFA: relative amounts of saturated fatty acids; SFCS: shear force of cooked steak; SFD: subcutaneous fat depth; TPCT: taste panel connective tissue content; TPFE: taste panel flavor evaluation; TPJN: taste panel juiciness; TPMP: taste panel myofibrillar tenderness and TPOP: taste panel overall tenderness rating. Markers with asterisk are those admitted into the genetic networks by the linear regression model analysis.
The first family involves nuclear encoded mitochondrial genes, such as aldehyde dehydrogenase 4 family, member A1 (ALDH4A1), amyloid beta (A4) precursor protein (APP), ATP synthase, H+ transporting, mitochondrial F1 complex, O subunit (ATP5O), BCL2-antagonist/killer 1 (BAK1), chromosome 21 open reading frame 2 (C21orf2), collagen, type VI, alpha 1 (COL6A1), C-reactive protein, pentraxin-related (CRP), enhancer of yellow 2 homolog (Drosophila) (ENY2), fatty acid binding protein 3 (FABP3) [5], fatty acid binding protein 4 (FABP4) [6], mitochondrial fission regulator 1 (MTFR1), mitochondrial ribosomal protein L39 (MRPL39), polymerase (RNA) mitochondrial (DNA directed) (POLRMT), Poly (A) polymerase associated domain containing 1 (PAPD1) [7], RAB2A, member RAS oncogene family (RAB2A), regulator of calcineurin 1 (RCAN1), single-minded homolog 2 (Drosophila) (SIM2), superkiller viralicidic activity 2-like (S. cerevisiae) (SKIV2L), transcription factor A, mitochondrial (TFAM) [8], transcription factor B1, mitochondrial (TFB1M), transcription factor B2, mitochondrial (TFB2M), tumor necrosis factor (TNF superfamily, member 2) (TNF), ubiquinol-cytochrome c reductase core protein I (UQCRC1) [9] and uncoupling protein 1 (UCP1).
The second family is related to the long chain fatty acids uptake gene complex, including solute carrier family 2, member 2 (SLC2A2), solute carrier family 25, member 27 (SLC25A27) and solute carrier family 27, member 1 (SLC27A1), member 2 (SLC27A2) and member 4 (SLC27A4).
The third family deals with the sauvagine/corticotropin-releasing factor/urotensin I family and related families, such as corticotropin releasing hormone (CRH) [10], CRH receptor 1 (CRHR1), CRH receptor 2 (CRHR2) [11], urocortin 3 (UCN3), urotensin 2 (UTS2) and urotensin 2 receptor (UTS2R) [12].
The fourth family targets the lipogenesis/lipolysis enzymes, such as acetyl-Coenzyme A acetyltransferase 2 (ACAT2), acyl-CoA synthetase long-chain family member 5 (ACSL5), 7-dehydrocholesterol reductase (DHCR7), diacylglycerol O-acyltransferase homolog 1 (DGAT1) [5], fibronectin type III domain containing 3B (FNDC3B), 3-hydroxy-3-methylglutaryl-Coenzyme A synthase 1 (soluble) (HMGCS1), 3-hydroxymethyl-3-methylglutaryl-Coenzyme A lyase (HMGCL), lipase, hormone-sensitive (LIPE), patatin-like phospholipase domain containing 2 (PNPLA2), stearoyl-CoA desaturase (delta-9-desaturase) (SCD1) [13] and sterol O-acyltransferase 1 (SOAT1).
The fifth family focuses on calpain/calpasatin or related genes, such as calpain 1 (CAPN1), calpain 3 (CAPN3), calpain 5 (CAPN5), calpain 7 (CAPN7), calpain 8 (CAPN8), calpain 9 (CAPN9), calpain 11 (CAPN11), calpain 12 (CAPN12), calpain 14 (CAPN14), calpain, small subunit 1 (CAPNS1), calpastatin (CAST) [14], dermatopontin (DPT), neuromedin U (NMU), troponin I type 2 (skeletal, fast) (TNNI2) and troponin T type 1 (skeletal, slow) (TNNT1).
In addition, ankyrin repeat and SOCS box-containing 3 (ASB3), chromodomain helicase DNA binding protein 9 (CHD9), dopey family member 2 (DOPEY2), epidermal growth factor receptor pathway substrate 15 (EPS15), growth hormone 1 (GH1), histone cluster 1, H1t (HIST1H1T), leptin (LEP), proteasome (prosome, macropain) assembly chaperone 1 (PSMG1), thyroglobulin (TG) and tRNA nucleotidyl transferase, CCA-adding, 1 (TRNT1) were also investigated in the present study.
Gene annotation, mutation detection and genotyping. A comparative annotation procedure was used to retrieve both cDNA and genomic DNA sequences for the candidate genes described above. We used cDNA sequences of the human orthologs as references for BLAST searches to retrieve the orthologous cDNA sequences against the GenBank database “nr” or the orthologous ESTs sequences against the GenBank database “est_others” with a species option limited to Bos taurus. The cDNA sequences in the “nr” database represent three categories: cDNA sequences derived from a full-length cDNA library, known gene cDNA sequences or annotated cDNA sequences compiled by the GenBank staff. We collected the longest cDNA sequence retrieved from the “nr” database or a cDNA sequence assembled from several ESTs retrieved from the “est_others” database to form a primary cDNA sequence for each cattle gene. This sequence was then used to perform a species-specific BLAST search against the “est_others” database in order to expand the primary sequence to a full-length cDNA sequence. At the end, we used the full-length cDNA sequence to search for genomic DNA contigs in the 7.15X bovine genome sequence database (see the Bovine Genome Resources at NCBI). The cDNA sequences and genomic DNA sequences were aligned to determine the genomic organizations of all genes investigated in the present study.
The online oligonucleotide design tool Primer3 (http://frodo.wi.mit.edu/) was used to design primers for all genes. Primers met the following criteria: 18-25 bp in length, >50% in GC content and optimal Tm of either 60oC or 65oC. We mainly targeted the promoter region and the 3'untranslated region (UTR) of each gene to maximize the chance for mutation detection. The sizes of the amplified products for most amplicons ranged from 400 - 600 bp, which is a sufficient length for accurate sequencing analysis. PCR reactions were performed using 25 ng of bovine genomic DNA as template in a final volume of 10 μL containing 12.5 ng of each primer, 200 μM dNTPs, 1.5 - 3 mM MgCl2, 50 mM KCl, 20 mM Tris-HCl and 0.2U of Platinum Taq polymerase (Invitrogen, Carlsbad, CA). The PCR conditions were carried out as follows: 94oC for 2 min, 32 cycles of 94oC for 30 sec, 61oC for 30 sec and 72oC for 30 sec, followed by a further 5 min extension at 72oC. PCR products were examined by electrophoresis through a 1.5% agarose gel with 1X TBE buffer to determine the quality and quantity for DNA sequencing. Sequencing was performed on ABI 3730 sequencer in the Laboratory for Biotechnology and Bioanalysis (Washington State University). Mutations were identified using six Wagyu-Limousin F1 animals (see animals below) and 138 of them were successfully genotyped on all animals using a Sequenom iPLEX assay service provided by the Children's Hospital Oakland Research Institute, Oakland, California.
Animals, phenotypes and statistical analysis. A Wagyu-Limousin F2 reference population was used in the present study, including 6 F1 bull, 113 F1 dams and 246 F2 progeny. We focused on a total of 19 phenotypic measurements, which can be classified into three categories: carcass measurements, including carcass weight (CW), ribeye area (REA), subcutaneous fat depth (SFD), percentage of kidney, pelvic and heart fat (KPH) and beef marbling scores (BMS); eating quality, including shear force of cooked steak (SFCS), taste panel myofibrillar tenderness (TPMT), taste panel connective tissue (TPCT) content, taste panel overall tenderness (TPOT) rating, taste panel juiciness (TPJN), taste panel flavor evaluation (TPFE); and fatty acid composition including three indexes of Δ9 desaturase activity - R1 = 14:1 to 14:0, R2 = 16:1 to 16:0 and R3 = 18:1 to 18:0, relative amounts of saturated (SFA), monounsaturated (MUFA) and poly unsaturated fatty acids (PUFA), conjugated linoleic acid/100 g dry meat (CLA) and cholesterol/100 g dry meat (CHOL). Development/management of the Wagyu-Limousin reference population and measurement/definition of these phenotypes were described previously [8,15-18].
The HAPLOVIEW program [19] was used to determine the linkage disequilibrium (LD) of 138 markers located on 22 bovine chromosomes, thus leading to selection of tag mutations for association analysis. The association between genotypes and traits was evaluated using the general linear model (GLM) procedure of SPSS (version 16.0) (The Predictive Analytic Company, Chicago, USA). The model was:
yijklm = µ+sexi+yearj+b×age+snpk+sirel+eijklm
where yijklm is phenotypic observation of a quantitative trait for animal m, sexi is the effect of the i-th sex category (i=1,2), yearj is the effect of the j-th harvest year (j=1,2), age is a covariate for age in days of the animal at harvest, snpk represents the effects of each genotype at the k-th SNP locus, and sirel is random effect of the l-th sire producing animal m, and eijklm is a residual term pertaining to animal m. In the model, we assumed that  where
where  is the variance of sire effects, and A is an additive genetic relationship matrix among the sires, and
  where
where  is the residual variance. If the effects of sire, sex, year, or age were not significant (P>0.05) after initial analysis, they were removed from the model for final analysis.
All single marker-trait associations that reached a significance level of P<0.05 were initially included in further analysis. We discarded significant markers when there were 9 or fewer animals in one genotype group or there were only two genotypes rather than three. Based on the pairwise significance tests among three genotypes, we classified the remaining significant associations into three quantitative trait modes (QTMs): 1) additive mode when PAa ≈ (PAA + Paa)/2; 2) dominant mode when PAa ≈ either PAA or Paa; and 3) overdominant mode when PAa > or < both PAA and Paa, where PAa = least square means of heterozygous animals, PAA = least square means of homozygous animals with higher performance and Paa = least square means of homozygous animals with lower performance. We then integrated these markers along with their QTMs into a linear regression analysis using the linear regression procedure (SPSS for Windows, version 16.0) in order to identify gene-gene combinations, i.e., gene-networks related to carcass traits, eating quality and fatty acid composition in beef.
Results
Gene locations, mutations and LD analysis. Based on the current bovine genome assembly (Btau_4.0), all genes are located on Bos taurus autosomes (BTA), but are unevenly distributed (Figure 1). Four chromosomes - BTA6, BTA15, BTA17 and BTA20 each had only one gene, while eight chromosomes - BTA3, BTA4, BTA9, BTA10, BTA13, BTA22, BTA26 and BTA28 each had 2 genes. Three genes were located on each of these four chromosomes - BTA2, BTA7, BTA11 and BTA19. BTA1 had the largest number of genes (12), followed by BTA14 with 7, BTA23 with 6, BTA16 and BTA18 each with 5, and BTA29 with 4, repectively (Figure 1). Four genes - ACAT2, CAPN9, PNPLA2 and TNNI2 are located on BTA9, BTA28, BTA29 and BTA29, respectively, but specific locations on the chromosomes are unknown at this time.
Among a total of 138 genetic polymorphisms genotyped, 134 were single nucleotide polymorphisms (SNPs) and 4 were other types of mutations, such as insertion/deletion (I/D) and multiple nucleotide length polymorphism (MNLP) [20]. These 134 SNPs include 55 C/T transitions, 39 A/G transitions, 15 C/G transversions, 15 A/C transversions, 7 G/T transversions and 3 A/T transversions, respectively (Figure 1). Thirty-six genes each had one marker, while 35 genes each had two or more mutations. At the chromosomal level, the number of mutations ranged from one on BTA17 and BTA20 to 22 mutations on BTA1 (Figure 1).
Haplotype analysis could not be performed on two genes - UCP1 on BTA17 and HMGCS1 on BTA20, because each had only one marker (Figure 1). For the 35 genes that each had two or more markers, LD relationship was estimated between any pair of within-gene markers. Generally speaking, the results can be roughly classified into five categories (Figure 1). CRH, CRHR2, PAPD1, RCAN1, TNF and UQCRC1 genes belong to the most variable LD group. With 4 - 7 mutations genotyped in each of these six genes, the r2 value between any pair of within-gene markers ranged from as low as 0% to as high as 80 - 100% (highlighted in blocks with a blue color). The highly variable LD group includes only two genes: CAPN5 and UCN3 with a r2 value of 0% to 50 - 80% (highlighted in blocks with a sea green color). The complete LD group involves APP, ASB3, ATP5O, CRP, SLC27A1, TFB1M and UTS2R with a r2 value of ≥95% between any pair of markers within a gene (highlighted in blocks with a gold color). Four genes - FABP4, POLRMT, SCD1 and TFAM had a r2 value of 50% - 100% for LD relationships between any pair of markers examined, which can be designated as a high LD group (highlighted in blocks with a rose color). However, for the remaining 16 genes - APP, ASB3, ATP5O, CAPN1, CAPN11, CAPN12, CRP, DHCR7, HIST1H1C, LIPE, PNPLA2, SLC27A1, TFB1M, TNNI2, TNNT1 and UTS2R, the within-gene markers apparently segregated in the reference population due to low r2 values (less than 40%) (highlighted in blocks with a red color).
Overall, few high LD relationships exist between any pair of markers derived from different genes. Only five pairs of between-gene markers reached a r2 value of ≥30% and they are RCAN1#1A/G-ATP5O#2C/T (30%) on BTA1, ACAT2#1A/G-TFB1M#G/T (38%) on BTA9, CRHR1#1A/G-UTS2R#1C/T (33%) on BTA19, SLC25A27#1C/T-TNF#1A/G or TNF#3A/G or TNF#4C/T (36%) (as these three TNF markers are completely linked) on BTA23 and TNF#1A/G or TNF#3A/G or TNF#4C/T - HIST1H1C#1A/G (48% - 50%) on BTA23, respectively (Figure 1). Based on the current bovine genome assembly (Btau_4.0), the physical distance is 0.39 Mb for the pair on BTA1, 4.4 Mb for the pair on BTA19, 6.9 Mb for the first pair on BTA23 and 4.5 Mb for the second pair on BTA23. The distance between ACAT2#1A/G and TFB1B#2G/T is unknown because the former gene is unasigned to a specific location on BTA19. However, based on their LD relationship, these genes should not be far apart on the bovine chromosome. On human chromosome 6, these two genes are just 4.4 Mb apart. Therefore, LD analysis on a pair of markers derived from different genes might provide information on their chromosome assignments.
Single marker-trait assoctions. Haplotype analysis described above also helped us select a total of 120 tagged markers for association analysis. As such, the GLM procedure was performed on 19 phenoytpes described above, resulting in a total of 2,280 single marker-trait association runs. Among them, 144 associations reached a significance level at P < 0.05, but 50 were removed from the final analysis due to the small number of animals (≤ 9) in one genotype group or absence of one genotype among three genotypes. The remaining 94 significant associations are shown in Figure 1, including 6 for CW, 4 for REA, 5 for SFD, 5 for KPH, 6 for BMS, 2 for SFCS, 6 for TPMT, 3 for TPCT, 5 for TPOT, 5 for TPJN, 4 for TPFE, 5 for R1, 2 for R2, 8 for R3, 9 for SFA, 7 for MUFA, 3 for PUFA, 6 for CLA and 3 for CHOL.
These 94 significant associations involved 46 markers from 35 genes, including 18 markers associated with one trait, 13 with two traits, 12 with three phenotypes, one with 4 traits and 2 with five traits, respectively (Figure 1). The QTM analysis further placed them into three groups: 32 with additive, 33 with dominant and 29 with overdominant effects. Interestingly enough, each group accounts for one-third of the total associations (χ2 = 0.194, P = 0.9078). When a marker is associated with multiple phenotypes, it might have the same or different QTMs on different traits. For example, RCAN1#4A/C had an additive effect on both CW and TPCT; TFB1M#1C/G was dominantly associated with TPMT, TPOT and TPJN; and ASB3#2C/T showed an overdominant effect on three traits - R3, SFA and MUFA. However, RCAN1#6C/T affected different traits with the different modes - additive on CW, dominant on KPH and overdominant on PUFA (Figure 1).
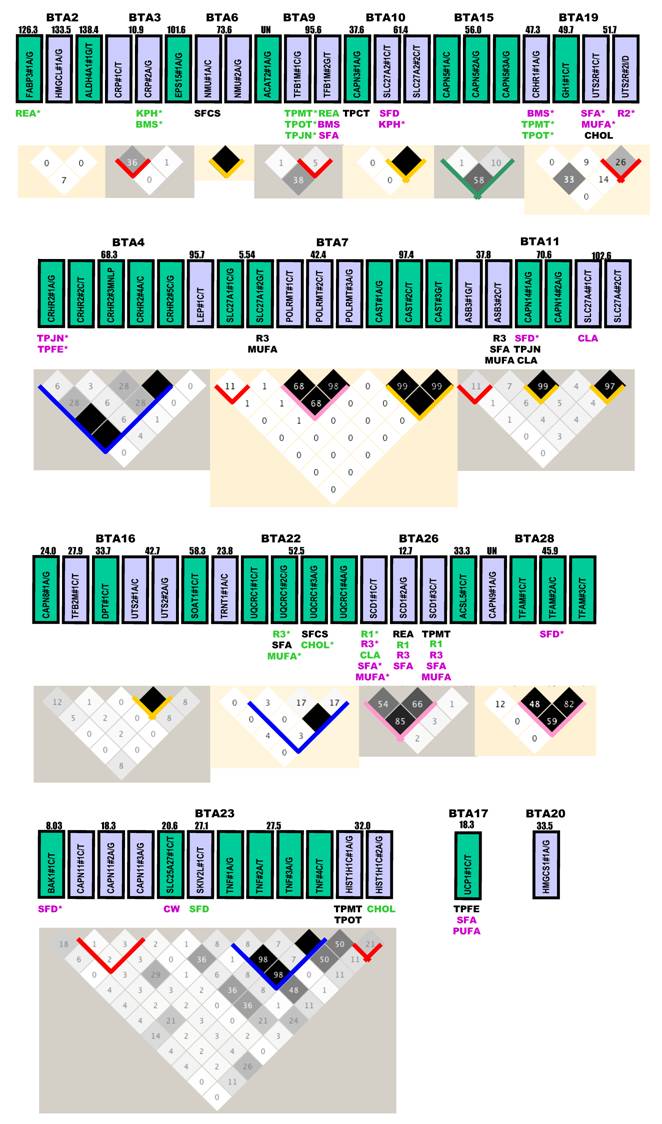
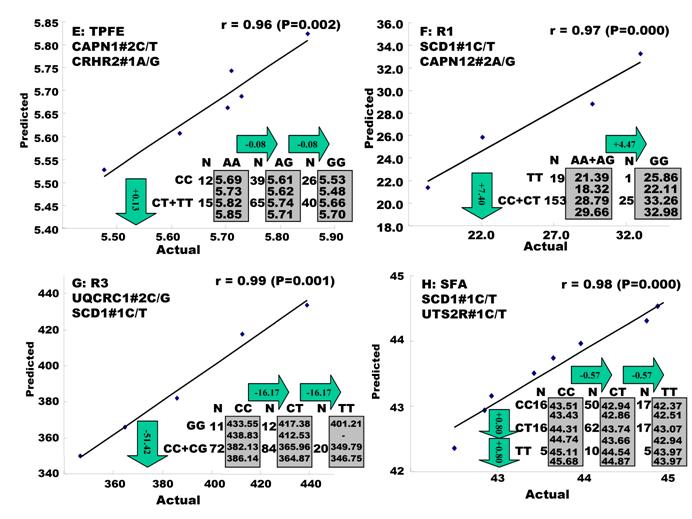
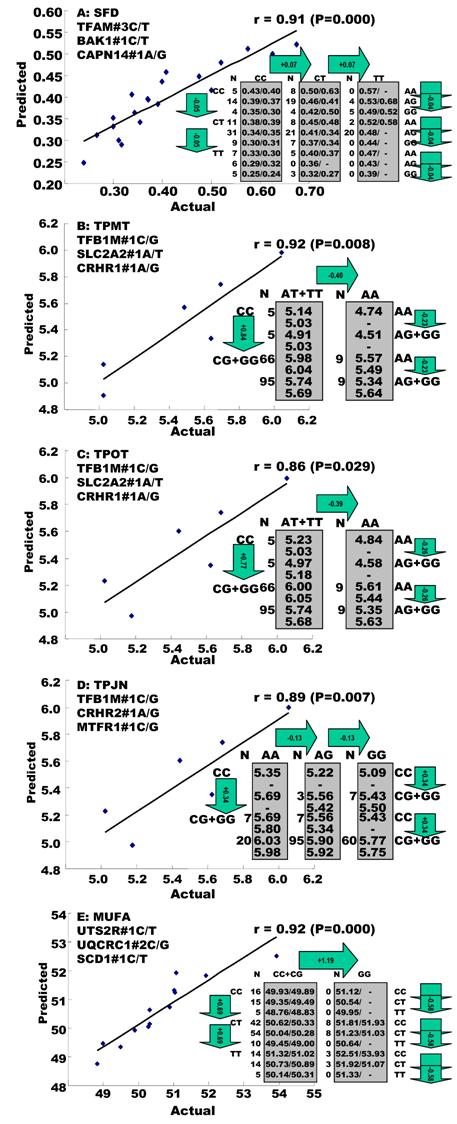
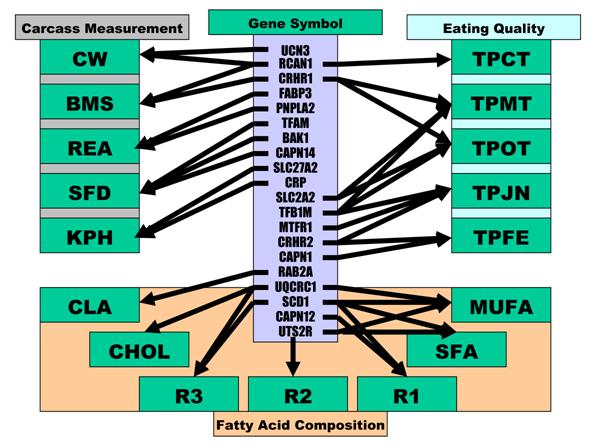
Regression analysis of multiple markers on single trait. Multiple significant markers and their QTMs associated with each single trait were involved in a linear regression model analysis to determine gene combinations or networks for a specific trait. The regression analysis confirmed single-gene associations for TPCT, R2, CLA and CHOL (Figure 2), but revealed two-gene networks for CW, REA, KPH, BMS, TPFE, R1, R3 and SFA (Figure 3) and three-gene networks for SFD, TPMT, TPOT, TPJN and MUFA (Figure 4), respectively. In fact, all 17 gene associations/networks were orchestrated by a total of 20 genes, including BAK1, CAPN1, CAPN12, CAPN14, CRHR1, CRHR2, CRP, FABP3, MTFR1, PNPLA2, RAB2A, RCAN1, SCD1, SLC2A2, SLC27A2, TFAM, TFB1M, UCN3, UTS2R and UQCRC1 (Figure 5). Several markers significantly affected both SFCS and PUFA, but gene networks were not identified by regression analysis.
Single marker-trait associations confirmed by the linear regression analysis. A: RCAN1 on TPCT; B: UTS2R on R2; C: RAB2A on CLA and D: UQCRC1 on CHOL.
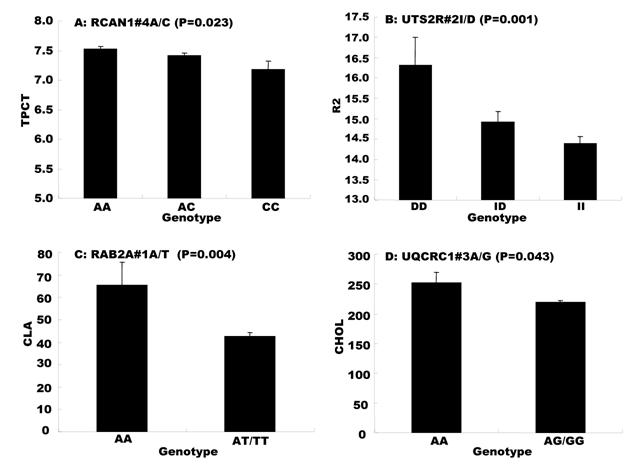
Genetic networks with two genes established by the linear regression analysis for economically important traits in beef cattle. The numbers in arrows represent substitution effects of one type of genotypes or allele for another one. Each combined genotype(s) between different genes has two means of performance: predicted (top) and actual (bottom). “-“ means no animals were identified with the combined genotype (s) in the population.
Genetic networks with three genes established by the linear regression analysis for economically important traits in beef cattle. The numbers in arrows represent substitution effects of one type of genotypes or allele for another one. Each combined genotype(s) among different genes has two means of performance: predicted (top or left side) and actual (bottom or right side). “-“ means no animals were identified with the combined genotype (s) in the population.
Phenotypic classifications and their associated gene networks.
In the single-gene associations, RCAN1#4A/C on BTA1 had an additive effect on TPCT. Similarly, UTS2R#2I/D on BTA19 had an additive effect on R2. In comparison, RAB2A#1A/T on BTA14 showed a significant impact on CLA and UQCRC1#3A/G on BTA22 significantly affected CLA and CHOL, respectively in a dominant mode (Figure 2). As for the two- and three-gene networks, two networks for SFD and SFA involved additive-additive combinations only, five networks for CW, REA, TPMT, TPOT and R1 had dominant-dominant combinations only, while six networks for KPH, BMS, TPJN, TPFE, R3 and MUFA showed additive-dominant combinations between/among genes in the networks (Figures 3 - 4). These multiple-gene networks determined by regression analysis recognize both genotype and QTM combinations between/among different genes on traits, resulting in high correlations (0.86 - 0.99, P<0.05) between predicted and actual values of performance (Figures 3 - 4).
As indicated above, these 17 economically important traits in beef cattle can be classified into three categories: carcass measurements, eating quality and fatty acid composition. As summarized in Figure 5, ten genes were involved in carcass measurements: UCN3 and RCAN1 for CW, FABP3 and PNPLA2 for REA, CRP and SLC27A2 for KPH, CRP and CRHR1 for BMS and TFAM, BAK1 and CAPN14 for SFD. Only RCAN1 is common to two traits: CW and BMS. However, among seven genes associated with the gene networks for eating quality, TFB1M affected three traits - TPMT, TPOT and TPJN; both SLC2A2 and CRHR1 played an important role in two traits - TPMT and TPOT; CRHR2 was also involved in two traits - TPJN and TPFE, and RCAN1, MTFR1 and CAPN1 each affected one trait only, i.e., TPCT, TPJN and TPFE (Figure 5). Seven traits related to fatty acid composition were affected by gene-networks, composed of only five genes. SCD1 was a critical deteminant for R1, R3, SFA and MUFA; UTS2R contributed to R2, SFA and MUFA; and UQCRC1 significantly impacted R3, MUFA and CHOL. CAPN12 influenced R1, while RAB2A affected CLA (Figure 5). Only two genes affected traits in different phenotype categories. Specifically. different mutations in RCAN1 affected both CW in carcass measurements and TPCT in eating quality, while the same mutation in CRHR1 was associated with BMS in carcass measurements and TPMT and TPOT in eating quality (Figure 1).
Discussion
Understanding the molecular basis of quantitative genetic variation is a principal goal for biomedicine in human [21] and genetic improvement in agriculture species [22]. However, identification of the candidate genes that are responsible for variation in continuous traits or quantitative traits has been a challenge in modern genetics. In the present study, we took advantage of the bovine genome sequencing, whole genome assembly and protein coding gene annotation by targeting several gene families for candidate selection. Among a total of 71 genes investigated, single marker-trait association analysis revealed 35 genes, while the multiple marker-trait regression analysis further confirmed 20 genes that significantly affect carcass measurements, eating quality and fatty acid composition in a Wagyu x Limousin F2 reference population. Therefore, our gene family-based approach is a very powerful means of optimizing the selection of candidate genes, thus facilitating delineation of genetic variation that underlies complex phenotypes [23].
More importantly, our gene family-based candidate approach might help overcome some QTL mapping drawbacks faced by the conventional genome scan approach, whole genome association study and expression QTL detection. Typically, the conventional genome scan approach uses relatively few markers, thus resulting in low resolution of QTL maps, which might leave many QTL uncovered or missed. For example, Alexander and coworkers [15] used the same Wagyu x Limousin cross for a whole-genome scan to identify QTL affecting palatability and fatty acid composition of beef. The authors found seven QTL on five chromosomes for these phenotypes, but none of these QTL regions can be linked to genes encoding major enzymes involved in fatty acid metabolism, such as fatty acid synthase (FASN), acetyl-CoA carboxylase alpha (ACACA), solute carrier family 2 (facilitated glucose transporter) member 4 (SLC2A4), stearoyl-CoA desaturase (SCD) and genes encoding the subunits of fatty acid elongase. However, in the present study we targeted three SNPs in the bovine SCD1 gene and found it is indeed involved in at least four gene networks associated with fatty acid composition, such as R1, R2, SFA and MUFA (Figure 5).
The currently developed BovineSNP50 BeadChip consists of more than 50K evenly spaced SNPs identified in the bovine genome. No doubt, such a SNP chip provides an important resource and tool for high-resolution studies of differences between breeds and for relating associated traits to the genome. Recently, a subset of these SNPs was genotyped on a total of 1,546 Holstein Friesian bulls for LD analysis [24]. Interestingly, the authors found that for association mapping in Holstein-Friesian cattle, at least one SNP is required for each 40 Kb. This means that 75,000 SNPs would be required for low power association mapping, while for a high power association study, up to 300,000 SNPs are needed [24]. Our experience here shows that it is relatively easy to increase the marker density in a particular genome region by targeting members of gene families. These markers can also be put in a high throughput format for genotyping. We found that markers within a gene might show a wide range of LD. In addition, the LD was rarely extended to any neighboring genes; even though their physical distance is just 0.39 Mb apart, for example, between RCAN1#1A/G-ATP5O#2C/G on BTA1 (Figure 1). Therefore, a gene family-based candidate approach would add value to the chip-based whole genome association studies by increasing marker density in a particular genome region, which would help understand gene networks and their associative effects on economically important traits of interest.
Evidence has shown that variants affecting gene expression (expression QTL, eQTL) have a substantial role in understanding genetic basis of complex phenotypes [25]. The goal of eQTL is to identify variation within a gene ('cis-acting') or elsewhere in the genome ('trans-acting') that causes expression differences [26]. However, this process requires a combination of genomic experiments with expression profiling, which is usually costly for a laboratory to carry out on a large reference population. In addition, the integration of QTL studies with gene expression profiles can be a challenge too, because many genes could be differentially expressed in a QTL region that spans several tens of centiMorgans and harbors hundreds of genes. In the present study, we targeted non-coding regions, such as promoter, 5' and 3' untranslated regions of genes for mutation detections, which were used for their networks associated with different complex traits. Therefore, these mutations involved in the gene networks might well represent the quantitative heritable variation potentially related to the cis- and trans-acting regulatory factors, thus providing a foundation to pursue e-QTL studies for these complex phenotypes.
The linear regression procedure showed several unique features in construction of gene networks associated with quantitative traits. First, the procedure was able to determine a leading marker within a gene for its association with a particular trait of interest. For example, single marker-trait association identified four SNPs in the RCAN1 gene significantly associated with CW, but only one was identified by the linear regression procedure for the gene network (Figures 1 and 3). The same case was also seen with markers in the SCD1 gene (Figures 1 and 4). Second, none of the overdominant markers significantly influenced any gene networks. Practically, overdominant effects are rarely used in a selection program. Third, the linear regression procedure allowed the integration of QTMs in the gene networks, which improves the correlation between the predicted and actual network values. For example, when only additive effects were considered for both UCN3 and RCAN1 on CW, the correlation coefficient was only 0.86 (data not shown). However, when the dominant effects were included in the linear regression model for both genes, the correlation increased to 0.98 (P=0.000) (Figure 3).
Among 20 genes involved in gene-networks associated with 17 phenotypic measurements, 10 had pleiotropic effects because each of them influences multiple phenotypic traits. Some of these pleiotropic effects seem obvious when one measurement is related to another measurement. For example, TPMT and TPOT, subjective measures of myofibrillar tenderness and overall tenderness, which are highly related, were influenced by the same gene network comprised of CRHR1, SLC2A2 and TFB1M genes. R1, R2 and R3 are calculated based on fatty acid composition, which are basic components of SFA and MUFA in total, so it is not surprising that three genes - SCD1, UQCRC1 and UTS2R were associated with 3 to 4 of these traits (Figure 5). It is understandable that RCAN1 had a pleiotropic effect on both CW and BMS because a previous study in humans described an association of the chromosome region with overweight and obese [27]. As well, the pleiotropic effect of CRHR1 on BMS, TPMT and TPOT might be due to the fact that BMS acounts for ~20% of the variation in beef tenderness [28]. Therefore, CRHR1 may be the first gene described that is related to both meat marbling and tenderness. The pleiotropic effect of RCAN1 on CW, BMS and TPCT as well as UTS2R on R2, SFA and MUFA resulted from different SNPs, indicating that one gene might be involved in different pathways through its different cis-acting mechanisms. However, how TFB1M affects tenderness and juiciness and how CRHR2 impacts both juiciness and meat flavor remains unknown. In particular, the chemistry underlying beef flavor is complex, with an excess of 140 components identified in cooked beef volatiles [29].
It appears that the nuclear-encoded mitochondrial genes are promising candidates to aid in understanding of economically important traits in beef cattle. Among a total of 17 traits influenced by gene networks in the present study, only four - TPFE, R1, R2 and SFA were not affected by nuclear-encoded mitochondrial genes. In other words, nine nuclear-encoded mitochondrial genes: BAK1, CRP, FABP3, MTFR1, RAB2A, RCAN1, TFAM, TFB1M and UQCRC1 participated in 13 gene networks (Figure 5). Both BAK1 and CRP function to induce apoptosis [30-31]. In particular, BAK1 plays a key role in blocking mitochondrial fusion to induce fragmentation, contributing to mitochondrial injury. FABP3 is confined to the mitochondrial matrix [32]. In addition to its participation in the uptake, intracellular metabolism and/or transport of long-chain fatty acids, FABP3 is also responsible in the modulation of cell growth and proliferation. MTFR1 promotes mitochondrial fission with a sequence specific mechanism [33]. RAB2A is a member of the Rab protein family and is involved in the maturation of pre-Golgi intermediates [34]. RCAN1 is located in the minimal candidate region for the Down syndrome phenotype (DSCR1). The protein encoded by this gene interacts with calcineurin A and inhibits calcineurin-dependent signaling pathways, possibly affecting central nervous system development. The Drosophila homolog of DSCR1 was found to be a regulator of mitochondrial function [35]. TFAM and TFB1M are members of the basal mtDNA transcription machinery that plays an essential role in maintenance and biogenesis of mtDNA [36]. UQCRC1 encodes a subunit of mitochondrial respiratory complex III, which operates through a Q-cycle mechanism that couples electron transfer to generation of the proton gradient that drives ATP synthesis [37].
Tenderness is an important aspect of beef palatability that contributes significantly to consumer satisfaction. Basically, consumers want tender beef and are willing to pay for it. For example, among 1,036 consumers surveyed, 89% of them indicated that they would definitely or probably buy a product described as Tender Select, i.e., the only steak guaranteed tender and lean [38]. Warner-Bratzler shear force is accepted as an accurate method of measuring the tenderness of meat [39]. To date, several genetic markers have been developed at CAST and CAPN1 for association with the Warner-Bratzler shear force and thus used for improvement of beef tenderness [40-41]. Unfortunately, we did not observe any significant associations of these two genes with either shear force of cooked steak or taste panel tenderness rating in the Wagyu x Limousin population. Instead, we found a three-gene network with CRHR1, SLCA2 and TFB1M that affected both TPMT and TPOT (Figures 4 and 5), but not SFCS. These data indicate that genetic background might differ between the mechanical and taste assessments of meat tenderness. Although the Warner-Bratzler shear force and tenderness sensory rating are highly correlated (for example, r = -0.72), Destefanis and colleagues [42] found that consumers have difficulties in discriminating category 1 Warner-Bratzler shear (WBs > 62.59 N) from category 2 (WBs: 52.78-62.59 N) and a greater inclination to distinguish category 5 (WBs < 32.96 N). Therefore, which assessment: mechanical or taste sensory should be used for improving meat tenderness need to be further weighted or adjusted in order to meet consumer satisfaction.
Overall, our present study indicated that three categories of phenotypes - carcass measurements, eating quality and fatty acid composition are not genetically well connected as they do not share a lot of gene networks (Figure 5). Exceptions are only two: RCAN1 is associated with CW, BMS and TPCT, while CRHR1 is involved in BMS and two phenotypes of tenderness (TPMT and TPOT). Therefore, marker-assisted selection for improvement of one category of these traits would not interfere with improvement of another. The same principal can be also applied to five traits - CW, REA, SFD, KPH and BMS in carcass measurement as only RCAN1 links both CW and BMS (Figure 5). It has been well known that traditional selection with low selection intensity and long generation interval in beef cattle has resulted in very little improvement in such economically important traits. Therefore, our present work provides a unique set of closely associated markers for genomic improvement of carcass, meat quality and healthful products in beef cattle.
Conflict of interests
The authors have declared that no conflict of interest exists.
Acknowledgements
This work was supported by Merial Ltd. Animal Genomics Research Fund to Z.J. This activity was also funded, in part, with an Emerging Research Issues Internal Competitive Grant from the Washington State University, College of Agricultural, Human, and Natural Resource Sciences, Agricultural Research Center to Z.J and R.W.W.
References
1. De Smet S, Raes K, Demeyer D. Meat fatty acid composition as affected by fatness and genetic factors: a review. Anim. Res. 2004;53:81-98
2. Pitchford WS, Deland MP, Siebert BD, Malau-Aduli AE, Bottema CD. Genetic variation in fatness and fatty acid composition of crossbred cattle. J Anim Sci. 2002;80:2825-2832
3. Yang A, Larsen TW, Powell VH, Tume RK. A comparison of fat composition of Japanese and long-term grain-fed Australian steers. Meat Sci. 1999;51:1-9
4. Jiang Z, Pappu SS, Rothschild MF. Hitting the jackpot twice: identifying and patenting gene tests related to muscle lipid accumulation for meat quality in animals and type 2 diabetes/obesity in humans. Recent Pat DNA Gene Seq. 2007;1:100-111
5. Wu X-L, MacNeil MD, De S. et al. Evaluation of candidate gene effects for beef backfat via Bayesian model selection. Genetica. 2005;125:103-113
6. Michal JJ, Zhang ZW, Gaskins CT, Jiang Z. The bovine fatty acid binding protein 4 gene is significantly associated with marbling and subcutaneous fat depth in Wagyu x Limousin F2 crosses. Anim Genet. 2006;37:400-402
7. Xiao Q, Wu X-L, Michal JJ. et al. A novel nuclear-encoded mitochondrial poly(A) polymerase PAPD1 is a potential candidate gene for the extreme obesity related phenotypes in mammals. Int J Biol Sci. 2006;2:171-178
8. Jiang Z, Kunej T, Michal JJ. et al. Significant associations of the mitochondrial transcription factor A promoter polymorphisms with marbling and subcutaneous fat depth in Wagyu x Limousin F2 crosses. Biochem Biophys Res Commun. 2005;334:516-523
9. Kunej T, Wang Z, Michal JJ, Daniels TF, Magnuson NS, Jiang Z. Functional UQCRC1 polymorphisms affect promoter activity and body lipid accumulation. Obesity. 2007;15:2896-901
10. Wibowo TA, Michal JJ, Jiang Z. The corticotropin releasing hormone is a promising candidate gene for marbling and subcutaneous fat depth in beef cattle. Genome. 2007;50:939-945
11. Jiang Z, Michal JJ, Williams GA, Daniels TF, Kunej T. Cross species association examination of UCN3 and CRHR2 as potential pharmacological targets for antiobesity drugs. PloS ONE. 2006;1:e80
12. Jiang Z, Michal JJ, Tobey DJ, Wang Z, MacNeil MD, Magnuson NS. 2008. Comparative understanding of UTS2 and UTS2R genes for their involvement in type 2 diabetes mellitus. Int J Biol Sci. 2008;4:96-102
13. Jiang Z, Michal JJ, Tobey DJ, Daniels TF, Rule DC, MacNeil MD. Significant associations of stearoyl-CoA desaturase (SCD1) gene with fat deposition and composition in skeletal muscle. Int J Biol Sci. 2008;4:345- 351
14. Garcia MD, Michal JJ, Gaskins CT. et al. Significant associations of the calpastatin gene with fertility and longevity in dairy cattle. Anim Genet. 2006;37:304-305
15. Alexander LJ, Macneil MD, Geary TW, Snelling WM, Rule DC, Scanga JA. Quantitative trait loci with additive effects on palatability and fatty acid composition of meat in a Wagyu-Limousin F2 population. Anim Genet. 2007;38:506-513
16. Alexander LJ, Geary TW, Snelling WM, MacNeil MD. Quantitative trait loci with additive effects on growth and carcass traits in a Wagyu-Limousin F-2 population. Anim. Genet. 2007;38:413-416
17. Alexander LJ, Kuehn LA, Smith TPL. et al. 2009. A Limousin specific myostatin allele affects longissimus muscle area and fatty acid profiles in a Wagyu-Limousin F-2 population. J Anim Sci. 2009;87:1576-1581
18. Tshipuliso NOM, Alexander LJ, Geary TW. et al. Mapping QTL for fatty acid composition that segregates between the Japanese Black and Limousin cattle breeds. S Afr J Anim SciI. 2009;38:126-130
19. Barrett JC, Fry B, Maller J, Daly MJ. Haploview: analysis and visualization of LD and haplotype maps. Bioinformatics. 2005;21:263-265
20. Jiang Z, Wang Z, Kunej T, Williams GA, Michal JJ, Wu XL, Magnuson NS. A novel type of sequence variation: multiple-nucleotide length polymorphisms discovered in the bovine genome. Genetics. 2007;176:403-407
21. Flint J, Mott R. Finding the molecular basis of quantitative traits: successes and pitfalls. Nat Rev Genet. 2001;2:437-45
22. Haley CS, Visscher PM. Strategies to utilize marker-quantitative trait loci associations. J Dairy Sci. 1998;81(Suppl 2):85-97
23. Rohrwasser A, Lott P, Weiss RB, Lalouel JM. From genetics to mechanism of disease liability. Adv Genet. 2008;60:701-726
24. Khatkar MS, Zenger KR, Hobbs M. et al. A primary assembly of a bovine haplotype block map based on a 15,036-single-nucleotide polymorphism panel genotyped in holstein-friesian cattle. Genetics. 2007;176:763-772
25. Farrall M. Quantitative genetic variation: a post-modern view. Hum Mol Genet. 2004;13:R1-7
26. de Koning DJ, Carlborg O, Haley CS. The genetic dissection of immune response using gene-expression studies and genome mapping. Vet Immunol Immunopathol. 2005;105:343-352
27. Bell AJ, Bhate MS. Prevalence of overweight and obesity in Down's syndrome and other mentally handicapped adults living in the community. J Intellect Disabil Res. 1992;36:359-364
28. Dikeman ME, Pollak EJ, Zhang Z, Moser DW, Gill CA, Dressler EA. Phenotypic ranges and relationships among carcass and meat palatability traits for fourteen cattle breeds, and heritabilities and expected progeny differences for Warner-Bratzler shear force in three beef cattle breeds. J Anim Sci. 2005;83:2461-7
29. Moloney AP, Mooney MT, Kerry JP, Troy DJ. Producing tender and flavoursome beef with enhanced nutritional characteristics. Proc Nutr Soc. 2001;60:221-9
30. Brooks C, Dong Z. Regulation of mitochondrial morphological dynamics during apoptosis by Bcl-2 family proteins: a key in Bak? Cell Cycle. 2007;6:3043-3047
31. Yang J, Wang J, Zhu S, Chen X, Wu H, Yang D, Zhang J. C-reactive protein augments hypoxia-induced apoptosis through mitochondrion-dependent pathway in cardiac myocytes. Mol Cell Biochem. 2008;310:215-226
32. Spener F, Unterberg C, Börchers T, Grosse R. Characteristics of fatty acid-binding proteins and their relation to mammary-derived growth inhibitor. Mol Cell Biochem. 1990;98:57-68
33. Tonachini L, Monticone M, Puri C. et al. Chondrocyte protein with a poly-proline region (CHPPR) is a novel mitochondrial protein and promotes mitochondrial fission. J Cell Physiol. 2004;201:470-482
34. Tisdale EJ, Balch WE. 1996. Rab2 is essential for the maturation of pre-Golgi intermediates. J Biol Chem. 1998;271:29372-29379
35. Chang KT, Min KT. Drosophila melanogaster homolog of Down syndrome critical region 1 is critical for mitochondrial function. Nat Neurosci. 2005;8:1577-85
36. Clayton DA. Replication and transcription of vertebrate mitochondrial DNA. Annu Rev Cell Biol. 1991;7:453-478
37. Iwata S, Lee JW, Okada K. et al. Complete structure of the 11-subunit bovine mitochondrial cytochrome bc1 complex. Science. 1998;281:64-71
38. Shackelford SD, Wheeler TL, Meade MK, Reagan JO, Byrnes BL, Koohmaraie M. Consumer impressions of Tender Select beef. J Anim Sci. 2001;79:2605-2614
39. Culioli J. Meat tenderness: Mechanical Assessment. In: (ed.) Ouali A, DeMeyer D.I, Smulders F.J.M. Expression of Tissue Proteinases and Regulation of Protein Degradation as Related to Meat Quality. The Netherlands: ECCEAMST, Utrecht. 1995:239-263
40. Schenkel FS, Miller SP, Jiang Z. et al. Association of a single nucleotide polymorphism in the calpastatin gene with carcass and meat quality traits of beef cattle. J Anim Sci. 2006;84:291-299
41. Casas E, White SN, Wheeler TL. et al. Effects of calpastatin and micro-calpain markers in beef cattle on tenderness traits. J Anim Sci. 2006;84:520-525
42. Destefanis G, Brugiapaglia A, Barge MT, Dal Molin E. Relationship between beef consumer tenderness perception and Warner-Bratzler shear force. Meat Sci. 2008;78:153-156
Author contact
![]() Correspondence to: Dr. Zhihua Jiang, Department of Animal Sciences, Washington State University, Pullman, WA 99164 - 6351. Tel: +509 335 8761; Fax: +509 335 4246; E-mail: jiangzedu
Correspondence to: Dr. Zhihua Jiang, Department of Animal Sciences, Washington State University, Pullman, WA 99164 - 6351. Tel: +509 335 8761; Fax: +509 335 4246; E-mail: jiangzedu