Impact Factor ISSN: 1449-2288

 Global reach, higher impact
Int J Biol Sci 2010; 6(4):382-395. doi:10.7150/ijbs.6.382 This issue Cite
Research Paper
E2F-1 binding affinity for pRb is not the only determinant of the E2F-1 activity
Fikret Sahin1, 2, ![]() , Todd L. Sladek1, 3
, Todd L. Sladek1, 3
1. Department of Microbiology and Immunology, Finch University of Health Sciences/Chicago Medical School (now Rosalind Franklin University), 3333 Green Bay Road, North Chicago, Illinois 60064-3095, USA
2. Current address: Microbiology Department, School of Medicine, Ankara University, Sihhiye-Ankara, Turkey
3. Current address: 3802 Sagamore Drive, Greensboro, NC 27410, USA
Received 2010-4-12; Accepted 2010-7-2; Published 2010-7-4
Abstract
E2F-1 is the major cellular target of pRB and is regulated by pRB during cell proliferation. Interaction between pRB and E2F-1 is dependent on the phosphorylation status of pRB. Despite the fact that E2F-1 and pRB have antagonistic activities when they are overexpressed, the role of the E2F-1-pRB interaction in cell growth largely remains unknown. Ideally, it would be better to study the properties of a pRB mutant that fails to bind to E2F, but retains all other activities. To date, no pRB mutation has been characterized in sufficient detail to show that it specifically eliminates E2F binding but leaves other interactions intact. An alternative approach to this issue is to ask whether mutations that change E2F proteins binding affinity to pRB are sufficient to change cell growth in aspect of cell cycle and tumor formation. Therefore, we used the E2F-1 mutants including E2F-1/S332-7A, E2F-1/S375A, E2F-1/S403A, E2F-1/Y411A and E2F-1/L132Q that have different binding affinities for pRB to better understand the roles of the E2F-1 phosphorylation and E2F-1-pRB interaction in the cell cycle, as well as in transformation and gene expression. Data presented in this study suggests that in vivo phosphorylation at amino acids 332-337, 375 and 403 is important for the E2F-1 and pRB interaction in vivo. However, although E2F-1 mutants 332-7, 375 and 403 showed similar binding affinity to pRB, they showed different characteristics in transformation efficiency, G0 accumulation, and target gene experiments.
Keywords: E2F-1, Rb, Cell cycle, cmyc, dhfr, TK, cdc2
1. Introduction
The E2F family of transcription factors play a critical role in cell proliferation control [1, 2]. pRB was defined as the major cellular target of and revealed the regulation of E2F activity [3, 4]. Studies showed that E2F binds to the pocket domain of pRB [5]. The pRB-binding domain on the E2F-1 molecule is located at the C-terminus and is close to the transactivation domain. The C-terminal domain is required for efficient pRB/E2F interaction and its functional consequence [6]. The functional consequence of the pRB-E2F interaction is that E2F activity is repressed by pRB binding [7, 8]. pRB, therefore, exerts its growth suppression function mainly through its sequestration of E2F activity. It was also shown that in some cases binding of pRB and other pocket proteins to E2F-1 does not simply inhibit E2F-1 activity. The resulting pRB/E2F-1 complex binds to the promoter and actively represses transcription by blocking the activity of surrounding transcription factors on the promoters [9]. The balance between these two activities in vivo is still in question.
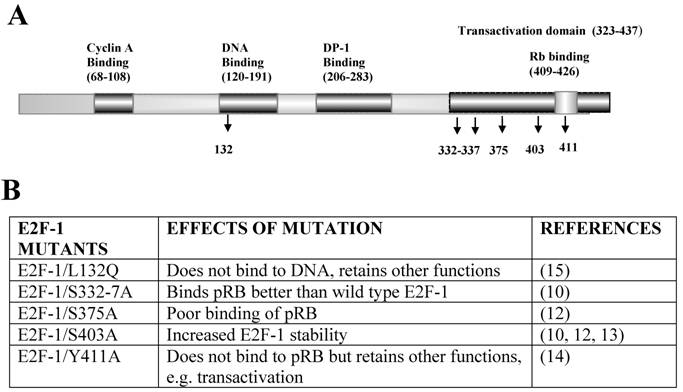
An ideal study to investigate the role of the E2F-1-pRB interaction in cell growth would be to study the properties of a pRB mutant that fails to bind to E2F, but retains all other activities. However, many of the pRB-binding proteins interact with similar regions of pRB and the commonly used tumor-derived mutant alleles encode proteins that fail to interact with multiple pRB-binding proteins. To date, no pRB mutation has been characterized in sufficient detail to show that it specifically eliminates E2F binding but leaves other interactions intact. An alternative approach to this issue is to ask whether mutations that change E2F proteins binding affinity to pRB are sufficient to change cell growth in aspect of cell cycle and tumor formation. Therefore we used the E2F-1 mutants including E2F-1/S332-7A, E2F-1/S375A, E2F-1/S403A, E2F-1/Y411A and E2F-1/L132Q that have different binding affinities for pRB to better understand the roles of the E2F-1 phosphorylation and E2F-1-pRB interaction in the cell cycle, as well as in transformation and gene expression. E2F-1 mutants and their previously known characteristics were shown in Fig. 1. Studies have shown that phosphorylation of E2F-1 in vitro on serine residues 332 and 337 prevented its binding to pRB, and mutation of these serine residues increased E2F-1 binding to pRB [10]. Phosphorylation of E2F-1 on serines 332 and 337 was shown to increase in cells in the late G1 phase of the cell cycle. Late G1 is when pRB becomes phosphorylated and subsequently releases E2F bound to it [11]. Therefore, phosphorylation of E2F-1 on serines 332 and 337, as well as phosphorylation of pRB, could assist in dissociation of the pRB/E2F-1 complex in the late G1 phase. In contrast, others have shown that phosphorylation of E2F-1 in vitro on serine 375 promotes binding of E2F-1 to pRB, and serine to alanine mutation of this residue decreased the E2F-1 binding to pRB [12]. Another mutant is E2F-1/S403A [10]. Peptide mapping of E2F-1/S403A did not reveal any changes in phosphorylation compared to the map of E2F-1/wt [12]. Interestingly, it has been shown in another study that site 403 is also phosphorylated and this phosphorylation increases the E2F-1 degradation [13]. Mutation S403A increased the stability of the E2F-1. The binding of the E2F-1/S403A mutant to pRB was found to be same as E2F-1/wt pRB binding in the yeast two-hybrid system [12]. An E2F-1 mutant has been described in which tyrosine 411 has been replaced with alanine. This mutation inhibited E2F-1's binding to pRB in a two-hybrid yeast system and in vivo [14]. Although the site of mutation is within the transactivation domain of E2F-1, it did not change E2F-1's full transcriptional potential. Another mutant is E2F-1/L132Q. The mutant no longer binds to DNA, but retains other activities such as pRB binding and transactivation [15]. In these experiments, however, effects of these mutants, in vivo binding to pRB, alteration of the cell cycle phenotype and tumor formation, were not reported.
E2F-1 mutants used in the present study. A. Schematic representation of the functional domains of E2F-1 and mutation sites. Each domain is represented by a shaded box and their function is described in the top part of the figure. Each mutation is shown by arrows at the bottom of the figure. B. Previously described effects of mutation.
In this study, we showed that in vivo phosphorylation at amino acids 332-337, 375 and 403 is important for the E2F-1 and pRB interaction. However, although E2F-1 mutants 332-7, 375 and 403 showed similar binding affinity to pRB, they showed different characteristics in transformation efficiency, G0 accumulation, and target gene experiments. More importantly, findings suggest that free E2F-1 provides the tumor cells with a growth advantage beyond simply shortening G1.
2. Materials and Methods
2.1. Cells and viruses
ψ-CRE, a murine fibroblast cell line was used in these experiments [16]. The cells were grown in DMEM supplemented with 5% (vol/vol) fetal bovine serum and 5% calf serum in a 5% CO2 atmosphere at 370C [17]. Retroviral vector, Linker Neo CMV E2F-1 was used to express E2F-1/wt and E2F-1/mutant genes as described below. Linker Neo CMV E2F-1 is identical to Linker CMV T [18] except that the large T antigen gene from simian virus 40 was replaced by a cDNA, approximately 1326 bps long, encoding E2F-1/wt [19] and E2F-1 mutants [8, 12, 15]. Mutant cDNAs including E2F-1/S332-7A, E2F-1/S375A, and E2F-1/S403A [12] were obtained from Dr. A. Zantema, mutant E2F-1/L132Q [15] was obtained from Dr. J. R. Nevins and E2F-1/Y411A [8] was obtained from Dr. K. Helin. pX17 is a retroviral vector [20], similar to Linker Neo CMV E2F-1, encodes the neomycin resistance gene but does not encode E2F-1 gene. pX17 was used as negative control in the experiments. To produce infectious virus, the recombinant plasmids encoding Linker Neo CMV E2F-1s were transfected together with helper virus containing vector (SV-A-MLV-env) which encoded genes needed to complement the linker virus, but did not encode whole virus [21], into Cos-7 packaging cells using the calcium-phosphate transfection method [18]. Two to three days later, virus containing medium was collected from these cells and used to infect established ψ-CRE murine cell lines [17]. E2F-1 wt and E2F-1 mutants expressing cells used in the experiments were chosen from at least 5 different CRE cell lines for each of individual E2F-1. Each cell lines were prepared from the different retroviral infection experiments and cell clones were pooled from cells growing in the presence of G418. All the experiments including cell cycle analysis, transformation and gene expression analysis were run simultaneously from the same group of cells.
2.2. Immunoblotting
To prepare cell-free extracts, an equal number of cells were split into dishes. Nearly confluent dishes of cells were washed with sterile TBS (10 mM Tris [pH 8.0], 50 mM NaCl), and then lysed by addition of 1 ml of lysis buffer (50 mM Tris [pH 8.0], 5 mM EDTA, 150 mM NaCl, 0.5% NP-40, 1 mM PMSF and 0.01 mg of aprotinin per ml [22] to the cell monolayer. Cells were scraped from the dishes into microfuge tubes and incubated on ice for 30 min with inversion. Lysed cells were centrifuged at 11,150 x g for 10 min at 40C to remove cell debris. The total extract volume was determined, and frozen in aliquots at -700C. In addition to the plate of cells used to make extracts, an identical plate was trypsinized and the cells counted to determine cell number. In this way a volume of extract corresponding to a given cell number could be analyzed by SDS-PAGE. Extract prepared from 4x10⁴ cells was used. From the previous studies, it is known that overexpression of E2F-1 decreases the cell size. Therefore we used the cell number to equilibrate the individual cell extracts on immunoblots. To this volume of extract was added one-sixth of the total volume of loading buffer (48 mM Tris [pH 6.8], 18.5% SDS, 3.94 M β-mercaptoethanol, 31% glycerol and 3% bromophenol blue) and the mixture was boiled for 3 min. Proteins were analyzed by SDS-PAGE using 10% gels [23].
Proteins were transferred from the gel to Hybond ECL membranes (Amersham; Arlington Heights, IL) using a Hoefer (San Francisco, CA) TE Series Transphor Unit. Membranes were blocked at room temperature on a shaking platform with wash buffer (0.1% Tween-20 in TBS) containing 5.0% dehydrated low fat milk for 45 min and then for 45 min in wash buffer containing 1% low fat milk and 1% bovine serum albumin. The membranes were rinsed in wash buffer and then incubated with an appropriate primary antibody (see below) diluted at 1:500 to 1:2000 in wash buffer containing 5% milk for 1 to 2 hrs. The membranes were washed four times in wash buffer as before and then incubated with a secondary antibody diluted at 1:2000 in wash buffer containing 5.0% low fat milk for 1 h. The membranes were washed three times as before in wash buffer. The wash buffer in the last wash containing no Tween-20. Equal volumes of ECL detection reagents 1 and 2 (Amersham) were mixed and added to the membranes for 1 min. The membranes were then immediately exposed to Hyperfilm-ECL (Amersham) [24].
2.3. Antibodies
The antibody used in immunoblotting for detection of E2F-1, was rabbit anti-human E2F-1 (C-20), polyclonal antibody (Santa Cruz Biotechnology; Santa Cruz, CA). The secondary antibodies used in immunoblotting were horseradish peroxidase conjugated sheep anti-mouse (Sigma) and donkey anti-rabbit (Amersham), which were used for reaction with monoclonal and polyclonal primary antibodies, respectively. The antibodies used for immunoprecipitation of E2F-1 and pRb were KH95 (Santa Cruz Biotechnology) and G3-245 (Pharmingen; San Diego, CA) monoclonal antibodies, respectively. All these antibodies have been shown to react with mouse proteins.
2.4. Soft agar assays
Five or ten thousand cells were plated in 1 ml of top agar composed of DMEM supplemented with 5% fetal bovine serum and 5% calf serum and containing 0.38% Noble agar [24]. This suspension was seeded into 35-mm diameter dishes over a 2 ml layer of solidified bottom agar containing DMEM and 0.5% Noble agar. Dishes were maintained at 37°C in a humidified 5% CO2 atmosphere. After 3 weeks, colonies were either photographed or counted. For photomicrographs, dishes were stained with p-iodonitrotetrazolium violet [25] and photographed. For counting, colonies were visualized with a microscope using low power magnification and those greater than 50 µm in diameter were counted. Six microscope fields per dish were counted and used to calculate the total number of colonies on the entire dish (based on dish surface area). Colony counts were obtained from four dishes each cell line for per experiment [26]. The data are expressed as the means of counts from five independent experiments.
2.5. Cell cycle synchronization
To synchronize cells by serum starvation, 5 x 10⁵ cells were seeded into 10-cm dishes. Forty-eight hrs later, cells were washed with PBS and DMEM supplemented with 0.5% fetal bovine serum was then added. After 60 h, cells were stimulated into the cell cycle by addition of complete medium (DMEM supplemented with 5% (vol/vol) fetal bovine serum and 5% calf serum). Samples for total RNA preparation and flow cytometry were collected at time 0 and appropriate intervals thereafter as indicated.
2.6. Flow cytometry
To analyze cellular DNA content, cells were fixed and stained [27] [24]. Briefly, 106 trypsinized cells were washed three times with PBS and then fixed by incubation with 50 μl of 0.125% paraformaldehyde at 370C for 5 min. Then 450 μl of ice-cold methanol was added to the sample. The fixed cells were washed three times with 0.1% Triton X-100 in PBS and treated with RNase A (0.04 Kunitz units) for 30 min. The cells were then stained with 50 μg of propidium iodide per ml. Cell analysis was performed using a Coulter EPICS Elite EPS flow cytometer (Coulter Electronics; Miami, FL). Excitation used the 488-nm line of an argon laser operating at 100 mW. Red fluorescence was collected above 570 nm. A doublet discriminator (peak versus integrated red signal) was used as the primary gate to eliminate cell aggregates. Red fluorescence was displayed on a linear scale. The fraction of the total cell population present in each of the G1, S and G2/M cell cycle phases was obtained from DNA histograms by mathematical modeling using MPLUS software (Phoenix Flow Systems; San Diego, CA [18].
2.7. Immunoprecipitation
Immunoprecipitations were performed using 300 µg of cell-free extract prepared as described in the immunoblotting procedure. The extracts were precleared by incubation with Protein G Plus-/Protein A-Agarose beads (Oncogene Science; Uniondale, NY) that had been treated with BSA. The BSA-treated beads were prepared by incubating Protein G Plus-/Protein A-Agarose beads on a rotating platform in lysis buffer containing 1% BSA at 4°C for 2 h. The BSA-treated beads were then washed twice in lysis buffer and added to the cell-free extract. The extract containing the BSA-treated beads was incubated at 4°C for 3 h on a rotating platform. Beads were then removed from the extracts by centrifugation at 3150 x g for 5 min at 4°C. E2F-1 or pRB was immunoprecipitated from precleared extracts by adding 2 µg of specific antibodies and 20 µl of BSA treated Protein G Plus-/Protein A-Agarose beads [24]. This mixture was incubated for 15 h and centrifuged as described above. The immune complexes were washed 4 times with lysis buffer and then analyzed by SDS-PAGE and immunoblotted as described above.
2.8. Total RNA isolation
RNA STAT-60 Total RNA (TEL-TEST, INC.; Friendswood, TX) isolation reagent kit was used and its protocol followed for total RNA isolation. Cells in culture dishes were homogenized with RNA STAT-60, followed by RNA extraction using chloroform. RNA was precipitated with 0.5 vol. of isopropanol followed by washing with 75% ethanol [24]. The quality of the samples was checked electrophoretically, and quantification was done spectrophotometrically. Two independent RNA preparations were used in the experiment.
2.9. Primers used in the MRT-PCR
All primers for E2F-1 target genes were designed with the Primer3: WWW primer tool program (http://biotools.umassmed.edu/bioapps/primer3_www.cgi) and are described previously [24]. Primers were made by IDT, Inc. (Coralville, IA).
2.10. Semiquantitative Multiplex RT-PCR
Multiplex RT-PCR was performed using Promega's Access RT-PCR system [24]. Importantly, RT-PCR was used first to determine the linear range of target genes. Second, the linear range of the internal standard was determined using β-actin and β-actin competimer (QuantumRNA β-actin internal standards, Ambion). Conditions for MRT-PCR were optimized after determining the β-actin and β-actin competimer ratio. PCR cycles were optimized so that the target gene would be in the linear range. Reactions contained AMV-RT and Tfl DNA polymerase, AMV/Tfl Reaction Buffer, dNTP mix, specific upstream and downstream primers, β-actin and β-actin competimer primers, MgSO4, and RNA template. The PCR machine was programmed as follows: 480C for 45 min to synthesize first strand cDNA; 940C for 2 min to denature template; 940C 45 sec for denaturation; at 600C for 45 sec for annealing; and 680C for 1 min for extension. The PCR products were run in a 1.5% agarose gel and the gel was stained with EtBr. EtBr signals were analyzed by computer assisted densitometry.
3. Results
3.1. Overexpression of E2F-1/wt and E2F-1/mutant genes in ψ-CRE cell line
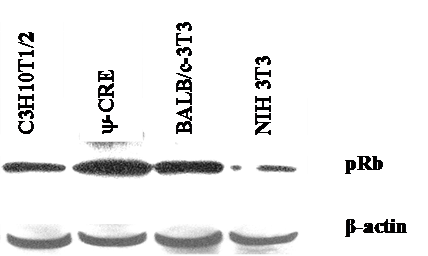
We used the mouse fibroblast ψ-CRE cell line because it has the highest amount of pRB protein among the cell lines C3H10T1/2, BALB/c-3T3 and NIH 3T3 (data was not shown) we evaluated. We established 7 cell lines using retroviral vectors that overexpress the control pX17 (the retroviral vector with no insert, negative control), E2F-1/wt (positive control), or E2F-1/mutants that have different binding affinities for pRB. E2F-1 mutants and their previously known characteristics were shown in Fig. 1.
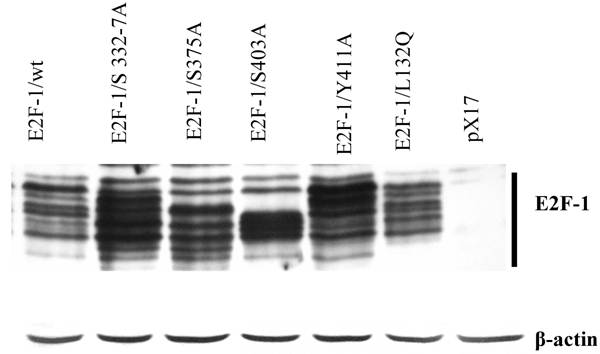
Since the phenotypes produced by any given E2F-1 are likely to depend on the amount of E2F-1 expressed, it was necessary to compare the cells that expressed E2F-1 at roughly equivalent levels. Therefore individual E2F-1 wt and each E2F-1 mutant was chosen from at least 5 different CRE cell lines for each of individual E2F-1 such that all chosen cell lines had approximately equivalent levels of E2F-1. Fig. 2 shows the chosen cell lines expressing E2F-1. These cell lines were called E2F-1/wt, E2F-1/S332-7A, E2F-1/S375A, E2F-1/S403A, E2F-1/Y411A and E2F-1/L132Q. In addition, pX17 viruses containing cells were used as control. Each cell lines were prepared from the different retroviral infection experiments and cell clones were pooled from cells growing in the presence of G418. All the experiments including cell cycle analysis, transformation and gene expression were run simultaneously from the same group of cells. The cell lines shown in Fig. 2 were used for the remaining experiments of this manuscript.
Phosphorylation patterns of E2F-1/wt and mutants. Cell free extracts from an equivalent number of cells (5 X 10⁴) of wt and E2F-1 mutants were analyzed by immunoblotting using anti-E2F-1 specific polyclonal antibody after separation on 10% SDS-PAGE. For loading control β-actin expression analyzed using anti- β-actin specific polyclonal antibody. The position of the E2F-1 bands is indicated on the right.
3.2. E2F-1 overexpressing cells show different phenotypic characteristics
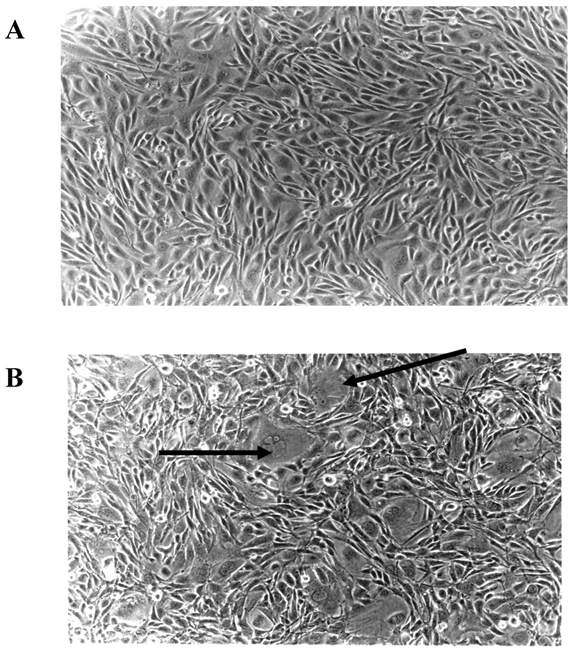
Microscopic examination of E2F-1 overexpressing cells in cell culture showed some different characteristics. Some E2F-1 overexpressing cells were much larger than normal and contained more than one nucleus. Multiple nuclei are characteristic of transformed cells [28, 29]. All the E2F-1 overexpressing cell lines were multinucleated to varying degrees. However, it was most striking in cells overexpressing the E2F-1/S332-7A and E2F-1/Y411A mutants (Fig. 3).
E2F-1 overexpressing cells showed altered characteristics in the culture. Some cells were much larger than normal and contained more than one nucleus. A. Control (not overexpressing E2F-1), B. Cell culture overexpressing E2F-1/wt. Arrows show the multinuclear cells.
3.3. The E2F-1/wt and E2F-1/mutants showed banding patterns dependent on phosphorylation
Previously we showed that E2F-1/wt could be separated into a series of different bands by SDS-PAGE. These bands were shown to be differentially phosphorylated forms of E2F-1 [30]. Similar to these results, this study confirmed that immunoblot analysis of cell extracts from the overexpressing E2F-1/wt cells displayed 8-10 different E2F-1 bands that reacted with the anti-E2F-1 specific antibody. E2F-1 mutants except E2F-1/L132Q used in this study showed different banding patterns than those of E2F-1/wt (Fig. 2). Some of E2F-1 mutants also showed 8-10 bands. However, the density distribution of E2F-1/mutants' bands was different than that of the E2F-1/wt.
3.4. Interaction between E2F-1/wt or E2F-1/mutants and pRB
As mentioned previously in introduction part, the E2F-1 mutant pRB interactions were mostly described in vitro and in the yeast two-hybrid system. Therefore it would be important to show E2F-1 mutants pRB binding in cell. To test in vivo affinity of the E2F-1 mutant proteins for pRB, E2F-1 was immunoprecipitated from extracts made from asynchronously growing E2F-1/wt or E2F-1/mutant cell lines using an anti-E2F-1-specific antibody. The immunoprecipitated proteins were then divided into two equal aliquots. One aliquot of the immunoprecipitated proteins was blotted onto nitrocellulose membranes following resolution by SDS-PAGE and then probed with an anti-E2F-1 specific antibody. The other aliquot was treated similarly and then probed with an anti-pRB specific antibody. In this way, it was possible to determine the amount of pRB co-immunoprecipitated with E2F-1, relative to the total amount of E2F-1 present in each of the cell lines (Fig. 4).
Co-immunoprecipitation of pRb and E2F-1. A. Cell free extracts from the ψ-CRE cell lines overexpressing E2F-1/wt, control (pX17), and E2F-1/mutants were co-precipitated with a monoclonal antibody specific for E2F-1 was followed by western blotting with E2F-1 polyclonal antibody or pRB polyclonal antibody as described in materials and methods. B. The results of immunoblots were analyzed by video-assisted densitometry. The bars show the relative densitometry ratios of pRB to E2F-1 for each cell line. The pRB/E2F-1 ratio for E2F-1/wt overexpressing cells was given a value of 1.0. Values for other cell lines are relative to this. Values are mean ± S.E.M., n=3, * P< 0.05 compared to ψ-CRE E2F-1/wt cell lines.
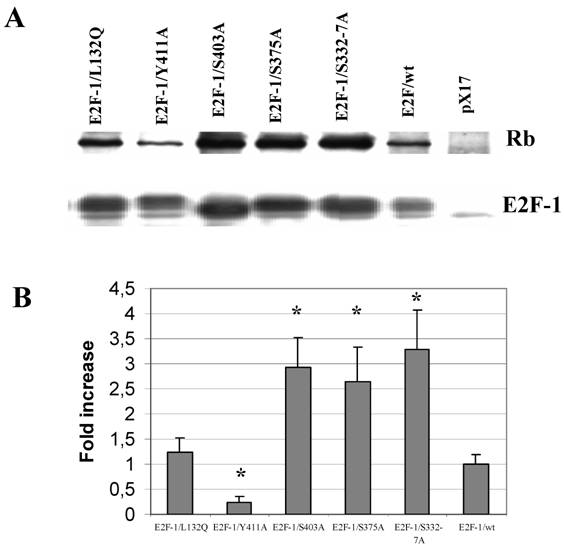
After the E2F-1/wt/pRB binding ratio was normalized to 1, we observed that E2F-1/S332-7A/pRB and E2F-1/S403A/pRB binding increased approximately 3-fold compared to that of E2F-1/wt-pRB binding (Fig. 4). E2F-1/S375A/pRB binding increased approximately 2.5-fold to that of E2F-1/wt/pRB binding. E2F-1/Y411A/pRB binding, on the other hand, decreased approximately 4-fold in comparison to E2F-1/wt/pRB binding. The E2F-1/L132Q/pRB binding ratio was found to be essentially equal to the E2F-1/wt/pRB binding ratio as expected.
3.5. Transformation of cells overexpressing E2F-1/wt or E2F-1/mutants
As shown previously, overexpression of E2F-1 increase the transformation of cell, therefore we aimed to see how E2F-1 mutants would change the transformation efficiency [26, 31].
Since anchorage-independent growth of fibroblast correlates highly with tumor formation in animals [32], anchorage-independent growth of E2F-1 overexpressing cells was tested by plating the cells in soft agar medium and assaying the ability of the cells to form colonies. Fig. 5 A and B shows micrograph of control (pX17) and the E2F-1 overexpressing cells after growth in soft agar for three weeks. The micrographs show that E2F-1 overexpressing cells formed colonies in soft agar and were therefore capable of proliferating in an anchorage-independent manner.
Representative soft agar fields demonstrating colony formation by transformed cells. Cells were plated in soft agar medium, stained and photographed as described in materials and methods. Colonies greater than 50 μm in diameter were scored after three weeks of growth. A. micrograph of control (pX17) cells after growth in soft agar for three weeks. B. micrograph of the E2F-1 overexpressing cells after growth in soft agar for three weeks. C. Transformation frequency was expressed as the percentage of total plated cells that formed colonies. Values are mean ± S.E.M., n=5, *P< 0.05 compared to control (pX17) ψ-CRE cell line, # P< 0.05 compared to ψ-CRE E2F-1/wt cell lines.
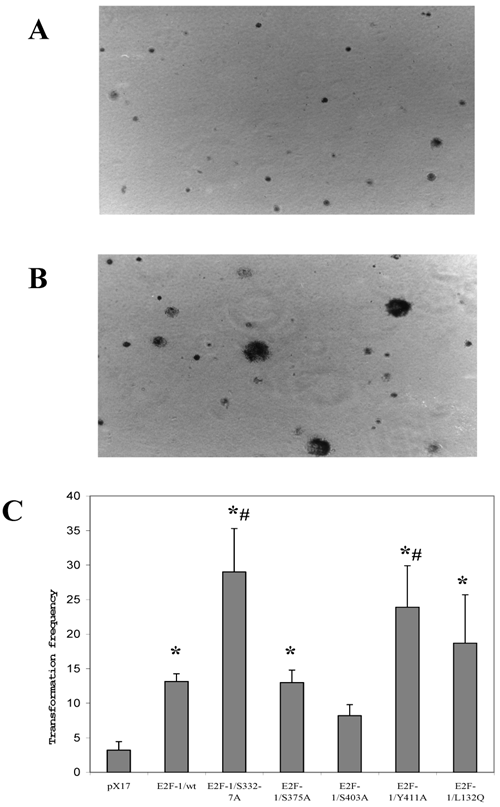
All the E2F-1 expressing cell lines (E2F-1/wt and E2F-1/mutants), except the E2F-1/S403A mutant, showed significant increases in transformation, compared to the control (pX17) cell line. The mutants E2F-1/S332-7A and E2F-1/Y411A showed a significant increase from the E2F-1/wt overexpressing cell line. The E2F-1/S375A and E2F-1/L132Q mutants overexpressing cell lines showed a significant difference in colony number compared to the mock control, but no difference compared to E2F-1/wt overexpressing cells. The E2F-1/S403A mutant did not significantly increase the transformation frequency compared to control (pX17) (Fig. 5).
3.6. The E2F-1/wt and E2F-1/mutants change G0/G1 checkpoint controls
Overexpression of E2F-1 in cells alters cell growth regulation, as reported previously [2]. In this study, the G0/G1 phase accumulation of the different E2F-1 mutants was determined by using flow cytometric analysis.
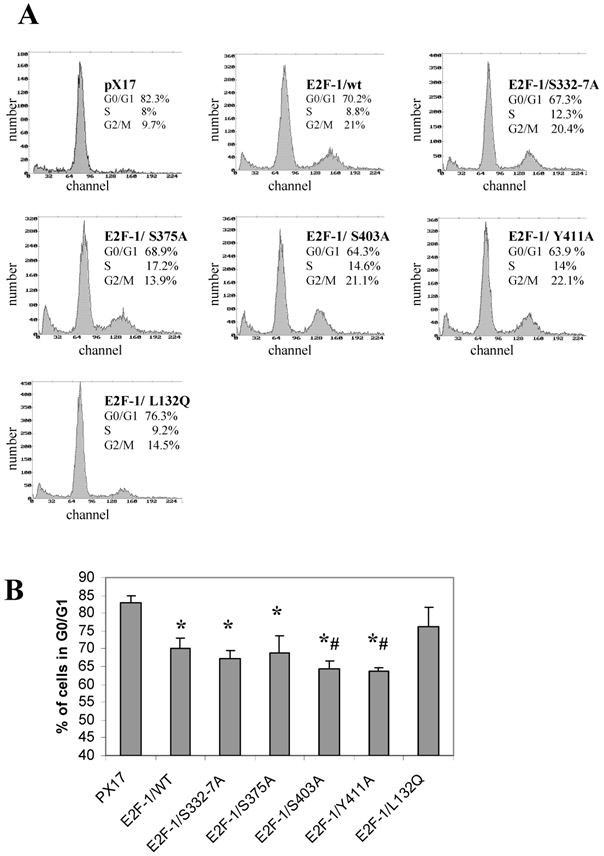
All of the E2F-1 mutants, except E2F-1/L132Q, showed significantly less accumulation in G0, compared to the control (pX17) cells. Furthermore, E2F-1/Y411A and E2F-1/S403A showed less accumulation in G0/G1 as compared to E2F-1/wt expressing cells (Fig. 6). However, the other E2F-1 mutants were not significantly different from the E2F-1/wt cells.
Cell cycle analysis of cell lines expressing E2F-1 mutants. A. Cells were starved in 0.5% FBS for 60 hours, at which time the first samples were taken to measure the G0 value of the different E2F-1 mutants and wt. Cells are fixed with methanol, treated with RNAse, stained with propidium iodide, and then analyzed by flow cytometry. DNA histograms were analyzed by the program Mplus. The x-axis shows the DNA content and the y-axis shows cell number. B. Number of E2F-1/wt or E2F-1/mutant overexpressing cells in G0/G1 phase. Values are mean ± S.E.M., n=3, *P< 0.05 compared to control ψ-CRE cell line, # P< 0.05 compared to ψ-CRE E2F-1/wt cell lines.
3.7. Effects of E2F-1/wt or E2F-1/mutants on target gene expression
It seems likely that the different phenotypic changes that occur in the mutants are a result of changes produced by alterations in the expression of E2F-1 target genes. E2F-1 target genes, such as RB, c-myc, b-myb, DHFR, TK, cdc2, cyclin D and others, are important cell cycle regulators. Therefore effects of E2F-1 mutants on target gene expression were compared to E2F-1/wt and control (pX17) using semiquantitative Multiplex RT-PCR.
Results obtained from the asynchronized proliferating cells showed that, overall, endogenous E2F-1 target genes, including DHFR, b-myb, cyclin D1, cdc2, c-myc, TK and RB, were deregulated in E2F-1/wt and mutants overexpressing cells (Fig. 7). Based on the results obtained, although not all of them are statistically significant, the expression levels of genes including the DHFR, b-myb, cdc2, c-myc, cyclinD1 and TK were showed similar result and were less repressed in cell lines overexpressing E2F-1/S332-7A, E2F-1/S375A, E2F-1/S403A, E2F-1/Y411A and E2F-1/L132Q compared to the expression of the same genes in the cell lines overexpressing E2F-1/wt. The expression of cyclinD1 in all cells expressing E2F-1 mutants are statistically less repressed compared to the cell expressing E2F-1/wt. In addition to cyclin D1, the expression of the DHFR, b-myb, c-myc in the cells expressing E2F-1/Y411A or E2F-1/L132Q is less repressed statistically compared to E2F-1/wt and the expression of the cdc2 in the cells expressing E2F-1/L132Q is less repressed statistically compared to E2F-1/wt.
Expression levels of the target genes in asynchronously growing ψ-CRE cells overexpressing E2F-1/wt and E2F-1/mutants. A. MRT-PCR of the total RNA of the ψ-CRE cells overexpressing E2F-1/wt and mutants was carried out as described in materials and methods and products were analyzed on a 1.5% agarose gel. The gel was stained with EtBr, and EtBr signals were analyzed by computer assisted densitometry. B. Results are presented as % change in expression of target genes for each cell line compared to control (px17), which was given the value of 100.0. Bar 1, 2, 3, 4, 5, 6, and 7 represent control (px17), E2F-1/wt, E2F-1/S332-7A, E2F-1/S375A, E2F-1/S403A, E2F-1/Y411A and E2F-1/L132Q, respectively. Values are mean ± S.E.M., n=3, *P< 0.05 compared to control ψ-CRE cell line, # P< 0.05 compared to ψ-CRE E2F-1/wt cell lines.
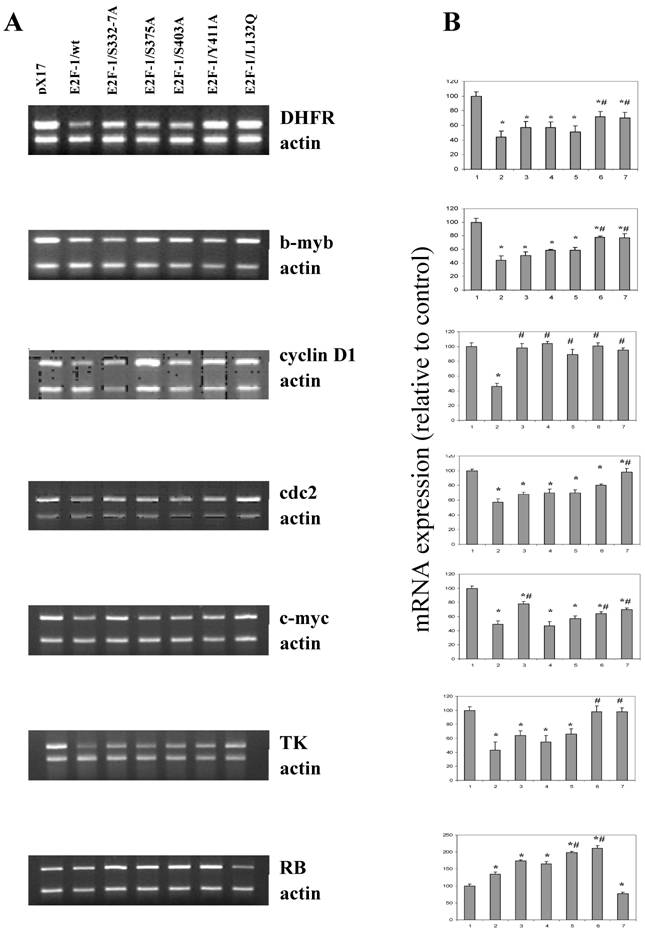
Very different results were observed with RB expression (Fig. 7) than those described for the other target genes, which showed lowered expression in cells overexpressing E2F-1 compared to the control (pX17). RB expression was significantly higher in the E2F-1/wt and E2F-1/mutants except in the E2F-1/L132Q as compared to controls. Fig. 7 shows that RB expression increased about two-fold in the cells overexpressing E2F-1/S403A and E2F-1/Y411A compared to that of controls. They were also significantly higher than the RB expression in cells overexpressing E2F-1/wt. The most interesting results were obtained with the E2F-1/L132Q, which is the only mutant in which RB expression is lower than that of the control.
4. Discussion
The structural consequences of E2F-1 phosphorylation are currently unknown. However from this data it is suggested that phosphorylation induces conformational changes resulting in the promotion of E2F-1-pRB interaction. Ser-332-337, ser-375 and ser-403 are not in the minimal domain of E2F-1 that is necessary and sufficient to interact with pRB. This makes it unlikely that phosphorylation is merely acting to sterically change the interaction with pRB. Thus, the regulatory effects of phosphorylation of these residues must act at a distance. Together these facts suggest that changes in phosphorylation affect the affinity of E2F-1 for pRB via conformational changes.
The interaction between E2F-1 and pRB changed with different E2F-1 mutants. Data presented in this study suggests that in vivo phosphorylation at amino acids 332-337, 375 and 403 is important for the E2F-1 and pRB interaction. Contrary to previous report [12], the E2F-1/S375A and E2F-1/S403A mutants bound more pRB compared to E2F-1/wt as measured in immunoprecipitation assays (Fig. 4). This discrepancy may arise from the fact that the previous experiments were done in vitro using extracts from insect cells expressing E2F-1 and a pRB GST fusion protein. Indeed, it has been shown that site 403 is also phosphorylated and this phosphorylation increases the E2F-1 degradation in another experiment [13]. Mutation of phosphorylation site S403 increased the stability of the E2F-1. Morever, it was shown that E2F-1 is stabilized by its interaction with pRB [33]. Therefore, it is reasonable to think that increased affinity of mutant 403 to pRB increases the stability of 403 mutant.
The cell cycle and transformation efficiency results for the E2F-1/Y411A mutant could be predicted and correlated well with known information. For example, it was shown earlier that its overexpression in the cell pushes the cell into S phase more efficiently compared to E2F-1/wt [14]. The same result was found in this study. Its binding affinity to pRB was also found to be in agreement with earlier in vitro studies. Transformation efficiency results were also well correlated with the result of cell cycle and E2F-1/Y411A pRB-binding experiments in this study. Therefore, free E2F-1, unbound to pRB, increased S phase entry and transformation of ψ-CRE cell. These results provided direct evidence for the biological significance of the E2F-1 and E2F-1/pRB interaction for proper cell cycle and tumor formation.
Although, we hypothesized that E2F-1/Y411A and E2F-1/L132Q overexpressing cells will show similar phenotypes, since both cell lines have more free E2F-1, the E2F-1/L132Q mutant showed the opposite results in the soft agar and cell cycle experiments. Although the E2F-1/L132Q mutants showed higher transformation efficiency compared to the pX17 in this study similar to previous study done in melanocytes [34], it did not show the expected result for the cell cycle. For example, overexpression of E2F-1/L132Q did not significantly push the cell into S phase more than control (Fig. 6). Therefore, it is interesting to consider the possibility that free E2F-1 provides the tumor cells with a growth advantage beyond simply shortening G1. This idea is also supported by the target gene expression results, which is described in the following paragraphs.
Data also shows that although E2F-1 mutants 332-7, 375 and 403 showed similar binding affinity to pRB, they showed different characteristics in transformation efficiency, G0/G1 accumulation, and target gene experiments. Interestingly, the E2F-1/S332-7A mutant was more efficient in transforming cells than E2F-1/wt. Another interesting result was seen in the E2F-1/S403A mutant. Although the E2F-1/S403A mutant binds pRB as efficiently as the E2F-1/S332-7A mutant, it did not show an increase in transformation efficiency. Unexpectedly, the E2F-1/S403A mutant showed less accumulation in G0 than the E2F-1/wt. This finding was inconsistent with very low E2F-1/S403A transformation efficiency. Although there is no clue to explain these phenotypic changes with the known effects of mutants, it might be possible to explain these different characteristics to some degree with the results from the target gene experiments. For example, c-myc oncogene expression was the least repressed in the E2F-1/S332-7A mutant expressing cells that produced one of the greatest numbers of transformed colonies. In the E2F-1/S403A expressing cells, RB gene expression was higher than that E2F-1/wt, which may be one of the reasons for having the lowest rate of transformation. It is worth mentioning that the E2F-1 target genes are not limited to those we checked in this study [35]. Therefore, it is possible that some other target genes might be affected by the alteration of RB expression or by other target genes causing some unexpected phenotypic changes.
The changes in target gene expression by the different mutants can be explained to some degree by the context of pRB binding to the particular E2F-1's. For example, RB expression increased in E2F-1/wt overexpressing cell lines compared to that of control. In the same cell lines, all target gene expression, including DHFR, b-myb, cdc-2, c-myc, cyclin D1 and TK were repressed compared to the control. Therefore, high amounts of E2F-1 and RB repressed expression of many of the target gene. This explanation will be more meaningful when the higher DNA binding affinity of E2F-1/pRB complex compared to free E2F-1 and increased stability of E2F-1/pRB is considered [33, 36].
However, it is not possible to use the same reasoning to explain the effects of the E2F-1/S332-7A, E2F-1/S375A and E2F-1/S403A mutants. E2F-1/S332-7A, E2F-1/S375A and E2F-1/S403A overexpression increased RB expression more than that E2F-1/wt. Furthermore, it was shown that the E2F-1/S332-7A, E2F-1/S375A, E2F-1/S403A mutants bind pRB better than the E2F-1/wt binds to pRB in this study (Fig 4). Following the reasoning used above; there should be more E2F-1/pRB complexes on the target gene promoter and more repression on the target gene compared to the cells overexpressing E2F-1/wt. However, the opposite was found. Therefore, in addition to pRB regulation on target gene promoter, some other factor must be effecting the target gene promoter. For example, Previous studies have shown that phosphorylation of E2F-1 changes its binding to DNA [37]. Similarly, it would be possible that mutation on E2F-1/S332-7A, E2F-1/S375A and E2F-1/S403A might affect E2F-1-DNA binding, and subsequently transcription. It is also possible that since the mutation of Serine sites 332-7, 375 and 403 is in the transactivation domain of E2F-1, which may change activation directly. Difference of the effects of mutant E2F-1, such as E2F-1/S403A increase RB expression more than E2F-1/S332-7A and 375 might be also related with the conformational changes of individual mutants.
We hypothesized that E2F-1/Y411A and E2F-1/L132Q overexpressing cells will have less pRB on the promoter of target genes. Excess E2F-1/L132Q binds to pRB proteins, and this complex will not be able to bind to DNA. Only endogenous, free E2F-1 will bind to the promoter and thereby increase the activation or relieve the repression caused by the E2F-1/pRB complex. Similarly, it is hypothesized that excess E2F-1/Y411A binds the promoter more than the endogenous E2F-1/pRB complex and increases activation or relieves repression caused by the E2F-1/pRB complex. Indeed, this hypothesis appears true since most of the target genes were derepressed by both mutants. However, the effect of the E2F-1/Y411A and E2F-1/L132Q on RB was opposite of each other. RB expression increased more than two-fold in the cells overexpressing E2F-1/Y411A compared to that in E2F-1/wt, while a 20% decrease was observed in the cells overexpressing E2F-1/L132Q over control. Therefore, phenotypic differences between these mutant-overexpressing cells might be related with changes in the RB expression level.
The target gene expression results present an interesting and unexpected result. For example, overexpression of E2F-1/wt increased the transformation efficiency, however target genes expression known that related with cell proliferation or tumurogenesis including c-myc, b-myb, cyclin D1, cdc2 and TK were decreased. Surprisingly, pRB, a tumor suppressor protein, expression level was increased. This result might suggest two things: first, there might be other target genes that have a more decisive role on the tumor formation other than what we studied. Second, exogenous E2F-1 induces transformation directly independent of its target genes. However, both suggestions are unlikely since the target genes we checked are well known oncogenes and regulated by E2F-1 as shown in this study (Fig. 7). Recently, we showed that E2F-1 acts in different ways, not only depending on the target gene but also depending on different stages of the cell cycle. For example, E2F-1 acts as part of the repression complex with pRB in the expression of DHFR, b-myb, TK and cdc2 in asynchronously growing cells; on the other hand, E2F-1 acts as an activator in the expression of the same genes in cells that are re-entering the cycle [24]. Therefore, cell cycle dependent activity of the E2F-1 might be the main determinant of growth regulation of the target genes followed by tumor formation.
Abbreviations
E2F: Early-Region-2 Transcription-Factor-1; Rb: Retinoblastoma.
Conflict of Interest
There are no conflicts of interest and financial disclosure in the subject matter of our paper.
References
1. Iaquinta PJ, Lees JA. Life and death decisions by the E2F transcription factors. Curr Opin Cell Biol. 2007;19:649-657
2. Muller H, Helin K. The E2F transcription factors: key regulators of cell proliferation. Biochim Biophys Acta. 2000;1470:M1-12
3. Stengel KR, Thangavel C, Solomon DA, Angus SP, Zheng Y, Knudsen ES. RB/p107/130 pocket proteins: Protein dynamics and interactions with target gene promoters. J Biol Chem. 2009;284(29):19265-71
4. Sun A, Bagella L, Tutton S, Romano G, Giordano A. From G0 to S phase: a view of the roles played by the retinoblastoma (Rb) family members in the Rb-E2F pathway. J Cell Biochem. 2007;102:1400-1404
5. Welch PJ, Wang JY. Disruption of retinoblastoma protein function by coexpression of its C pocket fragment. Genes Dev. 1995;9:31-46
6. Hiebert SW, Blake M, Azizkhan J, Nevins JR. Role of E2F transcription factor in E1A-mediated trans activation of cellular genes. J Virol. 1991;65:3547-3552
7. Black AR, Azizkhan-Clifford J. Regulation of E2F: a family of transcription factors involved in proliferation control. Gene. 1999;237:281-302
8. Helin K, Harlow E, Fattaey A. Inhibition of E2F-1 transactivation by direct binding of the retinoblastoma protein. Mol Cell Biol. 1993;13:6501-6508
9. Sellers WR, Rodgers JW, Kaelin WGJr. A potent transrepression domain in the retinoblastoma protein induces a cell cycle arrest when bound to E2F sites. Proc Natl Acad Sci U S A. 1995;92:11544-11548
10. Fagan R, Flint KJ, Jones N. Phosphorylation of E2F-1 modulates its interaction with the retinoblastoma gene product and the adenoviral E4 19 kDa protein. Cell. 1994;78:799-811
11. Emili A, Ingles CJ. Promoter-dependent photocross-linking of the acidic transcriptional activator E2F-1 to the TATA-binding protein. J Biol Chem. 1995;270:13674-13680
12. Peeper DS, Keblusek P, Helin K, Toebes M, van der Eb AJ, Zantema A. Phosphorylation of a specific cdk site in E2F-1 affects its electrophoretic mobility and promotes pRB-binding in vitro. Oncogene. 1995;10:39-48
13. Vandel L, Kouzarides T. Residues phosphorylated by TFIIH are required for E2F-1 degradation during S-phase. Embo J. 1999;18:4280-4291
14. Shan B, Durfee T, Lee WH. Disruption of RB/E2F-1 interaction by single point mutations in E2F-1 enhances S-phase entry and apoptosis. Proc Natl Acad Sci U S A. 1996;93:679-684
15. Cress WD, Johnson DG, Nevins JR. A genetic analysis of the E2F1 gene distinguishes regulation by Rb, p107, and adenovirus E4. Mol Cell Biol. 1993;13:6314-6325
16. Danos O, Mulligan RC. Safe and efficient generation of recombinant retroviruses with amphotropic and ecotropic host ranges. Proc Natl Acad Sci U S A. 1988;85:6460-6464
17. Sladek TL, Jacobberger JW. Rapid titration of retroviral vectors encoding intracellular antigens by flow cytometry. J Virol. 1990;64:3135-3138
18. Sladek TL, Jacobberger JW. Dependence of SV40 large T-antigen cell cycle regulation on T-antigen expression levels. Oncogene. 1992;7:1305-1313
19. Helin K, Lees JA, Vidal M, Dyson N, Harlow E, Fattaey A. A cDNA encoding a pRB-binding protein with properties of the transcription factor E2F. Cell. 1992;70:337-350
20. Sladek TL, Jacobberger JW. Simian virus 40 large T-antigen expression decreases the G1 and increases the G2 + M cell cycle phase durations in exponentially growing cells. J Virol. 1992;66:1059-1065
21. Landau NR, Littman DR. Packaging system for rapid production of murine leukemia virus vectors with variable tropism. J Virol. 1992;66:5110-5113
22. Kierstead TD, Tevethia MJ. Association of p53 binding and immortalization of primary C57BL/6 mouse embryo fibroblasts by using simian virus 40 T-antigen mutants bearing internal overlapping deletion mutations. J Virol. 1993;67:1817-1829
23. Laemmli UK. Cleavage of structural proteins during the assembly of the head of bacteriophage T4. Nature. 1970;227:680-685
24. Sahin F, Sladek TL. E2F-1 has dual roles depending on the cell cycle. Int J Biol Sci. 2010;6:116-128
25. Jat PS, Cepko CL, Mulligan RC, Sharp PA. Recombinant retroviruses encoding simian virus 40 large T antigen and polyomavirus large and middle T antigens. Mol Cell Biol. 1986;6:1204-1217
26. Yang XH, Sladek TL. Overexpression of the E2F-1 transcription factor gene mediates cell transformation. Gene Expr. 1995;4:195-204
27. Jacobberger JW, Fogleman D, Lehman JM. Analysis of intracellular antigens by flow cytometry. Cytometry. 1986;7:356-364
28. Kellokumpu-Lehtinen P, Soderstrom KO, Kortekangas A, Nordman E. Ultrastructural effects of irradiation on squamous cell carcinoma of the head and neck. Cancer. 1989;63:1108-1118
29. Nakano T, Oka K. Transition of Ki-67 index of uterine cervical tumors during radiation therapy. Immunohistochemical study. Cancer. 1991;68:517-523
30. Yang XH, Sladek TL. Novel phosphorylated forms of E2F-1 transcription factor bind to the retinoblastoma protein in cells overexpressing an E2F-1 cDNA. Biochem Biophys Res Commun. 1997;232:336-339
31. Johnson DG, Cress WD, Jakoi L, Nevins JR. Oncogenic capacity of the E2F1 gene. Proc Natl Acad Sci U S A. 1994;91:12823-12827
32. Barrett JC, Crawford BD, Mixter LO, Schechtman LM, Ts'o PO, Pollack R. Correlation of in vitro growth properties and tumorigenicity of Syrian hamster cell lines. Cancer Res. 1979;39:1504-1510
33. Hateboer G, Kerkhoven RM, Shvarts A, Bernards R, Beijersbergen RL. Degradation of E2F by the ubiquitin-proteasome pathway: regulation by retinoblastoma family proteins and adenovirus transforming proteins. Genes Dev. 1996;10:2960-2970
34. Halaban R, Cheng E, Zhang Y, Mandigo CE, Miglarese MR. Release of cell cycle constraints in mouse melanocytes by overexpressed mutant E2F1E132, but not by deletion of p16INK4A or p21WAF1/CIP1. Oncogene. 1998;16:2489-2501
35. Muller H, Bracken AP, Vernell R. et al. E2Fs regulate the expression of genes involved in differentiation, development, proliferation, and apoptosis. Genes Dev. 2001;15:267-285
36. Campanero MR, Flemington EK. Regulation of E2F through ubiquitin-proteasome-dependent degradation: stabilization by the pRB tumor suppressor protein. Proc Natl Acad Sci U S A. 1997;94:2221-2226
37. Sugarman JL, Schonthal AH, Glass CK. Identification of a cell-type-specific and E2F-independent mechanism for repression of cdc2 transcription. Mol Cell Biol. 1995;15:3282-3290
Figures
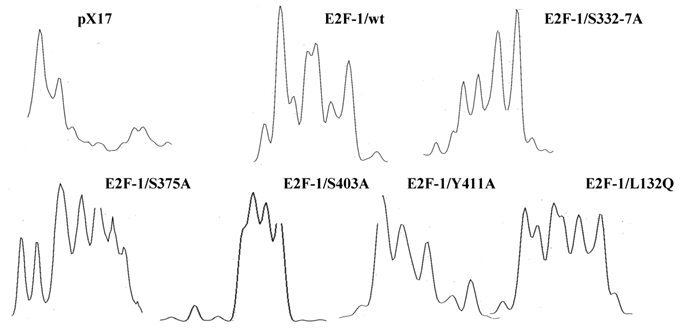
Densitometry analysis of the immunoblot of the wilt type and mutant E2F-1s. Immunoblot of wilt type and mutant E2F -1s were analyzed by computer assisted densitometry analyzes. X axis shows the molecular weight of the protein, Y-axis shows optic density of the individual bands.
Equivalent amount cell free extracts from of the cell lines were analyzed by immunoblotting using anti-pRb specific polyclonal antibody after separation on 10% SDS-PAGE. The position of the pRb and actin bands is indicated on the right.
Author contact
![]() Corresponding author: Fikret Şahin, MD. PhD., Microbiology Department, School of Medicine, Ankara University, Basic Science Buildings, 3rd floor, Sihhiye-Ankara, Turkey 06100. Home: 011 90-312 491 1951; Cell phone: 0535 721 2043; fsahin29com; Fax: 011 90- 312 310 6370
Corresponding author: Fikret Şahin, MD. PhD., Microbiology Department, School of Medicine, Ankara University, Basic Science Buildings, 3rd floor, Sihhiye-Ankara, Turkey 06100. Home: 011 90-312 491 1951; Cell phone: 0535 721 2043; fsahin29com; Fax: 011 90- 312 310 6370