Impact Factor ISSN: 1449-2288
- Issue 12; 2026
- Issue 11; 2026
- Issue 10; 2026
- Issue 9; 2026
- Issue 8; 2026
- Volume 22; 2026
- Past Issues
- Advance Articles
- Editorial Board
- Cover Images
- Index & Coverage
- Cover Suggestion
- Special Issues
Introduction
Material and Methods
Results
Discussion
Supplementary Material
Acknowledgements
References

 Global reach, higher impact
Int J Biol Sci 2010; 6(7):627-638. doi:10.7150/ijbs.6.627 This issue Cite
Research Paper
Gene Expression Profiling of Skeletal Muscle of Nursing Piglets
Caode Jiang* ![]() , Ping Shi*, Shun Li, Ranran Dong, Jiawei Tian, Jin Wei, Shuang Luo
, Ping Shi*, Shun Li, Ranran Dong, Jiawei Tian, Jin Wei, Shuang Luo
School of Life Science, Southwest University, Chongqing 400715, China
*These authors contributed equally to this work
Received 2010-8-20; Accepted 2010-9-30; Published 2010-10-11
Abstract
To gain insight into the regulation mechanism associated with the rapid gain in skeletal muscle during neonatal period, gene expression profiles of skeletal muscle of nursing pigs was investigated using Affymetrix Porcine GeneChip. A total of 1094 transcripts were detected as differential expression over time course tested (p<0.01, q<0.05). With combinative use of partitioning around medoid and hierarchical clustering, three clusters of transcripts with distinct temporal expression were defined. Gene functional categories and pathways, particularly involved in cell signaling, cell cycle, cell adhesion, ECM-receptor interaction, glycolysis, protein synthesis and degradation, and intracellular transport, were identified. Moreover, we showed 49 of the differentially expressed genes within published QTL regions or with marked deletion effects. Our study demonstrates previously uncharacterized changes in transcription accompanying early postnatal growth of skeletal muscle of pigs. It has highlighted potential cascades and important candidates for further investigation on controlling of postnatal muscle growth.
Keywords: microarray, gene expression profile, real-time PCR, skeletal muscle, pig
Introduction
Postnatal growth of skeletal muscle, which is achieved mainly by an increase in size (hypertrophy) of existing myofibres, is known to be a major determinant of meat mass. In particular, quality characteristics of the saleable meat are influenced by growth during postnatal period [1]. The relationship between muscle mass and postnatal growth is well illustrated by the observations that domestic pigs selected for muscularity exhibit higher gain in muscle mass resulting mainly from accelerated myofiber hypertrophy and increased protein accretion compared to their wild ancestor [2]. Hence, detailed knowledge of molecular processes that govern postnatal muscle growth as well as myogenesis is of agricultural and medical importance.
The molecular mechanisms for postnatal growth of skeletal muscle have not yet well been elucidated. Previous studies focused investigation on the rapid growth of neonatal skeletal muscle of pigs due to its ability to markedly increase protein synthesis in response to feeding, a response that declines rapidly with development [3]. These works identified components belonging to insulin and amino acid signaling pathways that lead to translation initiation, and examined ontogenic changes in protein abundance and activation of the components that contribute to the developmental changes of muscle protein synthesis. However, the relationship between postnatal muscle growth and gene expression through the analysis of the transcriptome have never been investigated.
This study used Affymetrix Porcine GeneChip to acquire a comprehensive picture of transcriptional adaptations in skeletal muscle of nursing piglets and, subsequently to identity genes that may play important roles in the growth of neonatal skeletal muscle.
Material and Methods
Animals and muscle sample collection
Three boars and three sows from China indigenous breed Rongchang were mated. These boars and sows have no common grandparents. All sows were fed in the same condition (ad libitum access to water and feed containing 16% crude protein) and piglets were weaned at 21 days postnatal. One boar piglet about the same weight from each of the three litters was sacrificed at 0, 7, 14 and 21 days of age, in compliance with national regulations applied in commercial slaughtering. Immediately after slaughter, longissimus dorsi (LD) muscle samples were removed, and frozen in liquid N2 until use. In total, 12 muscle samples were collected (3 biological replicates × 4 stages).
Microarray hybridization and data preprocessing
Total RNA was isolated from frozen tissues (50 mg) using TRIzol reagent (Invitrogen, CA, USA) according to the manufacturer's instructions. Total RNA concentration was assessed by spectrophotometry (OD 260 nm), and purity and integrity of the RNA were determined by the absorbance ratio at 260/280 nm and visualization after agarose gel electrophoresis. The RNA labelling and microarray hybridization were carried out according to the Affymetrix Expression Analysis Technical Manual (Biochip Corporation, Shanghai, China). The arrays were scanned using the Affymetrix Scanner 3000.
Raw data from the .CEL files were converted to gene signal files using MAS 5.0. The expression data were loaded into GeneSpring GX 10.0 software (Agilent Technologies) for data normalization and filtering. Gene detection call (present, marginal and absent) and expression levels of probesets were determined by comparing the perfect match (PM) and mismatch (MM) probe-pair data also in MAS 5.0 (Wolcoxon signed rank test). In our data, if a probeset had more than two present calls at least one age in the triplicate detection data, corresponding transcript was considered as expression in the muscle transcriptome and kept for further analysis.
Statistical analysis of microarray data
Normalized expression data of each transcript was subjected to log2 transformation. An analysis of variance (ANOVA) test was used to identify genes of significant expression over neonatal ages in R software, with age as a fixed effect. QVALUE was used to obtain false-discovery rates (FDR) [4]. As an alternative method for the detection of differentially expressed transcripts, deriving p-value for each probeset was calculated using sampling and residual shuffling permutation approach in R/MAANOVA software [5]. False discover rate (FDR) was controlled by Step-Down method and the FDR-adjusted permutation p-values were estimated following 10000 iterations. The resulting lists of differentially expressed genes for each of both methods were compared for overlaps.
Real-time quantitative RT-PCR
Microarray results for the transcript profiling experiments were validated by real-time quantitative RT-PCR (qRT-PCR), using SYBR® Premix Ex TaqTM II kit (TaKaRa, Japan) on the same RNA samples used for the microarray analyses. Primers were designed on the cDNA sequence to amplify fragments of 99 to 144 bp (Table 1). Reactions were performed in triplicate in a total volume of 25 μl. Melting curve analysis (60-95°C) was used for assessing amplification specificity. A standard curve for analysis of the expression data was derived for each single gene from a serial dilution of the pool of cDNA samples. The endogenous control gene ribosomal protein L32 (RPL32), which showed no significant variation in our microarray data, was used. Relative expression of each gene was determined using the 2-△△Ct method [6]. Statistical analysis was accomplished as described for microarray data. Pearson's correlation coefficient was further calculated for each gene on the normalized data to quantify the consistency between microarray experiments and qRT-PCR.
Primers for qRT-PCR
| Gene symbol | Gene name | GenBank | Primer sequence (5'-3') | Size (bp) |
|---|---|---|---|---|
| CDKN3 | Cyclin-dependent kinase inhibitor 3 | NM_214320 | F: AGCCTATTGAAGATGAACAAACTCC R: CAACCTGGAAGAGCACATAAACC | 100 |
| MEG3 | Maternally expressed 3 | NR_021488 | F: ATAGAGGAGGCAGTCGGCAAA R: GGAGTGCTGTGGGAGAATAAATG | 110 |
| PTEN | Phosphatase and tensin homolog | NM_001143696 | F: GAAGACCATAATCCACCACAGC R: TACACCAGTTCGTCCCTTTCC | 129 |
| PIK3CG | Phosphoinositide-3-kinase, catalytic, gamma polypeptide | NM_213939 | F: GGAATAGGCGACAGACACAATG R: GTTAGCACAAATGGCACCCTCT | 137 |
| PDK1 | Pyruvate dehydrogenase kinase, isozyme 1 | NM_001159608 | F: GTGAAGATGAGTGACCGAGGAG R: CCATAACCAAAACCAGCCAGAG | 134 |
| 4EBP1 | Eukaryotic translation initiation factor 4E binding protein 1 | NM_004095 | F: CTGGAAGAGCTAGAGGACCATTC R: ATGAACACCAGCGGATACCTC | 144 |
| mTOR | Mechanistic target of rapamycin | NM_004958 | F: CTCGTCACTCCTCTCAAC R: CCGCTTCCTTATGGTTCT | 99 |
| RPL32 | Ribosomal protein L32 | NM_001001636 | F: CATACTGTGCTGAGATTG R: CTGGAACTCCTGTCTATT | 141 |
Annotation and cluster analysis
The Affymetrix consensus sequences used for probe design were aligned against human Refseq or nr databases (http://www.ncbi.nlm.nih.gov/blast/). The highest scoring hit was used as the best hit (E-value < e-10). For sequences giving no significant hit, the corresponding TIGR tentative consensus (TC) contig (http://www.tigr.org/tdb/tgi/index.shtml) was used instead and aligned against human Refseq or nr databases again. Affymetrix Porcine GeneChip probes were thus assigned with human accession numbers based on homology. The Database for Annotation, Visualization and Integrated Discovery (DAVID) was used to assign transcripts with Gene Ontology (GO) terms of three categories as well as functional over-representation in the clusters. A term was defined as significant enrichment when it had a Benjamini adjusted p value lower than 0.1. Kyoto Encyclopedia of Genes and Genomes (KEGG) database was used for pathway analysis.
Twelve samples and the transcriptional patterns of differentially expressed genes were hierarchically clustered (HAC) by centroid Cluster 3.0 and TreeView softwares [7]. To determine the optimal number of clusters, a second clustering step using partitioning around medoids (PAM) from the Cluster R package was performed [8]. Only the number of cluster common for both methods were used.
Gene localization and integration in porcine QTL regions
To determine whether the differentially expressed genes could be associated with quantitative trait loci (QTL) regions related to muscle mass, chromosomal localizations of these genes on the porcine genome were determined by the methods described previously [9, 10] as well as retrieving from published information. All Affymetrix probesets localized in the flanking markers of QTL regions were downloaded from the PigQTLdb [11].
Results
Differentially expressed transcripts over neonatal ages
After digital processing of the array data, 14364 transcripts (71% of all probesets) were present in the skeletal muscle of nursing pigs, of which 13079, 12836, 12590 and 12609 transcripts were expressed at 0, 7, 14 and 21days of age respectively (GEO accession numbers: GSE22487). Among these expressed transcripts, 1822 transcripts were identified as differential expression over time course by MAANOVA algorithm, while 1327 transcripts by QVALUE algorithm. From these results, 1094 transcripts common to both algorithms were identified as robust differential expression (Supplementary Material, p < 0.01, q < 0.05). These transcripts represented 961 genes and 19 anonymous EST. At this step, the main control genes or the genes that were expressed at the same level during nursing period have been removed from the analysis.
Pair-wise comparisons disclosed that large numbers of transcripts were differentially expressed between any given two ages. In addition, the number of differentially expressed transcripts as well as the value of the average fold changes varied between the four neonatal ages investigated. As shown in Table 2, the most changes in transcription occur between d0 and d7 with up-regulated transcripts predominant over the down-regulated.
Summary of differentially expressed genes
| Change direction | d0 vs d7 | d7 vs d14 | d7 vs d21 | d14 vs d21 |
|---|---|---|---|---|
| up | 285 | 12 | 10 | 8 |
| down | 130 | 28 | 17 | 10 |
| all | 415 | 40 | 27 | 16 |
| Average fold change | 6.85 | 2.57 | 3.39 | 2.50 |
The differentially expressed genes of more than two fold changes in expression were counted. Values of distinct probes representing the same gene were averaged.
Validation of microarray data by qRT-PCR
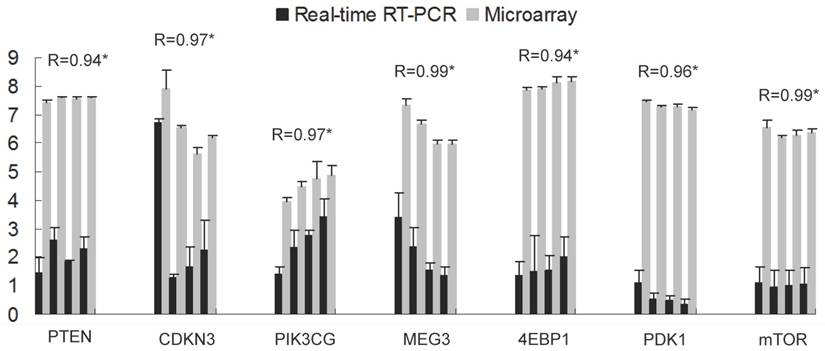
Seven genes were selected to validate the microarray results by qRT-PCR. The gene set included two genes of differential expression (CDKN3, MEG3) and five additional genes present on the array but not significant difference, of which four genes belongs to insulin signaling pathway leading to translation initiation (PTEN, PDK1, 4EBP1, mTOR) and one is an important modulator of extracellular signals (PIK3CG). As expected, expression patterns of these genes were in well agreement with the data of microarray analysis (Pearson correlation coefficient > 0.94, Fig. 1), demonstrating the reliability of microarray analysis.
Validation of the Microarray data by qRT-PCR of seven genes. The x-axis represents the genes and the y-axis shows the relative gene expression (mean ± s.e.). For each gene from left to right, bars display the transcript levels at d0, d7, d14 and d21 respectively, with four from real-time PCR (black) and four from microarray (grey). R indicates the Pearson correlation coefficient. * shows significance level at p<0.05.
Temporal changes of differentially expressed genes
To analyze how the 1094 differentially expressed transcripts could classify the muscle samples of the four ages, a clustering of the twelve arrays was performed with the combinative use of PAM and HAC. The arrays could be divided into 3 distinct classes: three arrays of each age were initially clustered together, then d14 and d21 were clustered together, and d7 and d0 was clustered into a single class respectively (Fig. 2A).
Cluster analysis of differentially expressed genes. (A) Hierarchical cluster based on the data adjustment of median center and normalization. The colour of red, green and black represents expression levels of high, low and absent, respectively. The x-axis of each cluster indicates the neonatal ages, and the y-axis represents the average of log2 transformed expression values. (B) Mean width of clusters given by PAM depending on the number of clusters for transcripts.
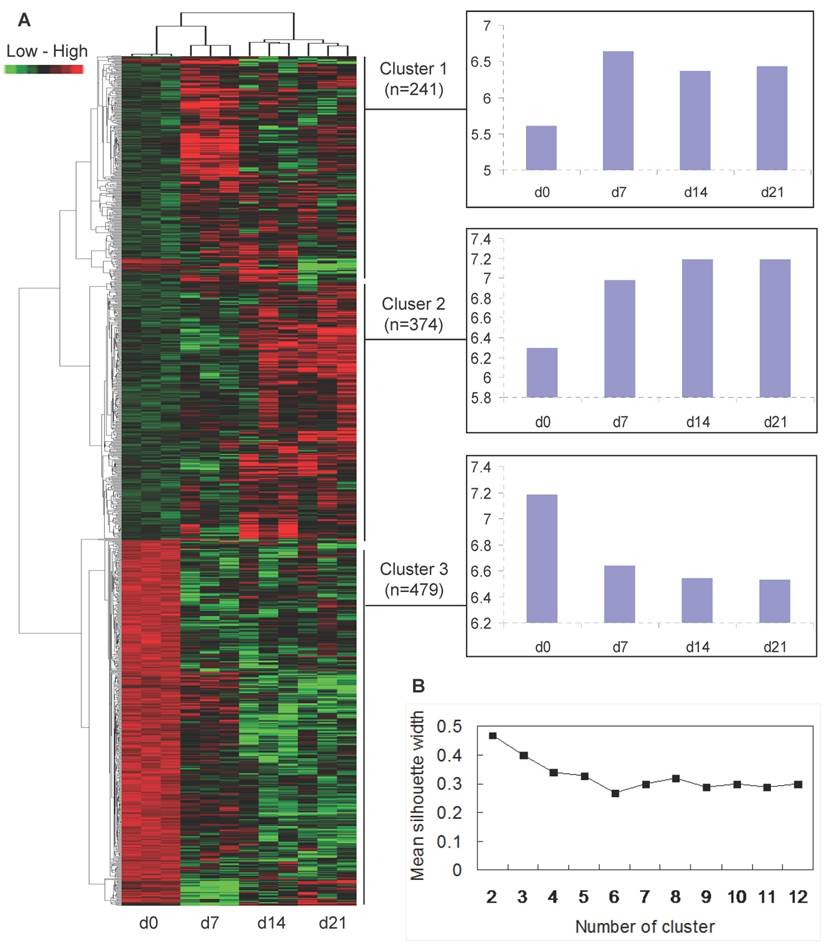
Temporal co-expression classes formed by the 1094 differentially expressed transcripts were further analyzed. Based on the mean silhouette width given by PAM, the best score was 2 classes (Fig. 2B), but this was poorly informative from a physiological point of view. Therefore, the second best score with 3 classes was chosen. As the mean silhouette width for the second best score is 0.4 which means that the structure of clusters given by PAM is weak and could be artificial, only HAC algorithm was used. The HAC analysis also showed 2 main branches (up-regulation versus down-regulation of transcripts after birth), and a threshold was possibly determined to separate 3 clusters (Fig. 2A). Thus, the 1094 differentially expressed transcripts fell into 3 typical expression patterns that gave rise to 3 distinct clusters of genes (Fig. 2A): (i) 241 (22%) transcripts showing increased expression after birth, with the highest expression levels at 7 days of age (cluster 1); (ii) 374 (34%) transcripts demonstrating increasing expression levels over time course (cluster 2); and (iii) 479 (44%) transcripts down-regulated after birth (cluster 3).
GO and pathway analysis
GO classification on the basis of the biological processes showed that certain functional categories of genes were over-represented in each temporal expression cluster. Genes enriched in cluster 1 were mainly related to intracellular signaling cascade and cell cycle. Cluster 2 was specially enriched in homeostatsis and monosaccharide metabolism. The over-representation of GO terms in cluster 3 highlighted genes representing macromolecule metabolism, cell cycle and intracellular transport. Genes representing a number of functional categories based on cellular component were also enriched in specific clusters. For example, genes involved in myofibril and mitochondrion were enriched in cluster 2 and 3 respectively, whereas non-membrane-bound lumen genes in both cluster 1 and 3. Although functional groups of genes for molecular function showed no significant enrichment in cluster 1 and 2, ribonucleotide and nucleoside binding were indeed over-represented in cluster 3. For the detailed top 10 categories of the three processes refer to Table 3 and 4.
The top 10 GO terms of biological process and cellular component enriched in each cluster
| Cluster 1 | Cluster 2 | Cluster 3 | ||||
|---|---|---|---|---|---|---|
| GO term | % | GO term | % | GO term | % | |
| Biological process | intracellular signaling cascade | 15 | response to organic substance | 9 | RNA processing | 12 |
| cell cycle | 13 | homeostatic process | 9 | mRNA metabolic process | 8 | |
| cell cycle process | 11 | positive regulation of cell communication | 7 | negative regulation of macromolecule metabolism | 9 | |
| mitotic cell cycle | 10 | protein complex biogenesis | 7 | mRNA processing | 8 | |
| cell cycle phase | 10 | protein complex assembly | 7 | cell cycle | 8 | |
| macromolecular complex subunit organization | 10 | positive regulation of signal transduction | 6 | positive regulation of macromolecule metabolism | 8 | |
| macromolecular complex assembly | 10 | chemical homeostasis | 6 | RNA splicing | 7 | |
| negative regulation of macromolecule metabolism | 10 | hexose metabolism | 6 | regulation of cellular protein metabolic process | 7 | |
| chromosome organization | 9 | monosaccharide metabolism | 6 | intracellular transport | 7 | |
| M phase | 8 | glucose metabolism | 5 | cellular macromolecule catabolism | 7 | |
| Cellular component | non-membrane-bounded organelle | 29 | cytosol | 14 | membrane-enclosed lumen | 22 |
| intracellular non-membrane- bounded organelle | 29 | cell fraction | 11 | non-membrane-bounded organelle | 21 | |
| cytoskeleton | 16 | organelle membrane | 10 | intracellular non-membrane- bounded organelle | 21 | |
| cytoskeletal part | 13 | actin cytoskeleton | 4 | intracellular organelle lumen | 21 | |
| chromosome | 11 | myofibril | 3 | organelle lumen | 21 | |
| microtubule cytoskeleton | 11 | contractile fiber part | 3 | nuclear lumen | 17 | |
| chromosomal part | 10 | contractile fiber | 3 | cytosol | 17 | |
| microtubule | 7 | membrane raft | 3 | mitochondrion | 16 | |
| chromatin | 5 | sarcomere | 3 | organelle membrane | 10 | |
| spindle | 5 | MHC protein complex | 2 | ribonucleoprotein complex | 10 | |
The top 10 GO terms of molecular function enriched in cluster 3
| GO term | % |
|---|---|
| purine nucleotide binding | 17 |
| purine ribonucleotide binding | 17 |
| ribonucleotide binding | 17 |
| adenyl nucleotide binding | 17 |
| purine nucleoside binding | 16 |
| nucleoside binding | 16 |
| adenyl ribonucleotide binding | 16 |
| RNA binding | 15 |
| ATP binding | 15 |
| cellular macromolecule catabolism | 7 |
KEGG pathway assignments were also enriched in each expression pattern cluster (Table 5). Focal adhesion, ECM-receptor interaction and Cell adhesion molecules were over-represented in cluster 1. Cluster 2 included Glycolysis/Gluconeogenesis, Calcium signaling and Insulin signaling pathways. And cluster 3 enriched in Spliceosome, Proteasome and Aminoacyl-tRNA biosynthesis pathways.
Genes belonging to KEGG pathways enriched in each cluster
| Cluster 1 | Count | Pvalue | Cluster 2 | Count | Pvalue | Cluster 3 | Count | Pvalue |
|---|---|---|---|---|---|---|---|---|
| Focal adhesion | 7 | 3.15E-2 | Glycolysis/Gluconeogenesis | 10 | 1.26E-5 | Spliceosome | 22 | 1.08E-11 |
| ECM-receptor interaction | 5 | 3.77E-2 | Calcium signaling pathway | 12 | 3.15E-3 | Proteasome | 14 | 1.57E-10 |
| Cell adhesion molecules | 6 | 4.88E-2 | Insulin signaling pathway | 10 | 5.67E-3 | Aminoacyl-tRNA biosynthesis | 7 | 7.37E-4 |
| Gap junction | 7 | 2.16E-2 | Ribosome | 7 | 3.00E-2 |
Genome mapping and deletion effect of the differentially expressed genes
To disclose the importance of the 1094 differentially expressed transcripts for neonatal muscle development and growth, we first searched for previous information and found that 115 genes also showed differential expression between muscles with distinct treatments or muscularity. Then, co-localization of these genes with known QTLs related to muscle mass were determined using their flanking genetic markers. The mouse homologous IDs were further used to search the MGI database for gene deletion effects. Thereby, 27 genes were found to be localized within porcine QTL chromosomal regions, and 37 have marked deletion effects in mice (Table 6). The traits associated with these QTLs included production (8 genes) and meat quality (19 genes), while the deletion effects are related to muscle phenotypes (11 genes) and neonatal lethality (3 genes) as well as embryonic and postnatal growth (7) and body weight and size (16 genes).
Genes showing co-localizatin with QTL regions or deletion effects
| Gene | QTL (chromosome/flank) | Deletion effect | Samples for differential expression | Ref. |
|---|---|---|---|---|
| Cytoskeleton, muscle contraction and extracellular matrix | ||||
| GAMT | LMA (2/MYOD1-SW395) | decreased body weight | cultured myotubes and skeletal muscle biopsies | [38] |
| ANKRD2 | weight gain | |||
| PLEC1 | decreased muscle weight | skeletal muscle of burned children and controls | [39] | |
| TNNC1 | abnormal cardiac muscle morphology | LD of neonatal Duroc and Taoyuan pigs | [40] | |
| COL4A1 | embryonic growth retardation | |||
| CRYAB | abnormal skeletal muscle fiber morphology | |||
| CSRP3 | enlarged myocardial fiber | skeletal muscles of ankle fracture patients and healthy volunteers | [41] | |
| TTN | TEND (2/SWR308) | decreased embryo size | ||
| MYL2 | abnormal cardiac muscle contractility | red and white muscle of pigs | [42] | |
| CASQ2 | ADG (4/SW512-SW58) | increased cardiac muscle contractility | ||
| Cell signaling | ||||
| PPP2CA | decreased embryo size | skeletal muscle of ankle fracture patients and healthy volunteers | [41] | |
| IRS1 | decreased body size | |||
| MAPK6 | ADG (1/S0312-SW2166) | neonatal lethality | ||
| EGF | postnatal growth retardation | red and white muscle of pigs | [17] | |
| GHR | LMA (16/SW419-S0077) | decreased body weight | cultured myotubes and skeletal muscle biopsies | [38] |
| S100A1 | BFM (4/SW1967-SW512) | decreased cardiac muscle contractility | ||
| CSNK2A1 | decreased body length | red and white muscle of pigs | [42] | |
| Protein synthesis, proteolysis, and protein transport | ||||
| MEF2C | WHC (2/SW1564-SW1370) | decreased cardiac muscle contractility | red and white muscle of pigs | [17] |
| GATA6 | 21DWT (6/S0146-S0003) | embryonic growth retardation | ||
| RPL35A | LOINWT (13/S0068- SW398) | LD muscle of Landrace and Tongcheng pigs | [43] | |
| RPL36A | ADG (1/S0313-S0082) | |||
| IGF2 | LMA (2/S0141- SW240) | abnormal postnatal growth | ||
| PKB | high neonatal mortality | hypertrophy and unloading muscle | [37] | |
| UBC | TWPLWT(14/SW1125-SW1709) | postnatal growth retardation | cultured myotubes and skeletal muscle biopsies | [38] |
| CAPN3 | decreased body weight | |||
| APP | SHEAR (13/SW398-SW1056) | decreased body size | ||
| PSMC6 | ADG (1/S0313-S0082) | mouse skeletal muscle of myostatin propeptide transgene and wild-type | [27] | |
| Glycolysis and metabolism | ||||
| PGAM2 | DIAMF (18/SW1023) | skeletal muscle of burned children and controls | [39] | |
| ALDH2 | muscle phenotype | LD of cattles divergent for muscle growth and intramuscular fat | [44] | |
| MB | BW (14/S0058-S0007) | |||
| PFKFB3 | embryonic lethality | mouse skeletal muscle of myostatin propeptide transgene and wild-type | [27] | |
| ND6 | abnormal cardiac muscle morphology | LD of neonatal Duroc and Taoyuan pigs | [40] | |
| ATP6V1G1 | LOINWT (1/SW1828-SW1301) | |||
| GPD1 | LOINWT (5/S0018-SW995) | cultured myotubes and skeletal muscle biopsies | [38] | |
| HBB | KHAM (2/SWC9-SW2623) | decreased body size | ||
| PFKM | abnormal muscle physiology | |||
| AMPD1 | LMA (4/S0073-ATP1A2) | LD of Yorkshire and Meishan pigs | [34] | |
| TCAP | muscular dystrophy | LD of pigs with distinct shear force | [10] | |
| Cell cycle, cell growth, and cell death | ||||
| BNIP3L | decreased body weight | cultured myotubes and skeletal muscle biopsies | [38] | |
| CLIP1 | TWPLWT (14/SW1125-SW1709) | |||
| PPP3CB | ADG (14/SW210-S0007) | decreased body weight | ||
| CDK4 | ADG (5/SWR453-SW332) | increased body weight | skeletal muscle from hindlimb suspended mice and controls | [14] |
| RAF1 | embryonic growth retardation | skeletal muscle of ankle fracture patients and healthy volunteers | [41] | |
| IGFBP5 | LMDEP (15/SW1683) | decreased body weight | soleus muscle of overloaded and unloaded mice | [45] |
| IGF1 | postnatal slow weight gain | |||
| Others/unknown | ||||
| B2M | decreased body size | LD of Landrace and Tongcheng | [43] | |
| AQP3 | LEANP (1/SW1092-SW1311) | red and white muscle of pigs | [17] | |
| POPDC3 | ECLC (1/SW1851-S0312) | cultured myotubes and skeletal muscle biopsies | [38] | |
| NUCKS1 | LMA (9/S0109-S0295) | |||
LMA, loin muscle area; TEND, tenderness; ADG, average daily gain; WHC, water holding capacity; 21DWT, body weight (3 weeks); LOINWT, loin weight; TWPLWT, Trimmed wholesale product / live weight; DIAMF, diameter of muscle fibers; BW, body weight; KHAM, knuckle ham weight; SHEAR, shear force; BFM, backfat at mid-back; LMDEP, loin muscle depth; LEANP, lean meat percentage; ECLC, estimated carcass lean content.
Discussion
Our study is the first report on gene expression profiling of skeletal muscle in neonatal pigs before weaning. More than one thousand transcripts displayed differential expression during this period. A number of transcripts were up-regulated and down-regulated (55% vs 44%) after birth. Moreover, the most marked changes in transcription were observed between d0 and d7, with the up-regulated predominant over the down-regulated. These findings suggest the rapid adaption in transcription of neonatal pigs to postnatal muscle growth, and that there may be many genes involved in the development and growth of neoantal skeletal muscle (Table 6).
During postnatal growth, the increase in skeletal muscle mass is mainly due to muscle hypertrophy. This process is accompanied by the proliferative activity of satellite cells, which incorporate new myonuclei to existing myofibers, thus results in an increased DNA content and further provides the machinery for protein deposition [12]. GO analysis demonstrated that genes involving cell cycle were over-represented in both cluster 1 and 3. Genes associated with pathways corresponding to Focal adhesion, ECM-receptor interaction and Cell adhesion molecules were also enriched in cluster 1. The cell cycle is the series of events that take place in a cell leading to its division and replication. ECM components contribute to formation of muscle niche. Specific interactions between cells and the ECM interactions, mediated by transmembrane molecules or other cell-surface-associated components, lead to a control of cellular activities such as adhesion, migration, differentiation, proliferation and apoptosis. Focal adhesions are large, dynamic protein complexes that serve as the mechanical linkages to the ECM, thus play essential roles in important biological processes such as cell motility, proliferation and differentiation. The temporal expression patterns of genes corresponding to these pathways indicate the considerable capacity for satellite cell activities and skeletal muscle development during the first week postnatally, but it begins to decline afterwards, in agreement with recent finding that in mice there is a linear fall in satellite cell numbers at 14 days of age, until the adult number is reached by 21 days [13]. Importantly, several crucial transcription factors in the regulation of cell growth, proliferation and differentiation, such as CDK4, MEF2A, MEF2C, EGF and GATA6, showed differential expression. CDK4 is a member of the cyclin-dependent kinase family, which are key regulatory enzymes of mitotic cell cycle progression. It has reduced expression in the soleus muscle of hindlimb suspended mice [14]. Previous studies have established that the MEF2 genes (MEF2A, -B, -C, -D) are members of the MADS gene family. Their proteins can activate transcription by binding to a conserved A/T-rich sequence in the control regions of numerous muscle-specific genes, and are expressed only in developing muscle with MEF2A and MEF2C being specific to differentiated skeletal and cardiac muscle [15]. In our data, the opposite regulation of MEF2A (up-regulatied) and MEF2C (down-regulated) indicate the nonredundant functions of the MEF2 isotypes as described previously [16]. This notion is further supported by recently finding that expression levels of MEF2C were higher in soleus (a oxidative muscle) than in LD (a fast twitch glycolytic muscle) [17]. Transcripts of GATA6 and EGF were also up-regulated in soleus compared to those in LD [17]. During development GATA6 becomes the only member of the GATA family expressed in vascular smooth muscle cells, and possibly regulate the expression of myosin light chain kinase, calponin and actin in skeletal muscle cells by binding at the consensus sequence (A/T/C)GAT(A/T)(A) [17], while EGF encodes a growth factor that demonstrates its functions by binding to its receptor EGFR. Of particular interest was the increased expression of MSTN and IGFBP5 after birth. MSTN, also known as growth differentiation factor 8 (GDF-8), is a member of the transforming growth factor-β superfamily which has been considered as a novel and unique negative regulator of muscle mass. It inhibits myoblast cell proliferation and differentiation, maintains the satellite cells in a quiescent state by the control of cell cycle progression, and can induce atrophy via an inhibitory effect on translation [18]. IGFBP5 has been postulated to inhibit muscle cell differentiation, and is known to sequester IGF, leading to decreases in protein synthesis [19]. Therefore, all these genes might be the important candidates worth further investigating on controlling neonatal growth and meat quality.
In neonatal pigs, the rapid growth of skeletal muscle is driven by the high rate of protein deposition due to the high fractional rate of protein synthesis, and this rate decreases sharply with age [3]. Indeed, genes related to mRNA processing and protein synthesis were enriched in cluster 3, which showed a developmental decline in expression. As the elevated capacity for muscle protein synthesis is driven by high ribosome content [3], the down-regulation of ribosomal genes also suggests a developmental decline in protein synthesis. Of the ribosome protein genes, RPL15 and RPS7, RPS10 have been reported to be down-regulated from 75-d fetal to 1-wk postnatal muscle samples [20]. Consistently, genes responsible for intracellular transport also showed the decreased expression with age.
In contrast, there was a elevated expression of genes involved in energy metabolism pathway. The elevated energy level was also supported by the high and developmental up-regulation of creatine kinase in muscle (CKM), associated with hypertrophic growth of muscle [21]. Several key genes involved in Glycolysis/Gluconeogenesis pathway, including PFKFB3, GAPDH, PGM1 and PGAM2, also showed the elevated expression. PFKFB3 has been shown as a powerful activator of glycolysis, and a SNP in the 3' untranslated region of the gene is associated with obesity in humans [22]. GAPDH encodes an enzyme that catalyzes the sixth step of glycolysis. In addition to this long established metabolic function, it has recently been implicated in non-metabolic processes, such as initiation of apoptosis [23], and has been reported as up-regulation in skeletal muscle from 75-d prenatally to 1-wk postnatally [20]. PGM1 catalyses the interconversion of glucose-1-phosphate and glucose-6-phosphate in the presence of glucose-1,6-diphosphate and Mg2+, while PGAM2 encodes the muscle subunit of the enzyme that catalyzes the interconversion of 2- and 3-phosphoglycerate. Mutations in PGAM2 cause muscle phosphoglycerate mutase efficiency, also known as glycogen storage disease X, and is associated with ham weight [24]. Together with the decrease in expression of mitochondrial genes, these findings indicate that growth potential of skeletal muscle is associated with increased expression of genes involved in glycolysis as demonstrated previously [25].
Of particular note is the expression patterns of genes belonging to insulin signaling pathway that lead to translation initiation. Components of the pathway and their variation in protein abundance and activation during neonatal period have been well reviewed [3]. The observation that transcript levels of PDK1 and PKB decreased with age in the skeletal muscle of nursing pigs parallels with the developmental decline in the abundance of protein. And, the finding that the expression of 4EBP1 and S6K1 did not change with age is also consistent with previous data. Interestingly, IRS1 showed increased expression levels while mTOR did not change with age, contradicting their developmental decline in protein activation. This may be due to the enhanced Ser/Thr phosphorylation of insulin receptor and IRS1, which plays a critical but negative role in insulin signaling, and involves the development of insulin resistance [26]. Taken together, ontogenic changes in transcript of genes involving insulin signaling pathway in skeletal muscle of neonatal pigs also contribute to the developmental decline in protein synthesis.
The control of protein degradation provides another mechanism for protein deposition in skeletal muscle. There are four proteolytic systems in skeletal muscle, including the proteasome, calpain, caspase and lysosomal system. Proteasomes cleave peptide in an ATP/ubiquitin-dependent process. The addition of ubiquitin to protein during post-translational modification is a key step in protein degradation. In this work, genes involved in proteasome pathway were over-represented in cluster 3. Consistent with this result, several ubiquitin-specific protease (USP) genes, such as USP13 (p=0.038, q=0.17), USP25 (p=0.01, q=0.09), USP34 (p=0.03, q=0.15) and USP44 (p=0.003, q=0.06), which remove ubiquitin from ubiquitylated substrates to rescue them from degradation by the proteasome, were up-regulated with development. Interestingly, expression of CAPN3 and CASP8 increased after birth. CAPN3, a member of caspase family, has reported to be down-regulated in the muscle of transgenic mice expressing myostatin propeptide [27]. It is known to bind specially to titin [10], and mutations in the gene lead to limb-girdle muscular dystrophy type 2A [28]. Moreover, CAPN3 has shown to be a potential major gene or in close linkage disequilibrium with a QTL for muscle growth in chicken [29]. The CASP8 gene encodes a member of the caspase family, which plays a central role in the execution-phase of cell apoptosis. It is well-characterized to initiate an apoptotic pathway triggered by the external stimuli, and there is emerging evidence to indicate that its precursor, procaspase-8, has an important function in cell adhesion and migration [30]. Collectively, these results suggest that enhanced muscle protein accumulation in neonatal pigs is also supported by decreased activities of degradation.
A key finding in our study is that a number of differentially expressed genes co-localized with porcine QTLs. Of the 49 genes listed in Table 6, 15 genes (GAMT, TTN, CASQ2, MAPK6, MEF2C, GATA6, GHR, UBC, HBB, APP, PPP3CB, S100A1, CDK4, IGF2 and IGFBP5) also show marked deletion effects. Especially, a multitude of studies have established that some of these genes have obvious functional relationship with muscle phenotypes or meat quality. For example, together with arginine:glycine amidinotransferase, GAMT is the enzyme required for creatine synthesis that have an important role in the development of embryonic and perinatal skeletal muscle. In the mouse, up-regulation of both genes in mature mdx muscle may help limit the cellular energy failure associated with the absence of dystrophin [31]. IGF2 has been identified as a paternally expressed gene co-localized with a maternally imprinted QTL with major effects on muscle mass and fat deposition [32]. Its effects are further supported by the finding that a mutation in intron 3 is associated with weight of loin and ham, loin eye area, carcass meat percentage and average backfat thickness [33]. It is interesting as the 15 genes might be the candidates for corresponding QTLs. In fact, there are some analogous genes among the others listed in Table 6. For example, AMPD1, which plays a central role in the purine nucleotide cycle and energy metabolism in skeletal muscle of mammals, is associated with loin muscle area, loin muscle height and average backfat thickness [34]. Knockout of TCAP in mice leads to limb-girdle muscular dystrophy type 2G [35], and expression of the gene in porcine skeletal muscle of F2 individuals is correlated with Warner-Bratzler Shear Force [10]. Moreover, Lobjois et al. [10] have revealed that BNIP3L, IGF2 and MEF2A are involved in the network of cell proliferation and myogenic differentiation, that APP, PGAM2 and UBC are involved in the network of energetic metabolism and tissue morphology, and that CAPN3, TCAP and TTN are involved in the network of muscle development and function. In addition, CLIP1 interacts with mTOR [36]. IGF1 have been widely investigated as a candidate gene for growth improvement in both cattle and pig [19]. And PKB can potentially attenuate the loss of muscle mass and function [37]. All these results provide indications of potential important genes that warrant further investigation on postnatal muscle growth and meat quality in pigs.
In summary, our work has identified the global changes in gene expression and functional categories of genes that contribute to early postnatal development and growth of skeletal muscle of pigs. Moreover, we showed 49 of the differentially expressed genes within published QTL regions or with marked deletion effects. Function of many of these genes is not yet well known. The present microarray analysis provided potential cascades and important candidates for further investigation on controlling of postnatal muscle growth and meat quality in pigs.
Supplementary Material
Differentially expressed transcripts and comparisons between ages.
Acknowledgements
This study was supported by Natural Science Foundation Project of CQ CSTC (2009BA1052) and Natural Science Foundation of China (30571331).
Conflict of Interests
The authors declare that no conflict of interest exists.
References
1. Harper GS. Trends in skeletal muscle biology and the understanding of toughness in beef. Aust J Agric Res. 1999;50:1105-1129
2. Rehfeldt C, Henning M, Fiedler I. Consequences of pig domestication for skeletal muscle growth and cellularity. Livest Sci. 2008;116:30-41
3. Davis TA, Suryawan A, Orellana RA. et al. Postnatal ontogeny of skeletal muscle protein synthesis in pigs. J Anim Sci. 2008;86(Suppl 14):E13-E18
4. Storey JD, Tibshirani R. Statistical significance for genome wide studies. Proc Natl Acad Sci USA. 2003;100:9440-9445
5. Cui X, Hwang JT, Qiu J. et al. Improved statistical tests for differential gene expression by shrinking variance components estimates. Biostatistics. 2005;6:59-75
6. Livak KJ, Schmittgen TD. Analysis of relative gene expression data using real-time quantitative PCR and the 2(-Delta Delta C(T) ) Method. Methods. 2001;25:402-408
7. Eisen MB, Spellman PT, Brown PO. et al. Cluster analysis and display of genome-wide expression patterns. Proc Natl Acad Sci USA. 1998;95:14863-14868
8. Smyth GK, Yang YH, Speed T. Statistical issues in cDNA microarray data analysis. Methods Mol Biol. 2003;224:111-136
9. Milan D, Hawken R, Cabau C. IMpRH server: an RH mapping server available on the Web. Bioinformatics. 2000;16:558-559
10. Lobjois V, Liaubet L, SanCristobal M. A muscle transcriptome analysis identifies positional candidate genes for a complex trait in pig. Anim Genet. 2008;39:147-162
11. Hu ZL, Dracheva S, Jang W. A QTL resource and comparison tool for pigs: PigQTLDB. Mamm Genome. 2005;16:792-800
12. Rehfeldt C, Fiedler I, Dietl G. et al. Myogenesis and postnatal skeletal muscle growth as influenced by selection. Livest Prod Sci. 2000;66:177-188
13. White RB, Biérinx AS, Gnocchi VF. et al. Dynamics of muslce fibre growth during postnatal mouse development. BMC Dev Biol. 2010;10:21-31
14. Däpp C, Schmutz S, Hoppeler H. et al. Transcriptional reprogramming and ultrastructure during atrophy and recovery of mouse soleus muscle. Physiol Genomics. 2004;20:97-107
15. Cagnazzo M, te Pas MFW, Priem J. et al. Comparison of prenatal muscle tissue expression profiles of two pig breeds differing in muscle characteristics. J Anim Sci. 2006;84:1-10
16. Naya FJ, Black BL, Wu H. et al. Mitochondrial deficiency and cardiac sudden death in mice lacking the MEF2A transcription factor. Nat Med. 2002;8:1303-1309
17. Yang L, Xu ZY, Li HY. et al. Differential transcriptional analysis between red and white skeletal muscle of Chinese Meishan pigs. Int J Biol Sci. 2010;6:350-360
18. Thomas M, Langley B, Berry C. et al. Myostatin a negative regulator of muscle growth, functions by inhibiting myoblast proliferation. J Biol Chem. 2000;275:40235-40243
19. Jackman RW, Kandarian SC. The molecular basis of skeletal muscle atrophy. Am J Physiol Cell Physiol. 2004;287:C834-C843
20. Zhao SH, Nettleton D, Liu W. et al. Complementary DNA macroarray analyses of differential gene expression in porcine fetal and postnatal muscle. J Anim Sci. 2003;81:2179-2188
21. Louis M, Van Beneden R, Dehoux M. et al. Creatine increases IGF-I and myogenic regulatory factor mRNA in C2C12 cells. FEBS Lett. 2004;557:243-247
22. Jiao H, Kaaman M, Dungner E. et al. Association analysis of positional obesity candidate genes based on integrated data from transcriptomics and linkage analysis. Int J Obes (Lond). 2008;32:816-825
23. Tarze A, Deniaud A, Le Bras M. et al. GAPDH, a novel regulator of the pro-apoptotic mitochondrial membrane permeabilization. Oncogene. 2007;26:2606-2620
24. Fontanesi L, Davoli R, Nanni Costa L. et al. Investigation of candidate genes for glycolytic potential of porcine skeletal muscle: Association with meat quality and production traits in Italian Large White pigs. Meat Sci. 2008;80:780-787
25. Bernard C, Cassar-Malek I, Renand G. et al. Changes in muscle gene expression related to metabolism according to growth potential in young bulls. Meat Sci. 2009;82:205-212
26. Zick Y. Uncoupling insulin signalling by serine/threonine phosphorylation: a molecular basis for insulin resistance. Biochem Soc Trans. 2004;32:812-816
27. Zhao B, Li EJ, Wall RJ. et al. Coordinated patterns of gene expressions for adult muscle build-up in transgenic mice expressing myostatin propeptide. BMC Genomics. 2009;10:305
28. Jia ZC, Petrounevitch V, Wong A. et al. Mutations in calpain 3 associated with limb girdle muscular dystrophy: analysis by molecular modeling and by mutation in m-calpain. Biophys J. 2001;80:2590-2596
29. Zhang ZR, Liu YP, Yao YG. et al. Identification and association of the single nucleotide polymorphisms in calpain 3 (CAPN3) gene with carcass traits in chickens. BMC Genet. 2009;10:10
30. Zhao Y, Sui X, Ren H. From procaspase-8 to caspase-8: Revisiting structural functions of caspase-8. J Cell Physiol. 2010;225:316-320
31. McClure WC, Rabon R, Ogawa H. et al. Upregulation of the creatine synthetic pathway in skeletal muscles of mature mdx mice. Neuromuscul Disord. 2007;17:639-650
32. Van Laere AS, Nguyen M, Braunschweig M. A regulatory mutation in IGF2 causes a major QTL effect on muscle growth in the pig. Nature. 2003;425:832-836
33. Oczkowicz M, Tyra M, Walinowicz K. et al. Known mutation (A3072G) in intron 3 of the IGF2 gene is associated with growth and carcass composition in Polish pig breeds. J Appl Genet. 2009;50:257-259
34. Wang L, Mo X, Xu Y. et al. Molecular characterization and expression patterns of AMP deaminase1 (AMPD1) in porcine skeletal muscle. Comp Biochem Physiol B Biochem Mol Biol. 2008;151:159-166
35. Markert CD, Meaney MP, Voelker KA. et al. Functional muscle analysis of the Tcap knockout mouse. Hum Mol Genet. 2010;19:2268-2283
36. Choi JH, Bertram PG, Drenan R. et al. The FKBP12-rapamycin-associated protein (FRAP) is a CLIP-170 kinase. EMBO Rep. 2002;3:988-994
37. Russell AP. The molecular regulation of skeletal muscle mass. Clin Exp Pharmacol Physiol. 2010;37:378-384
38. Raymond F, Métairon S, Kussmann M. et al. Comparative gene expression profiling between human cultured myotubes and skeletal muscle tissue. BMC Genomics. 2010;11:125
39. Dasu MR, Barrow RE, Herndon DN. Gene profiling in muscle of severely burned children: age- and sex-dependent changes. J Surg Res. 2005;123:144-152
40. Lin CS, Hsu CW. Differentially transcribed genes in skeletal muscle of Duroc and Taoyuan pigs. J Anim Sci. 2005;83:2075-2086
41. Chen YW, Gregory CM, Scarborough MT. et al. Transcriptional pathways associated with skeletal muscle disuse atrophy in humans. Physiol Genomics. 2007;31:510-520
42. Bai Q, McGillivray C, da Costa N. et al. Development of a porcine skeletal muscle cDNA microarray: analysis of differential transcript expression in phenotypically distinct muscles. BMC Genomics. 2003;4:8
43. Tang Z, Li Y, Wan P. et al. LongSAGE analysis of skeletal muscle at three prenatal stages in Tongcheng and Landrace pigs. Genome Biol. 2007;8:R115
44. Lehnert SA, Byrne KA, Reverter A. et al. Gene expression profiling of bovine skeletal muscle in response to and during recovery from chronic and severe undernutrition. J Anim Sci. 2006;84:3239-3250
45. Awede B, Thissen J, Gailly P. et al. Regulation of IGF-I, IGFBP-4 and IGFBP-5 gene expression by loading in mouse skeletal muscle. FEBS Lett. 1999;461:263-267
Author contact
![]() Corresponding author: E-mail: caodejiangcom, Telephone: 086-023-68367543, Fax: 086-023-68252365
Corresponding author: E-mail: caodejiangcom, Telephone: 086-023-68367543, Fax: 086-023-68252365