Impact Factor ISSN: 1449-2288

 Global reach, higher impact
Int J Biol Sci 2011; 7(1):61-73. doi:10.7150/ijbs.7.61 This issue Cite
Research Paper
Prediction of Human Disease-Related Gene Clusters by Clustering Analysis
Peng Gang Sun1 ![]() , Lin Gao1
, Lin Gao1 ![]() , Shan Han2
, Shan Han2
1. School of Computer Science and Technology, Xidian University, Xi'an, 710071, China
2. Faculty of Science, University of Copenhagen, Copenhagen, 1307K, Denmark
Received 2010-10-7; Accepted 2010-12-27; Published 2011-1-14
Abstract
Since genes associated with similar diseases/disorders show an increased tendency for their protein products to interact with each other through protein-protein interactions (PPI), clustering analysis obviously as an efficient technique can be easily used to predict human disease-related gene clusters/subnetworks. Firstly, we used clustering algorithms, Markov cluster algorithm (MCL), Molecular complex detection (MCODE) and Clique percolation method (CPM) to decompose human PPI network into dense clusters as the candidates of disease-related clusters, and then a log likelihood model that integrates multiple biological evidences was proposed to score these dense clusters. Finally, we identified disease-related clusters using these dense clusters if they had higher scores. The efficiency was evaluated by a leave-one-out cross validation procedure. Our method achieved a success rate with 98.59% and recovered the hidden disease-related clusters in 34.04% cases when removed one known disease gene and all its gene-disease associations. We found that the clusters decomposed by CPM outperformed MCL and MCODE as the candidates of disease-related clusters with well-supported biological significance in biological process, molecular function and cellular component of Gene Ontology (GO) and expression of human tissues. We also found that most of the disease-related clusters consisted of tissue-specific genes that were highly expressed only in one or several tissues, and a few of those were composed of housekeeping genes (maintenance genes) that were ubiquitously expressed in most of all the tissues.
Keywords: Disease-related gene cluster, Clustering analysis, PPI network, Gene expression data
Introduction
With the increase in availability of human protein interaction data and gene expression data, the focus of bioinformatics development has shifted from understanding networks encoded by model species to understanding the networks underlying human disease [1]. Predicting human disease-related clusters/subnetworks using a biomolecular network is critical to gain an understanding of disease mechanisms, and is also essential for the development of new diagnostics and therapeutics. Subnetworks are of great importance because they not only provide concrete hypotheses as to the molecular complexes, signaling pathways, but also offer mechanistic hypotheses about the causes of disease [2].
Integrating known disease genes with physical or biomolecular networks and gene expression data to identify disease-related subnetworks can help us explain many genetic and environmental factors influencing a disease in the context of a smaller number of discrete subnetworks as well as the causes or effects of the disease phenotype. In recent years, many studies had shown the utility of these networks in extracting disease-related clusters/subnetworks [2] and inferring disease-causing genes [2, 7-11]. Qiu et al. [3] proposed a method to detect disease-related gene modules or dysfunctional pathways based on global characteristics of interactome coupled with gene expression data. The modules or pathways were inferred based on gene's active score function which was defined based on the kernel trick. They applied the proposed method to two cancer related problems, i.e. breast cancer and prostate cancer, and successfully identified active modules or dysfunctional pathways related to these two types of cancers with literature confirmed evidences. Karni et al. [4] presented an approach to causal gene prediction that was based on integrating PPI network data with gene expression data under a condition of interest. They applied a set-cover-like heuristic to identify a small set of genes that best “cover” the disease-related genes and predicted possible genes that were involved in myasthenia gravis. Calvano et al. [5] assembled an endotoxin inflammatory response network by integrating functional interactions curated from the literature with gene expression information. The response network enabled the identification of new endotoxin-responsive modules. Ghazalpour et al. [6] constructed a gene coexpression network using microarray profiles gathered from the livers of a panel of mice, and plenty of subnetworks in the network were extracted to be enriched for genes in loci with strong associations to a physiological trait, yielding a matrix of module/trait associations. Lage et al. [12] devised a phenotype similarity score and used it to look for protein complexes whose genes were associated with similar phenotypes. Similarly, Fraser et al. [13] showed that identifying human protein complexes containing known disease genes was an efficient method for large-scale disease gene discovery.
In contrast to the above studies, Goh et al. [14] built a network of human disease/ human gene associations, which was a bipartite graph consisting of two disjoint sets of nodes. One set corresponded to all known genetic disorders, whereas the other set corresponded to all known disease genes in the human genome. A disorder and a gene were then connected by a link if mutations in that gene were implicated in that disorder. They found that disease genes causing similar diseases exhibited an increased tendency for their protein products to interact with one another, and tend to be coexpressed in specific tissues [2].
Combining these network-based disease studies, the overriding conclusion is that genes associated with a particular disease tend to exhibit high connectivity and cluster together [2, 14, 15, 16]. Thus, the hypothesis is that disease genes within such dense clusters in a biomolecular network that more likely interact with one another than with others often cause similar diseases and is becoming an increasingly significant factor for hunting human disease-related gene clusters/subnetworks.
In this paper, we tackled the prediction problem by clustering analysis integrating PPI networks and gene expression data, and superimposing a set of known disease genes on human PPI network in a different way. Firstly, we used clustering algorithms, Markov cluster algorithm (MCL) [22, 23], Molecular complex detection (MCODE) [21] and Clique percolation method (CPM) [24] to decompose human PPI network into dense clusters, and then a log likelihood model that integrates multiple biological evidences was proposed to score these dense clusters. Finally, we identified disease-related clusters using these dense clusters if they had higher scores. The efficiency was evaluated by a leave-one-out cross validation procedure. In addition, we also gave a comparison of the clusters decomposed by MCL, MCODE and CPM as the candidates of disease-related clusters.
Materials and Methods
Biological Data
The disease genes data was obtained from Goh et al. [14], and they collected the data from the Online Mendelian Inheritance in Man (OMIM) [17] which contains 1284 disorders and 1777 disease genes. Further, they classified each disorder into 22 primary disease/disorder classes manually based on the physiological system affected by the disorder.
The human protein-protein interaction (PPI) data was also gained from Goh et al. [14], and they combined two high quality systematic yeast two-hybrid experiments [18, 19] with PPIs obtained from literature by manual curation [18]. The integrated set of PPIs contains 22052 non-self-interacting, non-redundant interactions between 7533 genes.
The used gene expression microarray data was from Ge et al. [20], which is available for 36 normal human tissues. A gene is considered to be “expressed” if the P-value associated with its transcript abundance is less than the threshold, P-value<0.02. A gene is considered as housekeeping gene (maintenances gene) if it is expressed, and confidently detectable (P-value<0.01) in most human tissues [20].
Clustering Algorithms
Three classic clustering algorithms used to decompose the human PPI networks into dense clusters are shown in the following:
Molecular complex detection (MCODE) proposed by Bader and Hogue [21] was an effective approach for detecting densely-connected regions in large PPI networks. MCODE made use of local graph density to find protein complex. PPI networks were transformed to weighted graphs in which vertices were proteins and edges represented protein interactions. The algorithm operated in three stages: vertex weighting, complex prediction and optimal post-processing. First it assigned a weight to each vertex, corresponding to its local neighborhood density. Then, starting from the top weighted vertex (seed vertex), it recursively moved outward, including in the cluster vertices whose weight was above a given threshold. This threshold corresponded to a user-defined percentage of the weight of the seed vertex. The results showed that MCODE effectively found densely-connected regions of a molecular interaction network solely based on connectivity data. Many of these regions corresponded to the known molecular complexes.
Markov cluster algorithm (MCL) [22, 23] was a fast and scalable unsupervised clustering algorithm. It was designed to meet the challenge of finding cluster structure in simple and weighted graphs. The MCL algorithm simulated random walks within a graph by the alternation of expansion and inflation operations. Expansion referred to taking the power of a stochastic matrix using the normal matrix product. Inflation corresponded to taking the Hadamard power of a matrix, followed by a scaling step, so that the resulting matrix was again stochastic. Eventually, iterating expansion and inflation resulted in the separation of the graph into different segments.
A novel network clustering method, Clique Percolation Method (CPM) was proposed to reveal the overlapping modules in PPI networks [24]. In CPM, a module was defined as a union of all k-cliques (complete subgraph of size k) that can be reached from each other through a series of adjacent k-cliques (where adjacency means sharing k-1 nodes). This method performed well in detecting overlapping functional modules/protein complexes.
Evaluating Criteria
Disease Related Coefficient (DisRC) is used to evaluate the degree of the cover between the clusters decomposed from human PPI network, and the classes of disease associated genes.
(1)
where, C is the set of genes of a cluster; Di is the set of genes that causing disease, i. |C| and |Di| denote the number of genes in C and Di respectively. DisRC(C) equals the maximal that represents the “best cover”, and C is assigned to the corresponding disease class.
Since disease associated genes which more likely interact with each other often lead to similar disease/disorder, a group of genes associated with the same disease/ disorder should share similar cellular and functional characteristics, as annotated in Gene Ontology (GO) [14, 27]. To investigate its validity, we introduced the Biological Process Related Coefficient (BPRC), Molecular Function Related Coefficient (MFRC) and Cellular Component Related Coefficient (CCRC) of a disease-related cluster, defined as the maximum fraction of genes among those belonging to a disease-related cluster that had same GO annotation in biological process, molecular function and cellular component respectively. Using these criteria, we measured the consistency of each disease-related cluster separately with each branch of GO, biological process, molecular function, and cellular component.
BPRC, MFRC and CCRC are used to score the consistency of genes within disease-related clusters in GO annotations respectively.
(2)
(3)
(4)
where, tjBP denotes the number of genes have same GO annotation, j in biological process. tjMF and tjCC are similar to tjBP.
Disease genes encoding proteins that interact highly with each other tend to be coexpressed in the same human tissues. To measure this, we introduced the Tissue-Related Coefficient (TRC) of a disease-related cluster, defined as the maximum fraction of genes among those belonging to a disease-related cluster that were coexpressed in a specific tissue [14, 20].
TRC quantifies whether genes that are in a disease-related cluster tend to be coexpressed in similar human tissues.
(5)
where, nt denotes the number of genes, that are coexpressed in the tissue, t. If all the genes are coexpressed together in at least one tissue, the maximal value is 1; the minimum value is , when all are coexpressed in different tissues [14].
Our Method
The input to a disease-related cluster prediction problem consists of a human PPI network, the classes of known disease genes based on physiological system affected, and gene expression microarray data. The goal is to identify disease-related clusters.
Since genes associated with similar diseases/disorders show an increased tendency for their protein products to interact with each other through PPIs, we decomposed the human PPI network into dense clusters by clustering algorithms (MCL, MCODE and CPM) as the candidates of disease-related clusters. In order to extract disease-related clusters from these candidate clusters and evaluate the statistical significance of the disease-related clusters in multiple biological evidences, we gave a log likelihood model that was similar to that recently proposed by Sharan et al. [28, 29] to measure the fit of the candidate cluster to a disease-related cluster.
(6)
where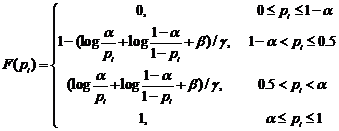 ; the genes within a candidate cluster interact with a high probability α, and this cluster may be suggested as a disease-related cluster that is not random; β,γ are the tuning parameters that are used for normalization; wi=1/|T|; T={DisRC(C);BPRC(C);MFRC(C);CCRC(C);TRC(C)}.
This model integrates multiple biological evidences in T to score the statistical significance of a disease-related cluster. For each candidate cluster C, we calculated the L(C) of the cluster related to a specific disease, and assigned it to the corresponding disease that received the maximal value. A group of genes with a higher score is more significant corresponding to a disease-related cluster than the one with a smaller score.
Eq. 6 can be simplified in the following:
;
;
;
;
;
;
Here, the α was set to 0.9 [28, 29] , and β,γ=2; DisRC ≥ 0.5 which kept 50% genes out of the candidate clusters were known disease genes involving in specific disease. We finally filtered these candidate clusters with L(C) ≥ 0.5 to ensure the statistical significance of disease-related clusters in multiple biological evidences.
Results
Disease-Related Clusters Detection
The biological data involving in disease genes data, human PPI data and gene expression data used by our method for disease-related clusters detection have been discussed beforehand. The three classic clustering algorithms: MCODE (Parameters: Include Loops: false, Degree Cutoff: 2, Node Score Cutoff: 0.2, Haircut: true, Fluff: false, K-Core: 2, Max. Depth from Seed: 100), MCL (Expand: 2.0, Inflation: 2.0) and CPM (3-clques) can be found in the above section. Since our method for disease-related clusters detection made use of the dense clusters decomposed by these clustering algorithms from the human PPI network, in this section, we evaluated our method's performance based on the candidate clusters from each of these clustering algorithms respectively, and by the way, compared these clustering algorithms' performance.
The results for detecting disease-related clusters based on the log likelihood model.
| Methods | No. of clusters | No. of disease-related clusters | |||
|---|---|---|---|---|---|
| cluster size ≥ 3 | L(C) ≥0.5 | Max L(C) | Min L(C) | Avg. L(C) | |
| CPM | 350 | 47 | 1.0 | 0.506 | 0.747 |
| MCODE | 49 | 1 | 0.619 | 0.619 | 0.619 |
| MCL | 1021 | 44 | 1.0 | 0.510 | 0.689 |
In the table, our method detected 47 (47/350=13.43%) disease-related clusters from 350 candidate clusters of CPM with L(C) ≥0.5. Similarly, one (1/49=2.04%) disease-related cluster from 49 candidate clusters of MCODE, and 44 (44/1021=4.31%) disease-related clusters from 1021 candidate clusters of MCL were discovered respectively. The L(C) = 1.0 means that the disease-related clusters achieve perfect support in multiple biological evidences (DisRC, BPRC, MFRC, CCRC, TRC=1.0, simultaneously).
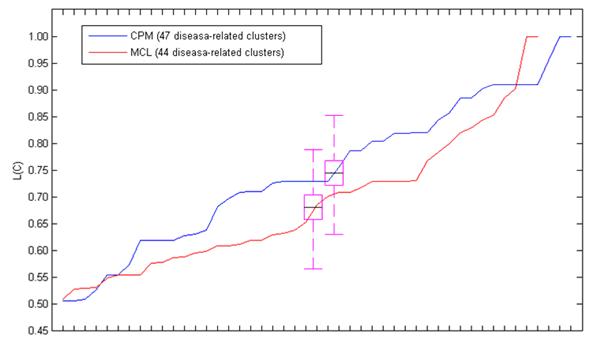
Fig. 1 showed the L(C) of each disease-related cluster in an ascending order. From the figure, we found that most of the disease-related clusters obtained from the candidate clusters of CPM gained higher L(C) than MCL, it was similar to the mean value of L(C). Since only one disease-related cluster was acquired from the candidate clusters decomposed by MCODE, we only discussed MCL and MCODE in this section.
The L(C) of these disease-related clusters in an ascending order. The black line in the purple pane denotes the mean value of the L(C).
Leave-One-Out Cross Validation
To evaluate the performance of our method, we employed a leave-one-out cross validation procedure [29]. In each cross validation trial, we selected k known disease genes that associated with disease-related clusters (128 known disease genes are associated with 47 disease-related clusters of CPM; 130 known disease genes are associated with 44 disease-related clusters of MCL, these k known disease genes are uniformly distributed in the detected disease-related clusters) with equiprobability and removed all the gene-disease associations involving the genes from the data, and our method was evaluated by its success in identifying the disease-related clusters that had been hidden. Given that the disease-related clusters detected above were the putative disease-related clusters. A disease-related cluster was correctly identified if it was assigned to a same disease with the above section. Here, we validated our method to use the disease-related clusters data detected from the candidate clusters of CPM and MCL respectively.
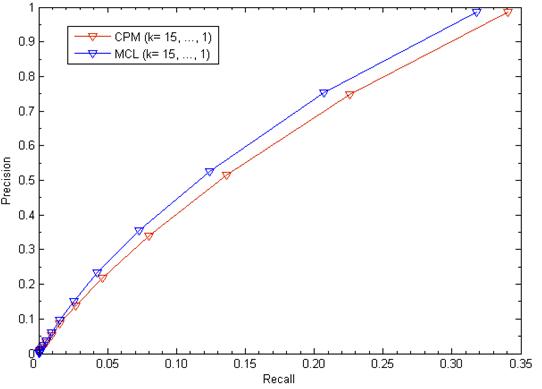
We evaluated our method's performance in terms of precision versus recall when considering various values of k (k= 15,…,1). Precision is the fraction of true disease-related clusters that are correctly detected in the corresponding trial of the cross validation procedure. Recall is the fraction of trials in which the hidden disease-related clusters were recovered. The results were depicted in Fig. 2. For k=1, in using disease-related clusters identified from candidate clusters of CPM, our method achieved a success rate with 98.59% and recovered the hidden disease-related clusters in 34.04% cases when removed one known disease gene and all its gene-disease associations. Similarly, in using disease-related clusters identified from candidate clusters of MCL: Precision = 98.45% and Recall = 31.81%. For 1≤k≤15, we found that the higher the value of k, the lower the value of Precision and Recall.
The leave-one-out cross validation for disease-related clusters detection. The figure shows recall versus precision when considering various values of k.
Statistical Analysis
Table 2 showed the results of the disease-related clusters with different criteria. In the table, the disease-related clusters detected from the candidate clusters of CPM obtained better performance than MCL in DisRC (0.715>0.696), BPRC (0.895>0.805), MFRC (0.697>0.630), CCRC (0.770>0.733) and TRC (0.839>0.771). In these criteria, the minimal average value was 0.630 in MFRC, which showed better enrichment in multiple biological evidences.
The Comparison of disease-related clusters detection.
| Methods | No. of disease-related clusters | Avg. | ||||
|---|---|---|---|---|---|---|
| L(C) ≥0.5 | DisRC | BPRC | MFRC | CCRC | TRC | |
| CPM | 47 | 0.715 | 0.895 | 0.697 | 0.770 | 0.839 |
| MCL | 44 | 0.696 | 0.805 | 0.630 | 0.733 | 0.771 |
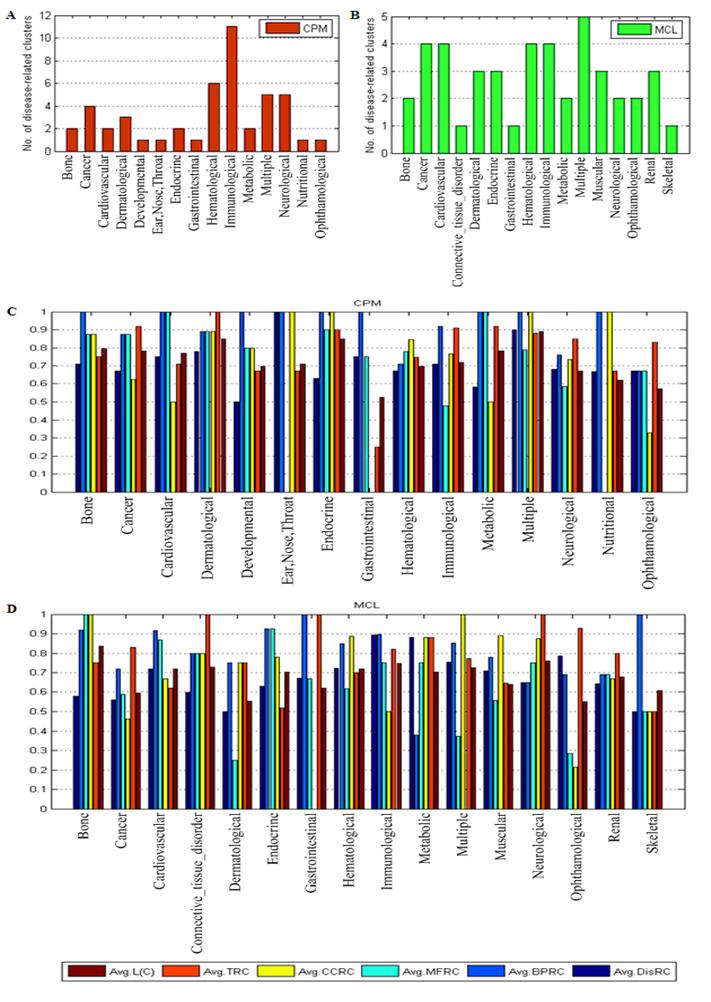
Fig. 3 presented the results of the disease-related clusters at each disease class. In Fig. 3A, 11 disease-related clusters out of 47 associated with disease class: Immunological were detected that was more than other disease classes in CPM. Similarly, In Fig. 3B, 5 disease-related clusters out of 44 related to disease class: Multiple was in MCL. From Fig. 3C and Fig. 3D, in most of the disease classes, we found that the average value of each criterion was above 0.6 which denoted the higher homogeneity of the genes within these disease-related clusters in biological process, molecular function and cellular component of GO, and expression in the same human tissues.
The results of disease-related clusters at each disease class.
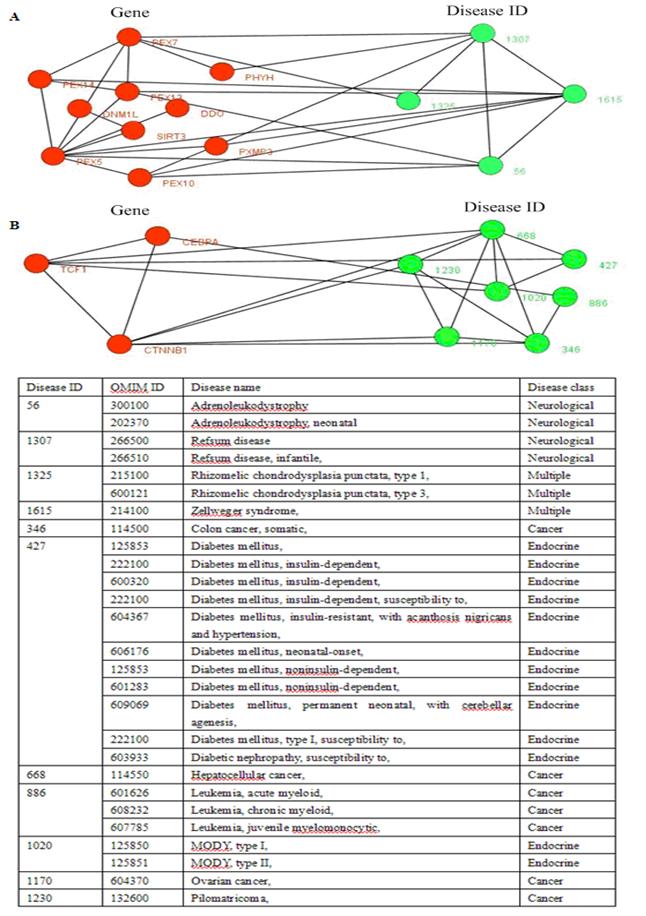
Two disease-related clusters consisting of tissue-specific genes, the red nodes denote genes, and the links between them represent interactions, the emerald green nodes are disease IDs, and the links between them shows they share at least one common disease genes. The link between a gene and a disease ID represents that the gene leads to this disease. The table in the bottom shows the details about diseases, one gene may lead to multiple diseases.
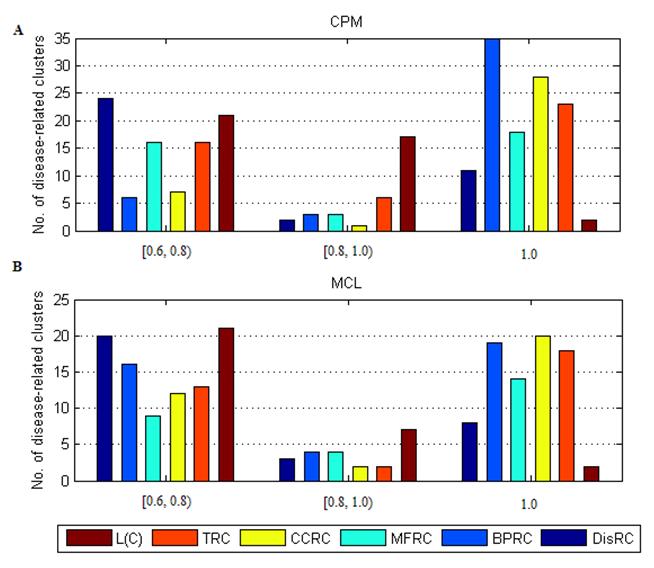
The distribution of disease-related clusters was showed in Fig. 4. From Fig. 4A and Fig. 4B, we found that a common feature that most of disease-related clusters were distributed in DisRC, BPRC, MFRC, CCRC, TRC ∈ [0.6, 0.8), and =1.0, and a few of those were in DisRC, BPRC, MFRC, CCRC, TRC ∈ [0.8, 0.1). In particular, almost 50% of disease-related clusters were in BPRC, MFRC, CCRC, TRC =1.0, which showed that the genes within these disease-related clusters won perfect biological significance in biological process, molecular function and cellular component, and expression in the same human tissues. It was in contrast to L(C), most of disease-related clusters were concentrated in L(C) ∈ [0.6, 0.8) and ∈ [0.8, 0.1), and a few of those were in L(C) =1.0. Since L(C) was an integrated evaluating criterion of DisRC, BPRC, MFRC, CCRC, TRC, it had a different distribution.
The distribution of disease-related clusters at each evaluating criterion.
Tissue-specific genes are only coexpressed in one or several organ, which is in contrast to housekeeping genes (maintenance genes) that are ubiquitously coexpressed in almost tissues [25, 26]. Maintenance genes play key roles in various cellular process, tissue-specific genes are related to the functioning of different organs. Knowing how genes are expressed in normal tissues not only is of fundamental importance for functional genomics, but also might contribute to the study of complex diseases [4, 20, 25, 26].
In the results, most of the disease-related clusters consisted of tissue-specific genes, and a few of those were composed of housekeeping genes (maintenance genes). For example, 9 (9/47=19.15%) disease-related clusters out of 47 consisted of housekeeping genes in CPM, and 5 (5/44=11.36%) disease-related clusters out of 44 were composed of housekeeping genes in MCL.
Fig. 5 showed two disease-related consisting of tissue-specific genes and their corresponding diseases. In Fig. 5B, this disease-related cluster caused Cancer with DisRC=1, BPRC=1, MFRC=1, CCRC=1 and TRC=1, which acquired perfect biological significances. Fig. 6 showed a disease-related cluster that was composed of housekeeping genes (maintenance genes) (see Fig. 6A). From Fig. 6B and Fig. 6C, we found that the genes within this disease-related cluster were coexpressed in most of human tissues with P-value <0.01.
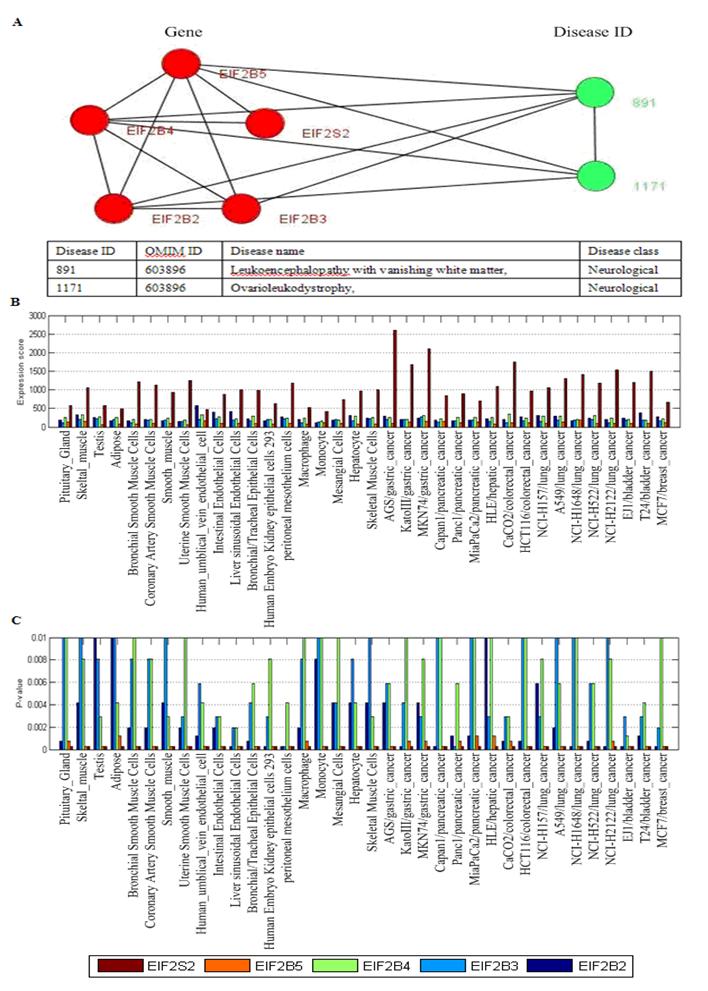
One disease-related cluster consisting of housekeeping genes (maintenance genes). (A) the disease-related cluster and their corresponding disease; (B) the expression levels of the genes in the disease-related cluster; (C) the detected P-value of each gene in human tissues. Note that the maintenances genes should be confidently detectable (P-value<0.01) in most tissues.
Analysis of Disease-Related Clusters
In the results of our experiments, we found a disease-related cluster (PEX1, PEX6, PEX26) involving in disease class, Multiple was detected from both the candidate clusters of CPM and MCL with L(C) =1.0. The PEX1 leads to Zellweger_syndrome (OMIM ID: 266510), Refsum disease (OMIM ID: 214100), Adrenoleukodystrophy (OMIM ID: 202370). Similarly, the PEX6 results in Peroxisomal_biogenesis_disorder, and the PEX26 causes Zellweger_syndrome, Refsum disease, Adrenoleukodystrophy. The proteins within this cluster are also enriched with GO terms: protein import into peroxisome matrix (P-value = 1.38e-09), protein targeting to peroxisome (P-value = 4.19e-09), peroxisomal transport (P-value = 5.23e-09) of biological process, and protein C-terminus binding (P-value = 5.01e-06), protein complex binding (P-value = 2.42e-05) of molecular function, and peroxisomal membrane (P-value = 1.11e-07), microbody membrane (P-value = 1.11e-07), microbody part (P-value = 2.13e-07) of cellular component.
The disease-related clusters (CEBPA, CTNNB1, TCF1) (see Fig. 5B) associated with disease class, Cancer was obtained from the candidate clusters of CPM with L(C) =1.0. The CEBPA is a causal gene of Leukemia, acute myeloid (OMIM ID: 601626), the CTNNB1 causes Colorectal cancer, Hepatoblastoma, Hepatocellular carcinoma (OMIM ID: 114550), Ovarian carcinoma, Pilomatricoma (OMIM ID: 132600), and the TCF1 is associated with Diabetes mellitus, insulin-dependent (OMIM ID: 222100), Diabetes mellitus, noninsulin-dependent (OMIM ID: 125853), Hepatic adenoma (OMIM ID: 142330), MODY, type III (OMIM ID: 600496). This cluster (CEBPA, CTNNB1, TCF1) is also abounded in GO terms: liver development (P-value = 0.00099) of biological process, and specific RNA polymerase II transcription factor activity (P-value = 0.00023) of molecular function, and transcription factor complex (P-value = 0.00232) of cellular component.
A disease-related cluster (NCF2, CYBA, CYBB) involving in disease class, Immunological was gained from the candidate clusters of MCL with L(C) =1.0. The NCF2 is a causal gene of Chronic granulomatous disease due to deficiency of NCF-2, (OMIM ID: 233710), the CYBA causes Chronic granulomatous disease, autosomal, due to deficiency of CYBA (OMIM ID: 233690), and the CYBB is associated with Chronic granulomatous disease, X-linked (OMIM ID: 306400). The cluster is also enriched with GO terms: superoxide anion generation (P-value = 6.44e-09), respiratory burst (P-value = 1.31e-08), superoxide metabolic process (P-value = 3.77e-08) of biological process, and superoxide-generating NADPH oxidase activity (P-value = 5.15e-06), electron carrier activity (P-value = 6.63e-06) of molecular function, and NADPH oxidase complex (P-value = 1.27e-09) of cellular component.
In Fig. 6A, the disease-related cluster consisting of housekeeping genes (EIF2B2, EIF2B3, EIF2B4, EIF2B5, EIF2S2) is associated with Leukoencephalopathy with vanishing white matte and Ovarioleukodystrophy (OMIM ID: 603896). The GO annotation indicates that this cluster takes part in biological process: oligodendrocyte development (P-value = 8.40e-11), oligodendrocyte differentiation (P-value = 2.41e-09), glial cell development (P-value = 3.40e-09), has same molecular function in translation initiation factor activity (P-value = 6.84e-13), translation factor activity, nucleic acid binding (P-value = 1.54e-11), RNA binding (P-value = 6.93e-07), and corresponds to eukaryotic translation initiation factor 2B complex (P-value = 5.28e-14).
Two disease-related clusters involving in BRCA1 (breast cancer 1, early onset) and BRCA2 (breast cancer 2, early onset) were discovered. The BRCA1 is a causal gene of Breast-ovarian cancer, Ovarian cancer, Papillary serous carcinoma of the peritoneum, and the BRCA2 is associated with Breast cancer, male, susceptibility to (OMIM ID: 114480), Fanconi anemia, complementation group D1 (OMIM ID: 605724), Pancreatic cancer (OMIM ID: 260350). We also found a disease-related cluster involving in RAD51A and RAD54L that are associated with several Breast Cancer variants (RAD51A, Breast cancer, susceptibility to, OMIM ID: 114480; RAD54L, Breast cancer, invasive intraductal), and two disease-related clusters, (BUB1B, BUBR1, BUB1) and (MLH1, PMS1, MLH3, MLH3, PMS2), which are associated with several Colorectal Cancer variants.
Discussion
Human disease-related gene clusters/subnetworks are of great importance because they not only provide concrete hypotheses as to the molecular complexes, signaling pathways, but also offer mechanistic hypotheses about the causes of disease [2]. With the development of biological experiment methods, protein interactions and gene expression data are becoming more and more complete, which offer valuable biological materials for disease-related clusters analysis.
The used clustering algorithms such as CPM, MCODE and MCL were initially proposed to identify functional modules or protein complexes − groups of genes within which connections are dense while between which they are sparse, it is consistent with the characteristic of disease-related gene clusters of Goh et al. [2, 14, 15, 16] that disease genes causing similar diseases exhibit an increased tendency for their protein products to interact with each other. We used CPM, MCODE and MCL to decompose human PPI network into dense clusters as the candidates of disease-related clusters. It is analogous to Lage et al. [12] and Fraser et al. [13] who looked for protein complexes whose genes were associated with similar phenotypes and discovered large-scale disease genes.
In previous studies, many methods used PPI networks to uncover novel disease-causing genes [2]. Lim et al. [7] built a PPI network around 23 proteins involved in inherited ataxias using Y2H screens, and used this network in uncovering novel ataxia-causing genes and genetic modifiers for ataxia. Pujana et al. [8] constructed a breast cancer-related network starting with four known breast cancer-associated genes for predicting new genes associated with breast cancer. Oti et al. [9] predicted new disease associated genes that fell within one of the significant loci and had a protein interaction with a gene already known to cause disease. In addition, PPI networks were also employed for disease candidate gene prioritization. Franke et al. [10] used the known molecular interactions and the predicted functional relations to construct a functional human gene network that was used to rank the candidate genes on the basis of their interactions. Chen et al. [11] described a candidate gene prioritization method that was entirely based on PPI network analyses and successfully used for disease candidate gene prioritization. Here, we can also predict novel disease-causing genes based on disease-related gene clusters. Given that the unknown disease genes also cause similar disease with the known disease genes in the identified disease-related clusters, our method predicted 47 new disease genes (SEPT4, UBB, RASD1, FBLN1, GFRA1, SCGB1A1, CFH, C8A, BF, IFNG, GATA4, NKX2-5, F3, PLAU, PKN1, MAG, IGFALS, IGFBP3, IGFBP5, HSPA5, IL7, DIPA, CYCS, IL13RA1, SPTAN1, ABCD1, ABCD2, C1R, HRG, PTX3, CGA, CGB, EXO1, PCNA, C5 MASP1, CD8B1, RSN, MSH4, ADD1, DLAT, PDK1, PDK2, RAC1, EIF2S2, TRAP1, FDX1, EVPL) from the disease-related clusters detected from the candidate clusters of CPM, similarly, 49 new disease genes (SLC8A1, DMC1, RAD51AP1, ERCC1, BMP1, DST, CGA, CGB7, ZC3H11A, MBD4, CRYZ, KIRREL, KIRREL3, TBX5, BMPR1A, BMPR2, BMP6, PCM1, KIAA0368, EDNRA, CTSG, DAPK3, F2RL3, GABRA4, AFAP, HBZ, RLN2, HRG, C1QB, C1QG, SLC4A7, COL5A3, NTHL1, TFPI2, SHOC2, PLCE1, COL3A1, CHAD, NDUFS6, INSRR, CHRNG, PKD2, EIF2S2, TRAP1, GALNT5, PHYH, DNM1L, DDO, SIRT3) of MCL. 3 new disease genes (CGA, EIF2S2, TRAP1) were in both of the above two disease genes sets. Here, we used the disease-related clusters to predict novel disease-causing genes, it not only considered the higher interaction with known disease genes, but also the higher consistency in GO annotations and expression of human tissues, which can give us a believable prediction.
In our paper, the clustering algorithms, CPM, MCODE and MCL for functional modules or protein complexes detection in general were evaluated by analyzing the consistency of genes or proteins within the functional modules in functional annotations. Here, we evaluated these clustering algorithms by decomposing human PPI networks into dense clusters as the candidates of disease-related clusters. We found that the clusters decomposed by CPM outperformed MCL and MCODE as the candidates of disease-related clusters with well-supported biological significance in biological process, molecular function and cellular component of GO and expression of human tissues (see Table 2). In the leave-one-out cross validation procedure, our method obtained better performance in using the disease-related clusters detected from the candidate clusters of CPM than MCL, when removed one known disease gene and all its gene-disease associations. While for 2≤k≤15, MCL gained better results than CPM in Precision (see Fig. 2). It is because the size of disease-related clusters of CPM is smaller than MCL, when we removed known disease genes and all their gene-disease associations in the disease-related clusters, more disease-related clusters' DisRC declined quickly below 0.5 in CPM than MCL, consequently, MCL performed better than CPM.
In conclusion, we integrated known disease genes with human PPI networks and gene expression data to identify disease-related clusters, and our method showed better performance. This study not only can help us understand disease mechanisms and infer new disease-causing genes, but also help us develop new diagnostics and therapeutics. In the future work, we will apply our approach to other species such yeast or fly for disease-related clusters' detection.
Acknowledgements
The authors would like to give kind respect and special thanks to Prof. Yong Gao for proofreading the manuscript and providing valuable comments. This work is supported by the State Key Program of National Natural Science of China (Grant No. 60933009) and the Research Fund for Doctoral Program of Higher Education of China (Grant No. 200807010013).
Conflict of Interests
The authors have declared that no conflict of interest exists.
References
1. Kann M.G. Protein interactions and disease: Computational approaches to uncover the etiology of diseases. Brief. Bioinform. 2007;8:333-346
2. Ideker T, Sharan R. Protein networks in disease. Genome Res. 2008;18:644-652
3. Qiu Y.-Q, Zhang S, Zhang X.-S, Chen L. Detecting disease associated modules and prioritizing active genes based on high throughput data. BMC Bioinformatics. 2010;11:1-13
4. Karni S, Soreq H, Sharan R. A network-based method for predicting disease-causing Genes. Journal of Computational Biology. 2009;16:181-189
5. Calvano S.E, Xiao W, Richards D.R. et al. A network-based analysis of systemic inflammation in humans. Nature. 2005;437:1032-1037
6. Ghazalpour A, Doss S, Zhang B. et al. Integrating genetic and network analysis to characterize genes related to mouse weight. PLoS Genet. 2006;2:1-12
7. Lim J, Hao T, Shaw C. et al. A protein-protein interaction network for human inherited ataxias and disorders of Purkinje cell degeneration. Cell. 2006;125:801-814
8. Pujana M.A, Han J.D, Starita L.M. et al. Network modeling links breast cancer susceptibility and centrosome dysfunction. Nat. Genet. 2007;39:1338-1349
9. Oti M, Snel B, Huynen M.A, Brunner H.G. Predicting disease genes using protein-protein interactions. J. Med. Genet. 2006;43:691-698
10. Franke L, Bakel H, Fokkens L. et al. Reconstruction of a functional human gene network, with an application for prioritizing positional candidate genes. Am. J. Hum. Genet. 2006;78:1011-1025
11. Chen J, Aronow BJ, Jegga AG. Disease candidate gene identification and prioritization using protein interaction networks. BMC Bioinformatics. 2009;10:73-82
12. Lage K, Karlberg E.O, Storling Z.M. et al. A human phenome-interactome network of protein complexes implicated in genetic disorders. Nat. Biotechnol. 2007;25:309-316
13. Fraser H.B, Plotkin J.B. Using protein complexes to predict phenotypic effects of gene. Mutation Genome Biology. 2007;8:252-261
14. Goh K.-I, Cusick M.E, Valle D. et al. The human disease network. PNAS. 2007;104:8685-8690
15. Jonsson P.F, Bates P.A. Global topological features of cancer proteins in the human interactome. Bioinformatics. 2006;22:2291-2297
16. Futreal P.A, Coin L, Marshall M. et al. A census of human cancer genes. Nat. Rev. Cancer. 2004;4:177-183
17. Hamosh A, Scott A.F, Amberger J.S. et al. Online Mendelian Inheritance in Man (OMIM), a knowledgebase of human genes and genetic disorders. Nucleic Acids Res. 2005;33:D514-D517
18. Rual J.-F, Venkatesan K Hao T. et al. Towards a proteome-scale map of the human protein-protein interaction network. Nature. 2005;437:1173-1178
19. Stelzl U, Worm U, Lalowski M. et al. A human protein-protein interaction network: a resource for annotating the proteome. Cell. 2005;122:957-968
20. Ge X, Yamamoto S, Tsutsumi S. et al. Interpreting expression profiles of cancers by genome-wide survey of breadth-of-expression in normal tissues. Genomics. 2005;86:127-141
21. Bader G.D, Hogue C.W. An automated method for finding molecular complexes in large protein interaction networks. BMC Bioinformatics. 2003;4:1-17
22. Dongen S.V. Graph clustering by flow simulation; PhD thesis. Centers for mathematics and computer science, University of Utrecht. 2000
23. Enright A.J, Van Dongen S, Ouzounis C.A. An efficient algorithm for large-scale detection of protein families. Nucleic Acids Res. 2002;30:1575-1584
24. Palla G, Derényi I, Farkas I, Vicsek T. Uncovering the overlapping community structure of complex networks in nature and society. Nature. 2005;435:814-818
25. Warrington J.A, NAIR A, Mahadevappa M, Tsyganskaya M. Comparison of human adult and fetal expression and identification of 535 housekeeping/maintenance genes. Physiol. Genomics. 2000;2:143-147
26. Watson J.D, Hopkins N.H, Roberts J.W, Steitz J.A, Weiner A.M. The functioning of higher eukaryotic genes. Molecular Biology of the Gene. 1965;1:704-713
27. Ashburner M, Ball C.A, Blake J.A. et al. The Gene Ontology Consortium Gene ontology: tool for the unification of biology. Nat. Genet. 2000;25:25-29
28. Sharan R, Ideker T. Modeling cellular machinery through biological network comparison. Nat. Biotech. 2006;24:427-433
29. Vanunu O, Magger O, Ruppin E, Tomer S, Sharan R. Associating Genes and Protein Complexes with Disease via Network Propagation. PLoS Comput. Biol. 2010;6:641-52
Author contact
![]() Corresponding author: psunxidian.edu.cn or lgaoxidian.edu.cn
Corresponding author: psunxidian.edu.cn or lgaoxidian.edu.cn