Impact Factor ISSN: 1449-2288

 Global reach, higher impact
Int J Biol Sci 2011; 7(9):1287-1297. doi:10.7150/ijbs.7.1287 This issue Cite
Research Paper
Protein and Antigen Diversity in the Vesicular Fluid of Taenia Solium Cysticerci Dissected from Naturally Infected Pigs
Marcela Esquivel-Velázquez, Carlos Larralde, Julio Morales, Pedro Ostoa-Saloma ![]()
Instituto de Investigaciones Biomédicas, Universidad Nacional Autónoma de México, Ciudad Universitaria, A.P. 70228, México D.F, 04510, México.
Received 2011-9-1; Accepted 2011-10-1; Published 2011-10-25
Abstract
Cysticercosis caused by Taenia solium is a health threat for humans and pigs living in developing countries, for which there is neither a flawless immunodiagnostic test nor a totally effective vaccine. Suspecting of individual diversity of hosts and parasites as possible sources of the variations of the parasite loads among cysticercotic animals and of the limited success of such immunological applications as well as, we explored and measured both in nine cases of naturally acquired porcine cysticercosis. For this purpose, 2-Dimensional IgG immunoblots were performed by reacting the sera of each cysticercotic pig with the antigens contained in the vesicular fluid (VF) of their own cysticerci. We found an unexpectedly large diversity among the proteins and antigens contained in each of the nine VFs. Also diverse were the serum IgG antibody responses of the nine pigs, as none of their 2D- immunoblot images exhibited the same number of spots and resembled each other in only 6.3% to 65.3% of their features. So large an individual immunological diversity of the cysticercal antigens and of the infected pigs´ IgG antibody response should be taken into account in the design of immunological tools for diagnosis and prevention of cysticercosis and should also be considered as a possibly significant source of diversity in Taenia solium´s infectiveness and pathogenicity.
Keywords: cysticercosis, Taenia solium, 2D-immunoblots, proteome
Introduction
Living organisms are unique [1]. Even among members of a same species, individual differences can be found at several levels, from their external appearance to their genomic makeup. Proliferation, diversification and selection are the main driving forces of nature responsible for individual differences. In the context of infection and immunity, these differences contribute in making some individuals susceptible and others resistant to infection, although to different extents and manners. However, in biological experiments, “noise” (ie an unresolved mixture of experimental and biological fluctuations and significant biological variability) is classically considered a “nuisance” caused by uncontrolled variables and is usually tried to be technically minimized or circumvented by statistical processing of the data. More rarely do biological studies focus on the interpretation of biological variation, because of the difficulties in distinguishing between technical sources from biological ones and from chance alone.
Previous work of our group found in Taenia crassiceps cysticercosis a very large variation in the immunological IgG responses of individual mice to the parasite's antigens which we demonstrated was attributable to differences in the genetic background, sex and individual variation among the infected mice, as well as to variation among the cysticerci contained in each inoculum [2].
Such results in experimental murine T. crassiceps cystiercosis compelled us to look more carefully into the immunological relationship between T. solium cysticerci and their porcine hosts, as a possible source of variation of parasite intensity in cysticercotic pigs [3,4], as well as a feasible explanation for the limited success of immunological diagnosis and prevention of porcine cysticercosis [5-8].
In this study we focused our recently developed system of immunoblot image analysis [2] on the variation in the vesicular fluid´s (VF´s) protein and antigen contents collected from parasites from different naturally infected cysticercotic pigs, as well as in their serum IgG antibodies when displayed by 2D- immunoblots.
Materials and Methods
Animals and parasites
All pigs used for this study (7 females and 2 males of 1-3 years of age) had naturally acquired cysticercosis in their skeletal muscles, as confirmed by macro- and microscopic examination, and all came from geographically separate endemic rural villages of similar economical and social profiles in the States of Morelos and Guerrero, Mexico. Blood samples were obtained from the pigs prior to their sacrifice in accordance with the standards established by the Institutional Committee for the Care and Use of Experimental Animals of the Facultad de Medicina Veterinaria y Zootecnia, Universidad Nacional Autónoma de México [9]. Their sera were then prepared by centrifugation of their clotted blood samples, aliquoted (1 ml each) and frozen at -20°C until use.
Preparation of Taenia solium proteins (VFi)
Cysticerci were dissected from the skeletal muscles of each infected pig removing the host capsule very carefully to avoid rupture of the vesicle. All cysticerci collected from the same pig had the same size and appearance, although these characteristics changed among parasites obtained from different pigs. The vesicular fluid (VF) of the parasites was collected individually by puncturing each cysticercus with a scalpel blade and placed in microcentrifuge tubes containing proteinase-inhibitor cocktail (Amersham). A pool of vesicular fluids (VFi) was constructed from each pig by mixing equal volumes (5-10 µL) of each VF from 15 individual cysticerci within the same pig. The individual VF and VFi were frozen and stored at -20°C until used.
Two-dimensional electrophoreses and immunoblots of VFi preparations
Briefly, 2D- electrophoresis was performed for each one of the VFi preparations. Western Blots were done using the sera from each pig and allowing them to react with the 2D- separated proteins from its corresponding VFi. All experiments were performed by duplicate or triplicate to check for their reproducibility. Those antigen spots (protein spots recognized by serum IgGs) that were not present in the two or three replicas of each VFi were excluded from the study.
Isoelectrofocusing was performed using a Protean IEF Cell (BIO-RAD). VFi (35 µg of protein) in each of the nine preparations was mixed with rehydration buffer containing 6M urea, 2% (w/v) CHAPS, 0.8% (w/v) DTT, 0.8% IPG Buffer and 0.002% (w/v) Bromophenol Blue (all reagents from BIO-RAD). The preparations' samples were loaded onto IPG Strips (pI 3-10 NL, GE Healthcare) using a rehydration/equilibration tray and the IPG strips were then left to rehydrate for 12 hours at room temperature before isoelectric focusing. Isoelectrofocusing was performed for a total of 10,000 Vhrs in three steps: 1) 250 V for 20 min; 2) 4000 V for 2 h; 3) 4000 V until 10,000 Vhrs were reached. The strips were then equilibrated with 0.5% w/v DTT and then with 2.5% w/v iodoacetamide in fresh equilibration buffer (6M urea, 0.375 M Tris-HCl pH 8.8, 2% w/v SDS, 20% v/v glycerol) for 10 min each under constant rocking. The second-dimension electrophoresis was performed in a 5% stacking/12% separating gel in denaturing conditions with constant current (25 mA). The 2D- separated proteins were electrophoretically transferred onto PVDF membranes using a Trans-Blot SD Semy Dry Electrophoretic Transfer Cell (BIO-RAD; 20 V, 1h). To confirm the transference of proteins, membranes were reversible-stained using the MEM-CODE Reversible Stain Kit (PIERCE) followed by blocking with 5% (w/v) skimmed milk powder (Svelty) in PBS+0.3% Tween 20 pH 7.4 (PBS-T) for 16 h at 4°C in constant rocking. Then the membranes were incubated with 1:1000 diluted serum of the corresponding pig in fresh blocking solution (5h, room temperature, constant rocking) followed by four 20 mL washes with PBS-T for 10 min each. Bound antibodies were detected by incubation with rabbit anti-pig IgG (H+L; ZYMED) diluted 1:2500 in PBS-T and incubated for 1 h at room temperature and five washes of 20 mL of PBS-T for 10 min each in order to eliminate unbound antibodies. Detection of second antibody binding was made with DAB substrate (SIGMA; 0.1 mg/ml in PBS-T+ 0.015% peroxide) for 5 min at room temperature and the reaction was stopped by rinsing the membranes three times with tap water.
Image analysis
For the total protein analysis the 2D- reversible-stained membranes were scanned. For the analysis of the antigens the 2D- immunoblots were scanned. In both cases a HP Scanjet G4050 scanner was used at a resolution level of 300 dpi in TIF format. The digitalized images were then analyzed with the PdQuest™ software (Bio-Rad) for the detection of spots. All images were studied with the same settings of brightness, contrast and color to minimize bias.
Statistical analysis
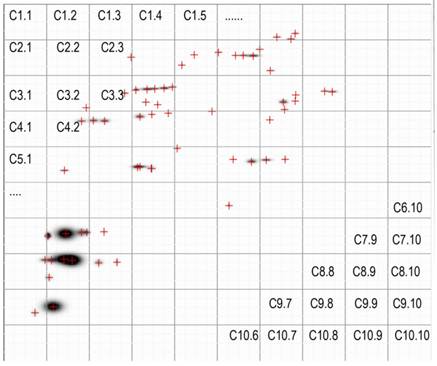
The statistical analysis of the 2D images was made using the IBM® SPSS® Statistics Version 19. Univariate ANOVA was used to study the effect of one independent variable (sex, 2 levels) upon one dependent variable ( Σ spots). To further analyze the 2D-protein images and the 2D-immunoblots, the images were divided by a Grid of 10x10 equidistant columns (pI) and rows (MW, kDa) [10] (Figure 1). To each of the 100 Grid-Cells, a value of one or zero was assigned according to whether there was at least one spot inside the Grid-Cell (1 or positive Grid-Cell) or none (0 or negative Grid-Cell). A SPSS database was then constructed with this binary notation [2]. The positive or negative correlations among Grid-Cells were then estimated by way of a Pearson Correlation. Similarity matrices were computed by Distance Similarity Measure using the Dice Measure. χ2 non-parametric tests were performed to correlate positive Grid-Cells with host sex. Phylogenetical trees were constructed using the Mega5 Software [11] with the data from the similarity matrices. Statistical tests were considered significantly different at P≤0.05 and very significant at P<0.01.
Example of the division of a 2D-immunoblot with a 10x10 Grid and the numbering of each Grid-Cell is presented. The same was done for the 2D-protein images.
Results
2D- VFi protein and immunoblot images
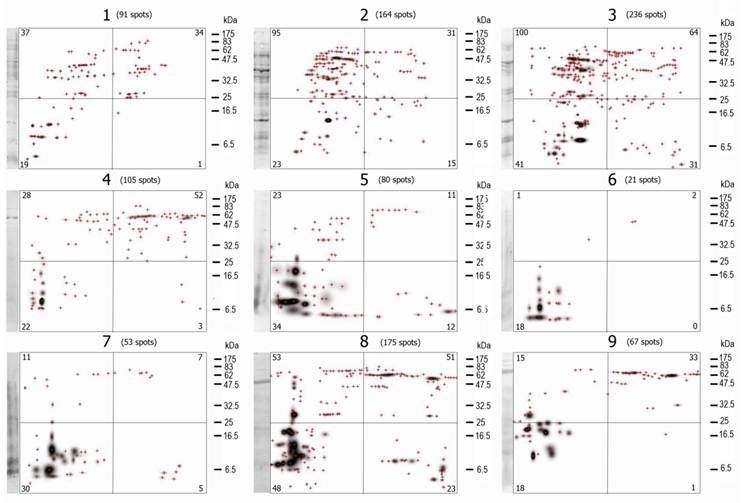
The images of the 2D- separated proteins in the VFi differed greatly from one pig to another, as visual analysis reveals (Figure 2). The Σ of protein spots was also different among the nine VFi (Table 1). There were many individual protein spots shared between the different VFi, but not a single one was found in all the nine.
The PdQuest processed images (master images) of the nine VFi pools separated by 2D- electrophoresis are shown here. Each image corresponds to cysticerci from a different infected pig and each crosshair represents an individual spot. The masters images are divided in 4 parts, the number in the corners of each quadrangle are the number of protein spots inside it. The total number of spots (Σ protein spots) is indicated at the top of each image. Note the similitude and differences among images. Visually there seem to be spots shared by several images. Note also the different number of protein spots in each image. Crosshairs represent spots. The first lane of each image correspond to the 1D-separated proteins.
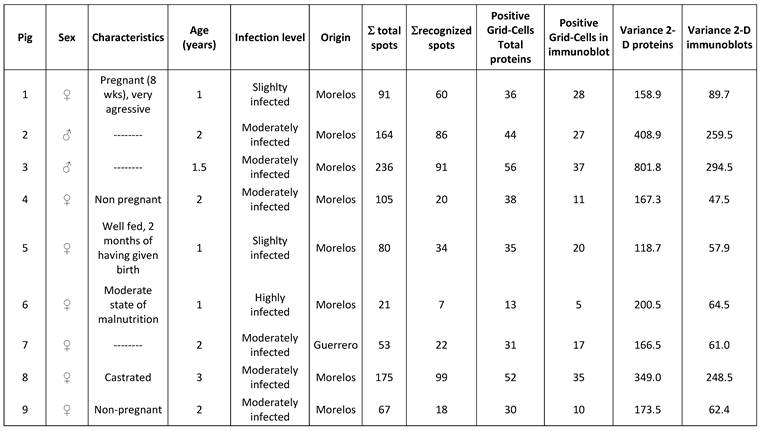
Sex, Σ spots, Positive Grid-Cells and image variance for the 2D- protein images and the 2D- immunoblots from the nine pigs. From the Σ protein spots, only a fraction of them were immunoregonized (Σ antigen spots) which is also reflected in the numbers of Positive Grid-Cells in 2D- protein images compared with 2D-immunoblot images. The variance of the 2D- protein images is higher, as well, than the variance of 2D-immunoblots in every case.
Σ antigen spots analysis
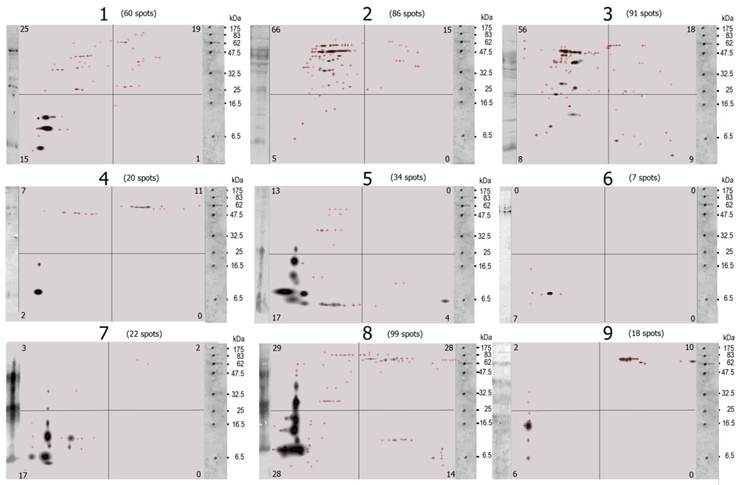
A visual analysis of the 2D- immunoblots suffices to prove that none of the immunoblots are identical and that differences among them are large (Figure 3), although some spots (antigen-antibody complexes) seem to be present in more than one VFi. The first feature analyzed of the 2D- immunoblots was the total number of antigen spots (Σ antigen spots) (Table 1). Not a single immunoblot had the same Σ antigen spots. The differences in the Σ antigen spots were not associated to the sex of the pigs (Table 2) but to the individual pigs. Not a single antigen spot of the nine VFi was found to be recognized by the serum IgGs of all the nine pigs.
The mater images of the PdQuested 2D- immunoblots are shown here. The masters images are divided in 4 parts, the number in the corners of each quadrangle are the number of protein spots inside it. The total number of spots (Σ antigen spots) is indicated at the top of each image. Visually, the diversity of the images is evident. Note also the differences in the number of antigen spots among images and among images' quadrangles. Crosshairs represent individual spots. The first lane of each image correspond to the WB of the 1D-separated antigens.
Univariate ANOVA statistics with Sex as independent variable and Σ spots as dependent variable. (Tests of Between-Subjects Effects).
| Source | Type III Sum of Squares | df | Mean Square | F | Sig. |
|---|---|---|---|---|---|
| Corrected Model | 4102.865a | 1 | 4102.865 | 4.655 | .068 |
| Intercept | 24556.198 | 1 | 24556.198 | 27.862 | .001 |
| Sex | 4102.865 | 1 | 4102.865 | 4.655 | .068 |
| Error | 6169.357 | 7 | 881.337 | ||
| Total | 31491.000 | 9 | |||
| Corrected Total | 10272.222 | 8 |
a. R Squared = .399 (Adjusted R Squared = .314)
Positive Grid-Cells analysis
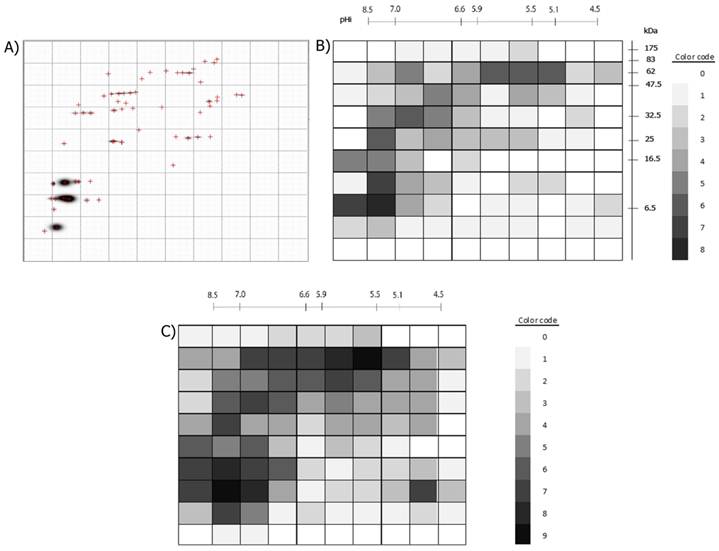
As it occurred for the Σ antigen spots, none of the 2D- immunoblots had the same positive Grid-Cells pattern or the same number of positive Grid-Cells (Table 1). The 2D-immunoblot from pig #6 had only five positive Grid-Cells and was the one with the fewer positive Grid-Cells, while pig #3 had the most positive Grid-Cells with 37. If including the 100 Grid-Cells of the nine pigs, 87 of them were positive in the 2D- protein images, and from them 68 were positive in 2D-immunoblots (68/87=78%). A single Grid-Cell which was positive in all the nine pigs' 2D-immunoblots was not found but there was a Grid-Cell positive in eight of the nine 2D- immunoblots and in the nine 2D- protein images. This Grid-Cell comprised 13 different spots within the range 7.65-8.21 for pI and 5.79-8.59 kDa for Molecular Weight. From these 13 protein spots, nine were immunorecognized by at least one serum and from these nine; only five were recognized by more than one serum, but none by the eight sera that resulted positive for that Grid Cell in 2D-immunoblots. Thus showing that not all pigs' sera recognize the same protein spots within the same Grid-Cells or the same number of antigen spots. The antigen spot within this Grid-Cell which was most frequently recognized, it was so by four of the eight sera. There were another 13 Grid-Cells which were positive in more than 50% of the 2D-immunoblots. From these, two Grid-Cells were positive in seven 2D-immunoblots (Grid-Cell 72: 7.65-8.21 pI and 8.59-12.75 kDa MW; Grid-Cell 81: 8.21-8.78 and 7.79-8.59 kDa MW), but as in the previous case, from the protein spots within these Grid-Cells, none was recognized by the seven sera. The most frequently recognized antigen spot was in Grid-Cell 72 which was recognized by five sera (7.94 pI, 10.68 kDa MW). It should be noticed that there were 24 Grid-Cells (24%) which were positive in only a single serum, representing antigens which are immunorecognized only by single pigs. Figure 4B compiles the nine pigs' positive Grid-Cells and the regions of the 2D-immunoblot in which they mapped. Notice that the most recognized Grid-Cells localize in the left and upper regions of the 2D- immunoblot, which correlates with the regions in which most of the proteins were found in the 2D- protein images (Figure 4C). Consequently, for 100% positive serological immunodiagnosis by 2D- immunoblots of the nine pigs used here it would be necessary to include at least two positive Grid-Cells (Grid-Cell 82: 7.65 - 8.21 pI and 5.79 - 8.59 KDa MW; and any other of these 10 Grid-Cells: 22,23,26-30,34,61 and 81 [eg Grid-Cell 81: 8.21 - 8.78 pI and 5.79 - 8.59 KDa MW]) or at least five different antigen spots (8.13 pI, 8.03 kDa MW; 7.85 pI, 8.03 kDa MW; 8.15 pI, 6.64 kDa MW; 7.99 pI, 5.95 kDa MW; 8.31 pI, 7.81 kDa MW).
A) Example of a processed immunoblot divided by a 10x10 grid. B) The 100 Grid-Cells generated for the 2D-immunoblots are shown. The positive Grid-cells are colored with different intensities, accordingly to if they were recognized by one or more of the nine sera. The color code to the right shows the intensity assigned to each value (number of 2D- immunoblots in which the Grid-Cell was positive). C) Positive Grid-Cells in the 2D- protein images. The color code indicates the numerical value represented by different intensities of gray. Note that the darkest areas in B) correspond to the darkest areas in C) and that some dark areas in C) are less intense in B) or are not colored at all, as not all protein spots are antigenic.
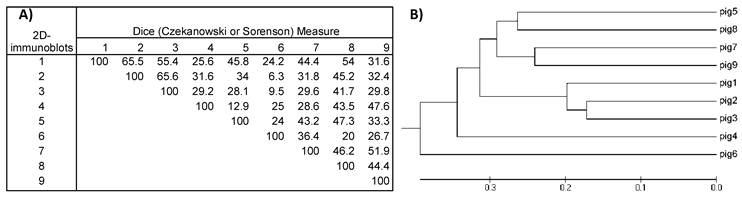
Dividing the protein and antigen 2D-images with a 10x10 Grid allowed the estimation of similarities among the images of the nine VFi taking into account the position in the 2D- images where spots clustered. For this purpose, a similarity matrix was constructed using the database of the positive and negative Grid-Cells. This matrix showed that the similarities of the 2D- protein images ranged between 28-80% (diversity = 72- 20%), while the similarities of 2D- immunoblots ranged between 6.3% and 65.6% (diversity = 93.7- 34.4%), thus revealing the great diversity of the images obtained. The most similar images were the 2D- immunoblots obtained from pigs #2 and #3 (similarity = 65.6%; diversity = 34.4%), followed by pigs #1 and #2, (similarity = 65.5%; diversity = 34.4 %) and the least similar and more diverse were the ones from pigs #2 and #6 (similarity = 6.3%; diversity = 93.7%) (Figure 5), which correlated with the higher and lowest similarities found among the 2D- protein images (Figure 6).
A) Similarity matrix computed for the nine 2D-immunoblot images. Values inside the matrix are the similarity percentages. B) Phylogenetic tree was constructed with the data from the similarity matrix. The 2D- immunoblots from the nine pigs are grouped together according to their resemblance. Note that immunoblots from pig #2 and #3 have the highest value in the similarity matrix (65.6%) and are also the most closely grouped in the phylogenetic tree.
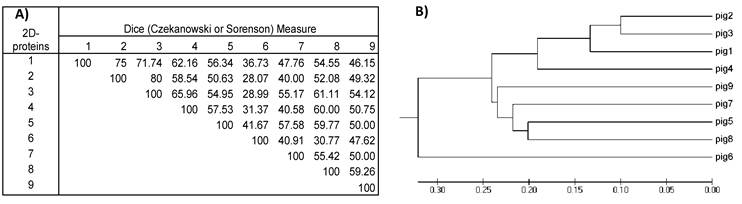
A) Similarity matrix computed for the nine 2D-protein images. Values inside the matrix are the similarity percentages. B) Phylogenetic tree was constructed with the data from the similarity matrix. The 2D- protein images from the nine pigs are grouped together according to their resemblance. Note that, as for 2D-immunoblots, 2D-protein images from pig #2 and #3 have the highest value in the similarity matrix (80%) and are also the most closely grouped in the phylogenetic tree. Comparing this 2D-protein matrix with the 2D- immunoblot matrix from figure 5 in all cases (excepting one) resemblances among 2D-protein images are higher than those from 2D-immunoblots.
To assess if there were positive Grid-Cells that correlated with a particular sex, a paired χ2 test was performed between all the 68 positive Grid-Cells of the 2D- immunoblots with the two categories of sex (male and female). Only one Grid-Cell correlated significantly with sex (p=0.028). This Grid-Cell (4.75 - 5.09 pI and 28.05 - 41.61 MW) was positive in all the males and none of the females, pointing to an antigen (5.05 pI, 39.94 kDa MW) that may be recognized preferentially by one sex over the other.
The correlation of the 2D- Immunoblot Grid-Cells among themselves showed a total of 4950 different correlations from which 151 were significant (3.05% - 141 positive and 10 negative): 49 (41 positive, 8 negative) were significant (p<0.05) and 102 (100 positive, 2 negative) were very significant (p<0.001).
The variances of each 2D- protein and 2D- immunoblot images were calculated to be greater in the 2D- protein images than in the 2D- immunoblots (Table 1).
Discussion
Herein, cysticerci isolated from different naturally infected pigs of rural Mexico were found to express different proteins and antigens in their VFs. The analysis of the 2D- protein images and of the 2D- immunoblots measured their diversity to be of considerable size. No single spot was present in all the 2D- protein images and none of the 2D- immunoblots had the same spot pattern. In fact, no single antigen spot was immunoreconized in all nine immunoblots. From the whole population of different proteins present in the VFi, only a fraction of them were immunorecognized in each VFi (from 19% to 65%).
The differences we found in the proteins and antigens expressed by cysticerci may be due to genetic differences among the parasites, variability of the host and/or a combination of both.
Studies of genetic diversity in Taenia solium have identified two major geographical regions: Asia and Africa/Latin America [12 -14]. Furthermore, genetic differences have been found among cysticerci collected from different pigs in the same locality and also in those from different localities within the same region and country [15, 16]. Moreover, detectable genetic variation was found between the cysticerci isolated from within the same pig, although the variation within was lower than that between pigs [16]: an indication that pigs are infected with eggs shed by a single tapeworm. In this respect it should be noticed that the pigs used herein were collected over a period of time (October 2007-July 2008) and came from different localities of Central Mexico, so it is likely that they were infected with eggs shed by different tapeworms. It is also possible that the differences in the proteins and antigens the cysticerci express in each host at the time of their collection be due to the host itself, since rural pigs differ in many ways (genetic background, age, gender, immunological history, castration, pregnancy, nutritional state, stress condition, social position in the herd, etc), and the parasite has to adapt to the specific conditions it finds in each different host [17 -19].
From the whole Σ antigen spots that were found in 2D- immunoblots some of them were more frequently recognized than others. From these at least five would be necessary to serologically detect all the nine pigs used in this study, as previously stated. These five antigen spots agree in their low molecular weights (5.95 - 8.03 kDa) and their basic isoelectric points (7.85 - 8.31 pI). Two of these antigen spots had a molecular weight of ≈8 kDa, being possible members of the 8kDa family of antigens previously described [20, 21], which have been used for serodiagnosis of cysticercosis. Interestingly, with these two antigen spots of 8 kDa five of the nine pigs (55.5%) can be detected. There is another antigen spot near 8 kDa (7.81 kDa) which is detected by three pigs' serum, two of which also detected one of the other 8 kDa antigens. This antigen spot may be a modified or truncated 8 kDa antigen, differing by little from the other 8 kDa antigen spots. Including this spot, 66.6% of the pigs can be serologically detected. Many authors [22-24] have focused their efforts to develop an immunodiagnostic test for cysticercosis using low molecular antigens (LMA), as these antigens constitute the subunits of larger immunogenic proteins. One of the characteristics of the 2D- electrophoresis is precisely the breakdown of large proteins into their individual subunits. The small changes in Isoelectric Points among antigen spots with the same Molecular Weights account for changes in the glycosilation of presumably the same protein. The diversity found here among protein and antigenic content of different VFi probably be due to differences in the glycosilation patterns of the same protein backbones [25, 26] and/or to different protein backbones. This would explain why neither a single protein spot nor a single antigen spot was found to be shared by the nine 2D- protein and immunoblot images.
Parasite antigenic diversity has seldom been thoroughly studied in Taenia solium, there are only few reports of antigenic differences in Taenia solium cysticerci from different isolates [25 -27]. However, the contribution of its genetic diversity has been suspected as being responsible for the diversity of the clinical presentations of human neurocysticercosis [28, 29] and of porcine cysticercosis [3, 30]. This is a suspicion very much in line with studies in other parasites which have shown that genetic differences among them do have an effect on the immune response of their hosts. The case of Trypanosoma cruzi´s different genotypes eliciting different patterns of humoral immune responses [31] is an example.
The diversity in the protein repertoire of the VFi found in our study is congruently related to the diversity found in the immunological response of the studied pigs, as expressed by their serum IgG antibodies. The extent of these two diversities varied between pigs but protein diversities seemed to resemble more among themselves (53.39%) than did the pigs' immunological perception of them, as displayed by their serum IgG antibodies (43.02%). Because the variance of the images was greater in the 2D- protein images than in the 2D- immunoblots, it would seem reasonable to conclude that not all the proteins in the VF are antigenic for the host. Some of the protein contents of the VFi may be of host origin (complete or degradation products of proteins and Ig's), but in the 2D- immunoblots these contents are very unlikely to be recognized by the serum IgG's as it would imply a wide spectrum autoimmune disorder in the pig. The protein and antigen diversities found in the present study represent different moments of the infection in each host and results may vary over time.
Having found diversity among the infected pigs and the infecting cysticerci is not a great surprise since individual organisms are unique [1] and infection and immunity constitute one of the most prominent and decisive scenarios of species diversification when making some individuals susceptible and others resistant to infection.
The significant correlations found between 2D- immunoblot Grid-Cells showed the diversity of the images as well. From the 4950 different correlations, only the 3% were significant. The biological meaning of these significant correlations is unknown but may be reflecting antigens that favor or block (in the case of negative correlations) the recognition of other antigens, implying that an immunological network may be involved in the way infected pigs recognize cysticerci as cysticercotic mice do with T. crassiceps [2]. If such network exists also in pigs and human, the study of the different interactions between nodes may bring some clues to better understand cysticercosis and may be especially useful in the field of vaccine design, as critical antigens can be selected in and out.
The combined host and parasite immunological diversities described here strengthen the existing hypothesis of the clinical and pathological diversities found in porcine and human T. solium cysticercosis by demonstrating there are indeed significant immunological differences among infected hosts and infecting cysticerci [28, 32, 33].
In more practical matters, cysticerci dissected from the skeletal muscles of cysticercotic pigs are extensively used worldwide as a source of antigens for immunodiagnostic tests [5, 22, 34 -36], vaccine design [7, 37] and pathophysiological studies of porcine and human cysticercosis [38 -41].The diversity of the hosts' immune response and of the VF antigens of the cysticerci can explain why immunodiagnostic tests for cysticercosis usually first claim to have very high sensitivity/specificity scores but, as they are used more widely, their scores tend to lower values [42 -44]. This is so even in some immunotests using synthetic or recombinant proteins, especially if they were first selected on the basis of the antigens expressed by cysticerci dissected from different infected pigs. Rather, the great antigen diversity shown here should advise those interested in the search of new and/or better immunodiagnostic tests or vaccines, to critically select their antigen samples since not all parasites or all hosts will provide with the same results. The use of complex antigen mixtures, such as VFs, as a diagnostic tool in T. solium cysticercosis should be discouraged, while the use of purified antigens should be encouraged.
Acknowledgements
Financial support was provided by Grant #IN204311-3 (P.O.S) from Programa de Apoyo a Proyectos de Investigación e Innovación Tecnológica (PAPITT), Dirección General de Asuntos del Personal Académico, Universidad Nacional Autónoma de México. M.E.V. is recipient of a doctoral scholarship from CONACYT (207061) for her PhD studies in the “Programa de Doctorado en Ciencias Biomédicas (PDCB)” at UNAM.
Conflict of Interests
The authors have declared that no conflict of interest exists.
References
1. Medawar PB. The Uniqueness of Individual. New York, USA: Basic Books. 1957
2. Ostoa-Saloma P, Esquivel-Velázquez M, Ostoa-Jacobo P, Larralde C. Strategies of statistical image analysis of 2D immunoblots: the case of IgG response in experimental Taenia crassiceps cysticercosis. J Immunol Methods. 2009;351(1-2):46-54
3. De Aluja AS, Villalobos AN, Plancarte A, Rodarte LF, Hernández M, Sciutto E. Experimental Taenia solium cysticercosis in pigs: characteristics of the infection and antibody response. Vet Parasitol. 1996;61(1-2):49-59
4. Deckers N, Kanobana K, Silva M, Gonzalez AE, Garcia HH, Gilman RH, Dorny P. Serological responses in porcine cysticercosis: A link with the parasitological outcome of infection. Int J Parasitol. 2008;38(10):1191-8
5. Sciutto E, Martínez JJ, Villalobos NM, Hernández M, José MV, Beltrán C. et al. Limitations of current diagnostic procedures for the diagnosis of Taenia solium cysticercosis in rural pigs. Vet Parasitol. 1998;79(4):299-313
6. Lightowlers MW. Eradication of Taenia solium Cysticercosis: a role for vaccination of pigs. Int J Parasitol. 2010;40(10):1183-92
7. Sciutto E, Fragoso G, de Aluja AS, Hernández M, Rosas G, Larralde C. Vaccines against cisticercosis. Curr Top Med Chem. 2008;8(5):415-23
8. Dorny P, Brandt J, Zoli A, Geerts S. Immunodiagnostic tools for human and porcine cisticercosis. Acta Trop. 2003;87(1):79-86
9. de Aluja AS. Laboratory animals and official Mexican norms (NOM-062-ZOO-1999). Gaceta Médica De México. 2002;138(3):295-298
10. Marengo E, Robotti E, Gianotti V, Righetti PG, Cecconi D, Domenici E. A new integrated statistical approach to the diagnostic use of two-dimensional maps. Electrophoresis. 2003;24(1-2):225-236
11. Tamura K, Peterson D, Peterson N, Stecher G, Nei M, Kumar S. MEGA5: Molecular Evolutionary Genetics Analysis using Maximum Likelihood, Evolutionary Distance, and Maximum Parsimony Methods. Mol Biol Evol. In Press
12. Hancock K, Broughel DE, Moura INS, Khan A, Pieniazek NJ, Gonzalez AE. et al. Sequence variation in the cytochrome oxidase I, internal transcribed spacer 1, and Ts14 diagnostic antigen sequences of Taenia solium isolates from South and Central America, India, and Asia. Int J Parasitol. 2001;31:1601- 7
13. Nakao M, Okamoto M, Sako Y, Yamasaki H, Nakaya K, Ito A. A phylogenetic hypothesis for the distribution of two genotypes of the pig tapeworm Taenia solium worldwide. Parasitology. 2002;124:657-62
14. Ito A, Yamasaki H, Nakao M, Sako Y, Okamoto M, Sato MO. et al. Multiple genotypes of Taenia solium--ramifications for diagnosis, treatment and control. Acta Trop. 2003;87(1):95-101
15. Maravilla P, Souza V, Valera A, Romero-Valdovinos M, Lopex-Vidal Y, Dominguez-Alpizar JL. et al. Detection of Genetic variation in Taenia solium. J Parasitol. 2003;89:1250- 4
16. Bobes RJ, Fragoso G, Reyes-Montes MdelR, Duarte-Escalante E, Vega R, de Aluja AS, Zúñiga G, Morales J, Larralde C, Sciutto E. Genetic diversity of Taenia solium form naturally infected pigs of central Mexico. Vet Parasitol. 2010;168(1-2):130-135
17. Recker M, Buckee CO, Serazin A, Kyes S, Pinches R, Christodoulou Z, Springer AL, Gupta S, Newbold CI. Antigenic variation in Plasmodium falciparum malaria involves a highly structured switching pattern. PLoS Pathog. 2011;7(3):e1001306
18. Rópolo AS, Touz MC. A lesson in survival, by Giardia lamblia. ScientificWorldJournal. 2010;10:2019-31
19. Haag KL, Gottstein B, Ayala FJ. Taeniid history, natural selection and antigenic diversity: evolutionary theory meets helminthology. Trends in Parasitol. 2007;24(2):96-102
20. Hancock K, Khan A, Williams FB, Yushak ML, Pattabhi S, Noh J, Tsang VC. Characterization of the 8-kilodalton antigens of Taenia solium metacestodes and evaluation of their use in an enzyme-linked immunosorbent assay for serodiagnosis. J Clin Microbiol. 2003;41(6):2577-86
21. Ferrer E, Bonay P, Foster-Cuevas M, González LM, Dávila I, Cortéz MM. et al. Molecular cloning and characterisation of Ts8B1, Ts8B2 and Ts8B3, three new members of the Taenia solium metacestode 8 kDa diagnostic antigen family. Mol Biochem Parasitol. 2007;152(1):90-100
22. Lee EG, Bae YA, Kim SH, Díaz-Camacho SP, Nawa Y, Kong Y. Serodiagnostic reliability of single-step enriched low-molecular weight proteins of Taenia solium metacestode of American and Asian isolates. Trans R Soc Trop Med Hyg. 2010;104(10):676-683
23. Atluri SRV, Singhi P, Khandelwal N, Malla N. Neurocysticercosis: immunodiagnosis using Taenia solium cysticerci crude soluble extract, excretory secretory and lower molecular mass antigens in serum and urine samples of Indian children. Acta Trop. 2009;110(1):22-27
24. Sako Y, Nakao M, Ikejima T, Piao XZ, Nakaya K, Ito A. Molecular characterization and diagnostic value of Taenia solium low-molecular-weight antigen genes. J Clin Microbiol. 2000;38(12):4439-44
25. Ito A, Nakao M, Okamoto M, Sako Y, Yamasaki H. Mitochondrial DNA of Taenia solium: From Basic to Applied Science. In: (ed.) Singh G, Prabhakar S. Taenia solium cysticercosis: From Basic to Clinical Science. Wallingford, United Kingdom: CABI. 2002:47-55
26. Sato MO, Sako Y, Nakao M, Yamasaki H, Nakaya K, Ito A. Evaluation of purified Taenia solium glycoproteins and recombinant antigens in the serologic detection of human and swine cysticercosis. J Infect Dis. 2006;194(12):1783-90
27. Yakoleff-Greenhouse V, Flisser A, Sierra A, Larralde C. Analysis of Antigenic variation in cysticerci of Taenia solium. J Parasitol. 1962;68(1):39-47
28. Fleury A, Escobar A, Fragoso G, Sciutto E, Larralde C. Clinical heterogeneity of human neurocysticercosis results from complex interactions among parasite, host and environmental factors. Trans R Soc Trop Med Hyg. 2010;104(4):243-50
29. Campbell G, Garcia HH, Nakao M, Ito A, Craig PS. Genetic variation in Taenia solium. Parasitol Int. 2006;55:S121-6
30. De Aluja AS. Cysticercosis in the pig. Curr Top Med Chem. 2008;8(5):368-74
31. Dos Santos DM, Talvani A, Guedes PM, Machado-Coelho GL, de Lana M, Bahia MT. Trypanosoma cruzi: genetic diversity influences the profile of immunoglobulins during experimental infection. Exp Parasitol. 2009;121(1):8-14
32. Sciutto E, Martínez JJ, Huerta M, Avila R, Fragoso G, Villalobos N, de Aluja A, Larralde C. Familial clustering of Taenia solium cisticercosis in ther rural pigs of Mexico: hints of genetic determinants in innate and acquired resistance to infection. Vet Parasitol. 2003;116(3):223-239
33. Vega R, Piñero D, Ramanankandrasana B, Dumas M, Bouteille B, Fleury A. et al. Population genetic analysis of Taenia solium from Madagascar and Mexico: implications for clinical profile diversity and immunological technology. Int J Parasitol. 2003;33:1479-85
34. Shukla N, Husain N, Jyotsna, Gupta S, Husain M. Comparisons between scolex and membrane antigens of Cysticercus fasciolaris and Cysticercus cellulosae larvae for immunodiagnosis of neurocysticercosis. J Microbiol Immunol Infect. 2008;41(6):529-24
35. Atluri SRV, Singhi P, Khandelwal N, Malla N. Evaluation of excretory secretory and 10-30 kDa antigens of Taenia solium cysticerci by EITB assay for the diagnosis of neurocysticercosis. Parasite Immunol. 2009;31(3):151-155
36. Deckers N, Dorny P. Immunodiagnosis of Taenia solium taeniosis/cysticercosis. Trends parasitol. 2010;26(3):137-44
37. Sciutto E, Aluja A, Fragoso G, Rodarte LF, Hernández M, Villalobos MN. et al. Immunization of pigs against Taenia solium cysticercosis: factors related to effective protection. Vet Parasitol. 1995;60(1-2):53-67
38. Rodriguez S, Dorny P, Tsang VC, Pretell EJ, Brandt J, Lescano AG. et al. Detection of Taenia solium antigens and anti-T. solium antibodies in paired serum and cerebrospinal fluid samples from patients with intraparenchymal or extraparenchymal neurocysticercosis. J Infect Dis. 2009;199(9):1345-52
39. Sciutto E, Chavarria A, Fragoso G, Fleury A, Larralde C. The immune response in Taenia solium cysticercosis: protection and injury. Parasite Immunol. 2007;29(12):621-36
40. Sikasunge CS, Johansen MV, Phiri IK, Willingham AL 3rd, Leifsson PS. The immune response in Taenia solium neurocysticercosis in pigs is associated with astrogliosis, axonal degeneration and altered blood-brain barrier permeability. Vet Parasitol. 2009;160(3-4):242-50
41. Montano SM, Villaran MV, Ylquimiche L, Figueroa JJ, Rodriguez S, Bautista CT. et al. Neurocysticercosis: association between seizures, serology, and brain CT in rural Peru. Neurology. 2005;65(2):229-33
42. Scheel CM, Khan A, Hancock K, Garcia HH, Gonzalez AE, Gilman RH, Tsang VC; Cysticercosis Working Group in Peru. Serodiagnosis of neurocysticercosis using synthetic 8-kD proteins: comparison of assay formats. Am J Trop Med Hyg. 2005;73(4):771-6
43. Prabhakaran V, Rajshekhar V, Murrell KD, Oommen A. Conformation-sensitive immunoassays improve the serodiagnosis of solitary cysticercus granuloma in Indian patients. Trans R Soc Trop Med Hyg. 2007;101(6):570-577
44. Ramos-Kuri M, Montoya RM, Padilla A, Govezensky T, Díaz ML, Sciutto E, Sotelo J, Larralde C. Immunodiagnosis of neurocysticercosis. Disappointing performance of serology (enzyme-linked immunosorbent assay) in an unbiased sample of neurological patients. Arch Neurol. 1992;49(6):633-636
Author contact
![]() Corresponding author: Pedro Ostoa-Saloma, Instituto de Investigaciones Biomédicas, Departamento de Inmunología. Universidad Nacional Autónoma de México. AP 70228, CP 04510. México D.F., México. Tel.: +52 55 56228941. E-mail address: postoamx
Corresponding author: Pedro Ostoa-Saloma, Instituto de Investigaciones Biomédicas, Departamento de Inmunología. Universidad Nacional Autónoma de México. AP 70228, CP 04510. México D.F., México. Tel.: +52 55 56228941. E-mail address: postoamx