Impact Factor ISSN: 1449-2288

 Global reach, higher impact
Int J Biol Sci 2014; 10(4):377-385. doi:10.7150/ijbs.8015 This issue Cite
Research Paper
CNN3 Is Regulated by microRNA-1 during Muscle Development in Pigs
Zhonglin Tang1*, Ruyi Liang1,2*, Shuanping Zhao1, Ruiqi Wang1, Ruihua Huang2 ![]() , Kui Li1
, Kui Li1 ![]()
1. Key Laboratory of Farm Animal Genetic Resources and Germplasm Innovation of Ministry of Agriculture, Institute of Animal Science, Chinese Academy of Agricultural Sciences, Beijing 100193, P.R.China
2. Department of Animal Genetics, Breeding and Reproduction, College of Animal Science and Technology, Nanjing Agricultural University, Nanjing, P.R.China
* Both authors contributed equally to this work.
Received 2013-10-30; Accepted 2014-2-1; Published 2014-3-18
Abstract
The calponin 3 (CNN3) gene has important functions involved in skeletal muscle development. MicroRNAs (miRNAs) play critical role in myogenesis by influencing the mRNA stability or protein translation of target gene. Based on paired microRNA and mRNA profiling in the prenatal skeletal muscle of pigs, our previous study suggested that CNN3 was differentially expressed and a potential target for miR-1. To further understand the biological function and regulation mechanism of CNN3, we performed co-expression analysis of CNN3 and miR-1 in developmental skeletal muscle tissues (16 stages) from Tongcheng (a Chinese domestic breed, obese-type) and Landrace (a Western, lean-type) pigs, respectively. Subsequently, dual luciferase and western blot assays were carried out. During skeletal muscle development, we observe a significantly negative expression correlation between the miR-1 and CNN3 at mRNA level. Our dual luciferase and western blot results suggested that the CNN3 gene was regulated by miR-1. We identified four single nucleotide polymorphisms (SNPs) contained within the CNN3 gene. Association analysis indicated that these CNN3 SNPs are significantly associated with birth weight (BW) and the 21-day weaning weight of the piglets examined. These facts indicate that CNN3 is a candidate gene associated with growth traits and regulated by miR-1 during skeletal muscle development in pigs.
Keywords: CNN3, miR-1, skeletal muscle, development, pig.
Introduction
CNN3 (calponin 3), a member of the CNN gene family, contains similar tandem repeated motifs, and it encodes a thin filament-associated protein which involves in regulation of the contraction/relaxation cycle in muscle cells [1]. CNN3 gene plays an important role in several biological processes, such as the formation, reorganization and disassembly of cytoskeletal structures that contain both actin and myosin [2]. CNN3 can interact with actin, tropomyosin, troponin C and calmodulin, and also inhibit the Mg-ATPase activity of smooth muscle actomyosin [3]. But its detail regulation mechanism during skeletal muscle development was remained unclear.
MicroRNAs (miRNAs) are short single-stranded RNA molecules that regulate gene expression at the post-transcriptional level by binding to the 3'-untranslated regions (3'-UTRs) of messenger RNAs (mRNAs) [4]. Many studies have documented that miRNAs play important roles in cell proliferation, differentiation, apoptosis, tumourigenesis and muscle development [4, 5]. Several miRNAs including miR-1, miR-133a, miR-133b, miR-206, miR-208, miR-208b and miR-486 are specifically expressed in cardiac and skeletal muscle tissues [6-11]. Using deep sequencing of serial developmental skeletal muscles of pigs [12], researchers previously discovered that certain miRNAs, such as miR-1, miR-378 and miR-206, play crucial roles in myogenesis [13]. Recent studies have demonstrated that miR-1 function is required for muscle development. The identification of target genes is essential for understanding the biological function of microRNAs. For example, Chen et al. previously showed that miR-1 promotes myogenesis by targeting the mRNA transcripts of histone deacetylase 4 (HDAC4), a transcriptional repressor of muscle gene expression [14]. Another miRNA, miR-148a, was shown to promote myoblast differentiation by inhibiting the expression of ROCK1 [15]. OLFML3 was identified as a candidate gene for muscle development that is regulated by miR-155 [16]. The expression of more than 30% of all genes is regulated by miRNAs in animals [17]. One miRNA can regulate multiple target genes, and a single gene also can be regulated by several miRNAs within the same tissue. Therefore, it is key to investigate interaction between mRNA gene and miRNA for reveal the biological phenotype. Our previous bioinformatics and miRNA-mRNA expression profiling suggests that CNN3 is potentially involved in skeletal muscle development and regulated by miR-1 in pigs.
To further understand the molecular function and regulation mechanism of CNN3 in swine muscle growth, we analysed the temporal and spatial co-expression patterns of both miR-1 and CNN3 genes. Subsequently, we performed dual luciferase and western blot analyses to validate CNN3 as a miR-1 target. The SNP polymorphisms and association analysis were carried out in an experimental pig population.
Materials and methods
Animals and sample preparation
In this study, each animal procedure followed the protocols that were approved by Hubei province, PR China for the Biological Studies Animal Care and Use Committee and Animal Ethical and Welfare Committee of Nanjing Agricultural of University. The longissimus dorsi muscles were isolated from foetal pigs at gestational days 33, 40, 50, 60, 65, 70, 75, 80, 90 and 100 (E33, E40, E45, E50, E60, E70, E75, E80, E90 and E100, respectively) and from postnatal new-born pigs that were 9, 20, 30, 40 and 60 days old [postnatal day (D)0, D9, D20, D30, D40 and D60] from Landrace and Tongcheng pigs. For each time point, three independent biological replicates were collected. In addition, other tissues, including the heart, liver, spleen, lung, and the kidney from adult sows, were also collected. After isolation, all of the samples were stored immediately in liquid nitrogen for RNA extraction.
Total RNA extraction
Total RNA was isolated from the longissimus dorsi muscles and tissues using the TRIZOL reagent according to the manufacturer's protocols. The total RNA concentrations were determined using spectrophotometry to ensure an OD260/OD280 ratio between 1.8 and 2.0. The integrity of the RNA was assessed by electrophoresis to ensure that the intact 28s and 18s RNAs were visible within the electrophoresis bands.
Real-time PCR
The expression level of miR-1 was detected by stem-loop real-time PCR [18]. RT (Reverse Transcription-Polymerase Chain Reaction) reactions were performed according to the manufacturer's protocols using the RevertAidTM First Strand cDNA Synthesis Kit. The RT reaction mixtures contained 1 µg of total RNA, 2 μl of stem-loop RT primer (miR-1miR-1 reverse primer: 5'-CTCAACTGGTGTCGTGGAGTCGGCAATTCAGTTGAGTACATACT-3'), 4 μl of 5× Reaction buffer, 2 μl of dNTP mixture (10 mmol each), 1 μl of RiboLock TM RNase Inhibitor (20 u/μl) and 1 μl of ReverAidTM M-MuLV Reverse Transcriptase (200 u/μl). The 20 μl reaction mixtures were incubated at 42℃ for 60 min, 70℃ for 5 min, 4℃ for 5 min. After the RT reactions, 2 μl of 1:10 diluted RT product was used in each 20 μl PCR reaction. The PCR reactions were performed using a standard SYBRRPremix Ex TaqTM kit protocol on an ABI PRISM 7500 Sequence Detection System, and the reactions were incubated at 95℃ for 30 s, followed by 40 cycles of 95℃ for 5 s and 60℃ for 34 s. The specificity of the PCR amplification of the cDNA templates was assessed by disassociation melting curves. U6 expression was assayed for normalisation, and all of the reactions were performed in triplicate.
To detect the relative expression level of CNN3 mRNA, real-time PCR was performed on a 1/100 dilution of each cDNA in triplicate for each transcript under the same conditions as for miR-1 above. The PCR primers are shown in Table 1, and the internal reference gene GAPDH was used to normalise the relative quantities of cDNA template. The real-time PCR results were analysed and the relative gene expression values were calculated using the comparative delta-delta Ct method (2-ΔΔCT) [19].
Primer sequence for PCR.
| Gene | Forward primer(5'-3') | Reverse primer(5'-3') | Product (bp) |
|---|---|---|---|
| miR-1 | ACACTCCGAGCTGGAATGTAAAG | CTCAACTGGTGTCGTGGAGTC | 67 |
| U6 | GCTTCGGCAGCACATATACTAAAAT | CGCTTCACGAATTTGCGTGTCAT | 89 |
| CNN3 | AAGCCGGCCAGAGTGTAAT | GAGTTGTCCACGGGTTGTAG | 234 |
| GAPDH | ATGGTGAAGGTCGGAGTGAAC | CTCGCTCCTGGAAGATGGT | 235 |
| P1 | TCGCAACTGGATAGAAGAGG | TTCACCTTCTTCACGGAGCC | 339 |
| P2 | GCCCGGCTCCGTGAAGAAG | AGCGTCGTCTGAACCTGGG | 1260 |
| P3 | ATGACCCAGGTTCAGACGA | CTTCACTCCAATGTCAATG | 452 |
| P4 | CCAGCCAAGCAGGTATGAC | CGAGTTGTCCACGGGTTGTAG | 1646 |
Plasmid Construct
To clone the 3'-UTR of CNN3 downstream of the Renilla Luciferase ORF in the psi-Check2 vector (Promega, USA) for analysis of the CNN3 promoter activity, we first amplified a 689-bp DNA fragment from porcine genomic DNA using PCR primers for the CNN3 3'UTR as follows: 5'-GTTCACGGGGGAGCTCA-3' and 5'-GATACATTGGCACAAACAG-3'. We then cloned this fragment into the psi-Check2 vector using Not I and Xho I. To construct a plasmid expressing the CNN3 for real-time PCR and Western blotting analyses, we used CNN3 coding sequences to replace the Renilla Luciferase ORF of the psi-Check2 vector with the Nhe I and Xho I sites. Similarly, we constructed the CNN3 mutant plasmid by bridging PCR, which deleted binding site between CNN3 and miR-1. All sequences which cloned into the final destination vectors were verified by DNA sequencing.
Cell culture and transfection
Porcine iliac endothelial cells (PIECs) (obtained from the Institute of Biochemistry and Cell Biology, Chinese Academy of Sciences, P. R. China) were grown in DMEM with high glucose (Gibco, USA), supplemented with 10% foetal bovine serum (Gibco, USA), 1% glutamine (Gibco, USA), and 1% penicillin/streptomycin (Gibco, USA). All of the cells were incubated at 37℃ in an incubator supplemented with 5% CO2. Chemically synthetic miR-1 and the negative control (purchased from GenePharma, Shanghai, China) were transfected into PIECs. Each transfection was performed in triplicate. At 36 h after transfection, RNA and protein were extracted for subsequent experiments.
Dual Luciferase Assay
Porcine iliac endothelial cells were seeded into 24-well plates (Corning Incorporated, NY) and transfected with luciferase reporters using the FuGENE® HD Transfection Reagent (Roche) according to manufacturer's protocols. In each well, 100 ng of psi-Check2-CNN3-3'UTR and 20 pmol of miR-1 or negative control were co-transfected accordingly. At 36 h after transfection, the Firefly and Renilla luciferase activities were measured using the dual luciferase assay system (Promega) after lysis of the cells. Each Renilla luciferase signal value was normalised to the Firefly luciferase values, and the values presented are the mean values of triplicates for the target construct.
Western Blot
Total protein was isolated from the PIECs, which were transfected with the indicated plasmids. Western blot analysis was performed as follows: 20 μg of protein was resolved by SDS-PAGE and transferred to PVDF membranes (Millipore). Next, the PVDF membranes were probed with primary antibodies (Calponin 3 (H-55): sc-28546; Santa Cruz Biotech., Santa Cruz, CA) at a 1:1,000 dilution and GAPDH (Santa Cruz; 1:3000 dilution) at a 1:5000 dilution as a control. Lastly, the membranes were further incubated with an HRP-conjugated secondary antibody (Zymed, San Diego, CA) at a 1:10,000 dilution.
SNP Identification and Association Analysis
The DNA fragments of the CNN3 gene were amplified by PCR using P1, P2, P3 and P4 primers (Table 1), and the DNA templates were prepared from Tongcheng, Landrace and Duroc × Yorkshire, Laiwu, Luchuan, and Guizhou pig breeds. The SNP sites were analysed using mass spectrometry by Yuewei company (Beijing, China). Association analyses between breed and traits were performed using individual subject information including breed, nipple number, birth weight and 21 days-weaning weight in both Landrace and Duroc × (Landrace ×Yorkshire) pigs.
Bioinformatic and Statistical analyses
The target prediction tools Targetscan (http://www.targetscan.org/), miRanda (http://www.microrna.org/microrna/home.do) and PicTar (http://pictar.mdc-berlin.de/cgi-bin/new_PicTar_vertebrate.cgi?species=vertebrate) were used to predict candidate targets of microRNA. The experimental data were analysed using SPSS 15.0 and expressed as the means±SE (n=3). One-way analysis and t-tests were used to determine the statistical significance of the differences between groups, where p-values < 0.05 were considered statistically significant.
Results
The co-distribution of CNN3 and microRNA-1 in tissues
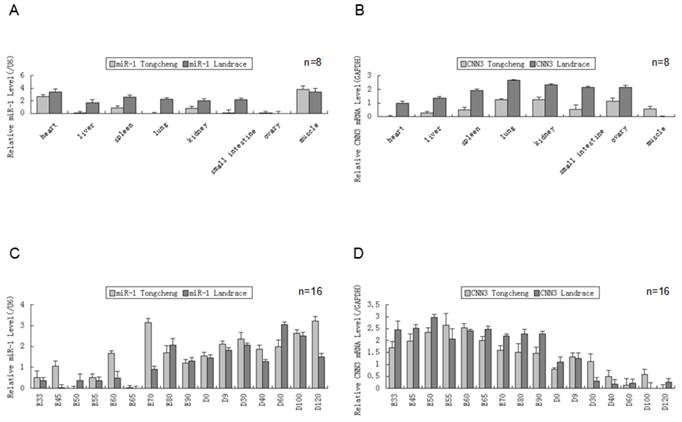
We measured the expression of both miR-1 and CNN3 genes in eight tissues from Tongcheng and Landrace pigs (Fig. 1A、B). As shown in tissue expression profile, miR-1 was abundantly expressed in heart and skeletal muscle (p<0.05) in two breed pigs. The expression of miR-1 in other tissues, including the lung and liver, was barely detected in Tongcheng pigs, and the same result was also found in the Landrace pigs (Fig. 2A). Whereas robust expression of the CNN3 gene was detected in the lung tissues, and significantly higher than that in the other tissues (hear, liver and lngissimus dorsi muscle) (p<0.05). There were no significant differences between kidney and ovary tissue (Fig. 1B). Although the expression of CNN3 was also detected in the longissimus dorsi muscle tissues, it was significantly lower in expression compared with other tissues (p<0.05). We did not find a significantly negative expression correlation between miR-1 and CNN3 in adult tissues (R = -0.428, p = 0.290 for Tongcheng pigs; R = -0.557, p = 0.152 for Landrace pigs).
The expression of miR-1 and CNN3 genes in the different tissues and developmental skeletal muscle . (A) The relative levels of miR-1 were evaluated in the heart, liver, spleen, lung, kidney, intestine, ovary and skeletal muscle in different breeds using real-time PCR. Total RNA was isolated from adult pig(12 months). (B) The CNN3 expression levels in the Tongcheng and Landrace pigs in tissues. Real-time PCR analysis of miR-1 (C) and CNN3 gene (D) during 16 developmental stages (from embryonic day 33 to 120 days after birth) in both breeds. The values in the columns represent the mean values ± standard error expressed as the relative expression level. In each group, the lowest expression value was chosen to evaluate the relative expression level of the target gene at different stages.
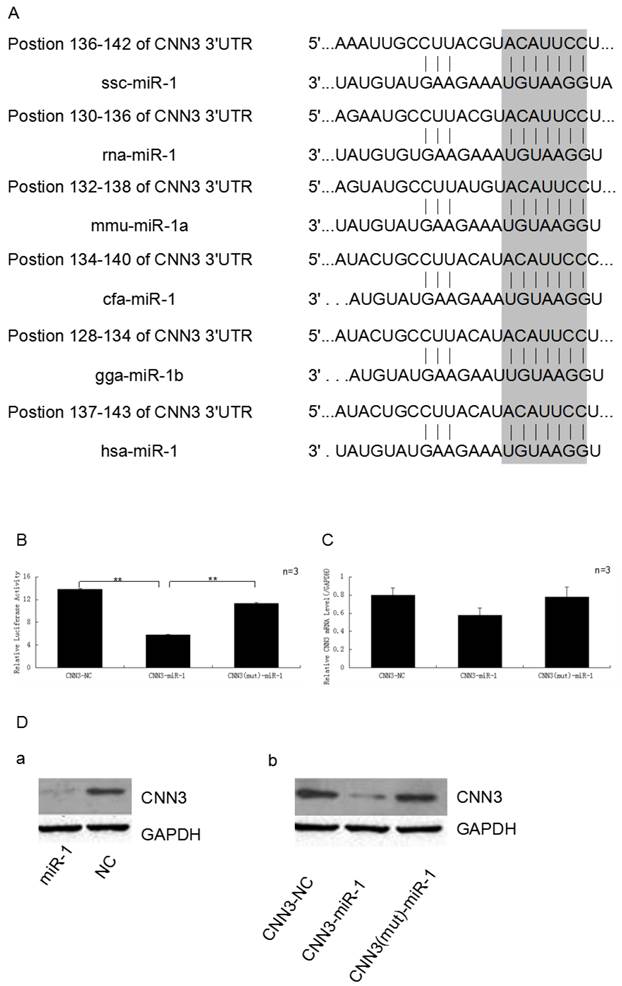
The CNN3 gene is one of target of miR-1. (A)The 3'-UTR of CNN3 contained the binding site of miR-1. The upper part represents CNN3 and the lower part represents miR-1. The corresponding plot shows conservation across species. (B) miR-1 down-regulated the luciferase activity of the psi-Check2-CNN3-3'UTR construct. The miR-1 mimics and normal control (NC) were transfected into PIECs together with the CNN3-3'UTR vector, the relative luciferase activity was measured 36 h later.(C) The expression of CNN3 is down-regulated by miR-1 at the mRNA level. (D) miR-1 inhibits the translation of endogenous and exogenous CNN3 mRNA. (a) After transfection, the levels of endogenous CNN3 protein decreased, as evidenced by Western blot. (b) miR-1 downregulated the exogenous CNN3 protein, whereas the mutant CNN3 protein exhibited no change compared to the NC. The expression of CNN3 was normalised to GAPDH.
Negative expression correlation between miR-1 and CNN3 during skeletal muscle development
To explore the co-expression of the miR-1 and CNN3 genes in myogenesis, we tested the their dynamic changes in pre- and postnatal skeletal muscle at 16 developmental time points (E33, E45, E50, E55, E60, E65, E70, E80, E90, D0, D9, D30, D40, D60, D100 and D120) in Tongcheng and Landrace pigs. The miR-1 was expressed through the embryonic period 33 d to 120 days after birth. While, the miR-1 exhibited relatively abundant expression in postnatal compared with prenatal skeletal muscle in both Tongcheng and Landrace pigs (Fig. 1C). In contrast to miR-1, the CNN3 gene exhibited opposing expression patterns in developmental skeletal muscles. CNN3 exhibited relatively abundant expression in prenatal tissues compared with skeletal muscle in both Tongcheng and Landrace breeds (Fig. 1D). These facts indicated that there was an opposing expression pattern between miR-1 and CNN3 during prenatal and postnatal skeletal muscle development in both Tongcheng and Landrace pigs. Expression correlation analysis revealed that the correlation coefficients were -0.665 (p-value = 0.005) and -0.762 (p-value = 0.001) between miR-1 and CNN3 gene in Tongcheng and Landrace pigs, respectively.
Predicting CNN3 as a putative target for miR-1
Based on our previous mRNA-microRNA expression profiling of prenatal skeletal muscle, CNN3 and miRNA-1 were negatively co-expressed in myogenesis. In this study, we used the bioinformatics tools (Targetscan, miRanda and PicTar) to search for binding site of miRNA within the 3'-UTR of CNN3 mRNA transcripts, and found a miR-1 putative binding site (7 bp conserved homology) at the 3'-UTR sequence of CNN3 (Fig. 2A). This suggested that CNN3 potentially was a regulator target for miR-1.
Validating CNN3 as target for miR-1 by dual luciferase and western blot
To investigate the possibility that the expression of CNN3 is down-regulated by miR-1, miR-1 mimics and the negative control (NC) were transfect into PIECs together with the psi-Check2-CNN3-3'UTR or CNN3 mutant plasmid. As we expected, miR-1 significantly suppressed the luciferase activity. As shown in Fig. 2B, the miR-1 mimic-transfected group exhibited approximately 44.8% less luciferase activity compared with the negative control-transfected group (p < 0.01), and also significantly lower than mutant group (P < 0.01).
To further analyse and confirm how miR-1 affects the expression of CNN3 at the mRNA or protein levels, real-time PCR and Western blot assays were performed. After comparing the amounts of CNN3 mRNA (CNN3 + NC, CNN3 + miR-1 and CNN3 (mut) + miR-1) by reverse transcription followed by real-time PCR, we found that the CNN3 mRNA levels, which are reflective of transcription, were moderately affected (29.3%) by the miR-1 mimic relative to the NC, but the group with mutated CNN3 exhibited no obvious changes at the RNA level (Fig. 2C). Whereas miR-1 induced a decrease in both endogenous CNN3 and exogenous CNN3 protein expression (Fig. 2D), the mutated CNN3-transfected group exhibited almost no change compared to the NC. These data indicate that CNN3 gene is a target of miR-1.
Polymorphism detection, allelic frequencies and association analysis with traits
Four potential polymorphic loci were detected from 6 pig breeds by direct sequencing of CNN3 PCR products, including four intronic polymorphisms within the fifth, sixth, seventh and ninth introns, respectively. Next, we surveyed the allelic and genotypic frequencies of each potential polymorphism in the Landrace and Duroc × (Landrace × Large White) pigs (Table 2). The GG genotype was not found in either of the two breeds, and the T allele was dominant within the P3 polymorphism locus. A similar situation was observed in the P4 polymorphism locus—the AA genotype did not appear among the different breeds. In addition, data from Table 3 revealed that both the Landrace and the Duroc × (Landrace × Large white) breeds exhibited increased frequencies of the CC and CA genotypes compared to the AA genotype within the P1 polymorphism locus. Partial results of the association analysis are shown in Tables 4, 5 and 6. With the exception of the P2 polymorphism, there were no significant differences between genotype and nipple number associated with any polymorphism locus. For the P1 and P3 polymorphisms, a significant association was detected between birth weight, 21-day weaning weight and the different genotypes of this polymorphism (Table 3, 5). In contrast, for the P2 polymorphism, birth weight, rather than the 21-day weaning weight, exhibited a significant correlation with the different genotypes (Table 4).
The genotypic and allelic frequencies of the P1, P2, P3 and P4 polymorphisms of CNN3 in the Landrace and D × L × L pigs.
| Site | Location | Breed | Number | Genotype frequency | Allele frequency | |||
|---|---|---|---|---|---|---|---|---|
| AA | CA | CC | A | C | ||||
| P1 | Intron 5 25328 | Landrace | 52 | 0.096 | 0.558 | 0.346 | 0.375 | 0.625 |
| D×L×Y | 331 | 0.160 | 0.598 | 0.242 | 0.459 | 0.541 | ||
| GG | GT | TT | G | T | ||||
| P2 | Intron 6 25470 | Landrace | 52 | 0 | 0.25 | 0.75 | 0.125 | 0.875 |
| D×L×Y | 331 | 0 | 0.175 | 0.825 | 0.088 | 0.912 | ||
| GG | GA | AA | G | A | ||||
| P3 | Intron 7 26947 | Landrace | 52 | 0.096 | 0.75 | 0.154 | 0.471 | 0.529 |
| D×L×Y | 330 | 0.169 | 0.707 | 0.124 | 0.523 | 0.477 | ||
| AA | AG | GG | A | G | ||||
| P4 | Intron 9 29974 | Landrace | 52 | 0 | 0.788 | 0.212 | 0.394 | 0.606 |
| D×L×Y | 330 | 0 | 0.604 | 0.396 | 0.302 | 0.698 | ||
Notes: Duroc × (Landrace × Large White) pigs abbreviated as D×L×Y.
Association analyses between the P1 polymorphisms of CNN3 and nipple number, birth weight and 21-day weaning weight
| Polymorphism | Number | Genotype | Nipple number | Body weight(kg) | |
|---|---|---|---|---|---|
| Birth weight | 21 days-weaning weight | ||||
| P1 | 34 | AA | 14.35±0.16a | 1.58±0.05a | 5.90±0.22b |
| 58 | CC | 14.41±0.14a | 1.57±0.03a | 6.72±0.19a | |
| 125 | CA | 14.65±0.08a | 1.47±0.03b | 5.83±0.11b | |
| Total | 217 | ||||
Notes: Values were expressed as mean±standard error. Different lowercase letters (a and b) indicate significant differences between genotypes (p<0.05).
Association analyses between the P2 polymorphisms of CNN3 and nipple number, birth weight and 21-day weaning weight
| Polymorphism | Number | Genotype | Nipple number | Body weight(kg) | |
|---|---|---|---|---|---|
| Birth weight | 21 days-weaning weight | ||||
| P2 | 40 | GT | 14.13±0.14a | 1.60±0.05a | 6.08±0.24a |
| 177 | TT | 14.64±0.09b | 1.49±0.02b | 6.08±0.10a | |
| Total | 217 | ||||
Notes: Values were expressed as mean±standard error. Different lowercase letters (a and b) indicate significant differences between genotypes (p<0.05).
Association analyses between the P3 polymorphisms of CNN3 and nipple number, birth weight and 21-day weaning weight
| Polymorphism | Number | Genotype | Nipple number | Body weight(kg) | |
|---|---|---|---|---|---|
| Birth weight | 21 days-weaning weight | ||||
| P3 | 33 | AA | 14.42±0.22a | 1.59±0.04a | 7.08±0.23a |
| 36 | GG | 14.28±0.17a | 1.60±0.05a | 5.89±0.21b | |
| 148 | GA | 14.64±0.10a | 1.47±0.02b | 5.90±0.11b | |
| Total | 217 | ||||
Notes: Values were expressed as mean±standard error. Different lowercase letters (a and b) indicate significant differences between genotypes (P<0.05).
Association analyses between the P4 polymorphisms of CNN3 and nipple number, birth weight and 21-day weaning weight
| Polymorphism | Number | Genotype | Nipple number | Body weight(kg) | |
|---|---|---|---|---|---|
| Birth weight | 21 days-weaning weight | ||||
| P4 | 145 | AG | 14.57±0.10a | 1.48±0.02a | 6.08±0.11a |
| 82 | GG | 14.50±0.12a | 1.55±0.33a | 6.07±0.16a | |
| Total | 217 | ||||
Notes: Values were expressed as mean±standard error. Different lowercase letters (a and b) indicate significant differences between genotypes (P<0.05).
Discussion
Calponin 3 (CNN3) is a member of the calponin family, which regulates actomyosin interactions and cytoskeletal organization through highly efficient binding to F-actin. As a muscle regulator, CNN3 has been shown to play a role in actin cytoskeleton rearrangement [20] and to participate in stress fibre formation [21]. Appel et al. demonstrated that CNN3 associated with extracellular signal-regulated kinase (ERK) 1/2 and found that it is ubiquitously expressed in a variety of tissues except for the skeletal muscle in ferrets [22]. We also detected the reduced expression of CNN3 mRNA in skeletal muscle compared to other tissues in adult pigs. Thus, we suspected that the translation of CNN3 was restricted by unknown factors in skeletal muscle tissues in mammals. Different porcine breeds exhibit different gene expression phenotypes at the same time points [23]. Our results confirmed that the CNN3 mRNA expression levels increased from E33 to E55 in the skeletal muscle tissues of Tongcheng pigs, which are the two key points for the generation of primary and secondary myogenic cells [24]. However, the CNN3 mRNA expression levels increased from E33 and E50 in Landrace pigs, a discrepancy that might be attributed to the differences of Chinese and Western porcine breeds.
Previous studies have reported that miRNAs regulate several developmental and physiological processes [5, 25]. The miR-1 is highly expressed in a tissue-specific manner in skeletal muscle, as previously reported by other groups [26], and we also observed similar results from the tissue expression patterns of pigs. Moreover, miR-1 has been shown to strongly enhance myogenesis by increasing the expression of myogenic markers, including myogenin, myosin heavy chain, MyoD, MEF2 and skeletal α-actin [14]. Recently, studies have shown that miR-1 also enhances cardiac myocyte differentiation in cell culture systems [27, 28]. Glass and Singla demonstrated that transplanted miR-1-ES cells affect apoptosis and improve cardiac function after 4 weeks in the infarcted heart [29]. In this study, we showed that miR-1 plays a key role in skeletal muscle development and that its expression is up-regulated from pre- to postnatal-stage muscle tissues. This study documented that its expression trend during skeletal muscle development is similar in Tongcheng and Landrace pigs, indicating that miR-1 might regulate skeletal muscle development and growth via an unknown molecular mechanism in pigs.
We focused our investigation on miR-1 in skeletal muscle and found that miR-1 targets CNN3, which mediates the effects elicited by miR-1 on skeletal muscle development. Thus, the identification of CNN3 as a miR-1 target gene offers a possible explanation for the specific expression of miR-1 in muscle. Many methodologies have been applied to determine the targets of specific miRNAs [30]. The generally accepted mechanism of miRNA targeting in mammals is that the miRNAs bind to a complementary sequence within the 3' UTR of its target mRNA transcript, thereby inhibiting or reducing the translation of the transcript. There is almost no complete complementarity between miRNAs and their target mRNA transcripts. However, it is possible to suppress gene expression with as little as a 6-bp match with the target transcript [31, 32]. The luciferase activity of psi-Check II, which contains the 3'-UTR of the CNN3 gene, was decreased by the overexpression of miR-1, implicating the specific existence of the miRNA target site in porcine cells.
A novel method for predicting miRNA targets and for discovering orthologous human and murine miRNAs and genes with expression profiles that exhibit obvious negative correlations has been previously reported [33]. Thus, we analysed the expression profiles of miR-1 and CNN3 in different tissues and during different stages of skeletal muscle development. Our results demonstrated that the expression of miR-1 is important and specific to muscle (cardiac and skeletal muscle) tissues. Although the CNN3 gene is not expressed in a particularly tissue-specific manner in muscle, it could be considered a candidate gene because of its function in skeletal muscle. These results are consistent with previous reports showing that the mRNA expression levels of CNN3 are increased in prenatal compared to postnatal muscle tissues [34]. Next, we determined the correlation between the miR-1 and CNN3 expression data and found that miR-1 expression is inversely correlated with the CNN3 mRNA levels. That is, as the CNN3 levels decrease in skeletal muscle, the levels of miR-1 increase. This method might improve the success rate for identifying miRNA target genes. Subsequently, we verified CNN3 as a target gene for miR-1 using a bioinformatics tool, experimental dual luciferase assay and western blot analysis. Our results showed that the overexpression of miR-1 significantly inhibited luciferase activity compared to the negative control after transfection into PK15 cells, suggesting that miR-1 might repress CNN3 expression by degrading its mRNA transcripts. miRNAs can regulate the expression of their target genes by degrading and/or inhibiting translation from their target transcripts[35]. Western blot analysis confirmed that the CNN3 was significantly downregulated by miR-1 at the protein level. Moreover, we found four potential polymorphic loci of CNN3 that are significantly associated with birth weight and the 21-day weaning weight, which implies a role for CNN3 during skeletal muscle development and growth in pigs.
In summary, our study showed that miR-1 regulates skeletal muscle development by targeting the CNN3 gene in pigs. We found that CNN3 is significantly associated with the growth traits of pigs. These data are helpful for elucidating the biological functions of miR-1 and the molecular mechanisms underlying skeletal muscle development in mammals. We also provide a potential candidate gene and a molecular marker for the improvement of meat production in farm animals.
Acknowledgements
The authors are grateful to Dr. Jianhua Cao from Huazhong Agricultural University for providing psi-Check2 vector and Sanping Xu in Tongcheng Animal Husbandry Bureau in Hubei Province for sample collection. This work was supported by the National Key Project (2013ZX08009001-004), the National High Technology Research and Development Program of China (2011AA100302), the National Basic Research Program of China (2012CB124706-6) and the National Natural Science Foundation of China (31171192).
Competing Interests
The authors have declared that no competing interest exists.
References
1. Takahashi K, Nadal-Ginard B. Molecular cloning and sequence analysis of smooth muscle calponin. J Biol Chem. 1991;266:13284-8
2. Maguchi M, Nishida W, Kohara K, Kuwano A, Kondo I, Hiwada K. Molecular cloning and gene mapping of human basic and acidic calponins. Biochem Biophys Res Commun. 1995;217:238-44
3. Winder SJ, Walsh MP. Smooth muscle calponin. Inhibition of actomyosin MgATPase and regulation by phosphorylation. J Biol Chem. 1990;265:10148-55
4. Bartel DP. MicroRNAs: genomics, biogenesis, mechanism, and function. Cell. 2004;116:281-97
5. Plasterk RH. Micro RNAs in animal development. Cell. 2006;124:877-81
6. Callis TE, Deng Z, Chen JF, Wang DZ. Muscling through the microRNA world. Exp Biol Med (Maywood). 2008;233:131-8
7. McCarthy JJ. MicroRNA-206: the skeletal muscle-specific myomiR. Biochim Biophys Acta. 2008;1779:682-91
8. McCarthy JJ, Esser KA. MicroRNA-1 and microRNA-133a expression are decreased during skeletal muscle hypertrophy. J Appl Physiol. 2007;102:306-13
9. McCarthy JJ, Esser KA, Andrade FH. MicroRNA-206 is overexpressed in the diaphragm but not the hindlimb muscle of mdx mouse. Am J Physiol Cell Physiol. 2007;293:C451-7
10. Small EM, O'Rourke JR, Moresi V, Sutherland LB, McAnally J, Gerard RD. et al. Regulation of PI3-kinase/Akt signaling by muscle-enriched microRNA-486. Proc Natl Acad Sci U S A. 2007;107:4218-23
11. van Rooij E, Quiat D, Johnson BA, Sutherland LB, Qi X, Richardson JA. et al. A family of microRNAs encoded by myosin genes governs myosin expression and muscle performance. Dev Cell. 2009;17:662-73
12. Hou X, Tang Z, Liu H, Wang N, Ju H, Li K. Discovery of MicroRNAs associated with myogenesis by deep sequencing of serial developmental skeletal muscles in pigs. PLoS One. 2012;7:e52123
13. Kim HK, Lee YS, Sivaprasad U, Malhotra A, Dutta A. Muscle-specific microRNA miR-206 promotes muscle differentiation. J Cell Biol. 2006;174:677-87
14. Chen JF, Mandel EM, Thomson JM, Wu Q, Callis TE, Hammond SM. et al. The role of microRNA-1 and microRNA-133 in skeletal muscle proliferation and differentiation. Nat Genet. 2006;38:228-33
15. Zhang J, Ying ZZ, Tang ZL, Long LQ, Li K. MicroRNA-148a promotes myogenic differentiation by targeting the ROCK1 gene. J Biol Chem. 2012;287:21093-101
16. Zhao S, Zhang J, Hou X, Zan L, Wang N, Tang Z. et al. OLFML3 expression is decreased during prenatal muscle development and regulated by microRNA-155 in pigs. Int J Biol Sci. 2012;8:459-69
17. Lewis BP, Burge CB, Bartel DP. Conserved seed pairing, often flanked by adenosines, indicates that thousands of human genes are microRNA targets. Cell. 2005;120:15-20
18. Chen C, Ridzon DA, Broomer AJ, Zhou Z, Lee DH, Nguyen JT. et al. Real-time quantification of microRNAs by stem-loop RT-PCR. Nucleic Acids Res. 2005;33:e179
19. Livak KJ, Schmittgen TD. Analysis of relative gene expression data using real-time quantitative PCR and the 2(-Delta Delta C(T)) Method. Methods. 2001;25:402-8
20. Shibukawa Y, Yamazaki N, Kumasawa K, Daimon E, Tajiri M, Okada Y. et al. Calponin 3 regulates actin cytoskeleton rearrangement in trophoblastic cell fusion. Mol Biol Cell. 2010;21:3973-84
21. Daimon E, Shibukawa Y, Wada Y. Calponin 3 regulates stress fiber formation in dermal fibroblasts during wound healing. Arch Dermatol Res. 2013;305:571-84
22. Appel S, Allen PG, Vetterkind S, Jin JP, Morgan KG. h3/Acidic Calponin: An Actin-binding Protein That Controls Extracellular Signal-regulated Kinase 1/2 Activity in Nonmuscle Cells. Molecular Biology of the Cell. 2010;21:1409-22
23. Tang Z, Li Y, Wan P, Li X, Zhao S, Liu B. et al. LongSAGE analysis of skeletal muscle at three prenatal stages in Tongcheng and Landrace pigs. Genome Biol. 2007;8:R115
24. Picard B, Lefaucheur L, Berri C, Duclos MJ. Muscle fibre ontogenesis in farm animal species. Reprod Nutr Dev. 2002;42:415-31
25. Shivdasani RA. MicroRNAs: regulators of gene expression and cell differentiation. Blood. 2006;108:3646-53
26. Sood P, Krek A, Zavolan M, Macino G, Rajewsky N. Cell-type-specific signatures of microRNAs on target mRNA expression. Proc Natl Acad Sci U S A. 2006;103:2746-51
27. Cordes KR, Srivastava D. MicroRNA regulation of cardiovascular development. Circ Res. 2009;104:724-32
28. Takaya T, Ono K, Kawamura T, Takanabe R, Kaichi S, Morimoto T. et al. MicroRNA-1 and MicroRNA-133 in spontaneous myocardial differentiation of mouse embryonic stem cells. Circ J. 2009;73:1492-7
29. Glass C, Singla DK. ES cells overexpressing microRNA-1 attenuate apoptosis in the injured myocardium. Mol Cell Biochem. 2011;357:135-41
30. Thomson DW, Bracken CP, Goodall GJ. Experimental strategies for microRNA target identification. Nucleic Acids Res. 2011;39:6845-53
31. Brennecke J, Stark A, Russell RB, Cohen SM. Principles of microRNA-target recognition. PLoS Biol. 2005;3:e85
32. Doench JG, Sharp PA. Specificity of microRNA target selection in translational repression. Genes Dev. 2004;18:504-11
33. Ritchie W, Rajasekhar M, Flamant S, Rasko JE. Conserved expression patterns predict microRNA targets. PLoS Comput Biol. 2009;5:e1000513
34. Bilek K, Knoll A, Stratil A, Svobodova K, Horak P, Bechynova R. et al. Analysis of mRNA expression of CNN3, DCN, FBN2, POSTN, SPARC and YWHAQ genes in porcine foetal and adult skeletal muscles. Czech Journal of Animal Science. 2008;53:181-6
35. Valencia-Sanchez MA, Liu J, Hannon GJ, Parker R. Control of translation and mRNA degradation by miRNAs and siRNAs. Genes Dev. 2006;20:515-24
Author contact
![]() Corresponding author: Kui Li, E-mail: kuilinet.cn. Ruihua Huang, E-mail: hrh2002com.
Corresponding author: Kui Li, E-mail: kuilinet.cn. Ruihua Huang, E-mail: hrh2002com.