Impact Factor ISSN: 1449-2288
- Issue 12; 2026
- Issue 11; 2026
- Issue 10; 2026
- Issue 9; 2026
- Issue 8; 2026
- Volume 22; 2026
- Past Issues
- Advance Articles
- Editorial Board
- Cover Images
- Index & Coverage
- Cover Suggestion
- Special Issues
Introduction
Materials and Methods
Results
Discussion
Supplementary Material
Acknowledgements
References

 Global reach, higher impact
Int J Biol Sci 2014; 10(5):530-542. doi:10.7150/ijbs.8450 This issue Cite
Research Paper
Detailed Localization of Augmented Angiotensinogen mRNA and Protein in Proximal Tubule Segments of Diabetic Kidneys in Rats and Humans
Masumi Kamiyama1,2, Michelle K. Garner1,2, Kristina M. Farragut1,2, Tadashi Sofue4, Taiga Hara4, Takashi Morikawa6, Yoshio Konishi6, Masahito Imanishi6, Akira Nishiyama5, Hiroyuki Kobori1,2,3,5 ![]()
1. Department of Physiology, Tulane University Health Sciences Center, New Orleans, LA 70112, USA;
2. Hypertension and Renal Center of Excellence, Tulane University Health Sciences Center, New Orleans, LA 70112, USA;
3. Department of Medicine, Tulane University Health Sciences Center, New Orleans, LA 70112, USA;
4. Department of Cardiorenal and Cerebrovascular Medicine, Kagawa University School of Medicine, Kagawa 761-0793, Japan;
5. Department of Pharmacology, Kagawa University School of Medicine, Kagawa 761-0793, Japan;
6. Department of Nephrology and Hypertension, Osaka City General Hospital, Osaka 534-0021, Japan.
Received 2013-12-28; Accepted 2014-4-22; Published 2014-5-3
Abstract
In the intrarenal renin-angiotensin system, angiotensinogen levels are well known to be increased in diabetes, and these enhanced intrarenal angiotensinogen levels may initiate the development and accelerate the progression of diabetic nephropathy. However, the specific localization of the augmented angiotensinogen in proximal tubule segments in diabetes is still unknown. We investigated the detailed localization of angiotensinogen in 3 proximal tubule segments in the diabetic Otsuka Long-Evans Tokushima fatty (OLETF) rats and the control Long-Evans Tokushima Otsuka (LETO) rats. We also prepared OLETF rats treated with angiotensin II type 1 receptor blocker, olmesartan or with a combination of vasodilator agents. Moreover, biopsied samples of human kidney cortex were used to confirm the results of animal studies. We examined the co-localization of angiotensinogen with segment-specific markers by double staining using fluorescence in situ hybridization and/or immunofluorescence. Angiotensinogen mRNA expression was barely detectable in segment 1. In segment 3, the area of angiotensinogen mRNA expression was augmented in the OLETF rats compared with the LETO rats. Angiotensinogen protein expression areas in segments 1 and 3 were also increased in the OLETF rats compared with the LETO rats. Chronic treatment with olmesartan ameliorated these areas of augmented angiotensinogen expression. Biopsied human kidney samples showed similar results. These data suggest that the augmented angiotensinogen mRNA levels in segment 3 and angiotensinogen protein levels in segments 1 and 3 may contribute to the progression of diabetic nephropathy.
Keywords: angiotensin II receptor blocker, angiotensinogen, diabetic nephropathy, proximal tubule, renin-angiotensin system.
Introduction
In the renal renin-angiotensin system (RAS), angiotensinogen (AGT) is formed primarily in the proximal tubule cells and is secreted into the tubular fluid [1-3]. A previous study demonstrated increased intrarenal AGT and urinary AGT excretion in various hypertensive animal models [4]. Moreover, using samples from patients with diabetic nephropathy (DN) [5-7] and diabetic mouse [8, 9] and rat [10, 11] models, we have shown that increased intrarenal AGT and subsequent increased AGT excretion in urine are involved in the mechanisms of both the development and the progression of DN. A recent study in rats indicates that urinary AGT originates from the AGT formed and secreted in the proximal tubules, and not from AGT in plasma [12]. A clearer picture of AGT expression in the proximal tubules is therefore important for understanding the development and progression of DN.
In 2011, the Randomized Olmesartan and Diabetes Microalbuminuria Prevention (ROADMAP) study made the novel finding that an angiotensin II receptor blocker (ARB), olmesartan, was associated with delayed onset of microalbuminuria (the first stage of DN), even though blood pressure control in the patients with type 2 diabetes was excellent [13]. Although the pathogenesis of DN is clearly multifactorial [14], the activation of the intrarenal RAS has been shown to have a potential role in the mechanism of DN [15-17]. The results of the ROADMAP study therefore suggest the possibility of preemptive treatment with ARBs for the delay or prevention of microalbuminuria in diabetes [4, 18] by direct suppression of the activated RAS. From these results, it can be anticipated that the control of intrarenal AGT expression may be effective in preventing the development and progression of DN. Since AGT is the only known substrate for renin, which is the rate-limiting enzyme of the RAS [3, 19], and the level of AGT is close to the Michaelis-Menten constant for renin, both renin and AGT levels can regulate the activity of the RAS. Recent studies showed that AGT is a sensitive biomarker of DN [9] and in vivo experiments have demonstrated that upregulation of AGT levels may lead to elevated angiotensin peptide levels [20, 21]. Moreover, in vitro studies in immortalized rat renal proximal tubule cells suggest that high glucose itself induces AGT gene expression [22, 23].
Despite the evidence for the expression of AGT in the proximal tubules of diabetic model animal kidneys [10, 11], the precise localization of increased AGT mRNA and protein in proximal tubule segments is still unknown. Structurally, the proximal tubules consist of 3 segments in a nephron unit [24]. Segment (S)1 is mainly confined to the beginning of the convoluted tubules, S2 comprises the end of the convoluted tubules, and S3 includes the major straight part of the tubules. Recently, we showed conclusive evidence of the detailed localization of AGT in normal kidney proximal tubules [25, 26], clarifying some previously reported controversial results [27-30]. Interestingly, our data showed a divergence between localization of AGT mRNA transcription and AGT protein synthesis in different segments of the normal rat proximal tubules.
The purpose of this study is to determine the detailed localization of increased AGT mRNA and protein in the 3 proximal tubule segments of kidney of human and rat with diabetes using established double staining methods. We also examined AGT expression after treatment with the ARB olmesartan or vasodilator agents, which included a combination of hydralazine, reserpine, and hydrochlorothiazide (HRH).
Materials and Methods
Animal tissue preparation
This study was carried out in strict accordance with the recommendations in the Guide for the Care and Use of Laboratory Animals of the National Institutes of Health. The protocol was approved by the Committee on the Ethics of Animal Experiments of Kagawa University (Permit Number: 77-1) and Tulane University Health Sciences Center (Permit Number: 2773R2-D). All surgery was performed under sodium pentobarbital anesthesia, and all efforts were made to minimize suffering.
Thirty-two 5-week-old male Otsuka Long-Evans Tokushima fatty (OLETF) rats and 16 genetic control male age-matched Long-Evans Tokushima Otsuka (LETO) rats were supplied by Otsuka Pharmaceutical Company Limited (Chiyoda-ku, Tokyo, Japan). Four each of the LETO and OLETF rats were sacrificed at 5 and 7 weeks of age, respectively. The following diets were then administered to the remaining OLETF rats from 7 weeks of age: standard diet (n = 8), diet including the ARB, olmesartan (0.02% in chow, 10 - 15 mg/kg/day; Daiichi-Sankyo Company Limited, Chuo-ku, Tokyo, Japan) (n = 8), or a diet including a combination of vasodilator agents (0.03% hydralazine, 0.006% reserpine, and 0.012% hydrochlorothiazide in chow; HRH; Sigma Chemical, St. Louis, MO) (n = 8). The remaining LETO rats (n = 8) were treated with a standard diet. The doses of olmesartan and HRH were determined on the basis of previous studies in rats [31-33]. At 15 and 25 weeks of age, 4 each of the LETO, OLETF rats, and OLETF rats treated with olmesartan or HRH were sacrificed. Physical and laboratory data were collected and systolic blood pressure (SBP) was measured in conscious rats by tail-cuff plethysmography (BP-98A; Softron Company, Suginami-ku, Tokyo, Japan) [34]. After sacrifice, kidneys were immediately harvested to prepare tissue sections. Kidney samples were fixed in 10% paraformaldehyde, embedded in paraffin, and deparaffinized in xylene. Three-µm thick sequential tissue sections were then prepared by an out-sourcing company (Mass Histology Service, Worcester, MA).
Human kidney biopsied sample collection
Patients were recruited in Osaka City General Hospital from new outpatients with intermittent or persistent hematuria and/or proteinuria between May 2000 and February 2010, and who were later diagnosed with DN or minor glomerular abnormality (MGA) by clinical and pathological findings [7]. The study was a retrospective exploratory clinical study using samples of renal biopsies that were performed for detailed disease diagnosis. The circumstances of the sample collection are as follows [7]:
Control subjects
Renal biopsy was performed in response to the possibility of kidney disease. However, if the diagnosis was negative with no histopathological findings, the samples were used as controls. They were later diagnosed as MGA by clinical and pathological findings.
Patients with diabetic nephropathy
When the physician strongly suspected that the kidney damage was caused by another disease such as chronic glomerulonephritis and not by DN, a renal biopsy was necessary to differentiate between the diseases. In the case of patients with diabetes, who also presented with nephrosis, hematuria and/or treatment-resistance, a renal biopsy was performed, since this is an effective method for confirming the diagnosis of nephritis. If other kidney diseases were excluded and a definite diagnosis of DN was made by clinical and pathological findings, we used these samples as 'patients with diabetic nephropathy'. In this study, patients who were taking any medication, who had previously received ACE inhibitors or ARBs, or had any cardiovascular event, were also excluded. All patients who were diagnosed with diabetic nephropathy were immediately treated with the appropriate medical care (including administration of ACE inhibitor and/or ARB).
Renal biopsied samples of human kidney cortex were obtained by fine-needle aspiration from 31 patients (19 patients with DN and 12 patients with MGA). The experimental protocol of this retrospective exploratory clinical study was approved by the Institutional Review Board of Osaka City General Hospital. All samples were obtained from patients with written informed consent. All kidney samples were fixed in buffered-formalin immediately after removal and embedded in paraffin, and sequential 3-µm thick tissue sections were prepared by Mass Histology Service. Blood and urine samples were obtained from participants within a week prior to the renal biopsy. Height, body weight, SBP, and diastolic blood pressure were also recorded on the same day. Blood pressure was measured as previously described [7, 35-37]. Prior to taking the subjects blood pressure on their right arms, we allowed them to sit quietly for at least 5 min. We used an automated manometer (Omron, Kyoto-shi, Kyoto, Japan) to make at least 3 blood pressure measurements 2 min apart. The mean blood pressure values were calculated from the last two systolic and diastolic pressure readings that fell within 5 mmHg of each other.
Fluorescence in situ hybridization (FISH)
Biotinylated locked nucleic acid (LNA)-modified DNA oligonucleotides (Exiqon, Woburn, MA) of AGT were used for FISH as previously described [7, 26]. LNA probes for rat AGT were designed by antisense and sense sequences (antisense: 5'-biotin-GGA TGG CCC GAG GAG G-3', Tm = 77.0°C; sense: 5'-biotin-CCT CCT CGG GCC ATC C-3', Tm = 75.7°C). LNA probes for human AGT were designed by antisense and sense sequences (antisense: 5'-biotin-CTT CCG CAT ACC CTT CTG CTG TAG-3', Tm = 80.0°C; sense: 5'-biotin-CTA CAG CAG AAG GGT ATG CGG AAG-3', Tm = 81.0°C). Sections were hybridized for 18 h with 10 nmol/l of either antisense or sense 5'-biotin-labeled LNA probes. Sections were subsequently incubated with 2 µg/ml Streptavidin, Alexa Fluor® 488 conjugate (Molecular Probes, Eugene, OR). Conventional fluorescence images were observed with fluorescence microscopy (BX51; Olympus, Shinjuku-ku, Tokyo, Japan). Fifteen consecutive microscopic fields in the tubules were examined by the same color adjustment (brightness and contrast) and the expression area was calculated for each slide in a blind manner using Image-Pro plus software (Media Cybernetics, Bethesda, MD) as previously described [7]. We used x100 magnification pictures for quantification (Additional file 1: Supplemental Fig. S1). We excluded glomeruli and vessels then the area of merged color, yellow in each picture was calculated using Image-Pro plus software.
Immunohistochemistry (IHC)
AGT expression intensity and area were examined by IHC as previously described [7, 26]. IHC was performed using an automated system (Autostainer; Dako, Carpinteria, CA) and samples were counterstained with hematoxylin. The concentration of primary antibodies against rat AGT and human AGT was 1:500. The specificity of the anti-AGT antibody used in this study was previously confirmed in a separate study where the pre-adsorption of the antibody with the synthetic oligo-peptide corresponding to the rat AGT epitope caused a marked decrease in its immunoreactivity for AGT [38]. Conventional images were observed with phase contrast microscopy (BX41; Olympus). Fifteen consecutive microscopic fields in the tubules were examined and the expression area was calculated for each slide in a blind manner using Image-Pro plus software (Media Cybernetics) [7]. We excluded glomeruli and vessels then the area of brown color in each picture was calculated using Image-Pro plus software.
Double staining using FISH and immunofluorescence (IF)
For double staining using FISH and IF, the sections were first incubated with AGT probe (see FISH Section), then incubated with the S1-specific anti-sodium glucose cotransporter 2 (SGLT2; apical brush border Na+-coupled glucose transporter) [39] antibody (1:100; Santa Cruz Biotechnology, Dallas, TX), the S2-specific anti-carbonic anhydrase IV (CA IV; apical brush border zinc metalloenzyme) [39, 40] antibody (1:100; Santa Cruz Biotechnology), or the S3-specific anti-ecto-adenosinetriphosphatase (ecto-ATPase; apical brush border enzyme) [39, 41] antibody (1:100; Santa Cruz Biotechnology) [7]. Sections were incubated with 2 µg/ml Streptavidin, Alexa Fluor® 488 conjugate for the detection of AGT mRNA and 2 µg/ml Alexa Fluor® 594 (Molecular Probes) for the detection of S1 - S3-specific markers.
Immunofluorescent double staining was performed using an anti-AGT antibody with the S1 segment-specific anti-SGLT2 antibody (1:100), the anti-CA IV antibody (1:100), or the S3 segment-specific anti-ecto-ATPase antibody (1:100). Sections were incubated with an Alexa Fluor® 488-labeled secondary antibody for the detection of AGT protein and 2 µg/ml Alexa Fluor® 594 for the detection of S1 - S3-specific markers [7]. Segment-specific markers are localized only predominantly to each segment; however, our previous study demonstrated that each segment is able to be successfully distinguished using by these markers [26]. As the segment specific markers are not absolute for each segment [42, 43], we quantified only strongly stained areas to ensure confidence in the identity of the segment observed.
Fifteen consecutive microscopic fields in the tubules were examined by BX51 fluorescence microscopy and the expression areas were calculated for each slide in a blind manner using Image-Pro plus software (Media Cybernetics) as previously described [7].
Statistical analysis
To analyze clinical data, statistical significance between groups was analyzed by Chi-square test or unpaired t-test. Data for expression levels were evaluated using Wilcoxon signed-rank test. All data are presented as the mean ± SEM. Statistical comparisons of differences for animal data were carried out using one-way ANOVA combined with Dunnett's post-hoc test. Values were considered significant at P < 0.05. All computations, including data management and statistical analyses, were performed with JMP software (SAS Institute, Cary, NC).
Results
Animal profiles
Changes in postprandial blood glucose over time and body weight, urinary albumin excretion, renal angiotensin II, SBP, creatinine (Cr), triglyceride (TG), and adiponectin at 15 weeks of age are shown in Table 1. There was a significant difference in the PPBG (11 weeks), body weight, urinary albumin excretion, renal angiotensin II, SBP, and TG between the LETO and OLETF rats. The increased PPBG, body weight, urinary albumin excretion, renal angiotensin II, SBP, and TG were ameliorated by olmesartan treatment. Furthermore, HRH treatment was also decreased the augmented SBP and TG.
Changes in PPBG over time and animal data at 15 weeks of age.
| Parameters | LETO + vehicle | OLETF + vehicle | OLETF + olmesartan | OLETF + HRH |
|---|---|---|---|---|
| (N = 4) | (N = 4) | (N = 4) | (N = 4) | |
| PPBG, mg/dl | ||||
| 5 weeks | 120.8 ± 8.3 | 130.8 ± 9.7 | 126.8 ± 8.0 | 130.8 ± 9.1 |
| 7 weeks | 97.0 ± 1.7 | 151.3 ± 12.2 | 137.5 ± 12.7 | 95.5 ± 28.5 |
| 9 weeks | 92.8 ± 2.1 | 125.0 ± 7.9 | 130.8 ± 8.4 | 142.3 ± 16.9 |
| 11 weeks | 92.5 ± 4.1 | 155.3 ± 23.1 * | 139.3 ± 17.4 # | 160.3 ± 14.8 |
| BW, g | 396.3 ± 7.5 | 486.5 ± 5.8 ** | 453.5 ± 11.1 ## | 464.0 ± 8.2 |
| UAlb, mg/g Cr | 38.8 ± 3.7 | 250.5 ± 68.7 ** | 23.1 ± 5.3 ## | 180.4 ± 13.6 |
| Angiotensin II in the kidney, fmol/g | 71.6 ± 17.8 | 171.6 ± 79.4 * | 23.0 ± 4.2 ## | 155.4 ± 19.6 |
| SBP, mmHg | 128.0 ± 5.5 | 157.3 ± 1.4 ** | 113.3 ± 3.7 ## | 112.8 ± 3.7 ## |
| Cr, mg/dl | 0.61 ± 0.04 | 0.45 ± 0.05 | 0.56 ± 0.07 | 0.46 ± 0.07 |
| TG, mg/dl | 66.0 ± 4.1 | 363.5 ± 45.9 ** | 154.8 ± 10.9 ## | 238.5 ± 25.6 # |
| Adiponectin, µg/ml | 2.6 ± 0.5 | 4.0 ± 0.6 | 5.0 ± 1.0 | 2.4 ± 0.9 |
PPBG, postprandial blood glucose; BW, body weight; SBP, systolic blood pressure; UAlb, urinary albumin excretion; Cr, creatinine; TG, triglyceride. * P < 0.05 vs. LETO + vehicle, ** P < 0.01 vs. LETO + vehicle, # P < 0.05 vs. OLETF + vehicle, and ## P < 0.01 vs. OLETF + vehicle.
AGT mRNA and protein expression in diabetic rat kidney sections
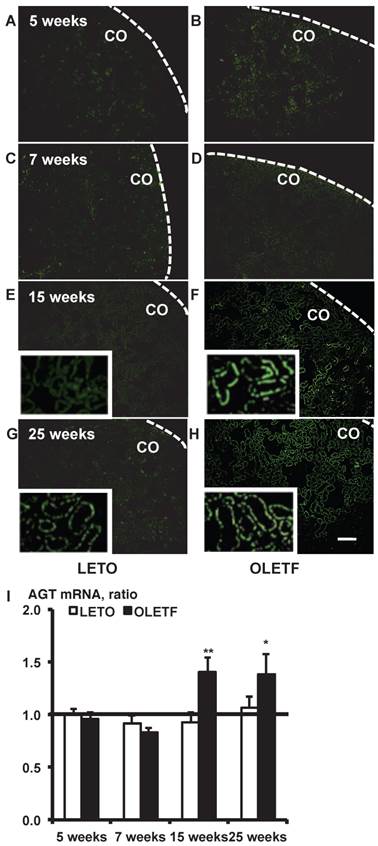
In situ hybridization histochemistry with biotinylated probes against AGT mRNA in 5, 7, 15, and 25-week-old rat kidneys is shown in Fig. 1. Although intrarenal AGT mRNA expression was similar between the LETO and OLETF rats at 5 and 7 weeks, intrarenal AGT mRNA expression was significantly increased at 15 weeks (LETO, 0.92 ± 0.10; OLETF, 1.40 ± 0.14; Fig. 1E and 1F) and 25 weeks (LETO, 1.07 ± 0.10; OLETF, 1.38 ± 0.19; Fig. 1G and 1H) in the OLETF rats compared with the control rats.
In situ hybridization with biotinylated probes against AGT mRNA. Images of stained kidney tissue are shown in A - H and the calculated AGT mRNA expression is shown in I. Each value was expressed as a fold-increase against the average of mRNA level of 5-week-old LETO rats, which was taken as 1. * P < 0.05 vs. each LETO, ** P < 0.01 vs. each LETO. Dotted lines indicate edge of kidney. Magnification, x100 (scale bar, 200 μm). High magnification images of E, F, G, and H are presented as insets. AGT: angiotensinogen; LETO: Long-Evans Tokushima Otsuka; OLETF: Otsuka Long-Evans Tokushima Fatty; CO: cortex.
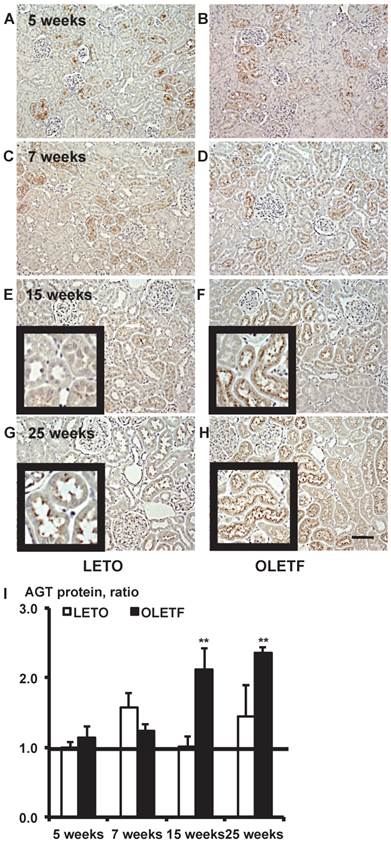
Immunostaining for AGT protein in 5, 7, 15, and 25-week-old rat kidneys is shown in Fig. 2. Although intrarenal AGT protein expression was similar between the LETO and OLETF rats at 5 and 7 weeks, intrarenal AGT protein expression was significantly increased at 15 weeks (LETO, 1.02 ± 0.14; OLETF, 2.11 ± 0.32; Fig. 2E and 2F) and 25 weeks (LETO, 1.45 ± 0.45; OLETF, 2.36 ± 0.08; Fig. 2G and 2H) in the OLETF rats compared with the control rats.
Immunostaining for AGT protein. Images of kidney tissue staining images (A - H) and the calculated AGT protein expression in I. Each value was expressed as a fold-increase against the average of protein level of 5-week-old LETO rats, which was taken as 1. * P < 0.05 vs. each LETO, ** P < 0.01 vs. each LETO. Magnification, x100 (scale bar, 200 μm). High magnification images of E, F, G, and H are presented as insets. AGT: angiotensinogen; LETO: Long-Evans Tokushima Otsuka; OLETF: Otsuka Long-Evans Tokushima Fatty.
AGT mRNA localization in proximal tubule segments in diabetic rat kidneys
We calculated the area of the merged color as yellow produced by the colocalization of green AGT mRNA in situ hybridization and red proximal tubule segment specific immunostaining [26]. Because our data showed that AGT mRNA and protein were higher at 15 weeks in OLETF rats than in LETO rats (Figs. 1I and 2I), 15-week-old rat kidneys were used for the localization study.
From the merged images of AGT mRNA and SGLT2, AGT mRNA was barely detectable in the S1 segments of either LETO or OLETF rats (Additional file 1: Supplemental Fig. S2).
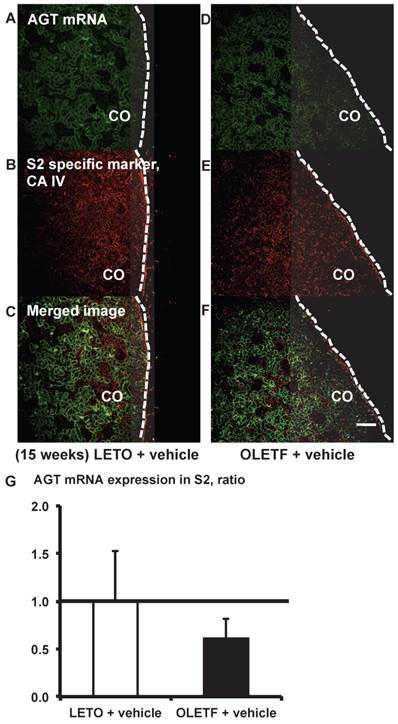
From the merged images (Fig. 3C and F) of AGT (Fig. 3A and D) mRNA and CA IV (Fig. 3B and E), AGT mRNA expression was weakly detectable in some areas of the S2 segments. AGT mRNA expression did not differ significantly between the LETO and OLETF rats (Fig. 3G).
AGT mRNA localization in proximal tubule segment (S) 2 in OLETF and LETO rats. The merged images of AGT mRNA (A and D) and the S2-specific marker CA IV (B and E) are shown in C (LETO rats) and F (OLETF rats). The calculated AGT mRNA expression in S2 is shown in G. Each value was expressed as a fold-increase against the average of protein level of LETO rats, which was taken as 1. Dotted lines indicate edge of kidney. Magnification, x100 (scale bar, 200 μm). AGT: angiotensinogen; LETO: Long-Evans Tokushima Otsuka; OLETF: Otsuka Long-Evans Tokushima Fatty; CA IV: carbonic anhydrase IV; CO: cortex.
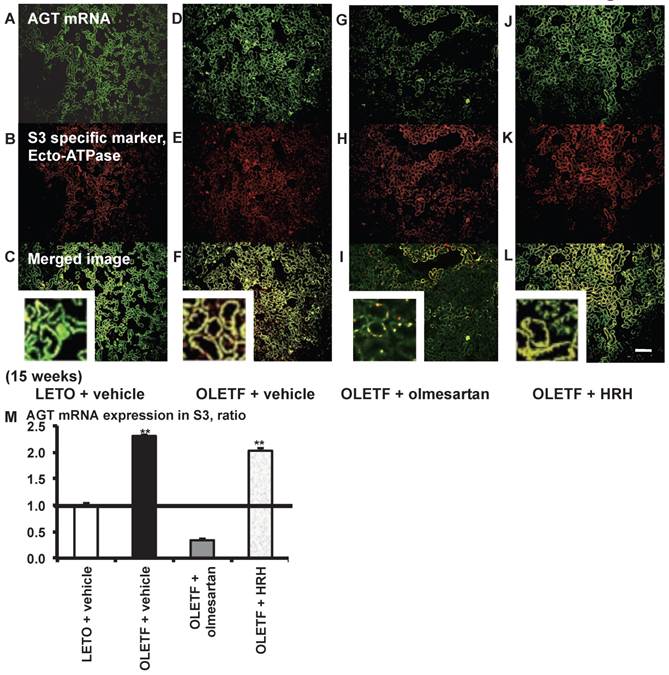
From the merged images (Fig. 4C, F, I, and L) of AGT mRNA (Fig. 4A, D, G, and J) and ecto-ATPase (Fig. 4B, E, H, and K), AGT mRNA expression was strongly detected in the S3 segments, and was increased in the S3 segments of OLETF rat kidneys compared with LETO rat kidneys. This increased AGT expression was reversed by olmesartan treatment, while HRH treatment had no effect (Fig. 4M).
AGT mRNA localization in proximal tubule segment (S) 3 in OLETF and LETO rats. The merged images of AGT mRNA (A, D, G, and J) and the S3-specific marker ecto-ATPase (B, E, H, and K) are shown in C (LETO rats), F (OLETF rats), I (OLETF + olmesartan), and L (OLETF + HRH). The calculated AGT mRNA expression in S3 is shown in M. Each value was expressed as a fold-increase against the average of protein level of LETO rats, which was taken, which was taken as 1. ** P < 0.01 vs. LETO + vehicle. Magnification, x100 (scale bar, 200 μm). High magnification images of C, F, I, and L are also attached. AGT: angiotensinogen; LETO: Long-Evans Tokushima Otsuka; OLETF: Otsuka Long-Evans Tokushima Fatty; ecto-ATPase: ecto-adenosinetriphosphatase; HRH: hydralazine, reserpine, and hydrochlorothiazide.
AGT protein localization in proximal tubule segments in diabetic rat kidneys
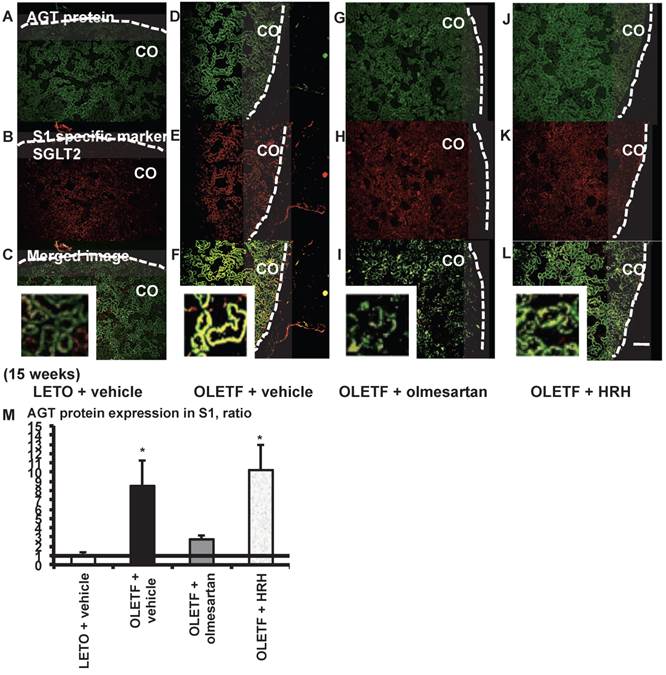
From the merged images (Fig. 5C, F, I, and L) of AGT protein (Fig. 5A, D, G, and J) and SGLT2 (Fig. 5B, E, H, and K), areas of AGT protein were detected mainly in the S1 segments, and were increased in the OLETF rat kidneys compared with the LETO rat kidneys. The increase in AGT protein expression in the S1 segments was reversed by olmesartan treatment, while HRH treatment had no effect (Fig. 5M).
AGT protein localization in proximal tubule segment (S) 1 in OLETF and LETO rats. The merged images of AGT protein (A, D, G, and J) and the S1-specific marker SGLT2 (B, E, H, and K) are shown in C (LETO rats), F (OLETF rats), I (OLETF + olmesartan), and L (OLETF + HRH). The calculated AGT protein expression in S1 is shown in M. Each value was expressed as a fold-increase against the average of protein level of LETO rats, which was taken as 1. * P < 0.05 vs. LETO + vehicle. Dotted line indicates edge of kidney. Magnification, x100 (scale bar, 200 μm). High magnification images of C, F, I, and L are also attached. AGT: angiotensinogen; LETO: Long-Evans Tokushima Otsuka; OLETF: Otsuka Long-Evans Tokushima Fatty; SGLT2: sodium glucose cotransporter 2; HRH: hydralazine, reserpine, and hydrochlorothiazide; CO: cortex.
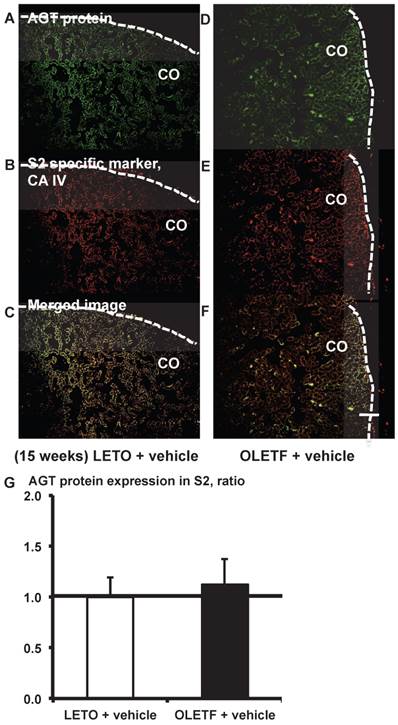
From the merged images (Fig. 6C and F) of AGT protein (Fig. 6A and D) and CA IV (Fig. 6B and E), areas of AGT protein were detectable in the S2 segments, but did not differ significantly between the LETO and OLETF rats (Fig. 6G).
AGT protein localization in proximal tubule segment (S) 2 in OLETF and LETO rats. The merged images of AGT protein (A and D) and the S2-specific marker CA IV (B and E) are shown in C (LETO rats) and F (OLETF rats). The calculated AGT protein expression in S2 is shown in G. Each value was expressed as a fold-increase against the average of protein level of LETO rats, which was taken as 1. Dotted lines indicate edge of kidney. Magnification, x100 (scale bar, 200 μm). AGT: angiotensinogen; LETO: Long-Evans Tokushima Otsuka; OLETF: Otsuka Long-Evans Tokushima Fatty; CA IV: carbonic anhydrase IV; CO: cortex.
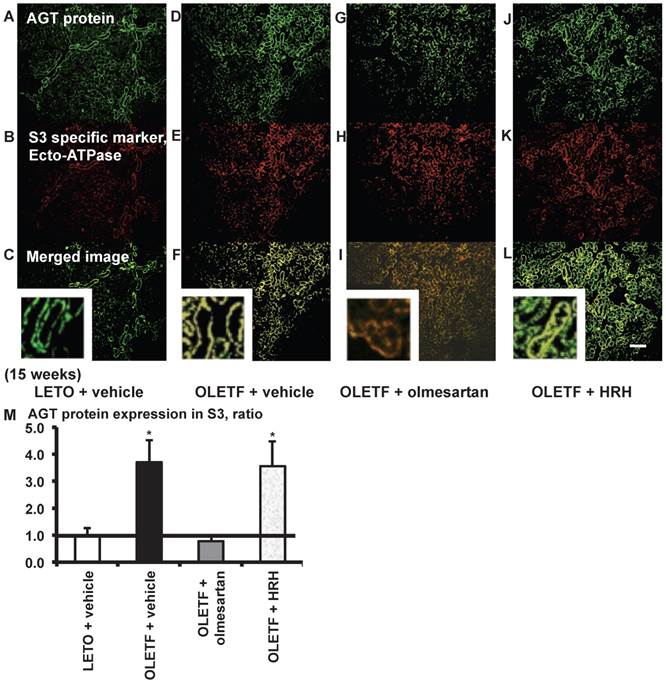
From the merged images (Fig. 7C, F, I, and L) of AGT protein (Fig. 7A, D, G, and J) and ecto-ATPase (Fig. 7B, E, H, and K), areas of AGT protein were detected in the S3 segments, and were increased in OLETF rat kidneys compared with LETO rat kidneys. Increased areas of AGT protein in the S3 segments were reversed by olmesartan treatment, while HRH treatment had no effect (Fig. 7M).
AGT protein localization in proximal tubule segment (S) 3 in OLETF and LETO rats. The merged images of AGT protein (A, D, G, and J) and the S3-specific marker ecto-ATPase (B, E, H, and K) are shown in C (LETO rats), F (OLETF rats), I (OLETF + olmesartan), and L (OLETF + HRH). The calculated AGT protein expression in S3 is shown in M. Each value was expressed as a fold-increase against the average of protein level of LETO rats, which was taken as 1. * P < 0.05 vs. LETO + vehicle. Magnification, x100 (scale bar, 200 μm). High magnification images of C, F, I, and L are also attached. AGT: angiotensinogen; LETO: Long-Evans Tokushima Otsuka; OLETF: Otsuka Long-Evans Tokushima Fatty; HRH: hydralazine, reserpine, and hydrochlorothiazide; ecto-ATPase: ecto-adenosinetriphosphatase.
Additionally, we investigated the correlation between AGT expression in S3 and urinary AGT excretion in the 15-week-old rats used in this study. Urinary AGT excretion was increased in diabetic OLETF rats (48.1 ± 27.4 µg/g Cr) compared with control LETO rats (6.5 ± 2.4 µg/g Cr) (P = 0.03). Our data also demonstrated a trend of decreased urinary AGT in ARB-treated rats (12.3 ± 6.2 µg/g Cr) compared with the OLETF rats (P = 0.06). Furthermore, AGT protein in S3 was positively correlated with urinary AGT excretion (urinary AGT = 8.08 + 1.89 AGT protein in S3, r = 0.5548, P = 0.0318) (Additional file 1: Supplemental Fig. S3). However, there was no correlation between AGT expression in S1 and urinary AGT excretion.
Subjects' profiles and laboratory data
The demographics and the baseline laboratory data of the included subjects are summarized in Tables 2 and 3. The results of estimated glomerular filtration rate (eGFR; mL/min/1.73 m2) [44] were as follows: ≥ 90 in 4 patients; 60 - 89 in 3 patients; 30 - 59 in 10 patients; 15 - 29 in 2 patients.
Subject profiles.
| Parameters | Control subjects | Patients with DN | P Value | χ2 |
|---|---|---|---|---|
| (N = 12) | (N = 19) | |||
| Gender, W/M | 10/2 | 8/11* | 0.0235 | 5.134 |
| Age, y | 38.8 ± 2.9 | 52.2 ± 3.1* | 0.0045 | |
| Height, cm | 159.7 ± 2.1 | 161.5 ± 1.9 | 0.4778 | |
| BW, kg | 54.4 ± 4.1 | 68.1 ± 2.3* | 0.0058 | |
| BMI | 21.2 ± 1.4 | 26.2 ± 0.9* | 0.0051 | |
| SBP, mmHg | 117.3 ± 4.6 | 155.5 ± 7.3* | 0.0002 | |
| DBP, mmHg | 70.7 ± 3.1 | 88.5 ± 3.1* | 0.0021 |
DN indicates diabetic nephropathy; W, women; M, men; BW, body weight; BMI, body mass index; SBP, systolic blood pressure; DBP, diastolic blood pressure. * P < 0.05 vs. control subjects.
Laboratory data.
| Parameters | Control subjects | Patients with DN | P Value |
|---|---|---|---|
| (N = 12) | (N = 19) | ||
| BG, mg/dl | 93.2 ± 4.6 | 170.5 ± 12.3* | 0.0003 |
| HbA1c, % | (N/A) | 8.1 ± 0.5 | (N/A) |
| T-Cho, mg/dl | 190.4 ± 14.0 | 250.4 ± 15.2* | 0.0119 |
| TG, mg/dl | 165.3 ± 48.1 | 309.0 ± 55.8* | 0.0106 |
| HDL, mg/dl | 64.5 ± 5.3 | 50.5 ± 2.3* | 0.0200 |
| LDL, mg/dl | 95.6 ± 10.9 | 135.9 ± 15.7 | 0.0891 |
| UNA, g/day | 2.2 ± 0.2 | 2.3 ± 0.2 | 0.8702 |
| UCl, g/day | 3.2 ± 0.4 | 3.0 ± 0.4 | 0.6238 |
| UNaCl, g/day | 5.4 ± 0.6 | 5.3 ± 0.6 | 0.7855 |
| UPro, mg/day | 91.7 ± 24.4 | 4078.2 ± 928.8* | < 0.0001 |
| Serum Cr, mg/dl | 0.6 ± 0.04 | 1.1 ± 0.2* | 0.0166 |
| eGFR, mL/min/per 1.73 m2 | 97.8 ± 6.1 | 68.3 ± 8.9* | 0.0219 |
HbA1c was measured according to the method of the Japan Diabetes Society (JDS) unit. DN indicates diabetic nephropathy; BG, blood glucose; HbA1c, hemoglobin A1c; T-Cho, total cholesterol; TG, triglyceride; HDL, high density lipoprotein; LDL, low density lipoprotein; UNA, urinary sodium excretion; UCl, urinary chloride excretion; UNaCl, urinary sodium chloride excretion; UPro, urinary protein excretion; Cr, creatinine; eGFR, estimated glomerular filtration rate. * P < 0.05 vs. control subjects.
AGT expression in the human renal cortex proximal tubule segments
We were hardly able to recognize the S3 segments in human kidney cortex samples, and instead focused on AGT expression in the S1 and S2 segments.
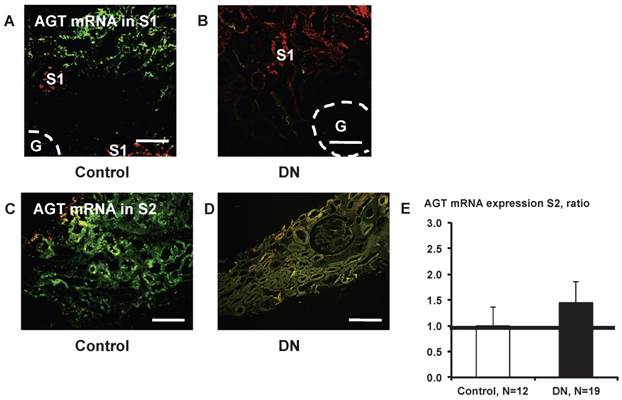
Little AGT mRNA expression was detected in S1 segments (Fig. 8A and B). AGT mRNA in S2 did not differ significantly (Fig. 8E) between control subjects (Fig. 8C) and patients with type 2 diabetes (Fig. 8D).
AGT mRNA localization in the kidney cortex proximal tubule segment (S)s of patients with diabetes. Little AGT mRNA was detected in S1 in control subjects (A) and in patients with diabetes (B). AGT mRNA in S2 did not differ significantly (E) between control subjects (C) and patients with type 2 diabetes (D). Data are presented as a fold-increase compared with the levels of control subjects. Green; AGT mRNA, Red; segment-specific marker. Dotted lines indicate the edge of glomeruli. Magnification, x200 (scale bar, 100 μm). AGT: angiotensinogen; DN: diabetic nephropathy; G: glomeruli.
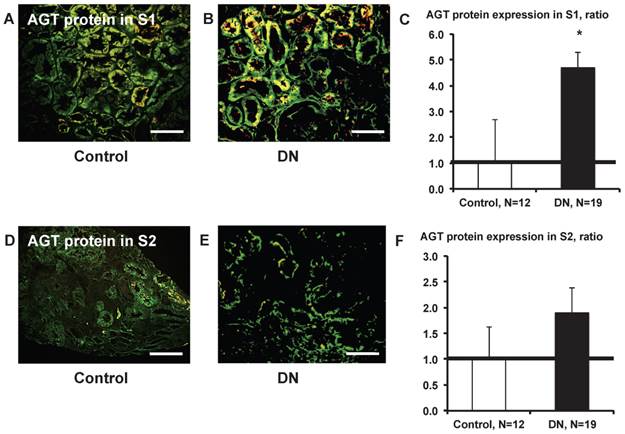
AGT protein expression in S1 was significantly greater (Fig. 9C) in patients with type 2 diabetes (Fig. 9B) compared with control subjects (Fig. 9A). AGT protein expression in S2 did not differ significantly (Fig. 9F) between control subjects (Fig. 9D) and patients with type 2 diabetes (Fig.9E).
AGT protein localization in the kidney cortex proximal tubule segment (S)s of patients with diabetes. AGT protein expression in S1 was significantly greater (C) in patients with type 2 diabetes (B) compared with control subjects (A). AGT protein expression in S2 did not differ significantly (F) between and control subjects (D) and patients with type 2 diabetes (E). Data are presented as a fold-increase compared with the levels of control subjects. * P < 0.05 vs. control subjects. Green; AGT protein, Red; segment-specific marker. Magnification, x200 (scale bar, 100 μm). AGT: angiotensinogen; DN: diabetic nephropathy.
Discussion
While increased levels of intrarenal AGT have been shown in type 1 and 2 diabetic mice [8, 9] and rats [10, 11], the precise segment(s) of the proximal tubules in which AGT mRNA and protein are increased remains uncertain.
To detect AGT in the 3 proximal tubule segments, we recently developed 2 methods; multi-staining methods [26] and primary cultures of proximal tubule segments [25], using unique proximal tubule segment-specific markers [39, 45, 46]. Using these methods, we clearly showed that the localization of AGT mRNA and protein in the proximal tubule segments differed under normal condition [25, 26, 47]. Our data suggest that AGT transcription occurs mainly in S3 segments and AGT protein is shown in all segments under normal conditions.
To investigate in detail variations of AGT localization in the 3 proximal tubule segments of the kidneys in diabetes, we used OLETF rats, a model of slowly progressive obese type 2 diabetes, and LETO rats as genetic controls. In addition, we studied biopsied samples of human kidney cortex. Fifteen-week-old rat kidneys showed largely undetectable AGT mRNA expression in the S1 segments of either OLETF or LETO rat kidneys (Additional file 1: Supplemental Fig. S1). AGT mRNA expression in S3 was elevated in the OLETF rats relative to the LETO rats (Fig. 4). Areas of AGT protein in S1 and S3 were also increased in the OLETF rat kidneys (Figs. 5 and 7). Chronic treatment with olmesartan, but not with HRH, reversed the increase in areas of AGT mRNA and protein (Figs. 4, 5, and 7). Human kidney cortical biopsied samples confirmed that AGT protein in S1 was increased in diabetes (Fig. 9C). As we could not recognize a large enough number of S3 proximal tubules in human kidney cortical biopsies for statistical analysis, we could not compare the AGT expression in S3 between the groups. Therefore, we have not shown any data of AGT in human kidney S3. The lack of the results of S3 in human data is a weak point of this study and alternative sources of renal tissue are currently being investigated. However, similarities in S1 results between both animal and human data are strongly support the finding of localized S1-specific increases in AGT in diabetic kidneys.
From our results, we propose that the increased levels of urinary AGT in DN are derived primarily from the S3 segments (however other segments may also make a contribution), and that excess AGT mRNA expression and the translation of AGT protein in S3 is important in AGT metabolism in the progression of DN. We also investigated the correlation between AGT expression in S3 and urinary AGT excretion in the 15-week-old rats used in this study. Urinary AGT excretion was increased in OLETF diabetic rats compared with LETO control rats. Our data also showed that urinary AGT in ARB-treated rats had a tendency to be reduced compared with the OLETF rats and AGT protein in S3 was positively correlated with urinary AGT. Notably, there was no correlation between AGT expression in S1 and urinary AGT. These results are consistent with our previous reports showing augmented AGT expression in kidney and increased urinary AGT in the diabetic condition [5-11].
From our data, increased AGT protein in the S1 segments is also important in the progression of DN. Although both animal and human data showed that AGT mRNA was barely detectable in the S1 segments of control or diabetic kidneys, AGT protein in S1 was significantly greater in type 2 diabetes compared with controls in both animal and human studies. Our demonstration of augmented AGT protein in S1 in the patients with diabetes is a novel finding, and the result supports the relevance of results gained from the study in OLETF rats. The significance of AGT protein in S1 in the development and progression of diabetic nephropathy will be clarified in future studies.
Therefore, the answer to the question of the origin of the AGT protein in S1 remains unclear. Previously, we reported AGT mRNA and protein expressions not only in proximal tubules but also in glomeruli, especially in the mesangial cells [26, 48]. Also, Matsusaka et al. reported that liver AGT is the primary source of renal angiotensin II [49]. Recently, they also reported that podocyte injury enhances filtration of liver-derived AGT [50]. From previous reports, it may be speculated that secreted AGT protein from glomeruli or liver AGT translocates to the S1 segments, where AGT signaling through membrane receptors such as megalin and cubilin could contribute to the progression of DN. Therefore, the origin of the AGT protein in S1 may in fact be from some sources. Additionally, in an in vivo study, receptors located in S1 were taken into the cytosol by endocytosis [30]. Therefore, although in vitro and in vivo studies show that augmented AGT induces proximal tubular hypertrophy [51] and proximal tubular apoptosis [52], further investigation is still needed on the detailed mechanism of how AGT in S1 contributes to disease.
Elevated glucose, glucose metabolites by the hexosamine and polyol pathways and oxidative stress are thought to induce RAS activation and, at least in part, increase AGT levels responsible for the development and progression of DN [23, 48, 53, 54]. In support this hypothesis, others and we have reported that insulin treatment ameliorated the AGT expression in the proximal tubules and augmented urinary AGT excretion in diabetes [9, 51]. In our current results, ARB treatment, but not HRH treatment, suppressed increased AGT in specific proximal tubule segments; AGT mRNA in S3 and AGT protein in S1 and S3. Our data also demonstrate that ARB treatment decreases angiotensin II in the kidney and urinary albumin (a DN marker) (Table 1). Furthermore, another reports show that ARB treatment inhibits the progression of DN through suppression of oxidative stress and urinary AGT, as well as the reduction of monocyte chemoattractant protein (MCP)-1 and interleukin (IL)-6 present in later diabetes [5, 55]. From these results, we can summarize our proposed hypothesis; the diabetic condition induces AGT mRNA and protein in S3, leading to increased urinary AGT excretion. AGT protein in S1 is taken into the cells by endocytosis and may contribute to cell signaling pathways. ARB treatment inhibits AGT expression and urinary AGT excretion via suppression of the activated RAS [15, 56, 57]. As a result, ARB may suppress the progression of DN.
In conclusion, we have demonstrated that AGT is increased in specific proximal tubule segments in the kidney in DN. In future studies, we will use the in vitro and in vivo methods that we have described here to investigate the function of AGT in the development and progression of DN, including the role of AGT protein in S1 and the significance of urinary AGT excretion with AGT expression in S3. At the same time, we will determine the effect of RAS blockades on intrarenal/urinary AGT to help assess the clinical significance of the reduction in intrarenal/urinary AGT by RAS blockades.
Supplementary Material
Additional File 1Supplemental Figs. S1-S3.
Acknowledgements
This study was supported by a grant from National Institute of Diabetes and Digestive and Kidney Diseases (R01DK072408) and a COBRE grant from National Center for Research Resources (P20RR017659).
Competing Interests
The authors have declared that no competing interest exists.
References
1. Ingelfinger JR, Zuo WM, Fon EA, Ellison KE, Dzau VJ. In situ hybridization evidence for angiotensinogen messenger RNA in the rat proximal tubule. An hypothesis for the intrarenal renin angiotensin system. J Clin Invest. 1990;85:417-423
2. Kobori H, Harrison-Bernard LM, Navar LG. Expression of angiotensinogen mRNA and protein in angiotensin II-dependent hypertension. J Am Soc Nephrol. 2001;12:431-9
3. Castrop H, Hocherl K, Kurtz A, Schweda F, Todorov V, Wagner C. Physiology of kidney renin. Physiol Rev. 2010;90:607-673
4. B Burns KD, Hiremath S. Urinary angiotensinogen as a biomarker of chronic kidney disease: ready for prime time? Nephrol Dial Transplant. 2012;27:3010-3013
5. Ogawa S, Kobori H, Ohashi N, Urushihara M, Nishiyama A, Mori T. et al. Angiotensin II Type 1 Receptor Blockers Reduce Urinary Angiotensinogen Excretion and the Levels of Urinary Markers of Oxidative Stress and Inflammation in Patients with Type 2 Diabetic Nephropathy. Biomark Insights. 2009;4:97-102
6. Saito T, Urushihara M, Kotani Y, Kagami S, Kobori H. Increased urinary angiotensinogen is precedent to increased urinary albumin in patients with type 1 diabetes. Am J Medl Sci. 2009;338:478-480
7. Kamiyama M, Urushihara M, Morikawa T, Konishi Y, Imanishi M, Nishiyama A, Kobori H. Oxidative stress/angiotensinogen/renin-angiotensin system axis in patients with diabetic nephropathy. Int J Mol Sci. 2013;14:23045-23062
8. Park S, Bivona BJ, Kobori H, Seth DM, Chappell MC, Lazartigues E. et al. Major role for ACE-independent intrarenal ANG II formation in type II diabetes. Am J Physiol Renal Physiol. 2010;298:F37-F48
9. Kamiyama M, Zsombok A, Kobori H. Urinary angiotensinogen as a novel early biomarker of intrarenal Renin-Angiotensin system activation in experimental type 1 diabetes. J Pharmacol Sci. 2012;119:314-323
10. Suzaki Y, Ozawa Y, Kobori H. Intrarenal oxidative stress and augmented angiotensinogen are precedent to renal injury in Zucker diabetic fatty rats. Int J Biol Sci. 2007;3:40-46
11. Miyata K, Ohashi N, Suzaki Y, Katsurada A, Kobori H. Sequential activation of the reactive oxygen species/angiotensinogen/renin-angiotensin system axis in renal injury of type 2 diabetic rats. Clin Exp Pharmacol Physiol. 2008;35:922-927
12. Nakano D, Kobori H, Burford JL, Gevorgyan H, Seidel S, Hitomi H. et al. Multiphoton imaging of the glomerular permeability of angiotensinogen. J Am Soc Nephrol. 2012;23:1847-1856
13. Haller H, Ito S, Izzo JL Jr, Januszewicz A, Katayama S, Menne J. et al. Olmesartan for the delay or prevention of microalbuminuria in type 2 diabetes. N Engl J Med. 2011;364:907-17
14. Brownlee M. Biochemistry and molecular cell biology of diabetic complications. Nature. 2001;414:813-820
15. Kobori H, Nangaku M, Navar LG, Nishiyama A. The intrarenal renin-angiotensin system: from physiology to the pathobiology of hypertension and kidney disease. Pharmacol Rev. 2007;59:251-287
16. Kobori H, Urushihara M. Augmented intrarenal and urinary angiotensinogen in hypertension and chronic kidney disease. Pflugers Arch. 2013;465:3-12
17. Cassis P, Conti S, Remuzzi G, Benigni A. Angiotensin receptors as determinants of life span. Pflugers Arch. 2010;459:325-332
18. Ingelfinger JR. Preemptive olmesartan for the delay or prevention of microalbuminuria in diabetes. N Engl J Med. 2011;364:970-971
19. Navar LG, Harrison-Bernard LM, Nishiyama A, Kobori H. Regulation of intrarenal angiotensin II in hypertension. Hypertension. 2002;39:316-322
20. Gould AB, Green D. Kinetics of the human renin and human substrate reaction. Cardiovasc Res. 1971;5:86-89
21. Brasier AR, Li J. Mechanisms for inducible control of angiotensinogen gene transcription. Hypertension. 1996;27:465-475
22. Zhang SL, Tang SS, Chen X, Filep JG, Ingelfinger JR, Chan JS. High levels of glucose stimulate angiotensinogen gene expression via the P38 mitogen-activated protein kinase pathway in rat kidney proximal tubular cells. Endocrinology. 2000;141:4637-4646
23. Hsieh TJ, Fustier P, Zhang SL, Filep JG, Tang SS, Ingelfinger JR. et al. High glucose stimulates angiotensinogen gene expression and cell hypertrophy via activation of the hexosamine biosynthesis pathway in rat kidney proximal tubular cells. Endocrinology. 2003;144:4338-4349
24. Helbert MJ, Dauwe SE, Van der Biest I, Nouwen EJ, De Broe ME. Immunodissection of the human proximal nephron: flow sorting of S1S2S3, S1S2 and S3 proximal tubular cells. Kidney Int. 1997;52:414-428
25. Kamiyama M, Garner MK, Farragut KM, Kobori H. The establishment of a primary culture system of proximal tubule segments using specific markers from normal mouse kidneys. Int J Mol Sci. 2012;13:5098-5111
26. Kamiyama M, Farragut KM, Garner MK, Navar LG, Kobori H. Divergent localization of angiotensinogen mRNA and protein in proximal tubule segments of normal rat kidney. J Hypertens. 2012;30:2365-2372
27. Yanagawa N, Capparelli AW, Jo OD, Friedal A, Barrett JD, Eggena P. Production of angiotensinogen and renin-like activity by rabbit proximal tubular cells in culture. Kidney Int. 1991;39:938-941
28. Terada Y, Tomita K, Nonoguchi H, Marumo F. PCR localization of angiotensin II receptor and angiotensinogen mRNAs in rat kidney. Kidney Int. 1993;43:1251-1259
29. Darby IA, Sernia C. In situ hybridization and immunohistochemistry of renal angiotensinogen in neonatal and adult rat kidneys. Cell Tissue Res. 1995;281:197-206
30. Pohl M, Kaminski H, Castrop H, Bader M, Himmerkus N, Bleich M. et al. Intrarenal renin angiotensin system revisited: role of megalin-dependent endocytosis along the proximal nephron. J Biol Chem. 2010;285:41935-41946
31. Kobori H, Ozawa Y, Suzaki Y, Nishiyama A. Enhanced intrarenal angiotensinogen contributes to early renal injury in spontaneously hypertensive rats. J Am Soc Nephrol. 2005;16:2073-2080
32. Nagai Y, Yao L, Kobori H, Miyata K, Ozawa Y, Miyatake A. et al. Temporary angiotensin II blockade at the prediabetic stage attenuates the development of renal injury in type 2 diabetic rats. J Am Soc Nephrol. 2005;16:703-711
33. Wienen W, Richard S, Champeroux P, Audeval-Gerard C. Comparative antihypertensive and renoprotective effects of telmisartan and lisinopril after long-term treatment in hypertensive diabetic rats. J Renin Angiotensin Aldosterone Syst. 2001;2:31-36
34. Sofue T, Kiyomoto H, Kobori H, Urushihara M, Nishijima Y, Kaifu K. et al. Early treatment with olmesartan prevents juxtamedullary glomerular podocyte injury and the onset of microalbuminuria in type 2 diabetic rats. Am J Hypertens. 2012;25:604-611
35. Kobori H, Alper AB Jr, Shenava R, Katsurada A, Saito T, Ohashi N. et al. Urinary angiotensinogen as a novel biomarker of the intrarenal renin-angiotensin system status in hypertensive patients. Hypertension. 2009;53:344-350
36. Kobori H, Urushihara M, Xu JH, Berenson GS, Navar LG. Urinary angiotensinogen is correlated with blood pressure in men (Bogalusa Heart Study). J Hypertens. 2010;28:1422-1428
37. Konishi Y, Nishiyama A, Morikawa T, Kitabayashi C, Shibata M, Hamada M. et al. Relationship between urinary angiotensinogen and salt sensitivity of blood pressure in patients with IgA nephropathy. Hypertension. 2011;58:205-211
38. Ohashi N, Yamamoto T, Huang Y, Misaki T, Fukasawa H, Suzuki H. et al. Intrarenal RAS activity and urinary angiotensinogen excretion in anti-thymocyte serum nephritis rats. Am J Physiol Renal Physiol. 2008;295:F1512-F1518
39. Kanai Y, Lee WS, You G, Brown D, Hediger MA. The human kidney low affinity Na+/glucose cotransporter SGLT2. Delineation of the major renal reabsorptive mechanism for D-glucose. J Clin Invest. 1994;93:397-404
40. Brown D, Zhu XL, Sly WS. Localization of membrane-associated carbonic anhydrase type IV in kidney epithelial cells. Proc Natl Acad Sci USA. 1990;87:7457-7461
41. Kanai Y, Stelzner MG, Lee WS, Wells RG, Brown D, Hediger MA. Expression of mRNA (D2) encoding a protein involved in amino acid transport in S3 proximal tubule. AmJ Physiol. 1992;263:F1087-F1092
42. Zhuo JL, Li XC. Proximal nephron. Compr Physiol. 2013;3:1079-1123
43. Li XC, Zhuo JL. Proximal tubule-dominant transfer of AT(1a) receptors induces blood pressure responses to intracellular angiotensin II in AT(1a) receptor-deficient mice. Am J Physiol Regul Integr Comp Physiol. 2013;304:R588-R598
44. Min TZ, Stephens MW, Kumar P, Chudleigh RA. Renal complications of diabetes. Br Med Bull. 2012;104:113-127
45. Sugawara-Yokoo M, Suzuki T, Matsuzaki T, Naruse T, Takata K. Presence of fructose transporter GLUT5 in the S3 proximal tubules in the rat kidney. Kidney Int. 1999;56:1022-1028
46. Vanslambrouck JM, Broer A, Thavyogarajah T, Holst J, Bailey CG, Broer S. et al. Renal imino acid and glycine transport system ontogeny and involvement in developmental iminoglycinuria. Biochem J. 2010;428:397-407
47. Kobori H, Kamiyama M, Harrison-Bernard LM, Navar LG. Cardinal role of the intrarenal Renin-Angiotensin system in the pathogenesis of diabetic nephropathy. J Investig Med. 2013;61:256-264
48. Ohashi N, Urushihara M, Satou R, Kobori H. Glomerular angiotensinogen is induced in mesangial cells in diabetic rats via reactive oxygen species--ERK/JNK pathways. Hypertens Res. 2010;33:1174-1181
49. Matsusaka T, Niimura F, Shimizu A, Pastan I, Saito A, Kobori H. et al. Liver Angiotensinogen Is the Primary Source of Renal Angiotensin II. J Am Soc Nephrol. 2012;23:1181-1189
50. Matsusaka T, Niimura F, Pastan I, Shintani A, Nishiyama A, Ichikawa I. Podocyte injury enhances filtration of liver-derived angiotensinogen and renal angiotensin II generation. Kidney int. 2013 doi:10.1038/ki.2013.453
51. Zhang SL, Chen X, Wei CC, Filep JG, Tang SS, Ingelfinger JR. et al. Insulin inhibits dexamethasone effect on angiotensinogen gene expression and induction of hypertrophy in rat kidney proximal tubular cells in high glucose. Endocrinology. 2002;143:4627-4635
52. Liu F, Brezniceanu ML, Wei CC, Chenier I, Sachetelli S, Zhang SL. et al. Overexpression of angiotensinogen increases tubular apoptosis in diabetes. J Am Soc Nephrol. 2008;19:269-280
53. Wang TT, Wu XH, Zhang SL, Chan JS. Effect of glucose on the expression of the angiotensinogen gene in opossum kidney cells. Kidney Int. 1998;53:312-319
54. Zhang SL, Filep JG, Hohman TC, Tang SS, Ingelfinger JR, Chan JS. Molecular mechanisms of glucose action on angiotensinogen gene expression in rat proximal tubular cells. Kidney Int. 1999;55:454-464
55. Ihara G, Kiyomoto H, Kobori H, Nagai Y, Ohashi N, Hitomi H. et al. Regression of superficial glomerular podocyte injury in type 2 diabetic rats with overt albuminuria: effect of angiotensin II blockade. J Hypertens. 2010;28:2289-2298
56. Kobori H, Prieto-Carrasquero MC, Ozawa Y, Navar LG. AT1 receptor mediated augmentation of intrarenal angiotensinogen in angiotensin II-dependent hypertension. Hypertension. 2004;43:1126-1132
57. Kobori H, Ozawa Y, Suzaki Y, Prieto-Carrasquero MC, Nishiyama A, Shoji T. et al. Young Scholars Award Lecture: Intratubular angiotensinogen in hypertension and kidney diseases. Am J Hypertens. 2006;19:541-550
Author contact
![]() Corresponding author: Hiroyuki Kobori, MD, PhD, FJSIM, FAHA, FASN, FJSH, FJSN, FACP, Departments of Physiology and of Medicine, and Hypertension and Renal Center of Excellence, Tulane University Health Sciences Center, 1430 Tulane Avenue, New Orleans, LA 70112, USA. Tel: +1-504-988-2591, Fax: +1-504-988-0911, E-mail: hkoboriedu.
Corresponding author: Hiroyuki Kobori, MD, PhD, FJSIM, FAHA, FASN, FJSH, FJSN, FACP, Departments of Physiology and of Medicine, and Hypertension and Renal Center of Excellence, Tulane University Health Sciences Center, 1430 Tulane Avenue, New Orleans, LA 70112, USA. Tel: +1-504-988-2591, Fax: +1-504-988-0911, E-mail: hkoboriedu.