Impact Factor ISSN: 1449-2288
- Issue 12; 2026
- Issue 11; 2026
- Issue 10; 2026
- Issue 9; 2026
- Issue 8; 2026
- Volume 22; 2026
- Past Issues
- Advance Articles
- Editorial Board
- Cover Images
- Index & Coverage
- Cover Suggestion
- Special Issues
Introduction
Materials and Methods
Results
Discussion
Supplementary Material
Acknowledgements
References

 Global reach, higher impact
Int J Biol Sci 2014; 10(9):1039-1050. doi:10.7150/ijbs.9737 This issue Cite
Research Paper
Co-Expression Analysis of Fetal Weight-Related Genes in Ovine Skeletal Muscle during Mid and Late Fetal Development Stages
Lingyang Xu1,4,5#, Fuping Zhao1#, Hangxing Ren1,2#, Li Li1,3#, Jian Lu1, Jiasen Liu1, Shifang Zhang1, George E. Liu4, Jiuzhou Song5, Li Zhang1, Caihong Wei1 ![]() , Lixin Du1
, Lixin Du1 ![]()
1. National Center for Molecular Genetics and Breeding of Animal, Institute of Animal Sciences, Chinese Academy of Agricultural Sciences, Beijing, 100193, China;
2. Chongqing Academy of Animal Sciences, Chongqing, 402460, China;
3. College of Animal Science and Technology, Sichuan Agricultural University, Ya′an, Sichuan, 625014, China.
4. Animal Genomics and Improvement Laboratory, U.S. Department of Agriculture-Agricultural Research Services, Beltsville, Maryland 20705, USA;
5. Department of Animal and Avian Sciences, University of Maryland, College Park, Maryland 20742, USA.
#These authors contributed equally to this work.
Received 2014-5-25; Accepted 2014-8-16; Published 2014-9-11
Abstract
Background: Muscle development and lipid metabolism play important roles during fetal development stages. The commercial Texel sheep are more muscular than the indigenous Ujumqin sheep.
Results: We performed serial transcriptomics assays and systems biology analyses to investigate the dynamics of gene expression changes associated with fetal longissimus muscles during different fetal stages in two sheep breeds. Totally, we identified 1472 differentially expressed genes during various fetal stages using time-series expression analysis. A systems biology approach, weighted gene co-expression network analysis (WGCNA), was used to detect modules of correlated genes among these 1472 genes. Dramatically different gene modules were identified in four merged datasets, corresponding to the mid fetal stage in Texel and Ujumqin sheep, the late fetal stage in Texel and Ujumqin sheep, respectively. We further detected gene modules significantly correlated with fetal weight, and constructed networks and pathways using genes with high significances. In these gene modules, we identified genes like TADA3, LMNB1, TGF-β3, EEF1A2, FGFR1, MYOZ1, and FBP2 correlated with fetal weight.
Conclusion: Our study revealed the complex network characteristics involved in muscle development and lipid metabolism during fetal development stages. Diverse patterns of the network connections observed between breeds and fetal stages could involve some hub genes, which play central roles in fetal development, correlating with fetal weight. Our findings could provide potential valuable biomarkers for selection of body weight-related traits in sheep and other livestock.
Keywords: Serial expression analysis, WGCNA, fetal development stages, fetal weight.
Introduction
Mammalian back skeletal muscles are one of the largest muscle groups, spanning the entire thoracic and lumbar regions [1]. In addition, they serve as the power source for respiration, locomotion, and other physical activities and overall metabolism. It is well known that skeletal muscle development is negatively regulated by myostatin (MSTN) gene, which is a member of the transforming growth factor-β (TGF-β) family and is predominantly expressed and secreted by skeletal muscle cells. Mutations in the myostatin gene cause a hypertrophic phenotype have been widely reported in many species, including sheep [2, 3], cattle [4, 5], dog [6], mice [7], and human [8]. Moreover, many evidences have showed that GDF8 mutant has redder muscle fibers with more intramuscular fat and faster growth than those of the indigenous sheep [3, 9]. Texel sheep, a typical breed with "double muscle" due to a GDF8 mutation, are more muscular than those indigenous such as Ujumqin sheep [10]. Therefore, these two breeds are good models for study of differential muscle and fat development.
Prenatal body weight in fetus contributes to variations in postnatal growth performance in farm animals [11]. Previous studies have investigated whether developmental transitions are associated with large coordinated changes in the transcription of skeletal muscle genes. For example, one study has investigated transcriptome changes in ovine longissimus dorsi (LD) muscle between late fetal development (Day 120) and 1-3 days postpartum [12]. Many other studies explored the global effects of myostatin on gene expression in prenatal muscles in cattle across both pre- and post-natal developments [13-16]. Our previous studies have explored gene expression and myofiber development in Texel and Ujumqin sheep at both the transcriptome and histological levels using traditional pairwise differential expression statistical analyses during five fetal stages [17]. However, to our knowledge, no studies have been reported to systematically explore the gene expression networks throughout ovine fetal stages in a time-series fashion.
Till now, various microarray approaches have been used to investigate differential gene expression between distinct muscles in swine [18, 19], mice [20], chicken [21], cattle [22, 23] and sheep [12, 17]. Serial Expression Analysis (SEA) is a web tool to identify significant differential expression pattern in a time-series microarray experiments [24]. SEA adjusts a global regression model with all defined variables to identify differentially expressed genes [25]. Additionally, network approach is increasingly used in biology and genetics [26-28]. Many evidences have shown that the network connections exist between genes which are working together to contribute complex traits [26, 29]. The gene co-expression, as one of widely used approach to explore network characteristics under complex trait, has been carried out to explore gene expression correlation in human [30, 31], mouse [32], chicken [33], cattle [16], sheep [34].
Investigation of gene expression changes and complex interaction patterns among genes is an effective way to understand complex network architecture and explore whether there existed any hubs genes. Previously, a systems biology approach, weighted gene co-expression network analysis (WGCNA), was used to explore the hub genes which play central roles in gene modules [35, 36]. While traditional methods compare pair wise measurements, WGCNA can describe the correlation patterns among a series of transcript measurements across multiple microarrays. WGCNA was developed to find modules/clusters of highly correlated genes and link modules to quantitative traits, which has been successfully applied in a variety of different studies recently [33, 34, 37-41].
In this study, we tested whether we could detect differentially expressed genes and/or differentially connected genes between Texel and Ujumqin during the mid and late fetal stages. We identified 1472 differentially expressed genes by utilizing SEA during various stages in two sheep breeds. In addition, we constructed gene co-expression network based differential expressed genes using WGCNA. To reveal the higher-order organization of the ovine fetal muscle transcriptome and its relationship to fetal weight, we further detected trait-related gene modules and hub genes using data sets at mid and late fetal development stages. We identified a serial of hub genes such as TADA3, LMNB, EEF1A2, TGF-β3, and FGFR1, which could function as potential candidate genes involved in the muscle development and lipid metabolism during fetal development.
Materials and Methods
Microarray data
Expression data used in current study were retrieved from NCBI GEO database (GSE23563). These were collected on Agilent Sheep Oligo Microarray (8 × 15K) (Agilent Technologies, Santa Clara, CA, USA) for two pure sheep breeds, Texel and Ujumqin as previously described [17]. LD muscle samples were obtained at days 70, 85, 100, 120, and 135 with three biological replicates for each sample. Fetal weight were measured with electronic weighing instrument after fetal were extracted from ewes.
Time-course analysis of gene expression profiles during five fetal stages
Differentially expressed genes were identified during five fetal stages using the maSigPro method in the SEA web Tool [24, 25]. This method applied two-step approach. First, a global regression model was adjusted with all defined variables. And then a variable selection strategy was applied to study differences between groups to identify differentially expressed genes.
Gene module construction
WGCNA was used to detect and compare module components and their hub genes. This approach defines co-expressed gene modules representing molecular networks involved in a common biological pathway. Genes highly connected with others within these groups are considered to drive the modules and are identified as “hub genes”. The network construction algorithm was described previously [36, 42] and detailed information is available at http://www.genetics.ucla.edu/labs/horvath/CoexpressionNetwork/. Briefly, weighted co-expression networks were constructed based on the matrix of pair-wise Pearson's correlation coefficients, and a soft thresholding approach was used by raising each correction to a fixed power. The power was chosen using the scale-free topology criterion proposed previously [42]. Gene connectivity was then calculated by summing the connection strengths with other network genes. We used the dynamic branch-cutting algorithm implemented in dynamic TreeCut [43] and the WGCNA R library to detect modules [36].
To balance sample size and increase our detection power, we merged datasets from the mid fetal stage (70 and 85 d) into one data group named as mid fetal stage (6 animals) within one breed. We also merged datasets from the late fetal stage (120 and 135 d) into another data group named as later fetal stage (6 animals), and datasets from 100 d were not included in this analysis.
Using single weighted gene co-expression analysis option in WGCNA, we first constructed four networks from 1472 differentially expressed genes detected by maSigPro. In total, we obtained 4 gene networks representing 4 data groups (two breeds × two development stages): network A, Texel mid fetal stage; network B, Ujumqin mid fetal stage; network C, Texel late fetal stage; and network D, Ujumqin late fetal stage.
We correlated genes and gene modules with fetal weight as described before [43,44]. In brief, the eigengene module is a weighted average of the module gene expression profiles. The correlation between the eigengene module and fetal weight is referred to as eigengene significance. Pearson's correlation coefficients were computed between fetal weight and each gene within the eigengene module. This value was termed as the “gene significance” (GS) of a particular gene [35]. The geometric mean was then calculated for the absolute values of all GS scores within each module, yielding the “module significance” (MS) of particular module. A higher MS value indicates this module was highly correlated with fetal weight [45, 46].
Functional annotation of hub genes and modules
Only 1508 of the 15,008 probe sets were definitive for the limited annotation of the Agilent Sheep Gene Expression Microarray. We further investigated the function of the differentially expressed genes, we conducted a BLASTN search for highly homologous human sequences (search setting: query coverage not less than 50%, E value < 1.00E-100) [17]. To test whether the identified modules were biologically meaningful during skeletal muscle development, we conducted a functional enrichment analysis using the DAVID database [47]. We mainly investigated genes associated with muscle development and lipid metabolism, and key genes related to fetal traits.
Module visualization and differential network analysis
Modules of high correlation score with fetal weight (MS) were used for network visualization analysis. In each module, positively and negatively correlated genes of high/low GS values (> 0.8 / < -0.8) were used as the input for VisANT v3.5, a integrative visual analysis tool for biological networks [48].
Results
Differential gene expression during five fetal stages
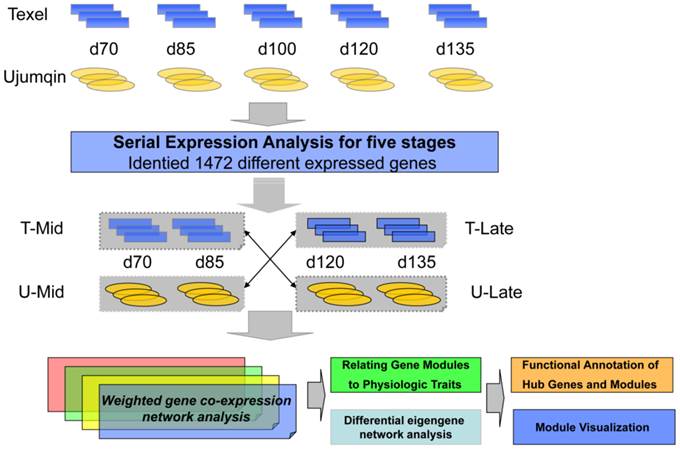
Three fetuses were randomly selected at each of the five different time points (Days 70, 85, 100, 120, and 135) from two breeds (for experimental design, see Figure 1). To investigate the diverse expression pattern during five fetal stages in two breeds, we applied maSigPro analysis in SEA (http://sea.bioinfo.cipf.es/) to our data. We set age as a quantitative factor in the SEA analysis, and set Ujumqin as the control group. We finally identified 1472 significant genes which representing six expression patterns (Significance with FDR = 0.01 and R-squared threshold = 0.7 for multiple test). The average expression values were plotted according to five fetal stages between the two breeds, as shown in Additional File 1: Figure S1. Six clusters corresponding to differential expression patterns were identified by the hierarchical clustering (hclust) method.
Flow chart displaying the major steps involved in the experimental design. Each box and corresponding arrow denotes a major step in the experimental design and WGCNA using microarrays and gene expression analysis.
Among them, we observed that most of genes were enriched in cell cycle, cytoskeletal protein binding, and ATP binding in cluster 1, which represents group of genes with higher expression in Ujumuqin than in Texel (Additional File 2). In contract, genes in cluster 2 have higher expression in Texel, most of which were involved in metabolic process including generation of precursor metabolites and energy, energy derivation by oxidation of organic compounds, glucose metabolic process, hexose metabolic process, and coenzyme metabolic process. We also found chordate embryonic development and cytoskeletal part in cluster 3 and cytoskeleton organization in cluster 4.
In cluster 5, we observed several GO terms were enriched in muscle contraction, muscle system process and structural constituent of muscle. These include genes like EDNRB, MYH1, MYL6B, MYH2, MYL1, DAG1, PGAM2, TMOD4, TPM1, TNNI2, MYL6B, MYH2, MYL1, ACTN3, and TPM1. Additionally, we observed some GO terms involved myofibril and muscle myosin complex, including genes such as MYH1, MYH2, ATP2A1, MYL1, PPP3CA, TPM1, TNNI2, and MYL6B. Moreover, we found several immune related GO terms in cluster 5, for instance, MHC class I protein complex (containing HLA-J, HLA-A, HLA-C, HLA-B, HLA-G, and B2M genes), immune response (containing PSMB10, IFIH1, HLA-J, IFITM3, MAP4K2, HLA-A, TLR3, CALCOCO2, HLA-C, HLA-B, IL15, HLA-G, SIGIRR, B2M, PSMB9, FCGR2B, VEGFA, CFI, and GBP2 genes). However, no significant GO term was found in cluster 6.
Construction of weighted co-expression networks
Based on 1472 differentially expressed genes identified in our time-series expression analysis, we constructed weighted co-expression networks. (Figure 1). In total, we obtained 4 gene networks representing 4 data groups (two breeds × two development stages): network A, Texel mid fetal stage; network B, Ujumqin at the mid fetal stage; network C, Texel late fetal stage; and network D, Ujumqin late fetal stage (Figure 2). Within these 4 networks, we found 5, 11, 7, and 6 gene modules in networks A, B, C, and D, respectively, with each module containing at least 20 genes.
Visual representations of the four gene co-expression networks and corresponding gene significant. The Network A was served as reference Network, module colors of other networks were redefined using matchLabels function in WGCNA R package to match the corresponding module in network A. (A) Hierarchical clustering of 1472 genes in network A constructed from mid-stage fetal skeletal muscles of Texel sheep. The colored bars (below) directly correspond to the module (color) designation for the gene clusters. Five distinct gene modules or groups of genes with high topological overlap were identified in network A. To distinguish between modules, we designated each module with an arbitrary color; grey modules represented poorly connected genes. (B) Hierarchical clustering of 1472 genes in network B constructed from mid-stage fetal skeletal muscles of Ujumqin sheep. (C) Hierarchical clustering of 1472 genes in network C constructed from late-stage fetal skeletal muscles of Texel sheep. (D) Hierarchical clustering of 1472 genes in network D constructed from late-stage fetal skeletal muscles of Ujumqin sheep.
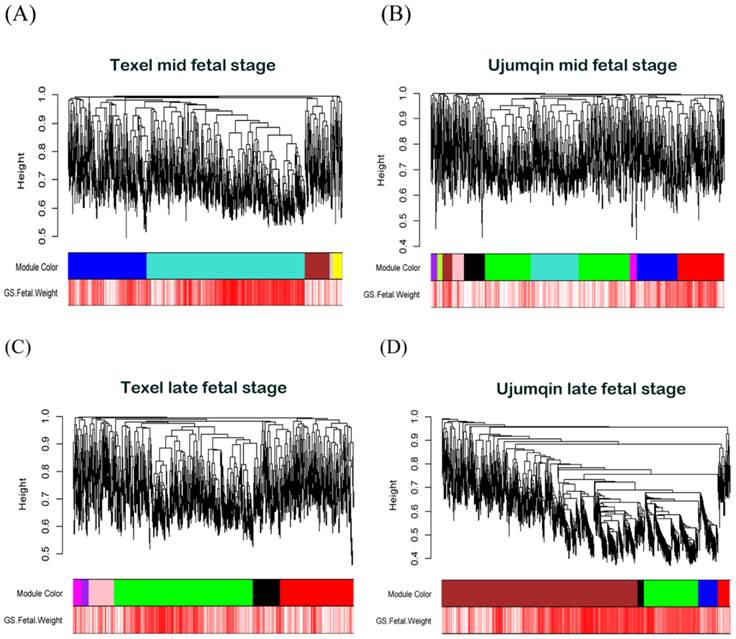
As shown in Figure 2, five distinct gene modules were identified with high topological overlap in network A. To distinguish between modules, we labeled each module with distinct colors with gray color represented poorly connected genes. The number of genes in the modules varied from 48 (yellow) to 849 (turquoise), with their mean overall connectivity ranging from 6.363 to 46.427. In network B, we detected 11 distinct gene modules with module sizes ranging from 26 (pink) to 487 (green), and their mean overall connectivity varying from 2.552 to 16.752. Network C contains 7 distinct gene modules, with their module sizes ranged from 37 (purple) to 729 (green) and their mean overall connectivity ranged from 5.428 to 30.913. In Network D, we detected 6 distinct gene modules with module sizes ranged from 33 (black) to 1001 (brown) and their mean overall connectivity varying from 39.249 to 257.695.
We defined the connectivity (k) of the ith gene as the sum of the connection strengths (weights or adjacencies) between the ith gene and all other genes in the network. In network A (Texel mid fetal stage), approximately 50% of all genes had k = 0~30, and 10% of all genes with k > 100. In network B (Ujumqin at the mid fetal stage), approximately 80% of all genes had k = 0~20, and 20% of all genes with k > 20 were identified. In network C (Texel late fetal stage), there was a peak around k from 5 to 15 containing most of genes. However, in network D (Ujumqin late fetal stage), the majority of genes had large k values over 50 (Additional File 1: Figure S2). We estimated pairwise correlation using k values between the four data sets. However, no significant correlation was found. (Additional File 1: Figure S3).
To compare global differences in gene expression levels among the four groups, the gene expression values were visualized by heatmap plots using R package “gplots.” We found the expression of differentially expressed genes was slightly higher during the mid fetal stage in Texel as compared to the mid fetal stage in Ujumqin. In contrast, the opposite pattern was found in late fetal stage (Additional File 1: Figure S4).
Identifying muscle development trait-related modules
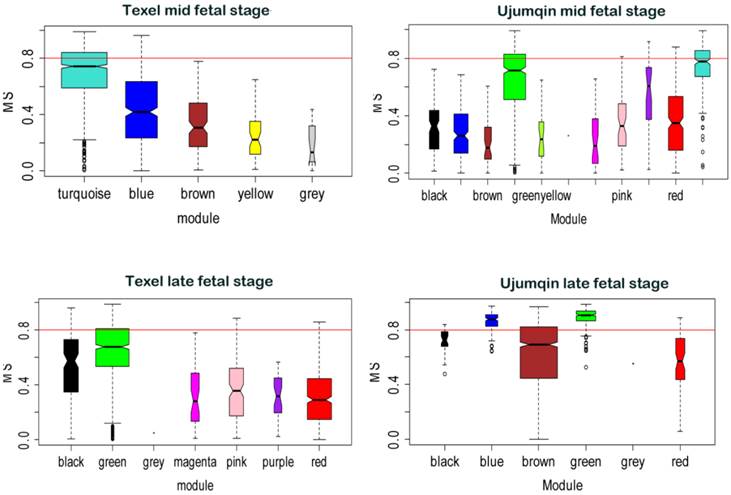
Besides network construction, we also evaluated correlation between gene modules and fetal weight using WGCNA. We compared the MS values of various modules across breed and stage (Figure 3). Modules significantly related to fetal weight were labeled in different colors. At the mid fetal stage, turquoise modules (849 genes) had the highest MS values for fetal weight in Texel, whereas green and turquoise modules (487 and 238 genes) had the top 2 MS values for Ujumqin fetal weight. At the late stage, we found green (729 genes) module had the highest MS values for fetal weight in Texel, while the green and blue modules (275 and 101 genes) had top 2 MS values for late stage fetal weight in Ujumqin.
Modules significance in relation to fetal weight. Modules significance is the average gene significance measure for all genes in a given modules across modules. The higher the mean significance in a module, the more significantly related the module is to fetal weight.
Comparison of gene expression level and connection between Texel and Ujumqin sheep at mid and late fetal stages
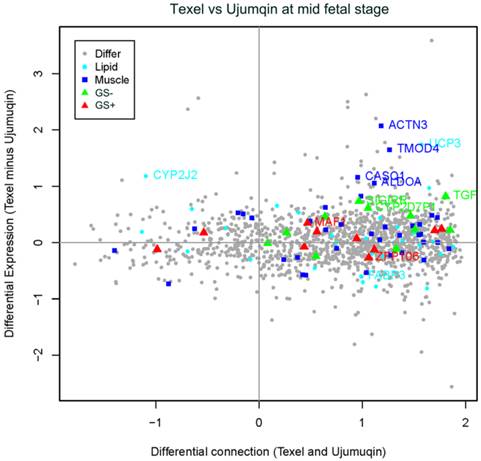
To compare the gene expression level and connection differences between Texel and Ujumqin sheep at two fetal stages, we plotted expression differences against connection differences. As shown in Figure 4, at the mid fetal stage, the majority of genes related to muscle development and lipid metabolism expressed at a higher level in Texel than in Ujumqin. For instance, we detected 4 upregulated genes in Texel related to muscle development (ACTN3, fold changes=2.07; TMOD4, fold changes=1.64; CASQ1; and ALDOA). We also identified two upregulated genes (UCP3, fold changes=1.74 and CYP2J2) and one slightly downregulated gene FABP3 related to lipid metabolism. In addition, we identified 3 genes (CYP2D7P1, TGF-β3, and SIGIRR) with highly significant negative GS values when correlated with fetal weight, as well as 2 genes (MAF1 and ZFP106) with highly significant positive GS values. Detailed expression fold changes and connection changes (Texel vs. Ujumqin) of these genes can be found in Additional File 3.
Plot for the differentially expressed and differentially connected genes in the mid fetal stage. Highly expressed genes in Texel sheep are distributed at the top, and highly expressed genes in Ujumqin sheep are distributed at the bottom. Highly connected genes in Texel sheep are on the right, and highly connected genes in Ujumqin sheep are on the left. Genes with GS values >0.8 were labeled as red triangles (GS+), whereas those with GS values <-0.8 were labeled as green triangles (GS-). Blue rectangles indicate genes related to muscle development while cyan dots indicate genes related to lipid metabolism. Gray dots represent all other genes. The vertical coordinate is denoted by e1-e2, where e1 was average expression value in Texel sheep, e2 was average expression value in Ujumqin sheep and expression value was estimated by Log2 Norm Signals of each probe. On the other hand, the horizontal coordinate is denoted by (t1-u1)/ (t1+u1), where t1 and u1 are gene connection values in Texel and Ujumqin sheep, respectively.
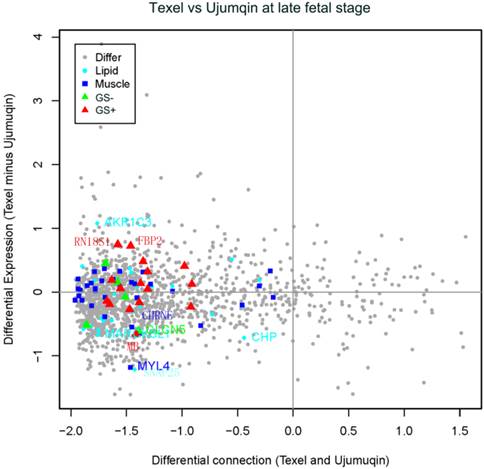
In late fetal stage, we detected a slight decrease in 2 genes (MYL4 and CHRNE) related to muscle development (Figure 5). We also observed one upregulated gene (AKR1C3) and 3 downregulated genes (MARCKSL1, SNAP25 and CHP) related to lipid metabolism. In addition, we identified one downregulated gene (CLCN5), which was negatively correlated with fetal weight. Moreover, we found two slightly upregulated genes (RN18S1 and FBP2) and one slightly downregulated gene (MB), all of which were positively correlated with fetal weight.
Plot for differentially expressed and differentially connected genes in the late fetal stage. Highly expressed genes in Texel sheep are distributed on the top, and highly expressed genes in Ujumqin sheep are distributed on the bottom. Highly connected genes in Texel are on the right, and highly connected genes in Ujumqin are on the left. See Supplemental File 3 for the plot data. Symbols are similarly defined in Figure 4.
GS gene networks
Gene significance (GS) values were used to determine how gene expression correlated with fetal weight. The key genes with extreme GS values were used to identify special “hub” genes (genes with central positions and the strong connections with others within a key gene set) with the web tool VisANT v3.5. We constructed four gene networks from genes positively correlated and negatively correlated with fetal weight (GS> 0.8 and GS< -0.8) in the mid and late fetal stage respectively.
In the mid fetal stage, many genes were identified as hub genes sharing a positive correlation with fetal weight (Additional File 1: Figure S5). These include TADA3 (31 links), EIF4A3 (20 links), CITED2 (13 links), MTHFD1L (12 links), ZFP106 (8 links), and TRPS1 (7 links). We also obtained 6 hub genes, including B2M (25 links), LMNB1 (30 links), SSR4 (28 links), SIGIRR (12 links), VRK1 (12 links) and TGF-β3 (10 links), which were negatively correlated with fetal weight (Additional File 1: Figure S6).
In the late fetal stage, we detected positively correlated genes that possessed a greater number of connections, including EEF1A2 (37 links), HPRT1 (20 links), MYOZ1 (12 links), SDHB (10 links), and SLC25A11 (10 links) (Additional File 1: Figure S7). We also found negatively correlated genes with a greater number of connections, such as FGFR1 (57 links), CBX1 (36 linked), CDC6 (33 links), TIAM1 (32 links), SNRPD1 (31 links), and LMNB1 (30 links) (Additional File 1: Figure S8).
Discussion
In this study, we identified 1472 differentially expressed genes using time-series expression analysis tool SEA, which was developed specially for studying multiple time point data sets. Next, based on these differentially expressed genes, we employed WGCNA analysis to construct co-expression network. This combined two-step method is so-called supervised WGCNA as described previously [49]. SEA results revealed thousands of differentially expressed genes between two breeds along 5 time points. In order to avoid the computation bottleneck for WGCNA analysis, we only fed WGCNA with differentially expressed genes instead of all genes as this study mainly focused on differential expression through a time course [50]. Therefore, our integrated approach, combining complementary tools like SEA and WGCNA (Figure 1), can efficiently group differential expressed genes into modules.
Differential gene expression during fetal stages
Previous studies have shown at least three waves of myogenesis occurred before day 76 of gestation in sheep [51, 52] and myofiber numbers increase sharply in a pulsed-wave mode at the second half of gestation [17]. However, their mechanisms remain unclear. In current study, significant differentially expressed genes were identified and clustered into six groups using hierarchical clustering during 5 fetal stages (Texel versus Ujumqin). These different expression patterns shed insights into biological mechanisms underlying five fetal stages between two breeds. The diverse gene expression pattern could indicate the potential complex network connection among the genes controlling the muscle devolvement and lipid metabolism. We speculate some hub genes would play a significant role during the fetal development. Most interestingly, we observed several GO terms involved in muscle and myofibril development in cluster 5. For example, we observed higher expressions of myosin gene family in Texel than Ujumqin, which is in agreement with the increasing myofiber diameter in Texel [17]. Thus, these genes are likely to explain the muscle differences between two sheep breeds (Additional File 1: Figure S1). For instance, we observed several GO terms were enriched in GO:0006936~muscle contraction, GO:0003012~muscle system process and GO:0008307~structural constituent of muscle, these containing genes EDNRB, MYH1, MYL6B, MYH2, MYL1, DAG1, PGAM2, TMOD4, TPM1, TNNI2, MYL6B, MYH2, MYL1, ACTN3, TPM1. Also, we observed some GO terms involved in GO:0030016~myofibril and GO:0005859~muscle myosin complex, including gene MYH1, MYH2, ATP2A1, MYL1, PPP3CA, TPM1, TNNI2, MYL6B. Moreover, we found several immune related GO terms, for instance, GO:0042612~MHC class I protein complex(contain genes HLA-J, HLA-A, HLA-C, HLA-B, HLA-G, B2M), GO:0006955~immune response (contain genes PSMB10, IFIH1, HLA-J, IFITM3, MAP4K2, HLA-A, TLR3, CALCOCO2, HLA-C, HLA-B, IL15, HLA-G, SIGIRR, B2M, PSMB9, FCGR2B, VEGFA, CFI, GBP2). Detailed functional classification was contained in Additional File 2.
Construction of weighted co-expression networks
Analyses of large data sets generated from expression profiles may facilitate the development of predictive models for systems underlying complex genetic traits [41, 53, 54]. In the current study, we employed a systems biology approach (WGCNA) and focused on modules rather than on individual genes. We constructed four single weighted gene co-expression networks in the mid and late fetal stages in Texel and Ujumqin.
Our analysis revealed diverse patterns of the network connection among sheep breeds and fetal stages. High connections were found in Texel mid stage and Ujumqin late stage. Connections are especially high for the Ujumqin late stage, where most of connection estimates were more than 50 (Additional File 1: Figure S2). These results indicated that changes of gene connection could lead to variations in muscle development and lipid metabolism between breeds and stages. Our previous studies have demonstrated the proliferation of muscle fibers was faster before the mid fetal stages in Texel than in Ujumqin [17]. In contrast, they proliferated more slowly at later fetal stages in Texel than Ujumqin. We found higher gene connections in Ujumqin than Texel at the late fetal stage, which is in agreement with the higher proliferation in Ujumqin [17]. One possible explanation is that these genes connection are likely contributing to the control of muscle development in Ujumqin. Our previous studies have demonstrated that genes involved in immune and hematological system development and function, lipid metabolism, and cell communication were the most differentially expressed between Texel and Ujumqin sheep during muscle development [17]. In this study, we further identified patterns of the network connection based on gene coexpression analysis among sheep breeds and fetal stages, and revealed marked variations in gene expression and connection at mid and late fetal developmental stages.
In addition, our results revealed that most of hub genes have complex network connections with other genes, which indicating their central functions in the regulation of muscle development and lipid metabolism during fetal development. We also observed that all labeled genes including muscle-related, lipid-related and GS key genes in Figure 4 were highly connected to during the mid-fetal stage in Texel. In contrast, we found most genes related to lipid metabolism, muscle development and GS genes have more connections in Ujumqin sheep in late fetal stage (Figure 5). One possible explanation could be that groups of genes involved in muscle-related and lipid-related function differently between Texel and Ujumqin during fetal developmental stages. Muscle development could mainly occur before the mid stage in Texel, while more genes involved in muscle and lipid system function mainly in the late fetal stage in Ujumqin.
Fetal weight-related modules and hub genes
WGCNA approach greatly alleviates the multiple-testing problem inherent in microarray data analysis [50]. Instead of relating thousands of genes to a trait, WGCNA focuses on the relationship between modules and traits. Our study demonstrated that WGCNA is useful for exploring transcriptional changes and identifying fetal weight-related genes. We revealed that several co-expression modules with different genes, which were significantly correlated with fetal weight. These results may help to explain the molecular mechanisms underlying fetal muscle development between Texel and Ujumqin with diverse muscle phenotypes. By identifying the differentially expressed and differentially connected genes, our results showed a good agreement with the study of weighted gene co-expression analysis of mouse body weight [32], which also indicated that genes which are differentially connected may be differentially expressed. In addition, Kogelman et al. have employed both EBV weighted gene co-expression network analysis and differential gene co-expression network analysis to identify highly connected genes associated with the trait and differentially connected genes in the high and low EBV sire groups [34]. Their study was designed to reveal the genetic structure in the gene expression program within ovine longissimus lumborum muscle for adult sheep, using a total of 40 half sib progeny derived from the six sires. In contrast, our study investigated the characteristics of gene expression during 5 fetal developmental stages. Probably because the different fetal developmental stages were investigated, no consistent gene sets were found in these two studies. There could be potentially some complex influences from sex, maternal nutrition level and other factors. However, they are normally not considered as major effects. In this study, we investigated two pure breeds with extreme phenotypes. We used six fetuses for each breed in the late stage, among them five Texel fetuses were males, while all Ujumqin fetuses were all females. It is possible that sex contributes to the fetal weight differences. However, with our sample sizes, we could not find any significant differences between male and female samples for fetal weight. More importantly, we focused on breed genetic effects as the major factors in determining the fetal weight. So, we believed the sex could have little effect comparing with breed effect in current study. Further investigation of sex and other factors will be worthwhile with larger sample sizes. Moreover, we did our best to control the genetic background of each of these two pure sheep breeds by using a single sire. They were fed in the same environment and supplied with the same nutrition. They were fattened using the same diet. Estrus synchronization and artificial insemination (AI) were used to synchronize pregnancies, which facilitated sample collection.
In this study, we found a serial of hub genes related to fetal weight based on WGCNA method at the mid fetal stage. For instance, transcriptional adaptor 3 (TADA3; 31 links) was positively related to fetal weight. The gene also encodes ADA3-like protein, which is essential for transcriptional activity and p53 acetylation in humans [55-57]. Many studies have indicated Ada3 in mammalian genome is essential for embryonic development, cell cycle progression [58] and genomic stability in mouse embryonic stage [59]. Our study indicated TADA3 is likely to play central role in the muscle development and differentiation. We also identified gene Lamin B1 (LMNB1, with 30 links) showed a significant negative correlation with fetal weight. LMNB1 belongs to the lamin family of proteins, which are highly conserved and comprise the Lamin matrix. Lamin proteins are thought to be involved in nuclear stability, chromatin structure, and gene expression [60-63]. However, their exact functions in muscle development remain unclear.
TGF-β3 gene, as one member of transforming growth factor-β (TGF-β) gene family [64], which is related to embryogenesis, cell differentiation and development. Campbell et al demonstrated that expression of TGF-β3 is initiated during early stages of mouse embryos development [65]. Additionally, TGF-β3 has been reported play an essential role in the normal morphogenesis of palate and lung using mice model [66]. Our study revealed TGF-β3 was negatively correlated with fetal weight in sheep, and it could work as one of important hub gene with multiple connections. Therefore, regulation of TGF-β3 and its connected genes could play critical roles in the muscle development during the fetal stages.
At late fetal stage, we found gene EEF1A2 (eukaryotic translation elongation factor 1 alpha, with 37 links) was positively correlated with fetal weight. This gene encodes an isoform of the elongation factor-1 complex alpha subunit, which is responsible for delivery of aminoacyl tRNAs to the ribosome. Deletion of EEF1A2 in mice would lead to the neurodegenerative phenotype “wasted” (wst), and mice homozygous for the wasted mutation may die of muscle wasting and neurodegeneration at four weeks post-natal [67, 68]. Our WGCNA analysis revealed that the hub gene EEF1A2 positively correlated with fetal weight, indicating this gene could play significant role for muscle development during fetal stages.
FGFR1 (Fibroblast growth factor receptor 1, with 57 links) was identified negatively correlated with fetal weight. FGFR1 inhibits skeletal muscle atrophy associated with hindlimb suspension mouse experiment [69]. FGFR1 mutations in humans may also lead to developmental defects and pathological conditions, such as Alzheimer's disease and cancer [70]. The protein encoded by this gene is a member of the FGFR family [71] and the amino acid sequence is highly conserved, so we speculate that FGFR1 could probably involve in the negative regulation of muscle development in many species including sheep.
MYOZ1, belong to a family of muscle proteins that bind to calcineurinare, which have been reported involved in fast-twitch skeletal muscle in many adult animals [72-74]. This gene has been detected was significantly correlated with TCAP and PDLIM3 in the coexpression network for bovine skeletal muscle [75]. In this study, we also observed gene MYOZ1 (with 12 links) was positively correlated with fetal weight in late stages. The detailed investigation is warranted to explore the function of these genes in sheep muscle development during fetal stages.
In conclusion, our study revealed the complex network characteristics involved in muscle development and lipid metabolism during fetal development stages. We found out that diverse patterns of gene expressions and network connections observed between breeds play central roles in fetal development, correlating with the adult muscle phenotypes. Our findings could provide potential valuable biomarkers for selection of body weight-related traits in sheep and other livestock.
Supplementary Material
Additional File 1Figures S1-S8.
Cluster_chart_1_5.
U-T-70-85.
Acknowledgements
We are grateful to Youying Zhao (Youyu County, Shanxi Province) for providing the experimental animals and settings for sampling, and Wenbin Yue and his colleagues (Shanxi Agricultural University) for their support organizing the sampling. Our studies were supported by the National Natural Science Foundation of China (No.30972094), the National Nonprofit Institute Research Grant (Grand No. 2012cj-2) and the National Modern Agricultural Industry Technology Fund for Scientists in the Sheep Industry System (CARS-39-04B).
Authors' contributions
LYX and LXD participated in the experimental design, data analysis and drafted the manuscript. HXR participated in the experimental design, sample collection, and the microarray experiment. LL and FPZ participated in the microarray data analysis and sample collection. JL and JSL and participated in sample collection and SFZ extracted the total RNA. LZ was actively involved in sampling and coordination. JZS and GL helped draft the manuscript. LXD and CHW organized the entire experiment and helped draft the manuscript. All authors have read and approved the final manuscript.
Competing interests
There were no competing financial interests (political, personal, religious, ideological, academic, intellectual, commercial, or any other) in relation to this manuscript. All authors agreed to publish the manuscript in this journal.
References
1. Hocquette JF. Endocrine and metabolic regulation of muscle growth and body composition in cattle. Animal: an international journal of animal bioscience. 2010;4:1797-809 doi:10.1017/S1751731110001448
2. Hickford JG, Forrest RH, Zhou H. Association between a g.+6723G-A SNP in the myostatin gene (MSTN) and carcass traits in New Zealand Texel sheep. J Anim Sci. 2009;87:1853. doi:10.2527/jas.2009-1960
3. Clop A, Marcq F, Takeda H, Pirottin D, Tordoir X, Bibe B. et al. A mutation creating a potential illegitimate microRNA target site in the myostatin gene affects muscularity in sheep. Nat Genet. 2006;38:813-8 doi:10.1038/ng1810
4. Kambadur R, Sharma M, Smith TP, Bass JJ. Mutations in myostatin (GDF8) in double-muscled Belgian Blue and Piedmontese cattle. Genome Res. 1997;7:910-6
5. Grobet L, Martin LJ, Poncelet D, Pirottin D, Brouwers B, Riquet J. et al. A deletion in the bovine myostatin gene causes the double-muscled phenotype in cattle. Nat Genet. 1997;17:71-4 doi:10.1038/ng0997-71
6. Mosher DS, Quignon P, Bustamante CD, Sutter NB, Mellersh CS, Parker HG. et al. A mutation in the myostatin gene increases muscle mass and enhances racing performance in heterozygote dogs. PLoS Genet. 2007;3:e79. doi:10.1371/journal.pgen.0030079
7. Lee SJ, McPherron AC. Regulation of myostatin activity and muscle growth. Proc Natl Acad Sci U S A. 2001;98:9306-11 doi:10.1073/pnas.151270098
8. Schuelke M, Wagner KR, Stolz LE, Hubner C, Riebel T, Komen W. et al. Myostatin mutation associated with gross muscle hypertrophy in a child. The New England journal of medicine. 2004;350:2682-8 doi:10.1056/NEJMoa040933
9. Johnson PL, McEwan JC, Dodds KG, Purchas RW, Blair HT. Meat quality traits were unaffected by a quantitative trait locus affecting leg composition traits in Texel sheep. Journal of Animal Science. 2005;83:2729-35
10. Meng XR, Guo J, Zhao Q, Ma YH, Guan WJ, Liu D. et al. Variation of MSTN gene UTR in eleven sheep breeds. Yi Chuan. 2008;30:1585-90
11. Picard B, Lefaucheur L, Berri C, Duclos MJ. Muscle fibre ontogenesis in farm animal species. Reproduction, nutrition, development. 2002;42:415-31
12. Byrne K, Vuocolo T, Gondro C, White J, Cockett N, Hadfield T. et al. A gene network switch enhances the oxidative capacity of ovine skeletal muscle during late fetal development. BMC Genomics. 2010;11:378
13. Cassar-Malek I, Passelaigue F, Bernard C, Leger J, Hocquette JF. Target genes of myostatin loss-of-function in muscles of late bovine fetuses. BMC Genomics. 2007;8:63. doi:10.1186/1471-2164-8-63
14. Lehnert SA, Reverter A, Byrne KA, Wang Y, Nattrass GS, Hudson NJ. et al. Gene expression studies of developing bovine longissimus muscle from two different beef cattle breeds. BMC developmental biology. 2007;7:95. doi:10.1186/1471-213X-7-95
15. Hudson NJ, Reverter A, Dalrymple BP. A differential wiring analysis of expression data correctly identifies the gene containing the causal mutation. PLoS Comput Biol. 2009;5:e1000382. doi:10.1371/journal.pcbi.1000382
16. Hudson NJ, Reverter A, Wang Y, Greenwood PL, Dalrymple BP. Inferring the transcriptional landscape of bovine skeletal muscle by integrating co-expression networks. PloS one. 2009;4:e7249. doi:10.1371/journal.pone.0007249
17. Ren H, Li L, Su H, Xu L, Wei C, Zhang L. et al. Histological and transcriptome-wide level characteristics of fetal myofiber hyperplasia during the second half of gestation in Texel and Ujumqin sheep. BMC Genomics. 2011;12:411
18. Bai Q, McGillivray C, da Costa N, Dornan S, Evans G, Stear MJ. et al. Development of a porcine skeletal muscle cDNA microarray: analysis of differential transcript expression in phenotypically distinct muscles. BMC Genomics. 2003;4:8
19. Li Y, Xu Z, Li H, Xiong Y, Zuo B. Differential transcriptional analysis between red and white skeletal muscle of Chinese Meishan pigs. International journal of biological sciences. 2010;6:350
20. Campbell WG, Gordon SE, Carlson CJ, Pattison JS, Hamilton MT, Booth FW. Differential global gene expression in red and white skeletal muscle. American journal of physiology Cell physiology. 2001;280:C763-8
21. Cui HX, Liu RR, Zhao GP, Zheng MQ, Chen JL, Wen J. Identification of differentially expressed genes and pathways for intramuscular fat deposition in pectoralis major tissues of fast-and slow-growing chickens. BMC Genomics. 2012;13:213. doi:10.1186/1471-2164-13-213
22. Moreno-Sanchez N, Rueda J, Carabano MJ, Reverter A, McWilliam S, Gonzalez C. et al. Skeletal muscle specific genes networks in cattle. Functional & integrative genomics. 2010;10:609-18 doi:10.1007/s10142-010-0175-2
23. Sudre K, Cassar-Malek I, Listrat A, Ueda Y, Leroux C, Jurie C. et al. Biochemical and transcriptomic analyses of two bovine skeletal muscles in Charolais bulls divergently selected for muscle growth. Meat science. 2005;70:267-77 doi:10.1016/j.meatsci.2005.01.012
24. Nueda MJ, Carbonell J, Medina I, Dopazo J, Conesa A. Serial Expression Analysis: a web tool for the analysis of serial gene expression data. Nucleic Acids Res. 2010;38:W239-45
25. Conesa A, Nueda MJ, Ferrer A, Talon M. maSigPro: a method to identify significantly differential expression profiles in time-course microarray experiments. Bioinformatics. 2006;22:1096-102
26. Barabasi AL, Oltvai ZN. Network biology: understanding the cell's functional organization. Nature reviews Genetics. 2004;5:101-13 doi:10.1038/nrg1272
27. Mitra K, Carvunis AR, Ramesh SK, Ideker T. Integrative approaches for finding modular structure in biological networks. Nature reviews Genetics. 2013;14:719-32 doi:10.1038/nrg3552
28. Luscombe NM, Babu MM, Yu H, Snyder M, Teichmann SA, Gerstein M. Genomic analysis of regulatory network dynamics reveals large topological changes. Nature. 2004;431:308-12 doi:10.1038/nature02782
29. Schadt EE, Friend SH, Shaywitz DA. A network view of disease and compound screening. Nature reviews Drug discovery. 2009;8:286-95 doi:10.1038/nrd2826
30. Stuart JM, Segal E, Koller D, Kim SK. A gene-coexpression network for global discovery of conserved genetic modules. Science. 2003;302:249-55 doi:10.1126/science.1087447
31. Jordan IK, Marino-Ramirez L, Wolf YI, Koonin EV. Conservation and coevolution in the scale-free human gene coexpression network. Molecular biology and evolution. 2004;21:2058-70 doi:10.1093/molbev/msh222
32. Fuller TF, Ghazalpour A, Aten JE, Drake TA, Lusis AJ, Horvath S. Weighted gene coexpression network analysis strategies applied to mouse weight. Mamm Genome. 2007;18:463-72
33. Stanley D, Watson-Haigh NS, Cowled CJ, Moore RJ. Genetic architecture of gene expression in the chicken. BMC Genomics. 2013;14:13. doi:10.1186/1471-2164-14-13
34. Kogelman L, Byrne K, Vuocolo T, Watson-Haigh N, Kadarmideen H, Kijas J. et al. Genetic architecture of gene expression in ovine skeletal muscle. BMC Genomics. 2011;12:607
35. Zhang B, Horvath S. A general framework for weighted gene co-expression network analysis. Statistical applications in genetics and molecular biology. 2005 4
36. Langfelder P, Horvath S. WGCNA: an R package for weighted correlation network analysis. BMC Bioinformatics. 2008;9:559
37. Mason M, Fan G, Plath K, Zhou Q, Horvath S. Signed weighted gene co-expression network analysis of transcriptional regulation in murine embryonic stem cells. BMC Genomics. 2009 10
38. Gustin MP, Paultre CZ, Randon J, Bricca G, Cerutti C. Functional meta-analysis of double connectivity in gene coexpression networks in mammals. Physiol Genomics. 2008;34:34-41
39. Saris CG, Horvath S, van Vught PW, van Es MA, Blauw HM, Fuller TF. et al. Weighted gene co-expression network analysis of the peripheral blood from Amyotrophic Lateral Sclerosis patients. BMC Genomics. 2009;10:405
40. Kadarmideen H, Watson-Haigh N, Andronicos N. Systems biology of ovine intestinal parasite resistance: disease gene modules and biomarkers. Molecular Biosystems. 2011;7:235-46
41. Kadarmideen HN, von Rohr P, Janss LL. From genetical genomics to systems genetics: potential applications in quantitative genomics and animal breeding. Mamm Genome. 2006;17:548-64
42. Zhang B, Horvath S. A general framework for weighted gene co-expression network analysis. Stat Appl Genet Mol Biol. 2005;4:Article17
43. Langfelder P, Zhang B, Horvath S. Defining clusters from a hierarchical cluster tree: the Dynamic Tree Cut package for R. Bioinformatics. 2008;24:719-20
44. Langfelder P, Horvath S. Eigengene networks for studying the relationships between co-expression modules. BMC Syst Biol. 2007;1:54
45. Ghazalpour A, Doss S, Zhang B, Wang S, Plaisier C, Castellanos R. et al. Integrating genetic and network analysis to characterize genes related to mouse weight. PLoS Genet. 2006;2:e130
46. Kadarmideen HN, Watson-Haigh NS, Andronicos NM. Systems biology of ovine intestinal parasite resistance: disease gene modules and biomarkers. Mol Biosyst. 2011;7:235-46
47. Huang da W, Sherman BT, Tan Q, Kir J, Liu D, Bryant D. et al. DAVID Bioinformatics Resources: expanded annotation database and novel algorithms to better extract biology from large gene lists. Nucleic Acids Res. 2007;35:W169-75
48. Hu Z, Hung JH, Wang Y, Chang YC, Huang CL, Huyck M. et al. VisANT 3.5: multi-scale network visualization, analysis and inference based on the gene ontology. Nucleic Acids Res. 2009;37:W115-21
49. Gargalovic PS, Imura M, Zhang B, Gharavi NM, Clark MJ, Pagnon J. et al. Identification of inflammatory gene modules based on variations of human endothelial cell responses to oxidized lipids. Proc Natl Acad Sci U S A. 2006;103:12741-6
50. Kadarmideen H, Watson-Haigh N. Building gene co-expression networks using transcriptomics data for systems biology investigations: Comparison of methods using microarray data. Bioinformation. 2012;8:855-61
51. Maier A, McEwan JC, Dodds KG, Fischman DA, Fitzsimons RB, Harris AJ. Myosin heavy chain composition of single fibres and their origins and distribution in developing fascicles of sheep tibialis cranialis muscles. Journal of Muscle Research & Cell Motility. 1992;13:551-72
52. Wilson S, McEwan J, Sheard P, Harris A. Early stages of myogenesis in a large mammal: formation of successive generations of myotubes in sheep tibialis cranialis muscle. Journal of Muscle Research & Cell Motility. 1992;13:534-50
53. Andersson L, Georges M. Domestic-animal genomics: deciphering the genetics of complex traits. Nat Rev Genet. 2004;5:202-12
54. Womack JE. Advances in livestock genomics: opening the barn door. Genome Res. 2005;15:1699-705
55. Wang T, Kobayashi T, Takimoto R, Denes AE, Snyder EL, el-Deiry WS. et al. hADA3 is required for p53 activity. Embo J. 2001;20:6404-13
56. Sekaric P, Shamanin VA, Luo J, Androphy EJ. hAda3 regulates p14ARF-induced p53 acetylation and senescence. Oncogene. 2007;26:6261-8
57. Nag A, Germaniuk-Kurowska A, Dimri M, Sassack MA, Gurumurthy CB, Gao Q. et al. An essential role of human Ada3 in p53 acetylation. J Biol Chem. 2007;282:8812-20
58. Mohibi S, Gurumurthy CB, Nag A, Wang J, Mirza S, Mian Y. et al. Mammalian alteration/deficiency in activation 3 (Ada3) is essential for embryonic development and cell cycle progression. J Biol Chem. 2012;287:29442-56 doi:10.1074/jbc.M112.378901
59. Mirza S, Katafiasz BJ, Kumar R, Wang J, Mohibi S, Jain S. et al. Alteration/deficiency in activation-3 (Ada3) plays a critical role in maintaining genomic stability. Cell Cycle. 2012;11:4266-74 doi:10.4161/cc.22613
60. Buendia B, Santa-Maria A, Courvalin JC. Caspase-dependent proteolysis of integral and peripheral proteins of nuclear membranes and nuclear pore complex proteins during apoptosis. J Cell Sci. 1999;112( Pt 11):1743-53
61. Maske CP, Hollinshead MS, Higbee NC, Bergo MO, Young SG, Vaux DJ. A carboxyl-terminal interaction of lamin B1 is dependent on the CAAX endoprotease Rce1 and carboxymethylation. J Cell Biol. 2003;162:1223-32
62. Kaufmann SH, Mabry M, Jasti R, Shaper JH. Differential expression of nuclear envelope lamins A and C in human lung cancer cell lines. Cancer Res. 1991;51:581-6
63. Takamori Y, Tamura Y, Kataoka Y, Cui Y, Seo S, Kanazawa T. et al. Differential expression of nuclear lamin, the major component of nuclear lamina, during neurogenesis in two germinal regions of adult rat brain. Eur J Neurosci. 2007;25:1653-62
64. Derynck R, Akhurst RJ. Differentiation plasticity regulated by TGF-beta family proteins in development and disease. Nature cell biology. 2007;9:1000-4 doi:10.1038/ncb434
65. Campbell W, Kelly D, Rizzino A. Expression of transforming growth factor-β3 by embryonal carcinoma cells, parietal endoderm-like cells and early mouse embryos. In Vitro Cell Dev Biol. 1990;26:1181-5 doi:10.1007/bf02623696
66. Kaartinen V, Voncken JW, Shuler C, Warburton D, Bu D, Heisterkamp N. et al. Abnormal lung development and cleft palate in mice lacking TGF-beta 3 indicates defects of epithelial-mesenchymal interaction. Nat Genet. 1995;11:415-21 doi:10.1038/ng1295-415
67. Newbery HJ, Loh DH, O'Donoghue JE, Tomlinson VA, Chau YY, Boyd JA. et al. Translation elongation factor eEF1A2 is essential for post-weaning survival in mice. J Biol Chem. 2007;282:28951-9 doi:10.1074/jbc.M703962200
68. Griffiths LA, Doig J, Churchhouse AM, Davies FC, Squires CE, Newbery HJ. et al. Haploinsufficiency for translation elongation factor eEF1A2 in aged mouse muscle and neurons is compatible with normal function. PloS one. 2012;7:e41917. doi:10.1371/journal.pone.0041917
69. Eash J, Olsen A, Breur G, Gerrard D, Hannon K. FGFR1 inhibits skeletal muscle atrophy associated with hindlimb suspension. BMC musculoskeletal disorders. 2007;8:32. doi:10.1186/1471-2474-8-32
70. Scholpp S, Groth C, Lohs C, Lardelli M, Brand M. Zebrafish fgfr1 is a member of the fgf8 synexpression group and is required for fgf8 signalling at the midbrain-hindbrain boundary. Dev Genes Evol. 2004;214:285-95
71. Guasch G, Popovici C, Mugneret F, Chaffanet M, Pontarotti P, Birnbaum D. et al. Endogenous retroviral sequence is fused to FGFR1 kinase in the 8p12 stem-cell myeloproliferative disorder with t(8;19)(p12;q13.3). Blood. 2003;101:286-8
72. Frey N, Richardson JA, Olson EN. Calsarcins, a novel family of sarcomeric calcineurin-binding proteins. Proc Natl Acad Sci U S A. 2000;97:14632-7 doi:10.1073/pnas.260501097
73. Wang H, Zhu Z, Yang S, Mo D, Li K. Characterization of different expression patterns of calsarcin-1 and calsarcin-2 in porcine muscle. Gene. 2006;374:104-11 doi:10.1016/j.gene.2006.01.035
74. Frey N, Frank D, Lippl S, Kuhn C, Kögler H, Barrientos T. et al. Calsarcin-2 deficiency increases exercise capacity in mice through calcineurin/NFAT activation. The Journal of clinical investigation. 2008;118:3598
75. Reverter A, Hudson NJ, Wang Y, Tan SH, Barris W, Byrne KA. et al. A gene coexpression network for bovine skeletal muscle inferred from microarray data. Physiol Genomics. 2006;28:76-83 doi:10.1152/physiolgenomics.00105.2006
Author contact
![]() Corresponding author: Dr. Lixin Du, E-mail: lxdunet. Tel: (86)1062819997. Or Dr. Caihong Wei, E-mail: weichxxcom.cn Institute of Animal Sciences, Chinese Academy of Agricultural Sciences, No. 2 Yuanmingyuan West Road, Beijing, 100193.
Corresponding author: Dr. Lixin Du, E-mail: lxdunet. Tel: (86)1062819997. Or Dr. Caihong Wei, E-mail: weichxxcom.cn Institute of Animal Sciences, Chinese Academy of Agricultural Sciences, No. 2 Yuanmingyuan West Road, Beijing, 100193.