Impact Factor ISSN: 1449-2288
- Issue 12; 2026
- Issue 11; 2026
- Issue 10; 2026
- Issue 9; 2026
- Issue 8; 2026
- Volume 22; 2026
- Past Issues
- Advance Articles
- Editorial Board
- Cover Images
- Index & Coverage
- Cover Suggestion
- Special Issues
Introduction
Materials and methods
Results
Discussion
Supplementary Material
Acknowledgements
References

 Global reach, higher impact
Int J Biol Sci 2015; 11(1):22-30. doi:10.7150/ijbs.10217 This issue Cite
Research Paper
Differential Transcriptional Response in Macrophages Infected with Cell Wall Deficient versus Normal Mycobacterium Tuberculosis
Yu-Rong Fu1,2, Kun-Shan Gao1, Rui Ji2, Zheng-Jun Yi1 ![]()
1. Department of Laboratory Medicine of Affiliated Hospital of Weifang Medical University, Key Laboratory of Clinical Laboratory Diagnostics in Universities of Shandong and Medical Priority Speciality of Clinical Laboratory in Shandong Province, Weifang Medical University, Weifang 261031, China;
2. Department of Medical Microbiology, Weifang Medical University, Weifang 261053, China.
Received 2014-7-30; Accepted 2014-10-13; Published 2015-1-1
Abstract
Host-pathogen interactions determine the outcome following infection by mycobacterium tuberculosis (Mtb). Under adverse circumstances, normal Mtb can form cell-wall deficient (CWD) variants within macrophages, which have been considered an adaptive strategy for facilitating bacterial survival inside macrophages. However, the molecular mechanism by which infection of macrophages with different phenotypic Mtb elicits distinct responses of macrophages is not fully understood. To explore the molecular events triggered upon Mtb infection of macrophages, differential transcriptional responses of RAW264.7 cells infected with two forms of Mtb, CWD-Mtb and normal Mtb, were studied by microarray analysis. Some of the differentially regulated genes were confirmed by RT-qPCR in both RAW264.7 cells and primary macrophages. Kyoto Encyclopedia of Genes and Genomes (KEGG) pathway was used to analyze functions of differentially expressed genes. Distinct gene expression patterns were observed between CWD-Mtb and normal Mtb group. Mapt was up-regulated, while NOS2 and IL-11 were down-regulated in CWD-Mtb infected RAW264.7 cells and primary macrophages compared with normal Mtb infected ones. Many deregulated genes were found to be related to macrophages activation, immune response, phagosome maturation, autophagy and lipid metabolism. KEGG analysis showed that the differentially expressed genes were mainly involved in MAPK signaling pathway, nitrogen metabolism, cytokine-cytokine receptor interaction and focal adhesion. Taken together, the present study showed that differential macrophage responses were induced by intracellular CWD-Mtb an normal Mtb infection, which suggested that interactions between macrophages and different phenotypic Mtb are very complex. The results provide evidence for further understanding of pathogenesis of CWD-Mtb and may help in improving strategies to eliminate intracellular CWD-Mtb.
Keywords: Mycobacterium tuberculosis, macrophage, bactericidal response, cytokine signaling, autophagy, lipid metabolism.
Introduction
Tuberculosis (TB) is still the leading cause of death in the world from a bacterial infectious disease. Mycobacterium tuberculosis (Mtb), the causative agent of TB, is one of the world's most devastating intracellular pathogens. The outcome of Mtb infection is determined by a complex interaction between host immune system and properties of pathogen [1, 2]. Mtb strains with distinct properties have been shown to induce macrophages diverse responses in vitro and in vivo [3, 4]. Under adverse circumstances, Mtb can form cell-wall deficient (CWD) variants within macrophages and this variation causes a marked resistance of mycobacteria to immune system of host and antibiotics, which is considered an adaptive strategy for facilitating bacterial survival and replication for a long time in macrophages [5]. Bacterial CWD-form conversion, i.e. existence without cell wall, is a universal phenomenon in nature. CWD-forms of Mtb have been found in pathological specimens from patients with TB, and of all the mycobacteria, CWD-forms of Mtb predominate in vivo [6]. Occurrence of CWD-Mtb is of clinical significance for the cause of latent, chronic and relapsing/recurrent infections which is one of the major hurdle in control of TB disease, especially persistent TB disease [7]. Although CWD-Mtb has been successfully isolated from patients with several chronic diseases, its pathogenesis is still unknown [8]. Macrophage activation plays a critical role in host defence against Mtb infection and the outcome following Mtb infection is determined, at least in part, by intricate host-pathogen interaction in macrophages [9, 10]. Exploring the interplay between Mtb and macrophages is crucial to understanding of the pathogenesis of TB, which may help in improving strategies to eliminate CWD-Mtb.
In the present study, we compared the expression patterns of macrophage-like cell line RAW264.7 cells infected with two forms of Mtb and some of the differentially regulated genes were validated in both RAW264.7 cells and primary macrophages with an emphasis in the analysis of the response elicited by CWD-forms of the bacterium.
Materials and methods
Bacterial culture
Mycobacterium tuberculosis H37Rv (normal Mtb with cell wall) was grown in Middlebrook 7H9 medium supplemented with 10% oleic acid albumin dextrose catalase (OADC) enrichment (Difco BD, Franklin Lakes, NJ), 0.5% glycerol and 0.05% Tween 80. CWD-forms of H37Rv were induced by means of nutrient starvation stress as described by Nadya et al [11]. CWD-Mtb was examined and confirmed by Ziehl-Neelsen staining and electron microscopy. Before every infection experiment, normal Mtb and CWD-Mtb were grown to mid-log phase. Bacteria were harvested at this point and resuspended in Dulbecco's modified eagle medium (DMEM) medium supplemented with 10% fetal bovine serum (complete medium). Following this, bacteria were dispersed to prevent bacillary clumping and single bacterium suspension was used for subsequent infection. The adequacy of dispersion was checked by acid-fast staining.
Infection of cell line and determination of bacterial load
Macrophage-like cell line RAW264.7 cells were maintained in complete DMEM medium at 37℃ with 5% CO2. Cells were infected with either CWD-Mtb or normal Mtb at a multiplicity of infection (MOI) of 10:1 (bacteria: macrophages) for 4 h. Extracellular bacteria were then removed by washing three times with pre-warmed DMEM medium. Mtb-infected cells were then harvested for bacterial load enumeration analysis. Briefly, cells were lysed by sonication and serial 10-fold dilutions of total cell lysates were plated on either Middlebrook 7H9 semisolid medium (Difco BD, Franklin Lakes, NJ) for CWD-Mtb growth or Middlebrook 7H10 solid medium (Difco BD, Franklin Lakes, NJ) for normal Mtb growth at 37℃. Colonies were counted after either 5 days of incubation for CWD-Mtb growth or 30 days for normal-Mtb growth.
RNA isolation and microarray analysis of gene expression
Total RNA was isolated from CWD-Mtb or normal Mtb infected RAW264.7 cells with Trizol reagent. RNA quality and quantity were determined using NanoDrop Specthophotometer (ND-1000, Nanodrop Technologies) and RNA integrity was evaluated by electrophoresis. Only RNA samples with high quality were used for further microarray analysis. mRNA was then purified from total RNA after removal of rRNA (mRNA-ONLY™ Eukaryotic mRNA Isolation Kit, Epicentre). Then, each sample was amplified, transcribed into fluorescent cRNA and hybridized onto a Mouse RNA Array v2.0 (8 x 60K, Arraystar), which contained 25,376 probes targeting protein-coding transcripts. Arrays were scanned by an Agilent Scanner G2505B and acquired array images were analyzed by an Agilent Feature Extraction software (version 10.7.3.1). Quantile normalization and subsequent data processing were performed using a GeneSpring GX v11.5.1 software package (Agilent Technologies). Expression of GAPDH (glyceraldehyde phosphate dehydrogenase) was used as an internal control. Genes with at least two fold changes in the expression level and FDR (false discovery rate)<0.05 were deemed to be differentially expressed. Hierarchical clustering was performed based on Pearson's correlation for differentially expressed mRNAs.
Primary macrophages harvest and infection
Female mice (8-12 weeks) were anesthetized, 6 ml RPMI 1640 was injected into the intraperitoneal space of each mouse, and mice were gently agitated for 5 min. Peritoneal cavity cells were then harvested, placed into a plastic petri dish, and then incubated at 37°C for 4 h. Each plate was washed until all red blood cells, fibroblasts, and other cellular debris were removed. Primary macrophages were collected by scraping the plate into 10 ml PBS, pelleted by centrifugation, and washed for three times. Harvested macrophages were resuspended and incubated in RPMI 1640 medium at 37℃ with 5% CO2. Cells were infected with either CWD-Mtb or normal Mtb as described above. After 24 hrs following infection, cells were collected. All procedures were approved by the Animal Care and Use Committees of Weifang Medical University.
Quantitative real time RT-PCR (qRT-PCR) analysis
We randomly selected four genes to validate the correctness and confidence of microarray data by qRT-PCR. Total RNA was isolated from infected RAW264.7 cells and primary macrophages, respectively. cDNA was amplified with gene specific primers (sequences available on request). The threshold cycle (Ct) is defined as the fractional cycle number at which the fluorescence exceeds the fixed threshold. The relative gene expression was calculated using the 2-ΔΔCt method and presented as fold-change after normalization to endogenous GAPDH control. RT-qPCR reaction for each sample was run in triplicate.
Measurement of nitric oxide (NO)
RAW264.7 cells and primary macrophages were infected with Mtb as described above, respectively. After 24 hrs following infection, dissolved nitrite production in culture supernatants were measured using Griess reagent (Beyotime Biotech, China) according to the manufacturer's instructions. Briefly, 50 μl of each culture supernatants from a 24-well plate was mixed with 50 μl of Griess reagent I and 50 μl of Griess reagent II and incubated for 3 min at room temperature in the dark. Absorbance at 540 nm was measured with a spectrophotometer. Each experiment was repeated in triplicate using samples from three independent experiments.
Gene ontology and Kyoto encyclopedia of genes and genomes functional enrichment analysis for differentially dxpressed genes
Gene ontology (GO) analysis was used to assess functional categories of the differentially expressed mRNAs. Kyoto Encyclopedia of Genes and Genomes (KEGG) pathway analysis was used to determine involved biological pathways of the differentially expressed mRNAs. GO category and signaling pathway were considered statistically significant only if a P-value was less than 0.05.
Statistical analysis
Data were presented as mean ± standard deviation (SD). ANOVA test or student's t test was used for statistical analysis. P < 0.05 was considered statistically significant.
Results
Evaluation of bacillary load in infected macrophages
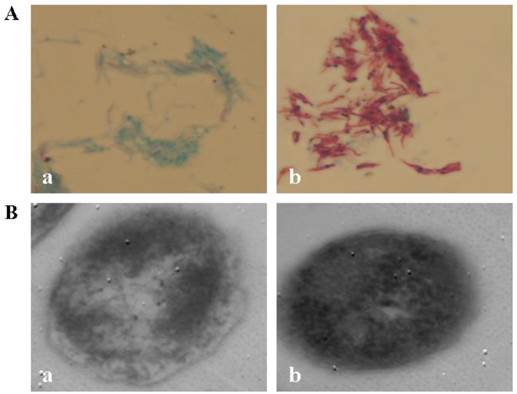
CWD-Mtb induced by nutrient starvation stress was loss of acid-fastness under light microscopy and was bounded only by a single unit membrane under electron microscopy (Figure 1). To assess the effect of loss of cell wall on bacterial load in macrophages, uptake of Mtb was determined at 4 hrs post CWD-Mtb or normal Mtb infection by CFU (colony forming units) assay. Data showed that there was no significant difference in total bacillary load between CWD-Mtb group and normal Mtb group (data not shown).
CWD-Mtb. A. Light microscopy of Mtb. H37Rv × 1000. B. Transmission electron microscopy of Mtb H37Rv. Bars = 400.00 nm. (a) CWD-Mtb; (b) normal Mtb with cell wall.
Gene expression variations between CWD-Mtb and normal Mtb infected cells
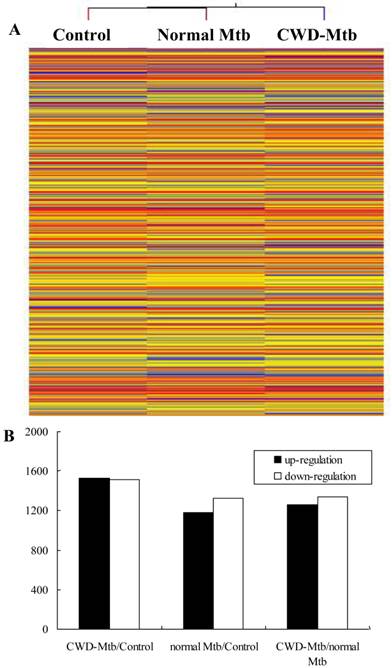
The result of hierarchical clustering showed a distinguishable gene expression profiling between different groups (Figure 2). In order to identify the most significant candidates, mRNAs with at least two-fold expression changes were selected for further statistical analysis. Compared with uninfected control group, 3,041mRNAs (1,526 of them increase) were deregulated in CWD-Mtb group and 2,505 mRNAs (1,180 of them increase) were differentially expressed in normal-Mtb group, respectively. Morever, compared with normal-Mtb group, 2,598 mRNAs (1,261 of them increase) were deregulated in CWD-Mtb group (FDR < 0.05) (Figure 2). The relative changes in gene expression between CWD-Mtb and normal Mtb group ranged from a 43.4-fold up-regulation to a 44.4-fold down-regulation and detailed information of these genes was provided in Supplementary Material: Table S1. The 10 most obviously up-regulated genes were Nnat (43.4 fold), Bcan (30.0 fold), 2810007J24Rik (28.7 fold), Lrrc57 (27.5 fold), Dcaf12l1 (23.2 fold), Hmgxb4 (22.5 fold), Myh8 (20.8 fold), Cbfa2t2 (20.8 fold), Trim7 (20.6 fold), Gngt1 (18.3 fold), Dedd (18.2 fold), and the 10 most significantly down-regulated genes were Adra1a (-44.5 fold), Ch25h (-38.2 fold), Slc1a2 (-35.7 fold), Synpo2l (-35.4 fold), Tril (-35.1 fold), Gsdmc (-34.6 fold), Pla2g12b (-34.5 fold), Cytl1(-31.3 fold), Prph (-28.3 fold), chr1 (-23.7 fold) and IL-11 (-23.1 fold) in CWD-Mtb group compared with normal Mtb group. In addition, NOS2 and Lyz2 were reduced in CWD-Mtb group compared with normal Mtb group. About cytokines and chemokines, microarray analysis demonstrated that levels of IL-6, IL-33, IL-1α, IL-1β, IFN-β, IFN-α, Ccl5, Ccl7 and Cxcl3 were increased, while TGF-β, IFN-γ, Tnfaip8, IL-11, IL-13, IL-31, Traf2 and Ccl17 were decreased in CWD-Mtb group compared with normal Mtb group. Atg9b, Atg10 and Mapt were up-regulated, while Acta1 and Acta2 were down-regulated in CWD-Mtb group compared with normal Mtb group. Moreover, many differentially expressed genes were involved in host lipid metabolism, among which, Stard5, Plscr4, Plscr3, Stard8, Stard13, Igf2, Lipa and Lipg were increased, while Pla2g12b, Acsl1, Pltp, Erlin1, Ppargc1b, Igfbp7, Igfbp4 and Igf1 were down-regulated in CWD-Mtb group compared with normal Mtb group.
Hierarchical clustering shows a distinguishable gene expression profiling in RAW264.7 cells among groups.
Validation of microarray data via qPCR in RAW264.7 cells and primary macrophages
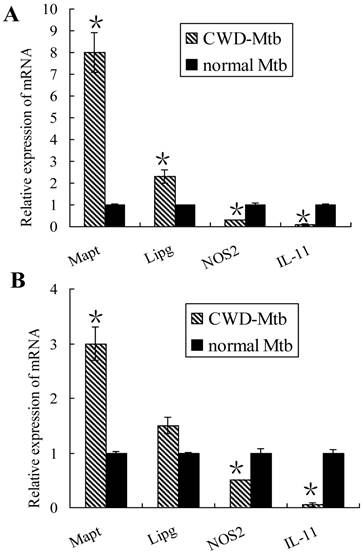
To validate the microarray results, expression levels of 4 genes were randomly selected for further confirmation by qRT-PCR, including NOS2 (macrophage activation-related gene), IL-11 (pro-inflammatory cytokine gene), Mapt (cell adhesion and tissue remodeling gene) and Lipg (host lipid metabolism gene). Gene expression data were presented as fold changes. Increased expression of Mapt and Lipg as well as decreased levels of NOS2 and IL-11 were found in CWD-Mtb infected RAW264.7 cells compared with wild Mtb infected ones (Figure 3A). Our qRT-PCR results were consistent with the microarray data. Similar results of Mapt, NOS2 and IL-11 were observed in primary macrophages, however, there was no difference for Lipg expression (Figure 3B).
Validation of mRNAs expression by qRT-PCR in RAW264.7 cells (A) and primary macrophages (B). Four mRNAs were randomly selected to confirm the microarray data. After normalization to endogenous control GAPDH, data were presented as mean ± SD and obtained average value for each mRNA was used for statistics. In CWD-Mtb infected RAW264.7 cells, Mapt and Lipg were increased, while NOS2 and IL-11 were decreased than those in normal Mtb infected ones (A). Our qRT-PCR results were consistent with the microarray data. Except no difference of Lipg expression, similar results of Mapt, NOS2 and IL-11 were observed in primary macrophages (B). *P < 0.05 compared with normal Mtb group.
NO production by Mtb infected macrophages
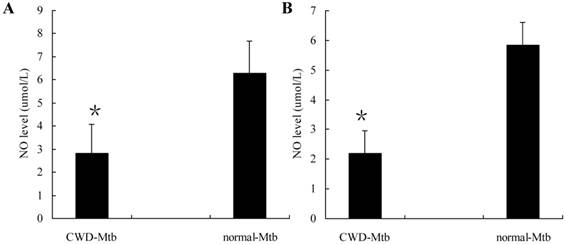
Highly activated macrophages have been shown to produce NO which is important for the control of mycobacterial infection. To determine the degree of cell activation following either CWD-Mtb or normal Mtb infection, we measured NO accumulation in culture supernatants of RAW264.7 cells and primary macrophages, respectively. Level of NO was lower in CWD-Mtb infected RAW264.7 cells compared with normal Mtb infected ones (Figure 4A). Similar results were also observed in primary macrophages (Figure 4B). The data indicated that, compared with normal Mtb, CWD-Mtb induced macrophages production of lower level of anti-microbial mediators.
Production of NO by Mtb-infected RAW264.7 cells (A) and primary macrophages (B). Culture supernatants of cells infected with CWD-Mtb or normal Mtb were collected at 24 hpi and level of NO was measured using Griess reagent. Production of NO was down-regulated in CWD-Mtb infected RAW264.7 cells compared with normal Mtb infected ones (A). Similar results were also observed in primary macrophages (B). Each value indicated the mean ± SD and was representative of results obtained from 3 independent experiments. *P<0.05 vs. normal Mtb.
KEGG with Pathway Annotation
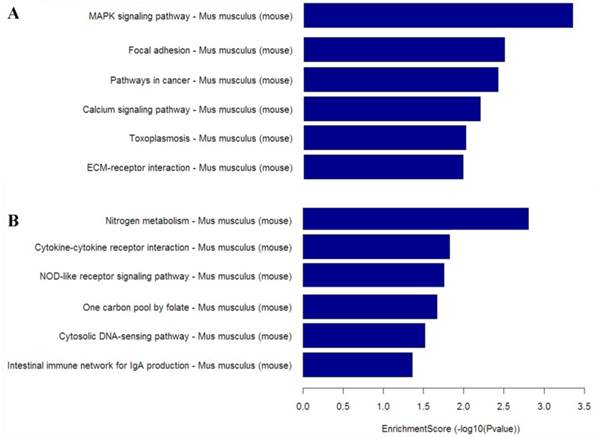
To gain insight into the cellular and molecular functions of Mtb-induced host genes, differentially expressed genes from microarray analysis were subjected to functional categorization. Up-regulated genes in CWD-Mtb group compared with normal Mtb group were mainly involved in nitrogen metabolism, cytokine-cytokine receptor interaction, NOD-like receptor signaling pathway and cytosolic DNA-sensing pathway, while down-regulated genes were mainly involved in MAPK signaling pathway, focal adhesion, pathways in cancer, calcium signaling pathway and ECM-receptor interaction (Figure 5).
KEGG pathway analysis based on down-regulated mRNAs (A) and up-regulated mRNAs (B) in CWD-Mtb group versus normal Mtb group. Enrichment Score value equals -log10 (P value). Enrichment provides a measure of the functional significance: the enrichment increases, the corresponding function becomes more specific. KEGG: Kyoto Encyclopedia of Genes and Genomes; P<0.05 were considered statistically significant.
GO Classification
In the three main categories (biological process, cellular component and molecular function) of the GO classification, ncRNA metabolic process and MAPKKK cascade, cytokine activity and DNA binding, nucleolus and cytoskeleton were dominant, respectively (Table 1, Table 2 and Table 3).
GO process analysis based on the differentially expressed mRNAs
| BP term (up-regulated genes) | P value | BP term (down-regulated genes) | P value |
|---|---|---|---|
| ncRNA metabolic process | 1.3E-4 | MAPKKK cascade | 1.6E-5 |
| pseudouridine synthesis | 5.9E-4 | transcription | 3.2E-5 |
| ribosome biogenesis | 2.2E-3 | RNA metabolic process | 3.9E-5 |
| ncRNA processing | 2.3E-3 | cell growth | 7.5E-5 |
| translation | 7.2E-3 | regulation of biosynthetic process | 1.8E-4 |
| RNA modification | 1.0E-2 | regulation of nitrogen metabolic process | 2.4E-4 |
| rRNA processing | 1.1E-2 | regulation of cell proliferation | 2.4E-4 |
| rRNA metabolic process | 1.2E-2 | phosphorus metabolic process | 2.9E-4 |
| nucleoside monophosphate catabolic process | 1.3E-2 | chromatin organization | 3.8E-4 |
| ribonucleoprotein complex biogenesis | 1.4E-2 | regulation of cell size | 3.9E-4 |
| tRNA metabolic process | 1.5E-2 | regulation of cell death | 1.7E-3 |
| central nervous system projection neuron axonogenesis | 2.3E-2 | T cell homeostasis | 4.2E-3 |
| acute-phase response | 2.9E-2 | cytoskeleton organization | 4.6E-3 |
| ruffle organization | 3.1E-2 | regulation of membrane potential | 7.6E-3 |
| respiratory system process | 4.4E-2 | regulation of metal ion transport | 9.4E-3 |
| neurotransmitter transport | 4.4E-2 | regulation of lipid biosynthetic process | 1.0E-2 |
| negative regulation of T cell activation | 1.5E-2 | ||
| negative regulation of leukocyte activation | 1.7E-2 | ||
| regulation of apoptosis | 3.2E-2 | ||
| B cell lineage commitment | 3.5E-2 | ||
| negative regulation of defense response | 3.7E-2 | ||
| negative regulation of immune system process | 4.8E-2 | ||
| cell migration | 4.8E-2 | ||
| membrane invagination | 4.9E-2 | ||
| endocytosis | 4.9E-2 |
BP: biological process; up-regulated genes: CWD-Mtb compared to normal Mtb; down-regulated genes: CWD-Mtb compared to normal Mtb.
GO Function analysis based on the differentially expressed mRNAs.
| MF term (up-regulated genes) | P value | MF term (down-regulated genes) | P value |
|---|---|---|---|
| cytokine activity | 6.0E-4 | DNA binding | 1.3E-4 |
| pseudouridine synthase activity | 3.6E-3 | transcription factor binding | 4.0E-4 |
| 3-beta-hydroxy-delta5-steroid dehydrogenase activity | 1.2E-2 | transcription regulator activity | 4.2E-4 |
| neurotransmitter binding | 2.6E-2 | transcription activator activity | 5.7E-4 |
| neurotransmitter receptor activity | 2.6E-2 | enzyme binding | 7.4E-4 |
| receptor inhibitor activity | 2.9E-2 | cytoskeletal protein binding | 1.2E-3 |
| organic acid:sodium symporter activity | 3.4E-2 | enzyme activator activity | 2.6E-3 |
| interleukin-1 receptor binding | 3.5E-2 | protein kinase binding | 5.2E-3 |
| N-acyltransferase activity | 3.6E-2 | chromatin binding | 1.0E-2 |
| acetylglucosaminyltransferase activity | 4.2E-2 | protein dimerization activity | 1.1E-2 |
| intramolecular transferase activity | 4.5E-2 | GTPase activator activity | 1.1E-2 |
| solute:sodium symporter activity | 4.6E-2 | protein homodimerization activity | 1.2E-2 |
| transcription factor activity | 1.5E-2 | ||
| adrenoceptor activity | 1.6E-2 | ||
| kinase binding | 1.9E-2 | ||
| protein kinase activity | 2.1E-2 | ||
| zinc ion binding | 2.4E-2 | ||
| nucleotide binding | 3.1E-2 | ||
| protein serine/threonine kinase activity | 3.2E-2 | ||
| phosphoprotein phosphatase activity | 3.4E-2 | ||
| structural constituent of cytoskeleton | 3.5E-2 | ||
| RNA binding | 3.5E-2 | ||
| activin receptor activity | 3.6E-2 | ||
| growth factor activity | 3.6E-2 | ||
| phosphatase regulator activity | 4.0E-2 | ||
| lipase activity | 4.2E-2 | ||
| ligand-dependent nuclear receptor transcription coactivator activity | 4.2E-2 | ||
| protein heterodimerization activity | 4.6E-2 |
MF: molecular function; up-regulated genes: CWD-Mtb compared to normal Mtb; down-regulated genes: CWD-Mtb compared to normal Mtb.
GO Component analysis based on the differentially expressed mRNAs.
| CC term (up-regulated genes) | P value | CC term (down-regulated genes) | P value |
|---|---|---|---|
| nucleolus | 5.8E-3 | cytoskeleton | 1.2E-4 |
| extracellular space | 6.9E-3 | adherens junction | 9.3E-4 |
| nuclear lumen | 9.4E-3 | plasma membrane | 2.0E-3 |
| endoplasmic reticulum | 9.5E-3 | intracellular non-membrane-bounded organelle | 2.1E-3 |
| non-membrane-bounded organelle | 2.0E-2 | non-membrane-bounded organelle | 2.1E-3 |
| intracellular non-membrane-bounded organelle | 2.0E-2 | contractile fiber part | 2.7E-3 |
| membrane-enclosed lumen | 2.6E-2 | cytoskeletal part | 3.1E-3 |
| nucleoplasm part | 2.7E-2 | cell projection | 3.2E-3 |
| intracellular organelle lumen | 2.8E-2 | dendrite | 3.7E-3 |
| nucleoplasm | 2.8E-2 | anchoring junction | 4.4E-3 |
| organelle lumen | 2.9E-2 | chromosome | 5.0E-3 |
| contractile fiber | 6.4E-3 | ||
| chromatin | 7.8E-3 | ||
| myofibril | 1.1E-2 | ||
| nucleosome | 1.5E-2 | ||
| membrane-bounded vesicle | 1.5E-2 | ||
| protein-DNA complex | 1.9E-2 | ||
| cell projection part | 2.1E-2 | ||
| cytoplasmic membrane-bounded vesicle | 3.0E-2 | ||
| secretory granule | 3.2E-2 | ||
| nuclear periphery | 3.3E-2 | ||
| cell-substrate adherens junction | 3.6E-2 | ||
| endomembrane system | 4.1E-2 | ||
| cell junction | 4.6E-2 |
CC: cellular component; up-regulated genes: CWD-Mtb compared to normal Mtb; down-regulated genes: CWD-Mtb compared to normal Mtb.
Discussion
Despite the long history in TB research, the effects of CWD-Mtb on host still remain obscure. Much research is required towards understanding the interplay between CWD-Mtb and host cells, which is helpful for the development of novel therapies and vaccines.
In the present study, gene expression patterns of RAW264.7 cells infected with two forms of Mtb were detected, with an emphasis on analysis of the response elicited by CWD-forms of the bacterium. The global transcriptome of Mtb-infected cells showed distinct patterns of gene expression. The differentially expressed genes can be grouped into 12 kinds of signaling pathways. In the study, we mainly focused more in highlighting the potential physiological relevance of groups of genes that have been suggested to be associated with Mtb infection.
Macrophages activation plays important roles in the defence against intracellular Mtb infection [12]. NOS2, a marker of macrophage activation [13], was reduced in CWD-Mtb infected cells compared with normal Mtb infected ones. Production of NO by macrophages expressing NOS2 is a key protective mechanism against mycobacteria [14], which can mediate mycobacterial killing by direct toxicity and indirect interference with Mtb virulence determinants [15,16], was decreased in CWD-Mtb group compared with normal Mtb group. Lyz2, one of anti-microbial agents [17], was also down-regulated in CWD-Mtb infected macrophages compared with normal Mtb infected ones. Our findings indicated that, compared to normal Mtb, CWD-Mtb infected macrophages were less effectively activated and less activated macrophages produced lower levels of anti-microbial mediators and thus imposed a less hostile intracellular environment on CWD-Mtb. This may explain the findings that CWD-forms predominated in the mycobacteria from clinical specimens from TB patients.
Pro-inflammatory cytokines are required for effective protection against Mtb infection [18]. Distinct Mtb strains could induce macrophages to produce different pro-inflammatory cytokine profiles [19,20]. In the study, IL-6, IL-33, IL-1α, IL-1β, IFN-β, IFNa7, TGF-β, IFN-γ, Tnfaip8, IL-11, IL-13, IL-31 as well as Traf2 were deregulated between CWD-Mtb and normal Mtb group. The data indicated that we might pay more attention to regulating these cytokines to effectively control Mtb infection.
Prevention of phagolysosome maturation is one mechanism by which Mtb is able to establish and maintain infection in macrophages [21, 22]. Delivery inhibition of vacuolar H+-ATPases to phagosome may be the main reason for delay of phagosome maturation [23]. Our results showed that some H+ transporting-related genes were found to be deregulated, among which, Atpbd4, Atp5j2, Atp5h and Atp2b2 were up-regulated, whereas Atp2b4, Atp2b1, Atp2a3 and Atp13a4 were down-regulated in CWD-Mtb group compared with normal Mtb group. Further functional studies of these genes may be helpful to increase understanding of the mechanisms involved in macrophages-Mtb interactions. Actin is required for efficient recycling and maturation of endosomes [24, 25] and disruption of actin results in the inhibition of phagolysosome maturation [26,27]. Our results showed that acta1 and acta2 were down-regulated in CWD-Mtb group compared with normal Mtb group. The data suggested that, compared to normal Mtb, CWD-Mtb might create a more favorable intracellular environment for survival by inhibition of phagosome-endosome interactions.
Autophagy has recently been identified as an effective way to restrict Mtb survival in infected macrophages [28]. Autophagosome formation is regulated by a family of evolutionally conserved autophagy-related (Atg) genes [29]. It has been reported that Atg9 is required for autophagy although its function is unknown [30]. More autophagosomes are formed in cells over-expressing Atg9; conversely, there are fewer autophagosomes seen in cells with reduced Atg9 [31]. It is reported that Atg10 is involved in autophagy-mediated immunity against intracellular pathogens such as virus [32] and Mtb [33]. Our results showed that Atg9b and Atg10 were up-regulated in CWD-Mtb group compared with normal Mtb group. These results suggest that there were differential autophagy responses between CWD-Mtb and normal Mtb infection, although roles of the autophagy genes are almost completely unknown in TB infection.
Deregulations of macrophage lipid metabolism have been reported in TB disease [34-36]. Macrophages infected with Mtb are induced accumulation of lipid droplets, which are required for intracellular Mtb growth [37]. The present study showed that some lipid metabolism-related genes were differentially expressed in CWD-Mtb group compared with normal Mtb group. StarD5 and Plscr3 were up-regulated, whereas Pla2g12b and Acsl1 were down-regulated in CWD-Mtb group compared with normal Mtb group. These findings suggested that the lipid metabolism related genes above mentioned may play important roles in Mtb-macrophages interactions and antituberculosis therapy may be targeting lipid metabolism, although their functions and mechanisms responsible for regulation of them in TB remain poorly defined.
Taken together, our findings showed that differential macrophage responses were induced by CWD-Mtb and normal Mtb infection, which may mediate two distinct infection outcomes. The study suggest that Mtb-macrophage interactions are very complex and the results provide evidence for further understanding of pathogenesis of CWD-Mtb, which may be helpful in improving strategies to eliminate intracellular CWD-Mtb. Further large and functional studies are needed to confirm our findings.
Supplementary Material
Table S1.
Acknowledgements
The work was supported by grants from the 2011 technology innovation frontier exploration key research projects of Weifang Medical University, China [K11TS1004]; the Shandong Provincial Natural Science Foundation, China [ZR2010HM073] and the National Natural Science Foundation of China [81100006, 81170080]. We thank KangChen Bio-tech for microarray analysis. Z.Y. and Y.F. designed and performed the experiments, analysed, interpreted the data and wrote the article. J.L. and X.W. performed the research, analysed the data and interpreted the results.
Competing Interests
The authors have declared that no competing interest exists.
References
1. Koo MS1, Subbian S, Kaplan G. Strain specific transcriptional response in Mycobacterium tuberculosis infected macrophages. Cell Commun Signal. 2012;10:2
2. Mehrotra P, Jamwal SV, Saquib N, Sinha N, Siddiqui Z, Manivel V. et al. Pathogenicity of Mycobacterium tuberculosis is expressed by regulating metabolic thresholds of the host macrophage. PLoS Pathog. 2014;10:e1004265
3. Pan F, Zhao Y, Zhu S, Sun C, Lei L, Feng X. et al. Different transcriptional profiles of RAW264.7 infected with Mycobacterium tuberculosis H37Rv and BCG identified via deep sequencing. PLoS One. 2012;7:e51988
4. Manabe YC1, Dannenberg AM Jr, Tyagi SK, Hatem CL, Yoder M, Woolwine SC. et al. Different strains of Mycobacterium tuberculosis cause various spectrums of disease in the rabbit model of tuberculosis. Infect Immun. 2003;71:6004-11
5. Thacore H, Willett HP. The formation of spheroplasts of Mycobacterium tuberculosis in tissue cultures cells. Am Rev Resp Dis. 1966;93:786-96
6. Michailova L, Kussovski V, Radoucheva T, Jordanova M, Berger W, Rinder H. et al. Morphological variability and cell-wall deficiency in Mycobacterium tuberculosis 'heteroresistant' strains. Int J Tuberc Lung Dis. 2005;9:907-14
7. Khomenko AG, Kochemasova ZN, Dykhno MM, Zemskova ZN, Dorozhkova IR. Significance of L-form transformation and reversion of the causative agent in the epidemiology of tuberculosis. ZhMikrobiol Epidemiol Immunobiol. 1984;3:9-14
8. Rosu V, Bandino E, Cossu A. Unraveling the transcriptional regulatory networks associated to mycobacterial cell wall defective form induction by glycine and lysozyme treatment. Microbiol Res. 2013;168:153-64
9. Wu K, Koo J, Jiang X, Chen R, Cohen SN, Nathan C. Improved control of tuberculosis and activation of macrophages in mice lacking protein kinase R. PLoS One. 2012;7:e30512
10. Stanley SA, Barczak AK, Silvis MR, Luo SS, Sogi K, Vokes M. et al. Identification of host-targeted small molecules that restrict intracellular Mycobacterium tuberculosis growth. PLoS Pathog. 2014;10:e1003946
11. Markova N, Slavchev G, Michailova L. Unique biological properties of Mycobacterium tuberculosis L-form variants: impact for survival under stress. Int Microbiol. 2012;15:61-8
12. Andersson H, Andersson B, Eklund D, Ngoh E, Persson A, Svensson K. et al. Apoptotic neutrophils augment the inflammatory response to Mycobacterium tuberculosis infection in human macrophages. PLoS One. 2014;9:e101514
13. Schoenen H, Huber A, Sonda N, Zimmermann S, Jantsch J, Lepenies B. et al. Differential control of mincle-dependent cord factor recognition and macrophage responses by the transcription factors C/EBPβ and HIF1α. J Immunol. 2014;193:3664-75
14. Duque-Correa MA, Kühl AA, Rodriguez PC, Zedler U, Schommer-Leitner S, Rao M. et al. Macrophage arginase-1 controls bacterial growth and pathology in hypoxic tuberculosis granulomas. Proc Natl Acad Sci U S A. 2014;111:E4024-32
15. O'Brien L, Carmichael J, Lowrie DB, Andrew PW. Strains of Mycobacterium tuberculosis differ in susceptibility to reactive nitrogen intermediates in vitro. Infect Immun. 1994;62:5187-90
16. Messmer UK, Reimer DM, Reed JC, Brune B. Nitric oxide induced poly (ADPribose) polymerase cleavage in RAW 264.7 macrophage apoptosis is blocked by Bcl-2. FEBS Lett. 1996;384:162-6
17. Berod L, Stüve P, Swallow M, Arnold-Schrauf C, Kruse F, Gentilini MV. et al. MyD88 signalling in myeloid cells is sufficient to prevent chronic mycobacterial infection. Eur J Immunol. 2014;44:1399-409
18. Li W, Zhao Q, Deng W, Chen T, Liu M, Xie J. Mycobacterium tuberculosis Rv3402c enhances mycobacterial survival within macrophages and modulates the host pro-inflammatory cytokines production via NF-kappa B/ERK/p38 signaling. PLoS One. 2014;9:e94418
19. Chen YY, Chang JR, Huang WF, Hsu SC, Kuo SC, Sun JR. et al. The pattern of cytokine production in vitro induced by ancient and modern Beijing Mycobacterium tuberculosis strains. PLoS One. 2014;9:e94296
20. Chakraborty P, Kulkarni S, Rajan R, Sainis K. Drug resistant clinical isolates of Mycobacterium tuberculosis from different genotypes exhibit differential host responses in THP-1 cells. PLoS One. 2013;8:e62966
21. Wang J, Yang K, Zhou L. et al. MicroRNA-155 promotes autophagy to eliminate intracellular mycobacteria by targeting Rheb. PLoS Pathog. 2013;9:e1003697
22. Podinovskaia M1, Lee W, Caldwell S, Russell DG. Infection of macrophages with Mycobacterium tuberculosis induces global modifications to phagosomal function. Cell Microbiol. 2013;15:843-59
23. Rohde K, Yates RM, Purdy GE, Russell DG. Mycobacterium tuberculosis and the environment within the phagosome. Immunol Rev. 2007;219:37-54
24. Hestvik AL, Hmama Z, Av-Gay Y. Mycobacterial manipulation of the host cell. FEMS Microbiol Rev. 2005;29:1041-50
25. Guerin I, de Chastellier C. Pathogenic mycobacteria disrupt the macrophage actin filament network. Infect Immun. 2000;68:2655-62
26. Guerin I, de Chastellier C. Disruption of the actin filament network affects delivery of endocytic contents marker to phagosomes with early endosome characteristics: the case of phagosomes with pathogenic mycobacteria. Eur J Cell Biol. 2000;79:735-49
27. Anes E, Kühnel MP, Bos E, Moniz-Pereira J, Habermann A, Griffiths G. Selected lipids activate phagosome actin assembly and maturation resulting in killing of pathogenic mycobacteria. Nat Cell Biol. 2003;5:793-802
28. Sanjurjo L, Amézaga N, Vilaplana C, Cáceres N, Marzo E, Valeri M. et al. The scavenger protein apoptosis inhibitor of macrophages (AIM) potentiates the antimicrobial response against Mycobacterium tuberculosis by enhancing autophagy. PLoS One. 2013;8:e79670
29. Mizushima N, Yoshimori T, Ohsumi Y. The role of atg proteins in autophagosome formation. Annu Rev Cell Dev Biol. 2011;27:107-32
30. Webber JL1, Tooze SA. New insights into the function of Atg9. FEBS Lett. 2010;584:1319-26
31. Jin M, Klionsky DJ. Transcriptional regulation of ATG9 by the Pho23-Rpd3 complex modulates the frequency of autophagosome formation. Autophagy. 2014;10:1681-2
32. Petkova DS1, Viret C, Faure M. IRGM in autophagy and viral infections. Front Immunol. 2013;3:426
33. Songane M, Kleinnijenhuis J, Alisjahbana B, Sahiratmadja E, Parwati I, Oosting M. et al. Polymorphisms in autophagy genes and susceptibility to tuberculosis. PLoS One. 2012;7:e41618
34. Russell DG, Cardona PJ, Kim MJ, Allain S, Altare F. Foamy macrophages and the progression of the human tuberculosis granuloma. Nat Immunol. 2009;10:943-8
35. Peyron P, Vaubourgeix J, Poquet Y, Levillain F, Botanch C, Bardou F. et al. Foamy macrophages from tuberculous patients' granulomas constitute a nutrient-rich reservoir for M. tuberculosis persistence. PLoS Pathog. 2008;4:e1000204
36. Caire-Brändli I, Papadopoulos A, Malaga W, Marais D, Canaan S, Thilo L. et al. Reversible lipid accumulation and associated division arrest of Mycobacterium avium in lipoprotein-induced foamy macrophages may resemble key events during latency and reactivation of tuberculosis. Infect Immun. 2014;82:476-90
37. Salamon H, Bruiners N, Lakehal K, Shi L, Ravi J, Yamaguchi KD. et al. Cutting edge: Vitamin D regulates lipid metabolism in Mycobacterium tuberculosis infection. J Immunol. 2014;193:30-4
Author contact
![]() Corresponding author: Zheng-Jun Yi Tel: +86 0536-3081587; Fax: +86 0536-8462230; E-mail: fuyizhengjuncom; Postal address: No. 2428, Yuhe Road, Kuiwen District, Faculty of Laboratory Medicine of Affiliated Hospital of Weifang Medical University, Weifang, Shandong Province 261031, China.
Corresponding author: Zheng-Jun Yi Tel: +86 0536-3081587; Fax: +86 0536-8462230; E-mail: fuyizhengjuncom; Postal address: No. 2428, Yuhe Road, Kuiwen District, Faculty of Laboratory Medicine of Affiliated Hospital of Weifang Medical University, Weifang, Shandong Province 261031, China.