Impact Factor ISSN: 1449-2288
- Issue 12; 2026
- Issue 11; 2026
- Issue 10; 2026
- Issue 9; 2026
- Issue 8; 2026
- Volume 22; 2026
- Past Issues
- Advance Articles
- Editorial Board
- Cover Images
- Index & Coverage
- Cover Suggestion
- Special Issues
Introduction
Methods
Results
Discussion
Abbreviations
Supplementary Material
Acknowledgements
References

 Global reach, higher impact
Int J Biol Sci 2015; 11(1):88-98. doi:10.7150/ijbs.10583 This issue Cite
Research Paper
Integrative Genomic and Transcriptomic Characterization of Matched Primary and Metastatic Liver and Colorectal Carcinoma
Stephanie Roessler1,#,*, Guoling Lin1,2,#,*, Marshonna Forgues1, Anuradha Budhu1, Shelley Hoover3, R. Mark Simpson3, Xiaolin Wu4, Ping He5, Lun-Xiu Qin2, Zhao-You Tang2, Qing-Hai Ye2, ![]() , Xin Wei Wang1,
, Xin Wei Wang1, ![]()
1. Laboratory of Human Carcinogenesis, National Cancer Institute, NIH, Bethesda, MD, USA;
2. Liver Cancer Institute, Fudan University, Shanghai, China;
3. Laboratory of Cancer Biology and Genetics, National Cancer Institute, NIH, Bethesda, MD, USA;
4. Laboratory of Molecular Technology, NCI-Frederick, SAIC-Frederick, Frederick, MD 21701, USA;
5. Division of Hematology, Center for Biologics Evaluation and Research, Food and Drug Administration, Bethesda, Maryland 20892, USA.
* These authors contributed equally to this work.
# Current address: SR, Institute of Pathology, University Hospital Heidelberg, Heidelberg, Germany; GL, Division of Hepatobiliary and Pancreatic Surgery, Department of Surgery, First Affiliated Hospital, School of Medicine, Zhejiang University, Hangzhou, China.
Received 2014-9-19; Accepted 2014-10-13; Published 2015-1-1
Abstract

Metastasis is the main cause of cancer mortality but its process remains poorly understood and thus hampers more effective treatment and improved cancer prognosis. To search for metastasis driver genes responsible for tumor spread, we integrated genomic and transcriptomic profiles of 61 matched primary tumors and distant metastases of liver or colorectal carcinoma isolated by laser-capture microdissection and assayed by array-based technologies. We found that primary tumor lesions and their matched distant metastases were largely similar at the genomic and transcriptomic levels, but substantial differences could be found between primary tumors with or without accompanying metastases. Interestingly, metastasis genes were principally tumor type and organ site-specific. Despite distinct pathway enrichment, different metastasis gene sets shared common prognostic capacity and were predictive of hepatocellular carcinoma survival in an independent cohort. Thus, the metastatic propensity is inherent to the primary tumor and the lack of general metastasis genes necessitates the development of specific treatment modalities.
Keywords: Liver cancer, Colon cancer, Organ site-specific metastasis, Profiling.
Introduction
The progression of a primary tumor to metastatic disease is believed to be a multistep process which requires the ability of cells to survive in the circulation, extravasate into the parenchyma of distant organs, adapt to the new environment and outgrow secondary lesions [1, 2]. Only few tumor cells are believed to be capable of completing this process. In addition, metastases arise at different rates and different organ sites are favored depending on the cancer type [3]. Thus, it is expected that there is a significant difference in tumor biology between primary tumor cells and their metastasized progenies. Although, many metastasis-related genes have been identified, the extent to which these genes are involved in the metastasis development of different tumor entities, their role in organ site-specific metastasis, and how they drive progression remains unclear [4, 5].
An effective and physiologically relevant approach to identify candidate metastasis driver genes is to perform genomic characterization of primary and paired metastatic lesions from the same individual. Such a comparison provides the most meaningful and physiological relevance to human cancer. However, such high quality patient samples of primary tumors and matched metastases are generally not available due to the fact that most of the metastatic lesions develop many years after initial cancer diagnosis and intervention. Thus, most studies investigating genes involved in metastasis rely on in vitro assays, animal models or metastases from autopsy without matched primary tumors. One approach which was taken in earlier studies is the selection of metastatic cells via in vivo mouse models, whereby, primary tumor tissues or cell lines are introduced into mice and organ site-specific metastatic cells are selected over multiple cycles and analyzed [6-8]. These studies led to the discovery of many pro-metastatic genes [9]. But only few studies so far compared a limited amount of primary tumors and paired metastases. Interestingly, gene profiling of 8 primary breast tumors and paired metastases revealed striking similarity between the primary tumor and the distant metastasis of the same patient [10]. In addition, the analysis of a metastasis signature obtained from comparison of multiple cancer types and unmatched primary tumors was able to predict patient outcome in breast, lung, prostate adenocarcinoma and medulloblastoma [11]. Previously, we have shown that primary hepatocellular carcinoma (HCC) samples and their corresponding intrahepatic metastases derived from surgical resection do not exhibit any statistically significant differences [12]. However, these results were based on intrahepatic metastatic lesions and thus their difference may be minimal.
To overcome the limitations described above, we collected high quality gastrointestinal tumor specimens derived from patients with primary tumors and corresponding distant metastases, whose metastatic lesions were determined to be potentially treatable by surgery. We collected a set of paired primary and distant metastatic liver and colon carcinomas from surgical resection with the goal of identifying metastasis dissemination-related genes. We performed gene expression profiling of laser capture microdissected tumor and paired metastasis and genome-wide somatic copy number alteration (SCNA) profiling to ensure that the identified genes are tumor-specific. We found that liver metastases display some genomic instability compared to their paired primary tumors but the gene expression profiles of primary liver and colorectal carcinoma did not show any significant differences. In contrast, liver metastases of colorectal carcinoma patients differed greatly from liver carcinoma. The integrative analysis of gene expression and SCNA data showed that potential cancer driver genes are enriched in primary tumor lesions with metastatic potential and that the organ site-specific metastasis gene signatures are associated with HCC prognosis despite of their distinct gene sets and related pathways.
Methods
Liver and colorectal carcinoma tissue samples and clinical data. Primary tumors and metastatic tissues were obtained with informed consent from patients who underwent radical resection or liver transplantation between 2004 and 2006 at the Liver Cancer Institute (LCI, Fudan University, Shanghai, China). The study was approved by the Institutional Review Board of LCI, Fudan University, Shanghai. A total of 39 patients, 7 colorectal adenocarcinoma, one gastric adenocarcima, 26 HCC, 4 cholangiocarcinoma and one angiosarcoma patient were recruited. Synchronous liver metastasis from all 7 colorectal carcinoma patients, synchronous lung metastasis from 2 liver cancer patients, 5 synchronous lymph node metastasis, and 3 synchronous adrenal gland metastasis were obtained at the time of surgery of the primary tumor. For 11 liver cancer patients, metachronous lung metastases were resected after primary tumor surgery and 10 HCC patients did not develop any metastasis at 2 years post resection. All patients were diagnosed by two independent pathologists, with detailed information on clinical presentation and pathological characteristics. In addition, tissue samples of 5 patients with hemangioma were obtained. Tissue samples were fresh frozen in liquid nitrogen within 30 minutes of surgical excision.
Laser capture microdissection (LCM). Enriched tumor cells from 61 primary and metastatic tumor specimens were obtained by laser capture microdissection (LCM). Selected tissue foci were microdissected with a laser microdissection microscope (LMD6000, LeicaMicrosystems, Buffalo Grove, IL) equipped with a 355nm ultraviolet laser diode from Hematoxylin & Eosin stained, 8µm thick, tissue sections mounted on glass slides containing a polyethylene naphthalate (PEN) membrane (Life Technologies, Grand Island, NY). Representative LCM images are shown in Figure 1B and Supplementary Material: Figure S1. The dissected cell population was selected with the aid of a drawing tablet and integrated pen tool (Wacom. Vancouver, WA). One Hematoxylin/eosin-stained section of each specimen was reviewed by a pathologist to confirm diagnosis and presence of tumor. The pathologist indicated which representative sections of the tumors should be microdissected. Tumor cells from primary tumor and metastatic specimens were collected.
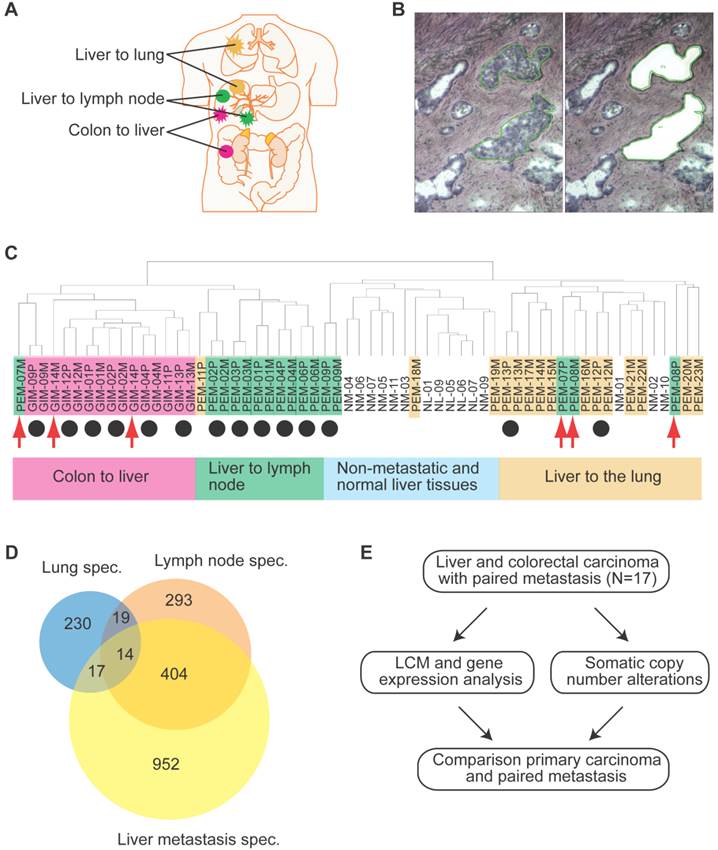
Gene expression analysis of colorectal and liver carcinoma and metastases. (A) Colorectal tumors and paired metastasis to the liver are indicated in pink. Liver carcinoma with metastasis to the lymph node and to the lung are depicted in green and yellow, respectively. (B) Representative images of laser capture microdissection (LCM) of a primary cholangiocarcinoma before (top panel) and after LCM (bottom panel) of a case with lymph node metastasis (PEM-02A). In green are two areas selected for LCM. (C) Unsupervised clustering of 61 primary and metastatic clinical tumor specimens analyzed by gene expression microarrays. Colorectal carcinomas (GIM), liver carcinomas (PEM) with metastasis to the lymph node or the lung, non-metastatic liver carcinomas (NM) and normal liver (NL) are indicated. Paired tumor-metastasis samples which cluster next to each other are indicated with black dots and samples which do not cluster together with red arrows. (D) Overlap of gene lists resulting from comparison of non-metastatic (NM) cancer to lung metastases, to lymph node metastases and to liver metastasis of colorectal carcinoma. (E) In this study, 17 liver and colorectal carcinomas with their respective paired metastasis have been used to perform gene expression analysis of LCM-enrich tumor epithelium and to measure somatic copy number alterations (SCNA). The data obtained was subsequently used for integrative comparison of primary carcinoma and paired metastasis.
RNA isolation and gene expression microarrays. Following LCM, total RNA was isolated from dissected tissues using the PicoPure protocol (Arcturus, Mountain View, CA). RNA quality was analyzed using the Agilent 2100 Bioanalyzer RNA 6000 Pico Assay (Agilent, Santa Clara, CA). The mRNA was amplified with two linear amplification steps by in vitro transcription using the MEGAscript T7 kit (Ambion, Austin, TX), followed by the labeling step using the BioArray HighYield RNA Transcript Labeling Kit T3 from Enzo Life Sciences (Farmingdale, NY). Labeled cRNA was hybridized onto Affymetix HG-U133 Plus 2.0 Arrays. CEL files with the normalized expression data, and additional tumor marker information, were deposited in the GEO repository (GSE40367).
Analysis of gene expression data. All Affymetrix HG-U133 Plus 2.0 microarrays were normalized with MAS 5.0 in BRB array tools Version 4.2.1 (http://linus.nci.nih.gov/BRB-ArrayTools.html). Arrays were normalized to the median array. After exclusion of probes with more than 50% missing or 50% absent calls, 23,515 probes of a total of 54,675 probes on the HG-U133 Plus 2.0 arrays remained. Class comparison of the gene expression data was performed in BRB-Array Tools (http://linus.nci.nih.gov/BRB-ArrayTools.html). For survival risk prediction, genes whose expression was significantly related to survival by univariate Cox proportional hazards regression were used by principal component analysis. Next, to compute a prognostic index, the weighted average of the principal component values was calculated, using the regression coefficients derived from the Cox regression. Finally, this prognostic index was used to split samples into two groups of equal size by the median of the prognostic index. Thereby, a high value of the prognostic index corresponded to a high value of hazard of death (high risk), and consequently a relatively poor predicted survival (low risk). In order to evaluate the predictive value of the method, 10-fold cross-validation with 1000-fold random permutation of the Cox-Mantel log-rank test was performed. We used clustering applying Euclidean distance and average linkage of the survival groups for each gene signature to analyze patient subgroups.
DNA isolation and arrayCGH. Somatic copy number alterations of 7 colon adenocarcinomas with paired liver metastasis and 10 liver carcinoma with metastasis to the lymph node, adrenal gland or lung were analyzed by Agilent array-based comparative genomic hybridization (CGH) as previously described [13]. Briefly, genomic DNA was isolated using proteinase K digestion (P2308, Sigma-Aldrich, St. Louis, MO) and subsequent Phenol/Chlororform extraction. Purified DNA was quantified by the fluorometric assay Quant-iT Pico Green dsDNA (Invitrogen, Carlsbad, CA). ArrayCGH Human-Genome-CGH-105A Oligo Microarrays G4412A were carried out according to the manufacturer's instructions (Agilent, Santa Clara, CA). Five micrograms of genomic DNA and reference DNA of the opposite gender (human genomic DNA, Promega, San Luis Obispo, CA) were digested with the restriction enzymes AluI and RsaI. Digested DNA was labeled using the BioPrime Array CGH Genomic Labeling kit (Invitrogen, Carlsbad, CA) according to the manufacturer's instructions. Tumor and reference DNA were combined and hybridized to Human Genome CGH 105A Oligo Microarray glass slides (G4412A, Agilent, Santa Clara, CA) for 36-40 hours at 65°C, washed and dried. Subsequently, dried array slides were scanned using the DNA Microarray Scanner (Agilent, Santa Clara, CA). Raw image files of the arrays were processed using Feature Extraction software 8.1 (Agilent, Santa Clara, CA). Arrays with derivative log ratio spread (DLRS) higher than 0.2 log units were repeated and according to MIAME guidelines, raw data Feature Extraction files were deposited into the GEO repository (GSE41210).
Analysis of arrayCGH data. All algorithms were implemented in the R programming language (version 2.15.0; www.r-project.org). Signal intensities were preprocessed by the Agilent feature extraction software followed by segmentation analysis using the snapCGH (version 1.26.0) R package available at the Bioconductor (www.bioconductor.org) as previously reported [13]. In brief, sex chromosomes were excluded from the arrayCGH analysis because the opposite gender was used as a reference for quality control. Intensity ratios of the tumor over reference samples were logarithm-2 (log2) transformed, median-centered, and subjected to an improved circular binary segmentation algorithm [14]. Segments without significant statistical differences were merged into the same states using the method provided by Willenbrock and Fridlyand [15]. Centers of the segmentation means for individual arrays were determined by setting the mode of density distribution as the baseline (log2 ratio = 0). The DNA copy number aberrations at particular genomic locations were determined by the corresponding segmentation means. Regions with segmented log2 ratios greater than 0.3 and smaller than -0.3 were considered regions of gain and loss, respectively. For unsupervised hierarchical clustering of the arrayCGH data, segmented data was converted to 1, -1, 0 according to their respective status of gain, loss and no change, and then weighted by the squares of the frequencies of copy number gain or loss at a particular genomic location. Adjacent probes with identical DNA copy number profiles across all samples were combined to form unique segments. Average-linkage clustering was performed based on the Euclidean distance metric. The significance of the difference in gain or loss status between HCC subgroups in unique segments was determined by the Fisher's exact test and the p-values were adjusted using Benjamini-Hochberg correction. Adjacent significant regions with gaps less than 50kb were combined and considered as one large region with differential genomic aberrations between subgroups.
Correlation analysis. To calculate the Spearman or Pearson correlation coefficients (r) for genes with more than one probe set, the mean gene expression was calculated. For each gene, the correlation coefficient between the segmented log2 ratios of the DNA copy number and the expression values was computed, as done previously [13]. The empirical null distribution was obtained from the Spearman or Pearson correlation coefficients calculated from 1,000 random permutations, as indicated. Genes with correlation coefficients greater than the one corresponding to the 95th percentile of the empirical null distribution were considered positively correlated between DNA copy number alteration and expression.
Pathway analyses and statistics. Organ site-specific metastasis gene lists resulting from class comparisons were analyzed by Ingenuity Pathway Analysis (IPA; http://www.ingenuity.com/products/ipa). We performed IPA of the respective corresponding probe sets to each organ site specific metastasis gene list with the associated fold change as input. For each of the three gene signatures enrichment of genes in canonical pathways was analyzed separately. The statistical significance was defined as p<0.05. To account for multiple testing, a statistical significance of p<0.001 and False Discovery Rate (FDR) <0.1 (<10% false positives) were used.
Results
Gene expression profiling of matched primary tumors and distant metastases reveals a high degree of similarity
We conducted gene expression profiling of a total of 61 matched primary liver and colon carcinoma lesions with paired synchronous metastasis to the lung, lymph nodes, adrenal glands, or liver, and of liver carcinomas without tumor relapse at 2-year post tumor resection (Supplementary Material: Table S1 and Figure 1A). To exclude gene expression patterns of the tumor stroma, enriched tumor epithelia were obtained by laser capture microdissection (LCM) and representative images of LCM are shown in Figures 1B and S1. Because the liver microenvironment was shown to exhibit a distinct metastasis signature which is characteristic of a Th1/Th2-like cytokine shift, we also attempted to isolate tumor stroma for gene expression profiling by LCM [16]. However, we were not able to obtain enough material to perform microarray analysis and thus, focused our analysis on the comparison of tumor epithelia in primary tumors and paired metastasis. Unsupervised hierarchical clustering of the gene expression data revealed four major tumor-site-specific and organ-specific clusters where most of the primary tumors (14/17) preferentially clustered with their paired extrahepatic metastases (Figure 1C), reminiscent of our previous findings with intrahepatic metastases [12]. Among primary liver carcinoma with extrahepatic metastasis (PEM), 2 synchronous (PEM-12, PEM-13) and 8 metachronous lung metastases fell into the same cluster. Thus, synchronous and metachronous metastasis to the lung showed more similarities than metastasis to other organs such as the lymph node or adrenal gland. It appears that tumors and their paired metastases share similar gene expression profiles and that liver cancers with different metastatic sites have distinct transcriptomes.
Identification of metastasis-related genes across tissue types
To further search for metastasis-related genes, we compared gene expression profiles of primary colorectal carcinomas (gastrointestinal metastasis: GIM) and paired synchronous liver metastases using pairwise class comparison even when increasing statistical power by comparing all primary liver and colorectal tumor samples (PEM+GIM) to their paired metastasis (Table 1), indicating that these primary carcinomas and their paired metastasis are transcriptomically similar. Taken together, our results indicate that primary colorectal or liver carcinomas and their paired synchronous metastasis do not exhibit any significant transcriptomic differences. These results reinforce the hypothesis that the ability to metastasize is inherent to the primary tumor and metastasis should be compared to non-metastatic tumors.
Differentially expressed genes and performance of classifier.
| Classifier | Clinical groups | No. of cases | p-valuea | FDRb | No. of genes |
|---|---|---|---|---|---|
| Colon | Primary vs. metastasis | 7/7 | <0.001 | 1 | |
| <0.01 | 1 | ||||
| Lymph node | Primary vs. metastasis | 5/5 | <0.001 | >0.983 | |
| <0.01 | >0.983 | ||||
| Adrenal gland | Primary vs. metastasis | 3/3 | <0.001 | NA c | |
| <0.01 | 0.916 | ||||
| Lung | Primary vs. metastasis | 2/2 | <0.001 | NA | |
| <0.01 | 1 | ||||
| All cases | Primary vs. metastasis | 17/17 | <0.001 | NA | |
| <0.01 | 1 | ||||
| Lung | NM vs. lung metastasis | 10/12 | <0.001 | <0.064 | 280 |
| <0.01 | <0.124 | ||||
| Colon | NM vs. colon metastasis | 10/7 | <0.001 | <0.001 | 1387 |
| <0.01 | <0.065 | 2540 | |||
| Lymph node | NM vs. lymph node metastasis | 10/5 | <0.001 | <0.024 | 730 |
| <0.01 | <0.094 | 1783 |
a Parametric p-value for two-sided t-test. b False Discovery Rate (FDR); bold indicates significant FDR values at FDR < 0.1 (10%). c NA: not available.
In contrast to a minimum difference among primary and paired metastatic lesions, class comparison of non-metastatic liver cancers (NM) to those with lung metastases or lymph node metastasis resulted in 369 and 1011 significant probes sets, which correspond to 280 and 730 genes, respectively. In addition, liver metastases of colorectal carcinomas differed in 2002 probe sets to NM which represent 1387 genes (p<0.001; Supplementary Material: Table S2). However, the identified differential gene sets exhibited a small overlap of only 14 genes, suggesting that most genes are tumor type and organ site-specific (Figure 1D; Supplementary Material: Table S2). Most of the 14 genes' function is related to metabolism (5/14 or 36%). Three of the genes are involved in proliferation, while 3 others are related to cell-cell or cell-matrix interaction and the remaining genes have roles in fibrosis, autoimmunity and histone modification. Taken together, it appears that the metastatic genes of different organ-specific metastases are distinct.
Somatic copy number alterations in primary tumors and metastases
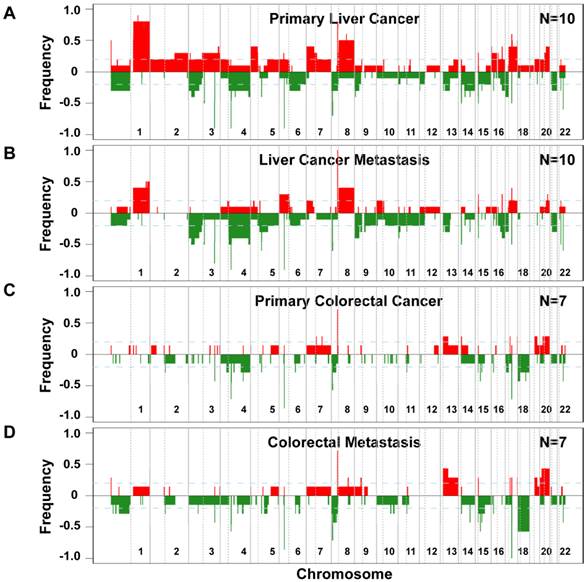
Since genomic alterations have been implicated in metastasis, we performed an integrative analysis of genomic and transcriptomic profiling in order to identify metastasis driver genes (Figure 1E). To determine genomic differences between primary tumors and distant metastases, we analyzed the somatic copy number alteration (SCNA) profiles by array-based comparative genomic hybridization (arrayCGH). We only included cases with fresh frozen metastatic tissues available which left us with 34 clinical specimens of 7 colorectal carcinoma and 10 liver cancer patients. The comparison of primary and metastatic liver tumors showed that both exhibit differences in their SCNA profiles (Figure 2A and B). In addition, colorectal tumors showed few SCNAs and similarly to liver, colorectal tumors and paired liver metastasis they exhibited differences in their SCNA profiles (Figure 2C and D). Unsupervised hierarchical clustering of the genomic alterations revealed that all 7 primary and paired metastatic colorectal carcinoma pairs each clustered together, whereas, only 5 out of 10 liver carcinoma pairs clustered adjacent to each other (Figure 3A). Next, we analyzed the mean number of SCNAs per sample which was comparable with previous studies (Figure 3B) [17]. Thus, liver tumors appeared to have accumulated more genomic aberrations than colorectal tumors. Although not significant, there was a trend of more SCNAs in liver carcinoma with paired extrahepatic metastasis (PEM) than colorectal carcinoma with matched metastases to the liver (GIM). We calculated the difference of SCNA counts in primary versus metastatic tissue pairs for each patient. Consistent with the clustering results (Figure 3A), the difference of SCNA counts in primary versus metastatic tissue pairs was larger in PEM specimens than in GIM specimens (t-test p= 0.044; Figure 3C). This suggests that the genomic instability is higher in PEM than in GIM.
Frequencies of significant aberration in SCNAs of gain and loss areas in gastrointestinal and liver carcinoma. (A) Frequencies of significant SCNAs are plotted as a function of genome location for 10 primary liver cancer cases. Positive values indicate frequencies of samples showing copy number increases, shown in red, and negative values indicate frequencies of samples showing copy number decreases, shown in green. Chromosome boundaries and centromere position are indicated by vertical solid and dashed lines, respectively. (B) Frequencies of SCNAs in the corresponding distant metastases of these 10 liver cancer cases. (C and D) Frequencies of significant SCNAs of 7 primary colorectal cancer and 7 paired colorectal metastases to the liver are plotted as a function of genome location, respectively. Horizontal dashed blue lines indicate frequency of + and -0.2.
Distinct patterns and frequencies of significant aberration in SCNA profiles in primary and metastatic gastrointestinal (GIM) and liver carcinoma (PEM). (A) Unsupervised clustering of SCNA profiles of 17 paired primary and metastatic tumor specimens is shown. Paired tumor-metastasis samples are indicated with black dots and un-paired samples with red arrows. Colorectal carcinomas with liver metastasis (GIM), liver carcinomas (PEM) with lung metastasis and metastasis to the lymph node are shown in pink, yellow and green respectively. (B) Mean number of deletions and amplifications per sample type are shown for primary (P) and metastatic (M) tissues of colorectal (GIM) and liver carcinoma patients (PEM). Mean deletion counts are displayed as grey and amplification counts as black bars, respectively. (C) Difference of SCNA counts in primary versus metastatic tissue pairs for GIM and PEM. (D and E) Differences (y axis) between frequencies of gain (D) and loss (E), respectively, across the genome for GIM versus PEM cases. SCNA frequencies are plotted as a function of positioned location in the genome with positive values indicating higher frequencies in GIM versus PEM.
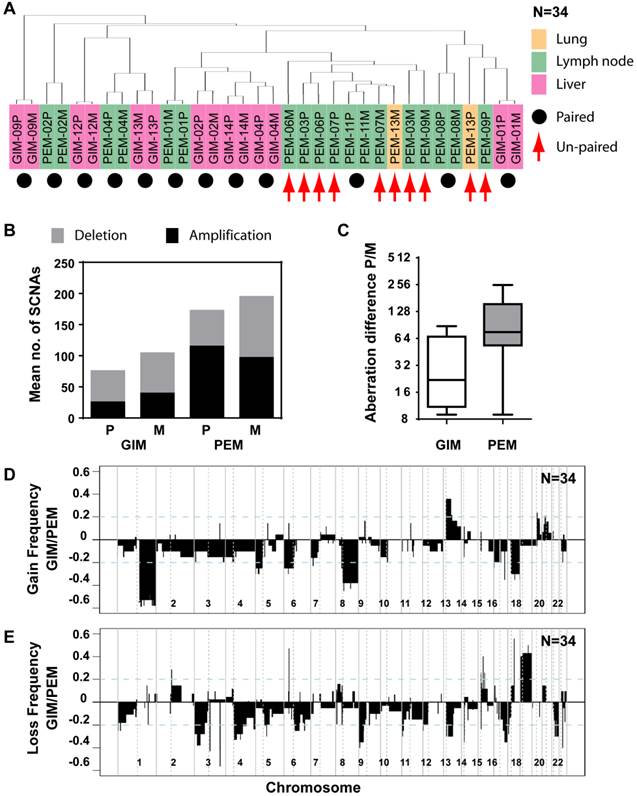
Comparison of SCNA frequency in GIM and PEM samples showed that the gained and lost regions differ by up to 60% (Figure 3D and E). Chromosome 1q, 8q and 17q gain and loss of large regions of chromosomes 3p, 4q, 9p, 13q, 16q and 21 were mainly associated with liver carcinoma, whereas gain of 13q and loss of 18 were most prevalent in colorectal carcinoma. The statistical analysis of SCNAs showed that 14 gain regions and 27 loss regions are significantly different between GIM and PEM (Supplementary Material: Table S3). Further analysis revealed that most of the loss (13/14) and gain regions (22/27) have a higher frequency of aberration in PEM than GIM. Thus, colorectal and liver tumors have specific genomic aberration profiles. In addition, primary tumors and matched metastases display some genomic differences, which indicate genomic instability in contrast to the transcriptomic profiles that do not show any significant differences.
Integration of gene expression profiling with somatic copy number alterations
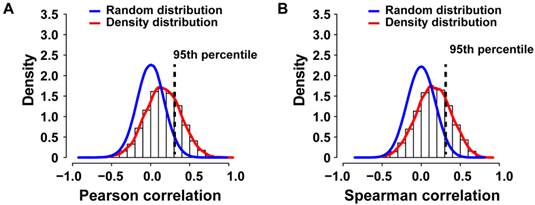
To identify potential cancer driver genes, we sought to integrate SCNA with gene expression profiling by performing correlation analysis, a strategy successfully used previously [13, 18]. Gene expression profiles of 7 primary colorectal cancer cases with paired metastasis and for 10 primary liver cancers and 9 paired metastases were available (N=33; PEM-11M gene expression microarray failed the quality control). We applied Pearson or Spearman correlation analysis of the gene expression and SCNA profiles for each gene of the 33 specimens and compared the resulting density distribution to the random distribution (Figure 4A and B). We found that 3,593 out of 12,714 genes (28.26%) of the Pearson correlation and 3,566 out of 12,714 genes (28.05%) of the Spearman distribution fell into the 95th percentile of the corresponding random distribution. Thus, Pearson and Spearman correlation performed similarly and about 28% of genes showed correlation between SCNA and gene expression and therefore are potential cancer driver genes.
Genomic and transcriptomic correlation of SCNAs observed in primary colorectal and liver carcinomas with paired metastasis. (A) The density histogram shows the distribution of the Pearson and (B) Spearman correlation coefficients of gene expression and arrayCGH data from 33 tumor and metastasis tissues. The blue line represents the density distribution of the 1000-fold random permutation of the data and the red line represents the density distribution of the Pearson correlation coefficients.
Distinct regulatory pathways are enriched in organ site-specific metastasis
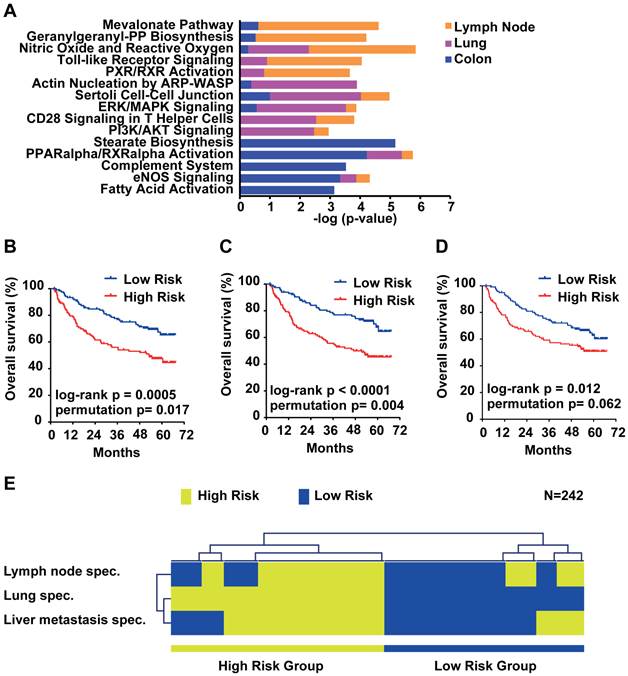
Due to the small overlap of metastasis genes of only 14 genes, we further analyzed the organ site-specific metastasis genes to determine their functional networks. We therefore focused on the organ site-specific genes after integration of gene expression profiling with somatic copy number alteration. Forty-nine (21.3%) of the 230 lung metastasis-specific genes showed significant correlation which corresponds to 52 probe sets (Supplementary Material: Table S4). We found that 66 (22.5%; 81 corresponding probe sets; Supplementary Material: Table S5) out of 293 lymph node-specific genes displayed correlation and 203 (21.3%; 256 corresponding probe sets; Supplementary Material: Table S6) genes of the 952 colorectal liver metastasis-specific genes showed significant correlation. We performed Ingenuity Pathway Analysis (IPA) of the respective corresponding probe sets and the associated fold change as input and found that the top 5 canonical pathways differed greatly. The top 2 pathways obtained from IPA for lymph node metastasis genes (Mevalonate Pathway and Geranylgeranyl-PP Biosynthesis) are involved in the HMG-CoA pathway. Lung metastasis genes on the other hand were enriched in cell-cell signaling and colon metastasis in stearate/fatty acid activation (Figure 5A). However, survival analysis of the respective gene signatures revealed that all three signatures are able to predict patient outcome in an independent HCC cohort (N=242; Figure 5B-D) [19]. Lastly, we sought to test if the three gene signatures assigned the same patients as good and poor outcome, respectively. We used clustering applying Euclidean distance and average linkage of the survival groups for each gene signature to analyze patient subgroups (Figure 5E). The results confirmed that all three signatures assigned HCC patients into similar low and high risk groups. Thus, although the lymph node, lung and colon metastasis-specific genes fall into distinct pathways, each is similarly associated with HCC patient outcome.
Survival risk prediction analysis and analysis of the function of the organ site-specific metastasis gene signatures. (A) Top 5 canonical pathways identified by Ingenuity Pathway Analysis of the lymph node, lung and colon metastasis specific gene signatures. Displayed is the -log(p-value) of the respective canonical pathways for the lymph node (orange), lung (purple) and colon (blue) signatures. (B) Kaplan-Meier survival curves showing the overall survival of the predicted high and low risk groups in a HCC cohort (N = 242) predicted by the lymph node, (C) lung, (D) colon and (E) overlapping genes. (F) Hierarchical clustering applying Euclidean distance and average linkage of the survival groups for each gene signature (N=242).
Discussion
The high heterogeneity of cancer manifests in the degree and site of metastasis. Intrahepatic metastasis is most common in liver cancer; however, extrahepatic metastases do occur in the lung lymph nodes and bone [20]. For multiple solid tumors, the liver is the most common site of metastasis, especially for colorectal cancer [21]. In particular, gastrointestinal tumors metastasize preferentially to the liver most likely due to dissemination of tumor cells through the portal vein. Approximately 20% of colorectal cancer patients present synchronous liver metastasis at diagnosis and an additional 20-30% of colorectal cancer patients will develop metachronous liver metastases after radical primary colorectal resection [22, 23]. Thus, it appears that metastases of different tumor entities occur at varying rates and are organ site-specific; however, the contribution of driver genes and the microenvironment at the distant site to the metastatic process are still poorly understood [24].
In this study, we analyzed gene expression profiles of a unique set of fresh-frozen resection specimens derived from paired primary tumors and metastases of liver and colorectal cancer patients. Although the patients of this study had metastatic disease their primary tumor and distant metastasis were resectable which allowed us to obtain fresh-frozen specimens. We used laser capture microdissection to enrich tumor cells and performed gene expression and SCNA profiling. We found that the gene expression profiles of primary tumors and metastases are similar, but organ site-specific metastasis genes differ greatly. These data suggest that metastasis capacity and organ-site specificity are early events in tumorigenesis, without the requirement of additional mutations beyond those that are needed for primary tumor formation [25].
Since cancer is a genetic disease, we also investigated the SCNA profiles of paired primary tumors and metastases. We found that the genomic profiles exhibit higher variability than the gene expression profiles, and that colorectal tumors had fewer genomic aberrations than liver carcinomas. The genomic changes between primary and metastatic tumors also were higher in liver tumors than colorectal tumors. It appears that the genomic instability is not reflected in the gene expression and most of the genetic changes may be passenger events for tumor cells. Interestingly, a recent study in renal-cell carcinoma found evidence for genomic and transcriptomic heterogeneity within one primary tumor and its metastatic lesions [26]. This study also shows intratumor genetic heterogeneity because different areas of a single tumor mass carry different mutated genes. One interpretation from these findings is that a majority of genetic changes associated with tumor cells are non-functional as they are passively selected during tumor evolution, which give rise to the appearance of inter- and intratumor heterogeneity. We suggest that integrative genomics through the integration of multiple levels of omics data, such as the approach used in this study, is powerful in identifying key molecular networks that functionally contribute to each tumor type and in minimizing our efforts to chase those passenger events.
Taken together, this study focused on the genomic and transcriptomic analysis of tumor cells at the primary tumor site and metastasis. Our results showed that while the SCNA differ between primary tumor and metastasis which appears to be mainly due to passenger effects the gene expression is highly similar. In addition, organ-specific changes that can be linked to HCC prognosis suggest a common prognostic propensity but different tumor biology which most likely requires specific treatment strategies.
Abbreviations
arrayCGH: array-based comparative genomic hybridization; FDR: False Discovery Rate; GIM: gastrointestinal metastasis; HCC: hepatocellular carcinoma; IPA: Ingenuity Pathway Analysis; LCI: Liver Cancer Institute; LCM: Laser capture microdissection; NM: non-metastatic liver cancers; PEM: extrahepatic metastasis; PEN: polyethylene naphthalate; SCNA: somatic copy number alteration.
Supplementary Material
Fig.S1, Tables S1-S6.
Acknowledgements
We thank the microarray core at the NCI-SAIC for performance of Affymetrix gene expression microarrays. Gene expression analyses were performed using BRB-ArrayTools developed by Dr. Richard Simon and BRB-ArrayTools Development Team.
Financial support
This work was supported in part by the Intramural Research Program of the Center for Cancer Research, the National Cancer Institute (Z01 BC 010313, Z01 BC 010877 and Z01 BC 010876). QHY was supported by the Grants of the National Key Project for Infectious Disease of China (2012ZX10002012-003), the State Key Basic Research Program of China (2009CB521701) and the National Natural Science Foundation of China (81071993).
Competing Interests
The authors have declared that no competing interest exists.
References
1. Chambers AF, Groom AC, MacDonald IC. Dissemination and growth of cancer cells in metastatic sites. Nature reviews Cancer. 2002;2:563-72
2. Steeg PS. Tumor metastasis: mechanistic insights and clinical challenges. Nature medicine. 2006;12:895-904
3. Nguyen DX, Massague J. Genetic determinants of cancer metastasis. Nat Rev Genet. 2007;8:341-52
4. Sethi N, Kang Y. Unravelling the complexity of metastasis - molecular understanding and targeted therapies. Nat Rev Cancer. 2011;11:735-48
5. Valastyan S, Weinberg RA. Tumor metastasis: molecular insights and evolving paradigms. Cell. 2011;147:275-92
6. Li Y, Tang Y, Ye L, Liu B, Liu K, Chen J. et al. Establishment of a hepatocellular carcinoma cell line with unique metastatic characteristics through in vivo selection and screening for metastasis-related genes through cDNA microarray. J Cancer Res Clin Oncol. 2003;129:43-51
7. Morikawa K, Walker SM, Jessup JM, Fidler IJ. In vivo selection of highly metastatic cells from surgical specimens of different primary human colon carcinomas implanted into nude mice. Cancer research. 1988;48:1943-8
8. Minn AJ, Kang Y, Serganova I, Gupta GP, Giri DD, Doubrovin M. et al. Distinct organ-specific metastatic potential of individual breast cancer cells and primary tumors. The Journal of clinical investigation. 2005;115:44-55
9. Francia G, Cruz-Munoz W, Man S, Xu P, Kerbel RS. Mouse models of advanced spontaneous metastasis for experimental therapeutics. Nat Rev Cancer. 2011;11:135-41
10. Weigelt B, Glas AM, Wessels LF, Witteveen AT, Peterse JL, van't Veer LJ. Gene expression profiles of primary breast tumors maintained in distant metastases. Proc Natl Acad Sci U S A. 2003;100:15901-5
11. Ramaswamy S, Ross KN, Lander ES, Golub TR. A molecular signature of metastasis in primary solid tumors. Nat Genet. 2003;33:49-54
12. Ye QH, Qin LX, Forgues M, He P, Kim JW, Peng AC. et al. Predicting hepatitis B virus-positive metastatic hepatocellular carcinomas using gene expression profiling and supervised machine learning. Nature medicine. 2003;9:416-23
13. Roessler S, Long EL, Budhu A, Chen Y, Zhao X, Ji J. et al. Integrative genomic identification of genes on 8p associated with hepatocellular carcinoma progression and patient survival. Gastroenterology. 2012;142:957-66
14. Venkatraman ES, Olshen AB. A faster circular binary segmentation algorithm for the analysis of array CGH data. Bioinformatics. 2007;23:657-63
15. Willenbrock H, Fridlyand J. A comparison study: applying segmentation to array CGH data for downstream analyses. Bioinformatics. 2005;21:4084-91
16. Budhu A, Forgues M, Ye QH, Jia HL, He P, Zanetti KA. et al. Prediction of venous metastases, recurrence, and prognosis in hepatocellular carcinoma based on a unique immune response signature of the liver microenvironment. Cancer cell. 2006;10:99-111
17. Beroukhim R, Mermel CH, Porter D, Wei G, Raychaudhuri S, Donovan J. et al. The landscape of somatic copy-number alteration across human cancers. Nature. 2010;463:899-905
18. Woo HG, Park ES, Lee JS, Lee YH, Ishikawa T, Kim YJ. et al. Identification of potential driver genes in human liver carcinoma by genomewide screening. Cancer research. 2009;69:4059-66
19. Roessler S, Jia HL, Budhu A, Forgues M, Ye QH, Lee JS. et al. A unique metastasis gene signature enables prediction of tumor relapse in early-stage hepatocellular carcinoma patients. Cancer research. 2010;70:10202-12
20. Poon RT, Fan ST, Lo CM, Liu CL, Wong J. Long-term survival and pattern of recurrence after resection of small hepatocellular carcinoma in patients with preserved liver function: implications for a strategy of salvage transplantation. Ann Surg. 2002;235:373-82
21. Nguyen DX, Bos PD, Massague J. Metastasis: from dissemination to organ-specific colonization. Nat Rev Cancer. 2009;9:274-84
22. Hayashi M, Inoue Y, Komeda K, Shimizu T, Asakuma M, Hirokawa F. et al. Clinicopathological analysis of recurrence patterns and prognostic factors for survival after hepatectomy for colorectal liver metastasis. BMC Surg. 2010;10:27
23. Millikan KW, Staren ED, Doolas A. Invasive therapy of metastatic colorectal cancer to the liver. Surg Clin North Am. 1997;77:27-48
24. Quail DF, Joyce JA. Microenvironmental regulation of tumor progression and metastasis. Nature medicine. 2013;19:1423-37
25. Hanahan D, Weinberg RA. Hallmarks of cancer: the next generation. Cell. 2011;144:646-74
26. Gerlinger M, Rowan AJ, Horswell S, Larkin J, Endesfelder D, Gronroos E. et al. Intratumor heterogeneity and branched evolution revealed by multiregion sequencing. The New England journal of medicine. 2012;366:883-92
Author contact
![]() Corresponding authors: Xin Wei Wang (xw3ugov) or Qing-Hai Ye (ye.qinghaish.cn).
Corresponding authors: Xin Wei Wang (xw3ugov) or Qing-Hai Ye (ye.qinghaish.cn).