Impact Factor ISSN: 1449-2288
- Issue 12; 2026
- Issue 11; 2026
- Issue 10; 2026
- Issue 9; 2026
- Issue 8; 2026
- Volume 22; 2026
- Past Issues
- Advance Articles
- Editorial Board
- Cover Images
- Index & Coverage
- Cover Suggestion
- Special Issues
Introduction
Materials and methods
Results
Discussion
Acknowledgements
Abbreviations
Supplementary Material
References

 Global reach, higher impact
Int J Biol Sci 2015; 11(1):109-121. doi:10.7150/ijbs.10276 This issue Cite
Research Paper
MiR-467a is Upregulated in Radiation-Induced Mouse Thymic Lymphomas and Regulates Apoptosis by Targeting Fas and Bax
Fu Gao1*, Song Chen2*, Mingjuan Sun3*, Ronald E.J. Mitchel4, Bailong Li1, Zhiyong Chu2, Jianming Cai1 ![]() , Cong Liu1
, Cong Liu1 ![]()
1. Department of Radiation Medicine, Faculty of Naval Medicine, Second Military Medical University, Shanghai 200433, PR China;
2. Department of Radiological Protection, Naval Medical Research Institute, Shanghai 200433, PR China;
3. Department of Biochemistry and Molecular Biology, Second Military Medical University, Shanghai 200433, PR China;
4. Radiological Protection Research and Instrumentation Branch, Atomic Energy of Canada Limited, Chalk River Laboratories, Chalk River, ON, K0J1J0, Canada.
* These authors contributed equally to this work.
Received 2014-8-5; Accepted 2014-11-18; Published 2015-1-1
Abstract

It has been reported dysregulation of certain microRNAs (miRNAs / miRs) is involved in tumorigenesis. However, the miRNAs associated with radiocarcinogenesis remain undefined. In this study, we validated the upregulation of miR-467a in radiation-induced mouse thymic lymphoma tissues. Then, we investigated whether miR-467a functions as an oncogenic miRNA in thymic lymphoma cells. For this purpose, we assessed the biological effect of miR-467a on thymic lymphoma cells. Using miRNA microarray, we found four miRNAs (miR-467a, miR-762, miR-455 and miR-714) were among the most upregulated (>4-fold) miRNAs in tumor tissues. Bioinformatics prediction suggests miR-467a may potentially regulate apoptosis pathway via targeting Fas and Bax. Consistently, in miR-467a-transfected cells, both proliferation and colony formation ability were significantly increased with decrease of apoptosis rate, while, in miR-467a-knockdown cells, proliferation was suppressed with increase of apoptosis rate, indicating that miR-467a may be involved in the regulation of apoptosis. Furthermore, miR-467a-knockdown resulted in smaller tumors and better prognosis in an in vivo tumor-transplanted model. To explain the mechanism of apoptosis suppression by miR-467a, we explore the expression of candidate target genes (Fas and Bax) in miR-467a-transfected relative to negative control transfected cells using flow cytometry and immunoblotting. Fas and Bax were commonly downregulated in miR-467a-transfected EL4 and NIH3T3 cells, and all of the genes harbored miR-467a target sequences in the 3'UTR of their mRNA. Fas and Bax were actually downregulated in radiation-induced thymic lymphoma tissues, and therefore both were identified as possible targets of miR-467a in thymic lymphoma. To ascertain whether downregulation of Fas and / or Bax is involved in apoptosis suppression by miR-467a, we transfected vectors expressing Fas and Bax into miR-467a-upregulated EL4 cells. Then we found that both Fas- and Bax-overexpression decreased cell viability with increase of apoptosis rate, indicating that downregulation of Fas and Bax may be at least partly responsible for apoptosis suppression by miR-467a. These data suggest that miR-467a may have oncogenic functions in radiation-induced thymic lymphoma cells and that its increased expression may confer a growth advantage on tumor cells via aberrant expression of Fas and Bax.
Keywords: radiocarcinogenesis, thymic lymphoma, miR-467a, Fas, Bax, apoptosis.
Introduction
Based on several epidemiological studies, a strong positive correlation has been observed between exposure to ionizing radiation (IR) and the development of cancer, but the mechanism for radiation-induced carcinogenesis is poorly understood [1,2]. Our previous studies found that ERK1/2, STAT3, SHP-2, TLR4 and reactive oxygen species (ROS) are also involved in γ-ray-induced thymic lymphomagenesis in BALB/c mice [3, 4, 5]. However, the role of miRNA in radiocarcinogenesis is still not well known.
MiRNA is a small non-coding RNAs, about 22 nucleotides in length, which regulates the expression of target genes at the post-transcriptional level [6]. It has been reported miRNAs play important roles in many physiological and developmental pathways in a multitude of different organisms [7, 8, 9, 10]. These biological processes include proliferation, apoptosis, development, differentiation, immune response and especially carcinogenesis [11, 12, 13, 14, 15, 16]. In cancer biology, studies have demonstrated that there is aberrant expression of miRNAs in several human tumors such as lung cancer, large cell lymphoma, Burkitt's lymphoma, and chronic lymphocytic leukemia [4, 17]. However, miRNAs which participate in radiocarcinogenesis are still poorly understood.
In this study, we found miRNA was aberrantly expressed in mouse radiation-induced thymic lymphoma (RTL). The overall profile of miRNA expression could clearly separate tumor tissues from normal tissues, identifying a number of differential miRNAs. Specifically, we found that miR-467a was one of the most upregulated miRNAs in RTL tissues relative to normal tissues, suggesting that alteration of the miR-467a expression level may have impact thymic cells. Therefore, we hypothesized that miR-467a may be a candidate oncogenic miRNA in RTL. In this study, to test this hypothesis, we attempted to clarify the function of miR-467a in the tumorigenesis and / or progression of RTL.
Materials and methods
Mice and treatment
Four-week-old male BALB/c mice and BALB/c nude mice (Chinese Academy of Sciences, Shanghai, China) were housed in a specific pathogen-free facility. All animal experiments were undertaken in accordance with the National Institute of Health “Guide for the Care and Use of Laboratory Animals” (NIH Publication No.85-23, National Academy Press, Washington, DC, revised 1996), with the approval of the Laboratory Animal Center of the Second Military Medical University (approval ID: #20081010). RTL model and 60Co irradiator for total body irradiation was used as described in our previous work [3, 4, 5, 18]. Briefly, un-anaesthetized mice were placed in well ventilated plastic boxes and exposed to the irradiator at a distance of 3-m from the source. Four weekly γ-ray irradiations (1.75-Gy per time) were delivered at the dose rate of 0.58 Gy/min. Then the mice were released and allowed free access to food and drinking water. Split irradiated mice (n = 400) and non-irradiated mice (n = 100) were checked daily and sacrificed 6 months after the last exposure. Subsequently, RTL tissues and parallel non-irradiated thymus tissues were harvested and set as paired samples randomly. All malignant tumors and tissues from different organs were diagnosed by pathology confirmation using post-mortem gross and histology examination. Electronic microscopy assay was performed on RTL tissues in collaboration with the Electronic Microscopy Laboratory of our university. In this study, 18 pairs were used for q-PCR assay, 3 pairs for miRNA array study, 9 pairs for western blots and correlation assays, and 9 or 15 pairs for FACS assays depending upon the requirement.
Cells culture and transfection
Synthetic double-stranded DNAs, which code miR-467a mimics, miR-NC mimics (miR-negative control mimics), miR-467a ASO (miR-467a antisense oligo) and miR-NC ASO (miR-negative control antisense oligo), were obtained from Genepharma company (Shanghai, China). Corresponding DNAs were assembled in miRNA expression plasmid pSilencerTM 2.1-U6 neo (Invitrogen) for the following experiments. Cloned mouse Fas or Bax cDNA was assembled in plasmid pcDNA3.1 (-) (Invitrogen) to derive expression vector pFas or pBax, respectively. EL4 (mouse thymic lymphoma cell line), NIH3T3 (mouse embryonic fibroblast cell line), and Molt4 (human T cell lymphoma cell line) were obtained from Institute of Biochemistry and Cell Biology, Chinese Academy of Sciences (Shanghai, China), primary radiation-induced thymic lymphoma (P-R/T/L) cells and matched primary normal thymic (P-NT) cells from aforementioned mice were used for transfection and fluorescence activated cell sorter (FACS) assays. Cells were cultured at 37℃ in a humidified atmosphere of 5% CO2 with DMEM or 1640 Medium (PAA Laboratories) containing 10% fetal bovine serum (PAA Laboratories). Additionally, the cells were exposed to different dose of irradiation (dose rate: 1 Gy/min) depending upon the requirement and subjected to apoptosis assay 24 h later. Cell culture and transfection procedures were described previously [19]. Briefly, cells were seeded at 6×10⁴ cells per well, then transfected with the aforementioned plasmids (1 μg) using Lipofectamine 2000 (Invitrogen) according to the manufacturer's instructions and subjected to further experiments 24 h later.
In vivo tumorigenesis assay
The BALB/c nude mice were inoculated in the left back by subcutaneously injection with 3 × 10⁶ treated P-R/T/L cells (n=12, each group) or EL4 cells (n=40, each group). Then tumor formation rate was assessed after 2 weeks and tumor size was measured weekly. For survival analysis, mice bearing EL4 tumor (n=12, each group) were monitored for 10 weeks.
Tumor cells for inoculation: transient miR-467a ASO- and miR-NC ASO-transfected P-R/T/L cells, stable miR-467a ASO- and miR-NC ASO-transfected EL4 cells.
RNA extraction and miRNA array
Tissues from normal thymus or RTL were homogenized in Trizol (Invitrogen) and RNA was isolated according to the manufacturer's instructions as described previously [4]. RNA from tumor tissues and normal tissues (each sample was derived from a single mouse) were subjected to Affymetrix microRNA Gene Chip array analysis. The miRNA labelling, hybridization assay and data analysis were performed by CapitalBio Company (Beijing, China) as described previously [20]. In comparison analysis, we applied a two class unpaired method in SAM to identify differentially expressed miRNAs.
Reverse transcription and quantitative real-time polymerase chain reaction (q-PCR)
cDNA was generated using the miScript Reverse Transcription Kit (Qiagen, No.218061) and miRNA expression was assayed by q-PCR using miScript SYBR Green PCR Kit system (Qiagen, No.218075) according to the manufacturer's instructions as described previously [4,5,21]. Briefly, the PCR was performed on a Rotorgene 3000 series PCR machine (Corbett Research) and analyzed with software of Rotorgene System. We quantified transcripts of GAPDH for normalizing the levels of interesting miRNAs. Sequences for the identification primers are available from the authors upon request and ΔΔCt method was used for data analysis. Three independent experiments were performed.
Bioinformatics prediction for miRNA
For pathway prediction, 4 miRNAs (miR-762, miR-714, miR-455 and miR-467a) were analyzed by an online pathway prediction system as reported previously [22]. Briefly, the genes regulated by the identified miRNAs were classified into cellular signaling pathways with MAS software (http://bioinfo.capitalbio.com/mas) to predict the target pathways. Target genes of miRNA-467a were predicted using the algorithms TargetScan (http://www.targetscan.org), miRanda (http://www.cbio.mskcc.org/mirnaviewer), PicTar (http://www.pictar.bio.nyu.edu), miRGen and miRBase (http://www.microrna.sanger.ac.uk) [23, 24]. To identify the genes commonly predicted by different softwares, prediction results were interpreted using our own bioinformatics methods in collaboration with Capitalbio Company.
FACS assays
For the detection of Fas and Bcl-2 protein levels, generally, prior to fluorescent antibody staining, all cells were incubated with CD16 / CD32 antibody at a concentration of 1µg/106cells/100µl for 15 minutes at 4℃ to block Fc receptors. Cells for intracellular staining were fixed & permeabilizated by Fixation & Permeabilization fixed kit (eBioscience) according to the manufacturer's instructions as described previously [4, 18]. Fluorescent antibodies Fas-PE, Bcl-2-FITC (eBioscience), and respective isotype controls were then added at a concentration of 1µg/106cells/100µl, and cells incubated for a further 30 minutes at 4°C. The cells were washed once with ice-cold PBS (pH 7.2) containing 0.5% BSA, and resuspended in 300µl PBS. For apoptosis assay, single cell suspensions were made and labeled with annexin V-FITC and propidium iodide (PI) provided by Bipec, following manufacturer's instructions as described previously [4,18]. Samples were examined by FACS and the data were analyzed using Cell-Quest software (Becton Dickinson).
Western blotting
Proteins were isolated by Protein Isolation Kit (Pierce) according to the manufacture's protocol. BCA protein Assay Reagent Kit (Pierce) was used to measure protein concentration. Samples containing equal amounts of protein were separated by 12% SDS-PAGE and transferred to nitrocellulose membranes (Schleicher & Schuell). Blots were probed with antibodies specific for murine Bax (Santa Cruz, sc-7480) and Fas (Abcam, ab82419) with rabbit anti-mouse IgG horseradish peroxidase conjugated antibodies as secondary antibodies (Cell Signaling Technology). Supersignal West Femto Maximum Sensitivity substrate (Pierce) was used for the chemiluminescent visualization of proteins.
Cell proliferation and colony formation assay
Cells were seeded in 96-well plate at 4×10³ cells / well and FACS cell counting assay was used to measure the cell number at 24 h, 48 h, and 72 h after transfection as described previously [4]. Colony formation assay was conducted as described previously [19]. Briefly, EL4 cells were fixed and stained with crystal violet and the numbers of colonies containing more than 50 cells were counted on day 11 after seeding. Three independent experiments were performed.
Luciferase reporter assay
Reporter plasmid pGL3-Report (Promega) carrying wild-type (WT) or mutant (MUT) miR-467a binding site in human/mouse Fas or Bax 3' untranslated region (3'UTR) were constructed by a similar method as described previously [4,19,21]. The 3'UTR oligonucleotides used are described in Supplementary Material. 24 h after transfection with miRNA-467a mimics vector or miRNA-NC mimics vector, a reporter plasmid containing the wt-3'UTR or mut-3'UTR and a plasmid expressing Renilla luciferase (pRL-CMV, Promega) were cotransfected into the cells. Firefly luciferase activity derived from pGL3-Report was normalized to Renilla luciferase activity from pRL-CMV. Normalized luciferase activity in wt-3'UTR-transfected cells was compared with that in mut-3'UTR-transfected cells.
Statistical analysis
Data were represented as mean ± SD. Experimental groups and relevant controls were compared using the Student's t-test. The differences in the tumor formation rate were tested using Chi-square test. The survival of mice was estimated by the Kaplan-Meier method, and the statistical significance of the difference was compared by the log-rank test. The relationship of Fas protein and miR-467a levels was examined by the nonparametric Spearman rank correlation coefficient analysis [21]. p<0.05 was considered a statistically significant difference.
Results
Induction and pathological confirmation of RTL
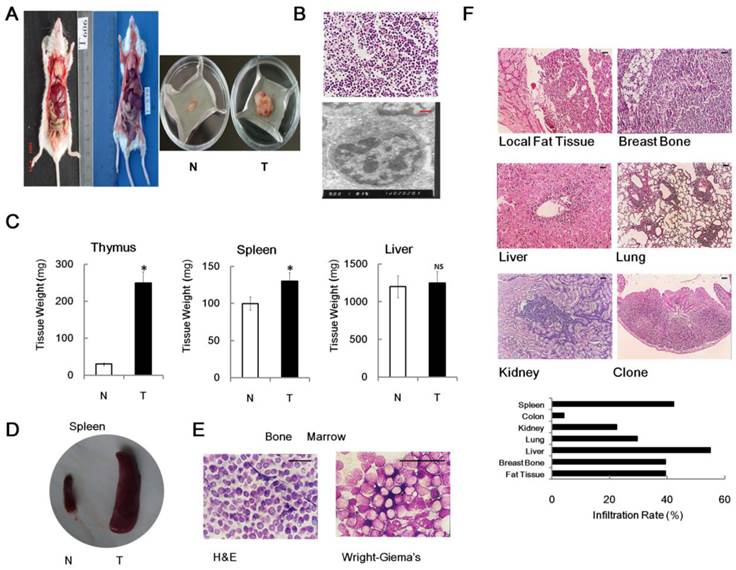
Previously, we found that 4×1.75 Gy γ-ray irradiations could induce thymic lymphoma in male BALB/c mice 6 month after last exposure [3,4,5]. In our experimental conditions, no unexposed mouse developed an enlarged thymus at 7-month-old. Conversely, significantly enlarged thymus and spleen were observed in about 40% of the same strain, sex and age irradiated mice relative to non-irradiated controls (Figure 1A, 1C and 1D). The pathological assays confirmed that, in irradiated group, 75% of the enlarged thymus was identified as thymic lymphoma or acute T cell lymphocytic leukemia / lymphoma (ALL) (Figure 1B), while the remaining 25% were not tumor. Oncopathology showed that the tumor incidence (6 month after last irradiation) was 30.5% (122/400) in irradiated group, which was significantly upregulated in comparison with non-irradiated group (0.0%, 0/100). To characterize RTL in detail, we demonstrated the tumor had immature T cell features, such as big nucleolus and small cytosol, using electron microscopy (Figure 1B). We also performed histopathological assays on bone marrow from RTL mice. As expected, hematoxylin and eosin (H & E) staining and Wright-Giemsa's staining also showed some bone marrow contained immature lymphocytic cells (Figure 1E). Furthermore, the metastasis properties of RTL were measured by histological procedures. Our result showed that metastasis was occurred in nearly all of the mice bearing tumor and RTL cells could infiltrate into several organs such as liver, lung, kidney, spleen, colon and breastbone (Figure 1F), indicating that RTL exhibits a highly invasive phenotype. These data demonstrated that the split irradiation protocol can induce mouse thymic lymphoma.
Mouse RTL model. (A) The graph shows two mice developed typical RTLs at 6 month after irradiation (left panel). Typical graph of RTL tissue (T) versus matched normal non-irradiated thymus tissue (N) (right panel). (B) Histopathological images of RTL tissue slides using H & E staining (upper panel) and electron microscopy (lower panel). (C) Weight analysis of different organs (n = 20, each group) from RTL mice (T) versus matched normal mice (N). The data represent mean±SD. (D) Representative graph of enlarged spleen from RTL mice (T) versus matched normal mice (N). (E) Histopathological images of bone marrow from RTL mice using H & E and Wright-Giema's staining. (F) Representative metastasis histopathological images of RTL (H & E staining). The infiltration rates of RTL to each organ are given (n = 71 mice). Black Bar: 50 μm; Red Bar: 1 μm. * p < 0.05; NS, no significant.
In vivo tumorigenesis of RTL
To further study biology of primary RTL and to set up a potential in vivo model, we performed transplantation experiments, indicating that no nude mice injected with P-NT cells developed tumor. However, about 66.7% (8/12) of nude mice inoculated with P-R/T/L cells developed macroscopic tumors 2 weeks later (Supplementary Material: Figure S1A). The transplanted RTL cells also showed a malignant metastasis phenotype with invading skin, muscle, liver, spleen, lung, kidney and bone marrow (Figure S1B). We also observed one case that the transplanted RTL cells invaded the solar plexus (Figure S1B). Electron microscopy demonstrated that transplanted RTL also showed immature T cell features (Figure S1C). Therefore, this procedure can be used as RTL tumorigenesis in vivo model.
MiRNA expression in RTL tissues
To determine whether and how the expression profile of miRNAs changed in radiocarcinogenesis, we used Affymetrix microRNA Gene Chip platform. The hierarchical clustering, based on all mouse miRNAs spotted on the chip, generated a tree with a clear division of samples into two main groups, representing normal or tumor tissues, respectively. As shown from the cluster analysis, the overall miRNA expression could clearly separate normal thymus tissues from RTL tissues (Figure 2A).
Identification of miRNAs associated with RTL. (A) Tree generated from the hierarchical cluster analysis shows all differentially expressed mouse miRNAs in RTL tissues (T) versus normal tissues (N) using miRNA array (n=3 mice, each group). Yellow bar: upregulated miRNAs; Blue bar: downregulated miRNAs. (B) List of selected upregulated and downregulated miRNAs in RTL using SAM assays. (C) Q-PCR was performed to validate selected differentially expressed miRNAs using 18 paired samples of RTL tissue (T) and matched normal tissues (N). All data represent means ± SD. The relative expression levels of selected miRNAs are normalized by expression of the internal control, GAPDH. * p < 0.05. NS, no significant.
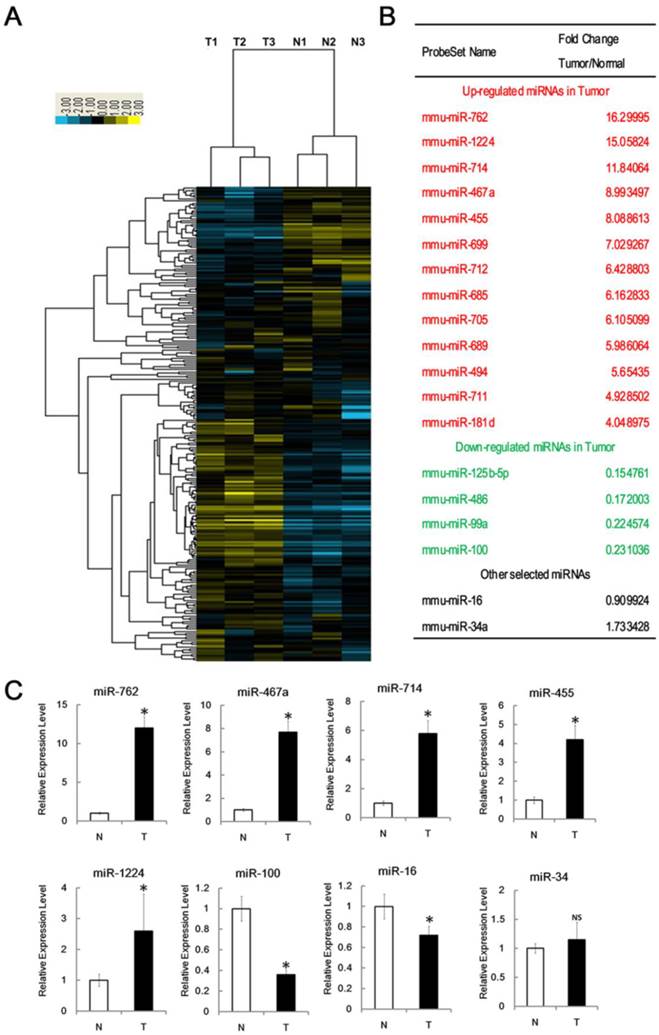
Using Significant Analysis of Microarray software (SAM), we identified 17 miRNAs that were differentially expressed in RTL relative to normal thymus (fold changes > 4); 13 of these were significantly upregulated and the other 4 were downregulated (Figure 2B). The most 4 upregulated miRNAs were miR-762, miR-1224, miR-467a and miR-714; whereas the most 3 downregulated miRNAs were miR-125b, miR-99a and miR-100. This data suggest that miRNA expression is aberrant in RTLs and these 17 miRNAs may associate with RTL.
To confirm the microarray data, we performed q-PCR assay for selected miRNAs. Consistent with the microarray data, miR-762, miR-1224, miR-467a, miR-714, and miR-455 levels were significantly upregulated in RTL, whereas miR-100 level was downregulated. Unlike the array data, miR-16 level was slightly down-regulated. We found no significant expression difference of miR-34a, which had been studied previously [25] (Figure 2C).
We examined the data for potential miRNA markers in RTL and found most of miRNAs aberrantly expressed have been reported in other types of tumors. However, miR-762, miR-467a, miR-714 and miR-455 expression was distinctively upregulated in RTLs. Furthermore, it is noteworthy that the functions of these miRNAs in radiocarcinogensis are still not well known.
Furthermore, we choose miR-467a to investigate its kinetics of induction in thymus tissues during the course of 4×1.75 Gy split irradiations. As shown in Supplementary Material: Figure S3A and B, miR-467a was induced in a time and dose dependent manner, and the threshold of the induction was at least 5 Gy (cumulative dose).
Bioinformatics prediction of identified miRNAs
To further explore the roles of miR-762, miR-467a, miR-455 and miR-714 in pathogenesis of RTL, we first performed a bioinformatics prediction approach to identify the functional pathways that may be impacted by these 4 miRNAs. Prediction indicated that these 4 miRNAs may potentially affect several biological processes, and apoptosis signal may be the most probable one, for it had the lowest p-value (Supplementary Material: Figure S2) and 3 miRNAs (miR-467a, miR-762 and miR-455) were involved (Supplementary Material: Table S1). Since dysregulation of apoptosis signal is one of the important mechanisms in carcinogenesis, we hypothesize that miR-762, miR-467a and miR-455 may play some roles in RTL via apoptosis pathway. Moreover, 11 genes relative to apoptosis were identified as the high-scoring candidate targets of miR-467a (Supplementary Material: Table S1). As most of these genes code pro-apoptosis proteins (such as Fas and Bax), we hypothesize that miR-467a may be a predominant anti-apoptosis regulator in RTL.
Pro-proliferation and anti-apoptosis effects of miR-467a in vitro
To determine the validity of miR-467a mimics and ASO vectors, we first performed plasmid transfection assay on P-NT, EL4, and P-R/T/L cells. For overexpression experiments, miR-467a mimics or miR-NC mimics vector was transfected; for knockdown experiments, miR-467a ASO or miR-NC ASO vector was used. Figure 3A showed that, compared with P-NT, miR-467a baseline level was higher in EL4 and P-R/T/L. Since EL4 and P-R/T/L cells have a more malignant phenotype, we hypothesize that miR-467a upregulation may have oncogenic effects. Additionally, the efficiency of miR-467a ectopic expression was confirmed using q-PCR, which showed a 1.9-fold, 3.2-fold and 11.7-fold increase of expression in P-R/T/L, EL4 and P-NT cells compared with the controls, respectively. And the knockdown validity of miR-467a ASO was also assessed about 50% (Figure 3A).
Pro-proliferation and anti-apoptosis effects of miR-467a on thymic lymphoma cells. Cells were transfected with miR-467a mimics, miR-NC mimics, miR-467a ASO and miR-NC ASO vector, respectively. (A) Relative expression levels of miR-467a in P-NT, EL4 and P-R/T/L cells were analyzed by q-PCR at 48 h after transfection using untreated aforementioned cells as control. (B) MiR-467a mimics enhanced, while miR-467a ASO suppressed EL4 cells proliferation at indicated time point after transfection using FACS cell counting assay. (C) The graphs show the efficiency of EL4 cells colony formation using crystal violet staining (upper panel). The relative colony formation rate (miR-467a mimics / miR-NC mimics) is shown (lower panel). (D) MiR-467a mimics reduced, while miR-467a ASO increased the apoptosis rate of EL4 at 24 h after various dose of irradiation using FACS assay. (E) FACS assay shows miR-467a ASO increased the apoptosis rate of P-R/T/L at 48 h after transfection. These data are shown as mean±SD of triple determinations. * p < 0.05.
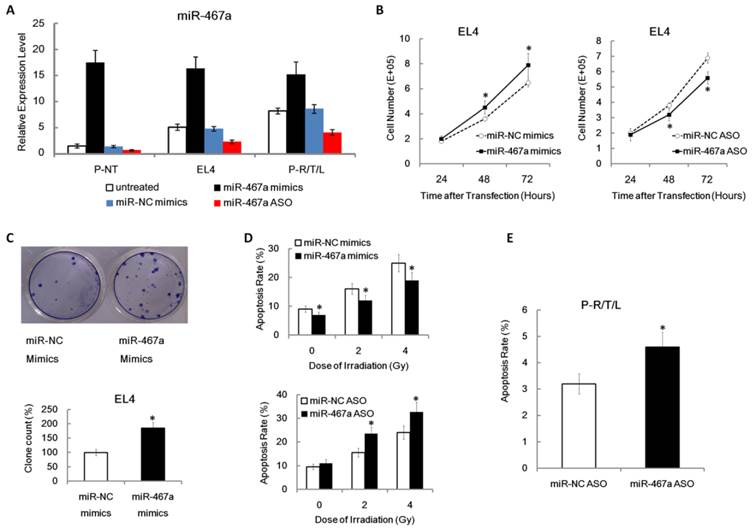
To investigate the effect of miR-467a on tumor cell proliferation, using FACS assay, we found that miR-467a upregulation enhanced growth, while miR-467a downregulation suppressed growth, which occurred in a time dependent manner in EL4 (Figure 3B). To further confirm the biological function of miR-467a, we found miR-467a also increased the ability of EL4 to form colonies (Figure 3C). This suggests that miR-467a may have oncogenic functions in thymic lymphoma cells.
To determine whether growth inhibition by miR-467a-knockdown was associated with apoptosis, apoptosis rates in EL4 cells transfected with were miR-467a mimics or ASO determined at 24 h after various dose of irradiation. We found that miR-467a upregulation reduced radiation-induced apoptosis rate, while miR-467a downregulation increased apoptosis rate, which occurred in a dose-dependent manner in EL4 (Figure 3D). More importantly, apoptosis rate was increased in miR-467a ASO-transfected P-R/T/L cells (Figure 3E). These results suggest that the growth suppression by miR-467a-knockdown may be dependent of apoptosis.
MiR-467a-knockdown suppresses thymic lymphoma growth in vivo
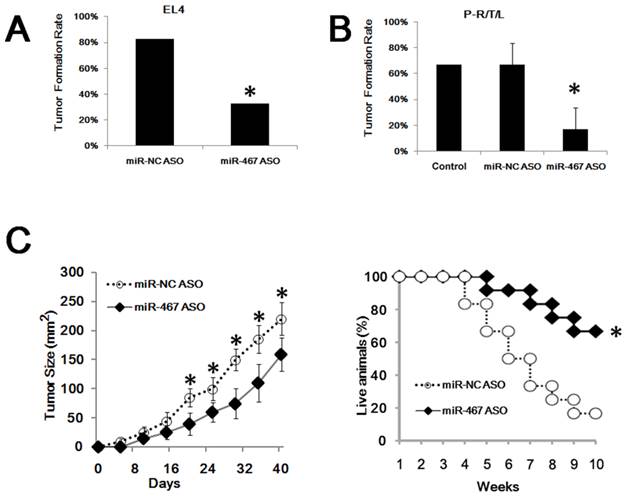
To confirm the in vivo effects of miR-467a on the growth of thymic lymphoma, tumor cells transfected with miR-467a ASO or miR-NC ASO were inoculated into the nude mice, respectively. As shown in Figure 4A, only 32.5% (13/40) of mice in the EL4 / miR-467a ASO group formed tumors, compared with 82.5% (33/40) of mice in the control group. Furthermore, miR-467a-knockdown also decreased the formation of RTL transplanted in nude mice. About 50% - 83.3% (3/6, 5/6) of mice in the P-R/T/L / miR-NC ASO group developed macroscopic tumors, similarly to the P-R/T/L group (8/12). However, only 0% - 33.3% (0/6, 2/6) of mice in the P-R/T/L / miR-467a ASO group developed tumors (Figure 4B). More importantly, miR-467a ASO-transfected EL4 cells formed smaller tumors and the mortality in EL4 / miR-467a ASO group was decreased in comparison with the controls (Figure 4C), suggesting miR-467a-knockdown could suppress tumor formation and growth in vivo.
MiR-467a-kockdown suppresses thymic lymphoma growth in vivo. P-R/T/L cells were transiently transfected with miR-467a ASO or miR-NC ASO vector, while EL4 cells were stably transfected with the aforementioned vectors. Then these tumor cells were used in transplant experiments. (A) Tumor formation rate of treated EL4 cells. (B) Tumor formation rate of treated P-R/T/L cells, using untreated P-R/T/L cells as control. The data represent mean±SD of duple determinations. (C) In vivo anti-tumor effects of miR-467a ASO vector on EL4 cells. Tumor volumes were calculated in 40 days after inoculation. Left panel shows tumor growth curves. The data represent mean±SD of quadruplicate determinations. Right panel shows overall survival curves of mice bearing EL4 tumor according to miR-467a level (n=12, each group). * p < 0.05.
MiR-467a regulates the expression of Fas and Bax in thymic lymphoma cells
To investigate the mechanism of apoptosis inhibition by miR-467a, we first predicted the target genes of miR-467a using five programs (PicTar, TargetScan, miRBase ,miRanda, and miRGen) [7]. As shown in Figure 5A, two pro-apoptosis genes, Fas and Bax, whose 3'UTR of mRNAs possessed the elements partially complementary to miR-467a, were identified as possible high-scoring candidate targets of miR-467a. In fact, these two genes were downregulated at the protein levels in miR-467a-transfected NIH3T3 and EL4 cells (Figure 5C and 5D), suggesting that miR-467a can regulate the expression levels of Fas and Bax in thymic lymphoma cells.
MiR-467a targets Fas and Bax in thymic lymphoma cells. (A) Predicted wild type (WT) and mutant (MUT) miR-467a binding sites at mouse Fas and Bax mRNA 3'UTR. (B) Interaction of miR-467a with the 3'UTR of Fas and Bax. At 48 h after transfection with miR-467a mimics or miR-NC mimics vector, a reporter plasmid containing Fas or Bax wt-3'UTR or mut-3'UTR and a plasmid expressing renilla luciferase were cotransfected into EL4 cells. Luciferase activities were measured at 48 h after transfection with the plasmids, and normalized data are shown. The data represent mean ± SD of triple determinations. (C) EL or NIH3T3 cells were transfected with miR-467a mimics or miR-NC mimics vector. 24 h later, these cells were exposed to 7-Gy irradiation for 5 min. 24 h after exposure, the protein levels of endogenous Fas and Bax were determined. FACS assay shows that exogenous miR-467a downregulates Fas protein level in EL4 and NIH3T3 cells. (D) Immunoblotting shows that exogenous miR-467a downregulates Fas and Bax protein level in these cells. * p < 0.05. NS, no significant.
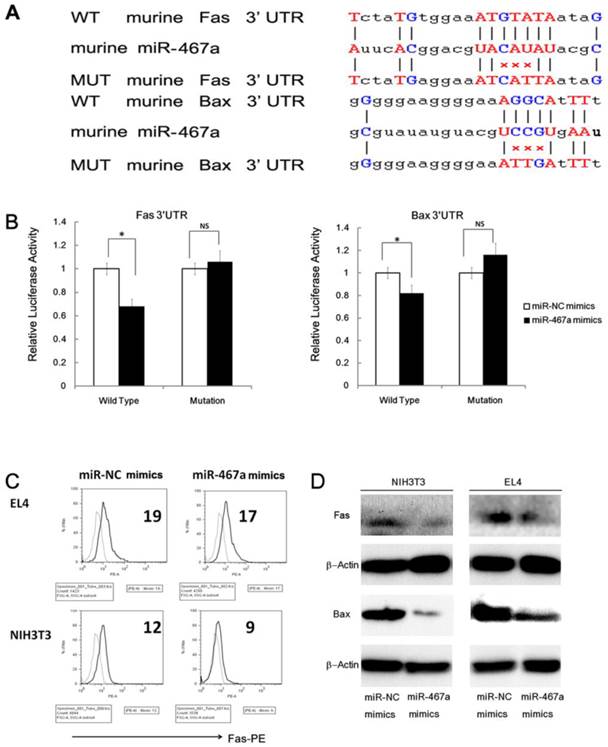
However, the relationship between miR-467a and two candidates, Fas and Bax, has not been reported. Therefore we examined whether miR-467a can interact directly with the 3'UTR of Fas and/or Bax. The miR-467a binding sequence at the 3'UTR of mouse Fas mRNA (WT Fas 3'UTR) or its mutant (MUT Fas 3'UTR) was cloned downstream of the firefly luciferase reporter gene, and then cotransfected with miR-467a or miR-NC vector into EL4 cells. When miR-467a was cotransfected, the relative luciferase activity of the reporter containing WT Fas 3'UTR was significantly suppressed in comparison with that of the reporter containing MUT Fas 3'UTR (Figure 5B). In contrast, the luciferase activity of the reporter containing WT Fas 3'UTR was unaffected by simultaneous transfection with miR-NC (Figure 5B). Similar results were obtained using luciferase reporter plasmids containing the miR-467a binding sequence at the 3'UTR of the Bax mRNA or its mutant (Figure 5B). These results indicate that miR-467a is able to regulate the expression of Fas and Bax by directly binding to their 3'UTRs. Furthermore, we also validated the regulation effect in human cell line Molt4 (Supplementary Material: Figure S4).
Exogenous expression of Fas and Bax partially rescues the anti-apoptosis effect of miR-467a
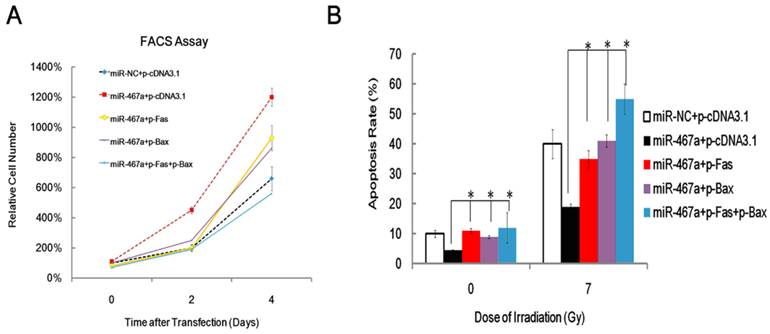
To assess the contribution of Fas and Bax to the apoptosis suppression by miR-467a, we performed rescue experiments via transfecting Fas and / or Bax plasmid into miR-467a-transfected EL4 cells and measured the resulting cell viabilities by FACS assay at day 0, 2 and 4. As shown in Figure 6A, Exogenous Fas and Bax significantly attenuated the pro-proliferation effect of miR-467a in a time-dependent manner. Furthermore, exogenous Fas and Bax increased apoptosis rate of miR-467a-transfected EL4 cells, similarly to the results obtained at 24 h after 7-Gy irradiation (Figure 6B). Taken together, these findings suggest that, although other possible mediators may exist, downregulation of Fas and Bax may be at least partly involved in the apoptosis suppression induced by miR-467a.
Exogenous Fas and Bax partly rescued the anti-apoptosis effect of miR-467a. At 48 h after transfection with miR-467a mimics or miR-NC mimics vector, plasmids pFas and / or pBax were transfected into EL4 cells. (A) Cell viability was measured on day 0, 2, and 4 after last transfection. FACS assay shows that exogenous Fas and Bax suppresses proliferation of miR-467a-upregulated EL4 cells. (B) At 24 h after last transfection, these cells were subjected to 7-Gy irradiation and apoptosis rate was measured 24 h later, using non-irradiated cells (0-Gy) as control. FACS assay shows exogenous Fas and Bax enhanced the apoptosis rate of miR-467a-upregulated EL4 cells. All data represent mean±SD of triple determinations.* P < 0.05.
Fas and Bax are significantly downregulated in RTL tissues
Since miR-467a was significantly upregulated in RTL, its possible targets were expected to be downregulated. To clarify this issue, we analyzed the expression levels of Fas and Bax protein in the cells from RTL tissues and matched non-irradiated normal thymus tissues using FACS and immunoblotting, respectively. The expression levels of Fas and Bax protein were actually downregulated in RTL tissues relative to normal tissues (Figure 7A). Furthermore, we found an inverse correlation between Fas protein and miR-467a levels among 9 paired samples using FACS and q-PCR (Figure 7B). And the inverse correlation between Fas and miR-467a was stronger in tumor samples (R = -0.49) than in normal controls (R = -0.31) (Figure 7C).
Fas and Bax are downregulated in RTL. (A) Representative FACS assay of Fas positive (M2) cells from 5 paired RTL tissues (T) and normal thymus tissues (N). The black curves are isotype control, while M2 positive cell percentages are shown below each sample (upper panel). Representative immunoblotting analysis of Bax protein expression in 3 paired samples (lower panel). (B) Fas protein and miR-467a level were inversely correlated in 9 paired tumor tissues (T) and normal tissues (N). MiR-467a level was measured by q-PCR. Fas protein level is indicated as mean fluorescence intensity (MFI) detected by FACS assay. The graphs show the normalized expression levels of Fas protein and miR-467a relative to the median of normal thymus tissues (upper and middle panel). All data represent mean±SD of triple determinations. Each bar indicates the expression level in an individual case. The y axis represents the fold change. The overall inverse correlation curve between Fas protein and miR-467a level (lower panel). (C) The inverse correlation curves between Fas and miR-467a expression levels in tumor tissues (T) and normal tissues (N). R represents Spearman rank correlation coefficient. (D) Representative FACS assay of Bcl-2 positive (M2) cell and apoptosis status in tumor tissues (T) and normal tissues (N). (E) Left panel shows apoptosis rate of the cells from tumor tissues (T) and normal tissues (N) (n=9, each group) determined by FACS assay. Middle and right panels show MFI of Fas-PE and Bcl-2-FITC in the cells from indicated tissues (n=15, each group) detected by FACS assay. These data represent mean±SD. * p < 0.05.
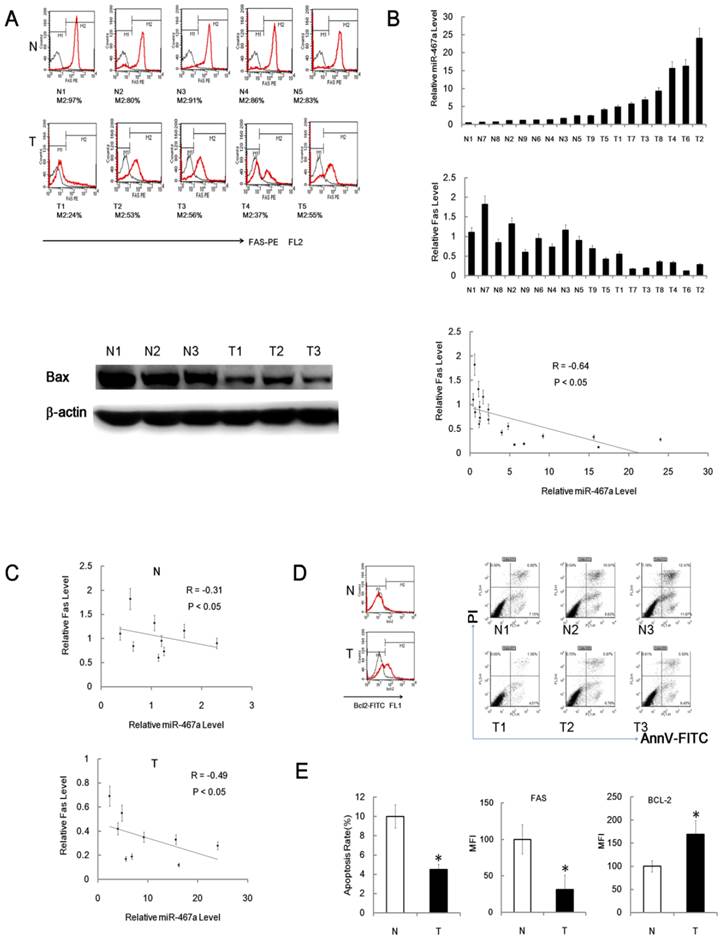
Our data also showed that the level of anti-apoptotic Bcl-2 protein was significantly upregulated in RTL tissues relative to normal tissues (Figure 7D and 7E). Together with downregulation of Fas and upregulation of Bcl-2, the apoptosis rates were significantly reduced in P-R/T/L cells relative to the controls using FACS (Figure 7D and 7E). Consistent with the bioinformatics predictions, these data suggests that Fas and Bax may be the targets of miR-467a in RTL and an aberrant apoptosis signal may regulate mouse RTL oncogensis.
Discussion
Radiation is capable of inducing diverse types of tumors in many organs and species, but the exact mechanism of carcinogenesis is not known [26]. Nowadays, several studies have shown the dysregulation of miRNAs in various types of cancers [27]. However, except for miR-21 [4,5], little has been known about the miRNAs participating in RTL oncogensis. In this study, using a mouse RTL model, we found that some miRNAs were aberrantly expressed in tumor tissues by miRNA array and the most upregulated 4 miRNAs were miR-762, miR-467a, miR-455 and miR-714. Bioinformatics prediction indicated that 3 of these 4 miRNAs (miR-467a, miR-762 and miR-455) may affect apoptosis pathway. Moreover, there have been no data to suggest the function and targets of miR-467a in RTL.
In this study, our data showed miR-467a can be dramaticlly induced in the thymus tissues during the early phase after split irradiation. However, in the cell model, concentration gradient H2O2 failed to induce miR-467a (Supplementary Material: Figure S3C), suggesting other stimuli, like oxidative damage, is not an inducer of miR-467a. Taken together, our data partially demonstrate the induction of miR-467a is radiation specificity.
Next, we showed that ectopic expression of miR-467a enhanced the proliferation of thymic lymphoma cells and their ability to form colonies, while knockdown of miR-467a suppressed the proliferation. Furthermore, the growth suppression occurred through an increase in the rate of radiation-induced apoptosis, suggesting that miR-467a may enhance cell proliferation by regulating apoptosis. On the other hand, miR-467a-knockdown could suppress tumor cell growth in vivo and decrease the mortality of mice bearing tumor, indicating that miR-467a may be a novel potential therapeutic target. To our knowledge, this is the first report to describe the oncogenic role of miR-467a in RTL. The mechanism responsible for miR-467a upregulation in RTL is still unknown. Some factors, such as genomic copy number alteration, interaction of transcriptional activators with the miR-467a promoter and post-transcriptional regulation may be responsible for the upregulation of miR-467a. Further studies will be needed to clarify these issues.
Previously, we have reported miR-21 has oncogenic functions in RTL via downregulating of tumor-suppressive gene Big-h3 [4]. However, miR-467a functions via a different mechanism. Therefore, investigating the roles of differential miRNAs and identifying their targets contribute to understand the oncogenic mechanism of RTL. As is known to all, two pro-apoptotic genes (Fas and Bax) are reportedly crucial regulators in apoptosis pathway. In this study, we showed miR-467a reduced the expression level of Fas and Bax protein, suggesting that miR-467a may be a novel and strong anti-apoptosis molecule. The activity of luciferase reporter assay suggest that miR-467a directly targets the 3'UTR of Fas and Bax mRNA respectively. In this study, we showed that both Fas and Bax were downregulated in RTL tissues, while Bcl-2 was upregulated. Furthermore, ectopic expression of Fas and / or Bax induced growth suppression with upregulation of apoptosis rate in thymic lymphoma cells. Together with aforementioned data, our results suggest that Fas and Bax contribute to the proliferation of thymic lymphoma cells by regulating apoptosis. Interestingly, growth suppression with upregulation of apoptosis rate was also observed in miR-467a-knockdown cells, suggesting that downregulation of Fas and Bax may be involved in the miR-467a-induced apoptosis suppression. Thus, our data suggest that miR-467a reduces the expression of Fas and Bax in thymic lymphoma cells, leading to enhanced growth through inhibition of apoptosis. Therefore, we can hypothesize that enhanced expression of miR-467a results in decreased expression of Fas and Bax, and confers a growth advantage on RTL cells.
We have found that miR-467a was upregulated in a substantial proportion of mouse RTLs, promoted proliferation and suppressed apoptosis of thymic lymphoma cells, potentially by targeting Fas and Bax. Furthermore, miR-467a improved the ability of thymic lymphoma cells to form colonies. On the contrary, miR-467a-knockdown resulted in smaller tumors and better prognosis in a tumor-transplanted model. Therefore, we propose that miR-467a may have an oncogenic role in RTL cells, and that its increased expression may confer a growth advantage on tumor cells at least partly via aberrant expression of Fas and Bax, two of the target genes of miR-467a. Future studies examining the mechanism of miR-467a upregulation and its other targets will be required in order to clarify the significance of miR-467a-dependent apoptosis regulation in RTL cells.
In summary, this work provides a complete miRNA expression profile of mouse RTL, some novel experimental evidences for the mechanism of radiocarcinogenesis and a novel potential therapeutic target for RTL.
Acknowledgements
Special thanks to Dr. Xuetao Cao, Dr. Yushi Yao and Dr. Sheng Xu from National Key Laboratory of Medical Immunology and Dr. Pu You from the department of Cell Biology of our university for providing additional help. We wish to thank Dr. Min Li from the department of Hygienics of our university for doing the q-PCR assays to detect many miRNAs. This work was supported by the grants from National Natural Science Foundation of China (No. 31100605).
Abbreviations
ALL: acute T cell lymphocytic leukemia / lymphoma;
ASO: antisense oligo, H & E: hematoxylin and eosin;
IR: ionizing radiation;
FACS: fluorescence activated cell sorter;
miRNA/miR: microRNA;
miR-NC: miR-negative control;
P-NT: primary normal thymic cells;
P-R/T/L: primary radiation-induced thymic lymphoma cells;
q-PCR: quantitative real-time polymerase chain reaction;
SAM: significant analysis of microarray software;
ROS: reactive oxygen species;
RTL: radiation-induced thymic lymphoma;
UTR: untranslated region.
Supplementary Material
Table S1, Figures S1 - S4.
Competing Interests
The authors have declared that no competing interest exists.
References
1. Williams D. Radiation carcinogenesis: lessons from Chernobyl. Oncogene. 2008;27:S9-18
2. Huang L, Snyder AR, Morgan WF. Radiation-induced genomic instability and its implications for radiation carcinogenesis. Oncogene. 2003;22:5848-5854
3. Fu Z, Huang D, Cai J. et al. Expression changes of ERK1/2, STAT3 and SHP-2 in bone marrow cells from gamma-ray induced leukemia mice. J Radiat Res (Tokyo). 2006;47:121-130
4. Liu C, Li B, Cheng Y. et al. MiR-21 plays an important role in radiation induced carcinogenesis in BALB/c mice by directly targeting the tumor suppressor gene Big-h3. Int J Biol Sci. 2011;7:347-363
5. Liu C, Gao F, Li B. et al. TLR4 knockout protects mice from radiation-induced thymic lymphoma by downregulation of IL6 and miR-21. Leukemia. 2011;25:1516-1519
6. Engels BM, Hutvagner G. Principles and effects of microRNA-mediated post-transcriptional gene regulation. Oncogene. 2006;25:6163-6169
7. Bartel DP. MicroRNAs: target recognition and regulatory functions. Cell. 2009;136:215-233
8. Lanford RE, Hildebrandt-Eriksen ES, Petri A. et al. Therapeutic silencing of microRNA-122 in primates with chronic hepatitis C virus infection. Science. 2010;327:198-201
9. Ambros V. The functions of animal microRNAs. Nature. 2004;431:350-355
10. Melton C, Judson RL, Blelloch R. Opposing microRNA families regulate self-renewal in mouse embryonic stem cells. Nature. 2010;463:621-626
11. Mayr C, Hemann MT, Bartel DP. Disrupting the pairing between let-7 and Hmga2 enhances oncogenic transformation. Science. 2007;315:1576-1579
12. Giraldez AJ, Cinalli RM, Glasner ME. et al. MicroRNAs regulate brain morphogenesis in zebrafish. Science. 2005;308:833-838
13. Chen CZ, Li L, Lodish HF. et al. MicroRNAs modulate hematopoietic lineage differentiation. Science. 2004;303:83-86
14. Hornstein E, Mansfield JH, Yekta S. et al. The microRNA miR-196 acts upstream of Hoxb8 and Shh in limb development. Nature. 2005;438:671-674
15. Marson A, Levine SS, Cole MF. et al. Connecting microRNA genes to the core transcriptional regulatory circuitry of embryonic stem cells. Cell. 2008;134:521-533
16. Patel N, Tahara SM, Malik P. et al. Involvement of miR-30c and miR-301a in immediate induction of plasminogen activator inhibitor-1 by placental growth factor in human pulmonary endothelial cells. Biochem J. 2011;434:473-482
17. Calin GA, Croce CM. MicroRNA signatures in human cancers. Nat Rev Cancer. 2006;6:857-866
18. Liu C, Lin J, Zhao L. et al. Gamma-ray irradiation impairs dendritic cell migration to CCL19 by down-regulation of CCR7 and induction of cell apoptosis. Int J Biol Sci. 2011;7:168-179
19. Hao J, Zhang S, Zhou Y. et al. MicroRNA 483-3p suppresses the expression of DPC4/Smad4 in pancreatic cancer. FEBS Lett. 2011;585:207-213
20. Guo Y, Chen Z, Zhang L. et al. Distinctive microRNA profiles relating to patient survival in esophageal squamous cell carcinoma. Cancer Res. 2008;68:26-33
21. Zhang S, Hao J, Xie F. et al. Downregulation of miR-132 by promoter methylation contributes to pancreatic cancer development. Carcinogenesis. 2011;32:1183-1189
22. Wang Y, Zhang H, Chen Y. et al. LSD1 is a subunit of the NuRD complex and targets the metastasis programs in breast cancer. Cell. 2009;138:660-62
23. Krek A, Grun D, Poy MN. et al. Combinatorial microRNA target predictions. Nat Genet. 2005;37:495-500
24. Bartel DP. MicroRNAs: target recognition and regulatory functions. Cell. 2009;136:215-233
25. Liu C, Zhou C, Gao F. et al. MiR-34a in age and tissue related radio-sensitivity and serum miR-34a as a novel indicator of radiation injury. Int J Biol Sci. 2011;7:221-233
26. Kominami R, Niwa O. Radiation carcinogenesis in mouse thymic lymphomas. Cancer Sci. 2006;97:575-581
27. Chaudhry MA, Sachdeva H, Omaruddin RA. Radiation-induced micro-RNA modulation in glioblastoma cells differing in DNA-repair pathways. DNA Cell Biol. 2010;29:553-561
Author contact
![]() Corresponding authors: Jianming Cai & Cong Liu. Address: Department of Radiation Medicine, Second Military Medical University; 800, Xiangyin Road 200433, Shanghai; P.R. China Fax: +86-21-81871149. E-mail: caijianming882003com, victorliu20102020com.
Corresponding authors: Jianming Cai & Cong Liu. Address: Department of Radiation Medicine, Second Military Medical University; 800, Xiangyin Road 200433, Shanghai; P.R. China Fax: +86-21-81871149. E-mail: caijianming882003com, victorliu20102020com.