Impact Factor ISSN: 1449-2288
- Issue 12; 2026
- Issue 11; 2026
- Issue 10; 2026
- Issue 9; 2026
- Issue 8; 2026
- Volume 22; 2026
- Past Issues
- Advance Articles
- Editorial Board
- Cover Images
- Index & Coverage
- Cover Suggestion
- Special Issues
Introduction
Materials and Methods
Results
Discussion
Supplementary Material
Acknowledgements
References

 Global reach, higher impact
Int J Biol Sci 2015; 11(4):370-379. doi:10.7150/ijbs.10666 This issue Cite
Research Paper
Caveolin-1 is a Modulator of Fibroblast Activation and a Potential Biomarker for Gastric Cancer
Xiao-Jun Shen1*, Hao Zhang2*, Gu-Sheng Tang3 ![]() , Xu-Dong Wang1, Rui Zheng1, Yang Wang4, Yan Zhu4, Xu-Chao Xue1, Jian-Wei Bi1
, Xu-Dong Wang1, Rui Zheng1, Yang Wang4, Yan Zhu4, Xu-Chao Xue1, Jian-Wei Bi1 ![]()
1. Department of General Surgery, Changhai Hospital, Second Military Medical University, Shanghai, China;
2. Department of General Surgery, No. 411 Hospital of Navy, People's Liberation Army, Shanghai, China
3. Department of Hematology, Changhai Hospital, Second Military Medical University, Shanghai, China;
4. Department of Pathology, Changhai Hospital, Second Military Medical University, Shanghai, China
*These authors contributed equally to this work.
Received 2014-9-29; Accepted 2015-1-21; Published 2015-2-15
Abstract
Stromal fibroblasts play an important role in chronic cancer-related inflammation and the development as well as progression of malignant diseases. However, the difference and relationship between inflammation-associated fibroblasts (IAFs) and cancer-associated fibroblasts (CAFs) are poorly understood. In this study, gastric cancer-associated fibroblasts (GCAFs) and their corresponding inflammation-associated fibroblasts (GIAFs) were isolated from gastric cancer (GC) with chronic gastritis and cultured in vitro. These activated fibroblasts exhibited distinct secretion and tumor-promoting behaviors in vitro. Using proteomics and bioinformatics techniques, caveolin-1 (Cav-1) was identified as a major network-centric protein of a sub-network consisting of 121 differentially expressed proteins between GIAFs and GCAFs. Furthermore, immunohistochemistry in a GC cohort showed significant difference in Cav-1 expression score between GIAFs and GCAFs and among patients with different grades of chronic gastritis. Moreover, silencing of Cav-1 in GIAFs and GCAFs using small interfering RNA increased the production of pro-inflammatory and tumor-enhancing cytokines and chemokines in conditioned mediums that elevated cell proliferation and migration when added to GC cell lines AGS and MKN45 in vitro. In addition, Cav-1 status in GIAFs and GCAFs independently predicted the prognosis of GC. Our findings indicate that Cav-1 loss contributes to the distinct activation statuses of fibroblasts in GC microenvironment and gastritis mucosa, and Cav-1 expression in both GCAFs and GIAFs may serve as a potential biomarker for GC progression.
Keywords: Cav-1, biomarker, gastric cancer
Introduction
Gastric cancer (GC) is the fourth most common cancer and the second most frequent cause of cancer-related deaths worldwide (1). In China, GC remains a significant cancer burden, with approximately 400,000 new cases and 300,000 deaths per year accounting for more than 40% of GC-related deaths worldwide (2). GC is predominantly related to chronic H. pylori infection which affects approximately 75% of GC patients (3) because chronic H. pylori infection may induce the genetic and epigenetic changes in gastric epithelial cells and trigger the progression from chronic gastritis to GC (4). It has been reported that the intestinal-type GC usually has features of corpus-dominated gastritis with gastric atrophy and intestinal metaplasia, whereas the diffuse-type GC is characterized by gastritis with loss of gastric glandular structure which is replaced by connective tissue throughout the stomach (5-6). Therefore, chronic gastritis or chronic gastric inflammation plays an important role in the development and progression of GC.
Recently, an essential, critical role of fibroblast-mediated inflammation has been identified in a variety of solid tumors (7-10) because cancer-related inflammation is common and occurs with multiple steps throughout the carcinogenesis. Initially, inflammation-associated fibroblasts (IAFs) contribute to the induction and maintenance of chronic inflammation due to the aberrant production of cytokines, chemokines and extracellular matrix (ECM) (7). Furthermore, IAF-derived cytokines/chemokines accelerate inflammation-induced tumorigenesis at the site of chronic inflammation through expanding IAFs and epithelial progenitors (8-9). Moreover, when carcinomas subsequently occur, the pro-inflammatory signature is maintained in cancer-associated fibroblasts (CAFs) in an NF-κB-dependent manner (10). Recently, it has been revealed that CAFs are related to the myofibroblast-like phenotype of tumor stroma. CAFs actively define the tumor microenvironment, thereby promoting the macrophage recruitment, neovascularization and tumor growth via interaction with other stromal cells and ECM (11-12). Thus, both IAFs in inflammatory tissues and CAFs in cancers are closely related to the cancer development and progression, although there is little evidence regarding the association between IAFs and CAFs.
Although the mechanism(s) underling the fibroblast activation remains elusive, activated fibroblasts exhibit distinct characteristics in various microenvironments or different functional positions because they are diverse and heterogeneous cell populations in terms of origin and function (11-12). Gastric CAFs (GCAFs) and gastric IAFs (GIAFs) mainly originate from the proliferation of local residing fibroblasts in GC or gastritis mucosa, and the differentiation of bone marrow-derived mesenchymal cells (MSCs), whereas GCAFs are also thought to be derived from the trans-differentiation of other mesenchymal cell types within the tumor, such as vascular smooth muscle cells, pericytes or adipocytes, and from the epithelial-mesenchymal transition or endothelial to mesenchymal transition (10-11,15). GCAFs could facilitate GC growth and progression by orchestrating the recruitment of inflammatory cells and releasing soluble mediators, such as keratinocyte growth factor (KGF), hepatocyte growth factor (HGF), and transforming growth factor-β1 (TGF-β1) (13-16). On the other hand, in addition to mediating the chronic gastritis, GIAFs may induce gastric intestinal metaplasia and dysplasia during carcinogenesis (9). However, to our knowledge, no study has been conducted to distinguish the features of GIAFs and GCAFs and evaluate their relationship, especially to determine the roles of GIAFs in GC progression.
In the present study, our results showed that GCAFs and GIAFs released different pro-tumorigenic soluble factors and exhibited distinct effects on the proliferation and invasion of GC cells in vitro. Caveolin-1 (Cav-1) was identified as a key regulator of the paracrine of activated fibroblasts in GC microenvironment. We propose that Cav-1 status in GIAFs and GCAFs may act as a novel molecular biomarker for GC prognosis.
Materials and Methods
Patients and Specimens
GC and corresponding adjacent tissues were collected from 120 GC patients who underwent radical gastrectomy from September 2006 to March 2007 at the Department of General Surgery, Changhai Hospital, Shanghai, China. The median follow-up period was 68.5 months. Normal fibroblasts (NFs) were extracted from the stomach stroma of a patient with normal gastric morphology who underwent a bariatric surgery. Written informed consent was obtained from each patient prior to enrollment into this study, which was approved by the Institutional Review Board of our hospital. The baseline characteristics of GC patients are shown in Supplementary Material: Table S1. The antibodies are described in the Supplementary Materials and Methods.
Cell culture and assays
The human gastric carcinoma cell lines AGS (American Type Culture Collection, Rockville, MD, USA) and MKN45 (Shanghai Institute of Cell Biology, Chinese Academy of Sciences, Shanghai, China) were cultured in RPMI 1640 supplemented with 10% fetal calf serum (FCS; PAA Laboratories Inc., Newport Beach, CA, USA). Fibroblasts were prepared using the outgrowth method as described previously (17). Briefly, the fresh GC tissues and the adjacent gastric mucosa with chronic gastritis at least 5 cm away from the primary GC were obtained within 25 min after resection. Samples were placed in RPMI 1640 with 10% FCS and penicillin/streptomycin (pH 7.4). Following removal of the surrounding fat, blood vessels and necrotic tissues, the GC and normal gastric mucosa were mechanically minced with scissors into small pieces (approximately 1 mm3 to 2 mm3 in volume) under a sterile condition followed by digestion for 1 h at 37°C with 1 mg/mL type IV collagenase (Roche Molecular Biochemicals, Mannheim, Germany). The cell suspension was centrifuged, and the resulting pellet was re-suspended in fresh RPMI 1640 with 10% FCS. After ~5 days, new cells grew from the tissue clumps. The medium was refreshed every 3 days. The primary cells were plated onto 100-mm dishes and maintained in a humidified atmosphere with 5% CO2 at 37°C. The fibroblasts used in this study were passaged no more than 5 times. The cell purity and morphology were determined by indirect immuno-fluorescent staining for α-smooth muscle actin (α-SMA), vimentin, keratin, and stromal cell-derived factor 1 (SDF-1).
Preparation of conditioned medium (CM) and cytokine quantification by ELISA
The fibroblasts were grown to over 70% confluence in 20-cm2 dishes in RPMI 1640 with 10% FCS. The medium was refreshed with serum-free RPMI 1640, and cells were cultured for 48 h. The media were collected and centrifuged at 1,000 ×g for 10 min, and the supernatant (referring to conditioned medium [CM]) was concentrated with a Centricon YM-3 concentrator (Millipore Corp., Bedford, MA, USA). The protein content of CM was determined by Bradford assay (Bio-Rad Laboratories, Hercules, CA, USA), and aliquots were stored at -80°C until use. The CM was processed for the detection of IL-6, IL-8, TGF-β1, HGF, IGF-1, Angiogenin, CCL2, CCL5, CCL16, CCL28, CXCL9, and CXCL12 (R&D Systems, Inc., Minneapolis, MN, USA) by ELISA according to the manufacturer's instructions.
Human cytokine antibody arrays
To detect the concentrations of 120 proteins released by the GCAFs and GIAFs, an assay with Human Chemokine Antibody Array VI and VII (Raybiotech Inc., Norcross, GA, USA) was performed in a balanced mix of CMs from three samples according to the manufacturer's instructions. Briefly, the membranes were blocked with blocking buffer at room temperature for 30 min. Then, the membranes were incubated with 1-mL samples at room temperature for 90 min, washed three times with washing buffer I and twice with washing buffer II at room temperature (5 min for each). Then, the membranes were incubated with biotin-conjugated antibodies at room temperature for 90 min. Finally, the membranes were washed and incubated with horseradish peroxidase-conjugated streptavidin at room temperature for 2 h and then with detection buffer for 2 min. A luminescence image analyzer (LAS-1000, Fuji Photofilm Co., Ltd., Tokyo, Japan) was used for detection, and the signal intensities were quantified using the ScanAlyze software (Michael Eisen, Lawrence Berkeley National Laboratory, http://www.microarrays.org/software.html). For each spot, the net signal intensity was determined by subtracting the background from the total raw signal intensity. The criteria used for the selection of differentially expressed cytokines in the GCAF-CM and GIAF-CM were based on signal intensities with a greater than 1.3-fold increase or less than 0.77-fold decrease and a value of P < 0.05.
Protein identification by two-dimensional nano-liquid chromatography-electrospray ionization/tandem mass spectrometry (2D Nano-LC-MS/MS)
Primary fibroblasts were harvested from three GC samples and lysed in 150 μl of 8 M urea, 4% (w/v) CHAPS and 0.05% SDS (w/v) on ice for 20 min with vortexing. The lysates were precipitated following incubation with cold (-20°C) 50% acetone (6:1 v/v) for 15 h. The concentrations of lysates were measured using a modified Bradford assay (Bio-Rad, Richmond, CA, USA), and the cell lysates of GCAFs and GIAFs were pooled with equal amount of lysates from each sample. The protein pellets were then digested with trypsin and desalted as described previously (18). The desalted peptides were analyzed using an automated 2D Nano-LC-ESI-MS/MS on a Nano Acquity UPLC system (Waters Corp., Milford, MA, USA) connected to a LTQ Orbitrap XL mass spectrometer (Thermo Electron Corp., Bremen, Germany) according to the manufacturer's instructions. For each experiment, 100 μL of peptides from 200 μg of total protein after digestion was used. For protein identification, the resulting MS/MS data were interpreted with the Bioworks Browser (Version 3.3.1 SP1; Thermo Electron Corp., Waltham, MA, USA) after searching the SwissProt Human protein sequence database with the following parameters: a peptide tolerance of 30 ppm and 1.0 Da for fragment ions, allowing two missed cleavages. The peptide identifications were filtered using the Trans Proteomic Pipeline (revision 4.0, Institute of Systems Biology, Seattle, WA, USA) with a confidence level of 95%. Protein identifications were accepted with a greater than 99% probability. The false discovery rate was less than 1%, which was calculated using the APEX-Quantitative Proteomics Tool (revision1.0.0, J. Craig Venter Institute, Rockville, MD, USA).
Bioinformatics analysis
The proteomics data of GCAFs and GIAFs were normalized by mean normalization. The fold-change method was used to identify the differentially expressed proteins between GCAFs and GIAFs. The NetBox 1.0 software (http://cbio.mskcc.org/tools/pathways/index.html) was used to search the Human Interaction Network (HIN) compiled by Cerami et al. (19) for the altered proteins (as seeds) and all neighbors, which was connected into an initial network. The neighbor nodes were removed immediately from the network if it was connected to less than two seed genes. The remaining neighbor nodes with degree of ≥2 represented the candidate linkers that connected two or more altered genes within the network. The global degree of each linker gene within the HIN was used to identify statistically significant linker genes, and the hypergeometric distribution was used to assess the probability that the linker gene would connect to the observed number of altered genes by chance alone. After false discovery rate (FDR) correction using the Benjamini-Hochberg procedure, the linker genes with a p-value of > 0.05 were pruned from the network. Finally, the linker genes and the remaining seeds were connected into a new sub-network. To demonstrate the biological function of the sub-network, the GATHER software (http://gather.genome.duke.edu/) was used to analyze the pathway enrichment of the Kyoto Encyclopedia of Genes and Genomes (KEGG) and Gene Ontology (GO) (20).
Real-time quantitative reverse transcription polymerase chain reaction (RT-PCR)
Total RNA was extracted from the tissues as described previously (21). Reverse transcription and cDNA amplification were performed using the LightCycler-FastStart DNA Master SYBR Green I kit, device, and software (Roche Diagnostics GmbH, Mannheim, Germany). Primers covering exon 3 and 5′-untranslated region of human caveolin-1 gene were Cav-1-S, 5′-TTGGAAGGCCAGCTTCAC-3′ and Cav-1-AS, 5′-CTATCCTTGAAATGTCA-3′ as reported previously (21).
Protein assay
Cav-1 expression was detected in primary fibroblasts by Western blot assay and evaluated in a GC cohort by immunohistochemistry as described previously (21-22). Data were independently analyzed by three investigators who were blinded to this study. The expression intensity was graded as 0 (no/little expression; < 25% positive fibroblasts), 1 (intermediate expression; 25-75% positive fibroblasts), and 2 (strong expression; > 75% positive fibroblasts). The median of three numeric scores was used as the stromal Cav-1 score for each sample. When the median score was fractional, it was rounded upwards to reflect the presence of stromal Cav-1. A median score of 0 was negative expression, and that of 1 and 2 was positive expression. Grading of chronic gastritis was based on a previous report (23).
Small interfering RNA (siRNA)-mediated gene silencing in vitro
Gene silencing was used to inhibit Cav-1 expression in GIAFs and GCAFs. The transfections were performed using the small interfering RNA (siRNA) Transfection Reagent and siRNA Transfection Medium (Santa Cruz Biotechnology Inc., Santa Cruz, CA, USA.) following the manufacturer's instructions. Briefly, 2×10⁵ of GIAFs were seeded into a 6-well plate and incubated overnight. Subsequently, 10 μM Cav-1 siRNA or 10 μM control siRNA (Santa Cruz Biotechnology Inc.) was used for transfection. After 24 h, the cells were collected for immunofluorescence assay. Briefly, the fibroblasts were washed with PBS, fixed in methanol at -20°C for 20 min, and stained with Cav-1 antibody (SC-894, 1:100) at room temperature for 1 h. Alexa-488-conjugated goat anti-rabbit IgG was used as the secondary antibody and the nuclei were stained with DAPI. The transfection efficiency were confirmed by both Western blot assay and immunofluorescence microscopy (>80%).
Statistics
Data are expressed as mean ± SEM. Comparisons were done with the paired sample Student's t-test. Friedman test was used to evaluate the difference in Cav-1 immunostaining between GIAFs and GCAFs and the difference in Cav-1 original scores among patients with different grades of chronic gastritis. The χ2 test or Fisher exact test was used to assess the associations between Cav-1 expression and clinical features. The cumulative survival time was described using the Kaplan-Meier curve. The log-rank test was used to test the differences between two groups. A multivariate Cox proportional hazards model was constructed to assess the predictors of overall survival in GC patients. The SPSS statistical software (version 17.0; SPSS Inc., Chicago, IL) was used for statistical analyses. All data were analyzed using 2-tailed tests, and a value of P<0.05 was considered statistically significant unless otherwise specified.
Results
GIAFs and GCAFs display different statuses of secretion
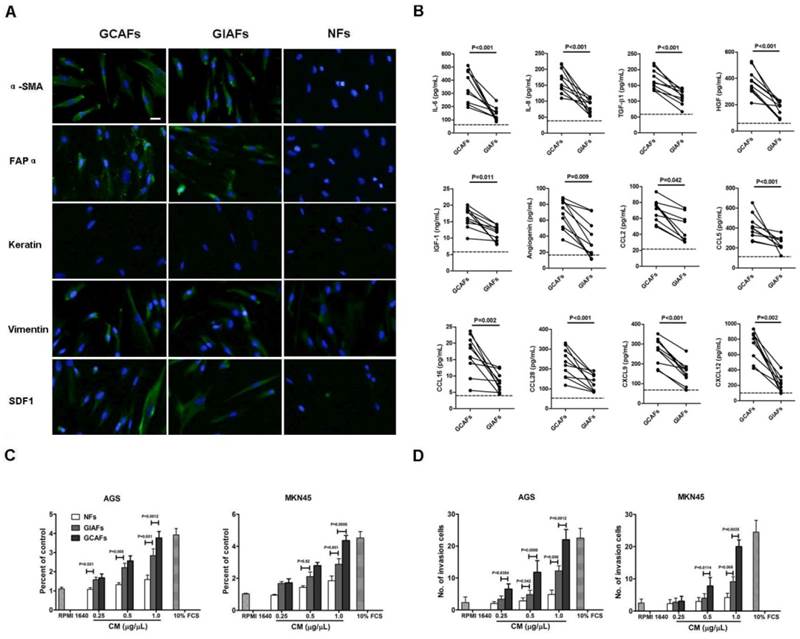
To characterize and study the function of GIAFs, primary GIAFs and GCAFs were prepared from 10 fresh GCs and their matched chronic gastritis tissues with or without intestinal metaplasia (Supplementary Material: Table S2, No. 1-10). GIAFs and GCAFs had comparable expressions of α-SMA, FAPα, and SDF-1 (Fig. 1A). Serum-free CM from NFs, GIAFs and GCAFs were also prepared and analyzed using the Human Chemokine Antibody Array VI and VII aming to identify the secretory profiles of GIAFs and GCAFs. As shown in Supplementary Material: Table S3, 67 soluble differentially expressed mediators were found between GCAFs and GIAFs, including 8 cytokines, 4 growth factors, 7 signal proteins and 7 chemokines. Of 12 differentially expressed soluble molecules confirmed by ELISA, the pro-inflammatory cytokines were IL-6 and IL-8; the growth factors were TGF-β1, HGF and IGF-1; the chemokines were CCL2, CCL5, CCL16, CCL28, CXCL9 and CXCL12; the angiogenic factor was angiogenin (Fig. 1B). Then, CM from GIAFs and GCAFs were used to treat GC cell lines AGS and MKN45. Results showed GIAF-CM increased the cell proliferation and invasion, which was intermediate between that seen in NF-CM group and GCAF-CM group (Fig. 1C and 1D).
Characterization of primary GCAFs and GIAFs. (A) GCAFs, GIAFs and NFs were stained with anti-αSMA, anti-vimentin, anti-cytokeratin, and anti-SDF1 antibodies. Scale bar, 20 μm. (B) Cytokines and chemokines were detected in the supernatants of NFs, GIAFs and GCAFs by ELISA. Each dot represents one sample. The dotted line indicates the mean of NFs from three independent experiments. (C, D) The proliferation and invasion of AGS and MKN45 cells were detected using the CCK-8 kit and Matrigel at 72 h. Error bars represent the standard errors of the mean from three independent experiments.
Caveolin-1 contributes to distinct phenotypes of fibroblast activation based on comparative profiling of the proteomes and network-centric protein analysis of GIAFs and GCAFs
To further understand the molecular mechanisms of GIAF phenotype at a systematic biology level, the proteomes of GIAFs and GCAFs were characterized using a 2D-Nano-LC-ESI-MS/MS system. Analysis of comparative proteomics showed that the matched GIAFs and GCAFs exhibited different protein expression profiles. Using a relatively strict standard (GCAFs/GIAFs or GIAFs/GCAFs ≥ 1.5 for each pair), 121 differentially expressed proteins were identified between GIAFs and GCAFs, of which 76 proteins had down-regulated expression in GCAFs (Supplementary Material: Table S4).
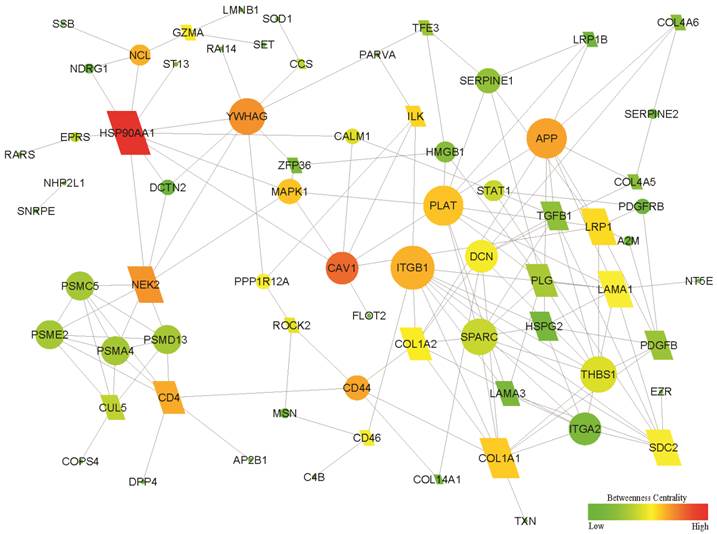
Using the NetBox 1.0 software, a network of 71 seeds (altered proteins) and 154 linkers connected with 5375 edges were identified, in which 11 altered proteins were directly connected without linker nodes and enriched the biosynthesis function (8/11). After the 11 proteins were removed from the above network, a sub-network with 46 altered genes and 25 linker genes was connected with 148 edges (Fig. 2). Therefore, the sub-network provided a new potential molecular mechanism. Enrichment analysis showed that the new sub-network was associated with the GO terms cell adhesion and migration, as well as the KEGG pathways ECM-receptor interaction and focal adhesion (all Bayes factor ≥ 6). The details are shown in Supplementary Material: Table S5. Network-centric analysis showed that CAV1 is a network-centric node with more degree and/or betweenness than other nodes, indicating that Cav-1 has an important function in the organization of the network function and definition of the features for GIAFs.
Functional subnetwork related to the development of GIAFs and GCAFs. The differentially expressed proteins between GCAFs and GIAFs by comparative proteomics were used to construct a functional sub-network using the NetBox 1.0 software. The diamonds represent 25 linker genes and the ellipses represent 46 seed genes (altered proteins). A larger size and a red color indicate a higher degree and a higher betweenness in the sub-network, respectively.
Loss of stromal Cav-1 predicts clinical outcomes of GC patients
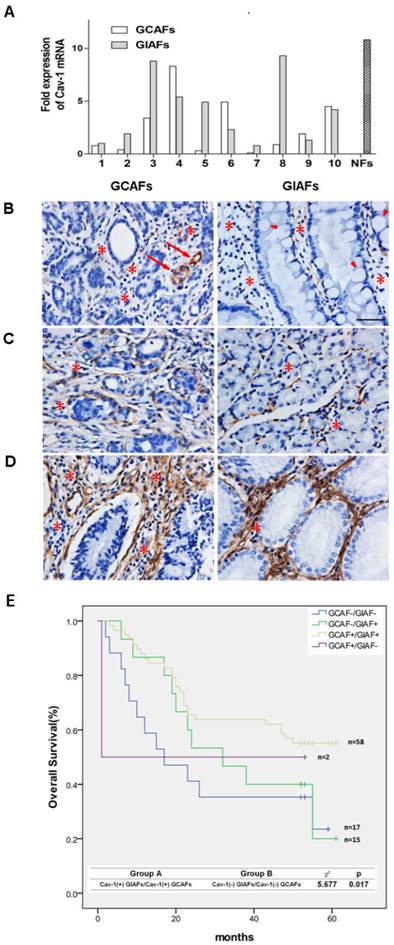
To validate the results of the comparative proteomics and bioinformatics analysis, quantitative RT-PCR was performed to detect the mRNA expression of Cav-1 in paired GIAFs and GCAFs. Our results showed higher Cav-1 mRNA expression in 6 of 10 GIAFs samples as compared to GCAFs (Fig. 3A). Based on the Cav-1 staining grades in which no/little expression was scored as 0 (Fig. 3B), intermediate expression as 1 (Fig. 3C), and strong expression as 2 (Fig. 3D), significant differences were observed in the Cav-1 staining between GIAFs and GCAFs and among patients with different grades of chronic gastritis (Table 1). Moreover, Cav-1 expression in GIAFs was inversely correlated with the tumor location, size and lymph node involvement, whereas Cav-1 expression in GCAFs was significantly negatively related to tumor size, histologic type, lymph node metastasis and tumor stage (Supplementary Material: Table S6). Survival analysis showed that Cav-1 positive expression (scores 1 and 2) in both GIAFs and GCAFs was inversely related to the overall survival of GC patients (P= 0.017) as compared to absence of Cav-1 expression (score 0) (Fig. 3F). Importantly, the presence of stromal Cav-1 in GIAFs and GCAFs was verified to independently predict the survival of GC patients in multivariate analysis using a Cox proportional hazard model (Table 2).
Cav-1 mRNA and protein expressions in GIAFs and GCAFs. (A) Cav-1 mRNA expression was detected in 10 GCAFs and GIAFs. Quantitative PCR was performed with 2- ΔΔCt method using β-actin as a reference gene. The fold increase in Cav-1 mRNA expression in cells of 10 patients is relative to the calculated Ct value of Cav-1 mRNA in GIAF of patient 1. (B-D) Cav-1-positive staining was classified into (B) no/little expression, (C) intermediate expression, or (D) strong expression in GCs and adjacent gastric mucosa with inflammatory cell infiltration (stars) and intestinal metaplasia (arrow heads). Original magnification: 40×. Vascular endothelial cells (arrows) served as internal positive controls. (E) Kaplan-Meier curve for the analysis of overall survival of patients with Cav-1(+) GIAFs/Cav-1(+) GCAFs, Cav-1(+) GIAFs/Cav-1(-) GCAFs, Cav-1(-) GIAFs/Cav-1(+) GCAFs and Cav-1(-) GIAFs/Cav-1(-) GCAFs.
Cav-1 Protein Expression in GCAFs and GIAFs in Gastric Cancer with Different Grades of Chronic Gastritis
| Name | Cav-1 expression scores | |||
|---|---|---|---|---|
| Negative (0) | Intermediate (1) | Strong (2) | P value | |
| GCAFs | 32 | 41 | 19 | |
| GIAFs | 17 | 37 | 38 | .004* |
| GRADE 0 | 0 | 7 | 20 | |
| GRADE 1 | 1 | 11 | 15 | |
| GRADE 2 | 6 | 13 | 2 | |
| GRADE 3 | 10 | 6 | 1 | <.001# |
*Cav-1 Scores in GIAFs versus in GCAFs
#Cav-1 Scores in GIAFs versus Chronic Inflammation Grades in Adjacent Gastric Mucosa
Cox Univariate and Multivariate Analyses of Factors Associated with Overall Survival
| Univariate P value | Multivariate | |||
|---|---|---|---|---|
| HR | 95% CI | P | ||
| Age (<60 vs ≥60) | .108 | NA | ||
| Sex (Male vs. Female) | .150 | NA | ||
| H pylori infection (Negative vs. Positive) | .236 | NA | ||
| Size (cm) (<5 vs. ≥5) | .002 | 1.682 | .754-3.579 | .057 |
| Histologic type (Well and moderately vs. Poorly and others*) | .010 | 1.920 | 1.001-2.352 | .202 |
| Lauren classification (Intestinal type vs. Diffuse +Mixed type) | .043 | 1.101 | .753-3.004 | .583 |
| Location (Stomach vs. GEJ) | .211 | NA | ||
| Lymphatic invasion (Negative vs. Positive) | .109 | NA | ||
| Depth of tumor (T1+ T2 vs. T3 + T4) | .002 | 3.004 | 1.346-5.330 | .024 |
| Lymph node metastasis (N0+ N1 vs. N2 +N3) | .015 | 1.879 | .987-3.980 | .654 |
| Distant metastasis (M0 vs. M1) | .020 | 1.894 | .589-4.130 | .098 |
| TNM stage (I+II vs. III+Ⅵ) | .007 | 1.329 | .876-4.067 | .309 |
| Cav-1 Protein Expression in GIAFs and GCAFs (Presence vs. Absence) | .017 | 1.687 | 1.135-3.827 | <0.001 |
NOTE. Cox proportional hazards regression model. The variables used in the multivariate analysis were adopted by the univariate analysis. NA, not adopted. *Other histologic types of gastric cancer mainly included mucinous adenocarcinomas and signet-ring cell carcinomas, according to the World Health Organization (WHO) classifications.
Cav-1 deficiency in GIAFs and GCAFs increases the production and secretion of tumor-enhancing cytokines in vitro
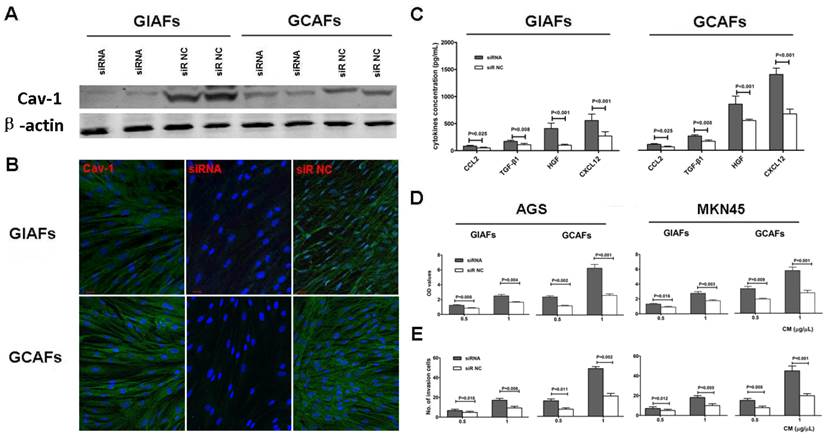
To further elucidate the functional consequences of altered Cav-1 expression in GIAFs and GCAFs, endogenous Cav-1 expression was silenced using Cav-1 siRNA. The siRNA-mediated silencing of Cav-1 expression almost completely abrogated cytosolic Cav-1 expression (Fig. 4A-B). To determine the effects of Cav-1 deficiency on the secretory function, CMs were prepared from GIAFs and GCAFs of siRNA-Cav1 (siR-Cav1) group and siRNA-negative control (siR-NC) group. The concentrations of HGF, TGF-β1, CXCL 2, and CXCL12 in siR-Cav1 groups were significantly higher than those in siR-NC groups, and the addition of CMs from siR-Cav1 groups significantly increased the proliferation and invasion of GC cell lines when compared with CMs from GIAFs and GCAFs in control group (Fig. 4C, 4D and 4E).
Cav-1 silencing in GIAFs promotes the proliferation and invasion of GC cells and increases fibroblast activation-related cytokines and chemokines. (A and B) Cav-1-expressing GIAFs and GCAFs were transfected with siR-Cav1, and the silencing efficiency of endogenous Cav-1 was confirmed by Western blot assay (A) and immunofluorescent staining (B). Scrambled siR-NC was used as a control. Green: Cav-1; Blue: DAPI. Data are representative of three independent experiments. Original magnification, 100×. Scale bar, 20 μm. The concentrations of HGF, TGF-β1, CXCL 2, and CXCL12 in siR-Cav1 groups were significantly higher than those in siR-NC groups (C), and CM from siR-Cav1 cells significantly increased the proliferation and invasion of the GC cell lines (D, E). siR: siRNA. NC: negative control. Neg: negative.
Discussion
In this study, we isolated GIAF and GCAFs from inflammatory tissues and GC tissues, respectively and for the first time compared GIAFs and GCAFs on the basis of molecular signatures and functional impact on GC cells in vitro. Both GIAFs and GCAFs are activated and have similar expression pattern of activation related markers other than NFs. However, GIAFs released less pro-inflammatory cytokines, chemokines and growth factors as compared to GCAFs, thereby having an inferior tumor-promoting effect on GC cells. GIAFs and GCAFs share an “activation state” but have different phenotypes (such as biosynthetic capacity), which is one of heterogeneities of activated fibroblasts ascribed to their origin and mechanism of activation (10-12). This heterogeneity impedes the comprehensive understanding of CAFs and IAFs. Although GIAFs and GCAFs are representative of activated fibroblasts, identifying the molecules that are involved in the different functional states of heterogeneous cell populations is a prerequisite for defining the mechanisms that drive fibroblast activation in different microenvironments.
The present study for the first time reveals that Cav-1 contributes to the different activation statuses of GIAFs and GCAFs. Additionally, immunohistochemistry in a GC cohort showed the overall Cav-1 protein expression significantly increased in GIAFs as compared to that in GCAFs. Cav-1, a membrane-bound scaffolding protein of caveolae, plays an important role in negatively modulating cell proliferation, survival, motility and migration through direct interaction and inhibition of oncogenic signaling molecules and downstream pathways (24-26). Previous studies on the functions of Cav-1 were conducted mainly in epithelial cells. In recent years, evidence also reveals that Cav-1 is highly expressed in stromal cells including fibroblasts and its expression may be downregulated via degradation and autophagy in a hypoxic and malnourished niche of the cancer microenvironment (25-26). Based on previous studies, the loss of Cav-1 in cancer cells further drives the constitutive activation of several oncogenes, such as c-Myc, v-Abl, v-Src, H-Ras, and Neu/ErB2 in stromal fibroblasts, resulting in a myofibroblast conversion characterized by the up-regulated α-SMA expression, increased deposition of ECM components and hyperactivation of TGF-β signaling pathway (26). Moreover, several of these myofibroblast phenotypes can be reversed by Cav-1 restoration (27-28). Therefore, a loss of Cav-1 in fibroblasts is sufficient to induce a CAF phenotype in the tumor microenvironment.
Currently, no study has been conducted to investigate the mechanisms governing the deficiency of Cav-1 in IAFs without direct “education” from cancer cells. In a model of Cav1-deficient mice infected with H. pylori, however, Cav-1 in the gastric epithelial cells was found to play a protective role against inflammation and tissue damage and its expression was down-regulated by H. pylori infection (29), suggesting that H. pylori-induced inflammation is a response to Cav-1 loss. Our findings showed approximately 70% of GC patients had chronic gastritis, of which a majority of GIAFs lost, at least partially, Cav-1 expression, and its expression gradually decreased with the aggravation of gastric inflammation. Our results also showed that siRNA-mediated silencing of Cav-1 in GIAFs increased the release of factors into the supernatant (CM) which was able to significantly increase the proliferation and invasion of GC cells. Taken together, on the basis of findings from GCAFs, one of the consequences of stromal Cav-1 loss is the increased release of soluble proinflamamtory factors. Therefore, it is hypothesized that chronic inflammation in gastritis mucosa, similar to cancer cells in GC microenvironment, may facilitate Cav-1 genetic ablation in GIAFs, resulting in fibroblast activation.
In the present study, the activation state of GIAFs in terms of Cav-1 expression was markedly associated not only with cytokine production, but also with primary GC size, lymph node involvement and tumor stage. This suggests that Cav-1 loss in GIAFs can promote the local infiltration and invasion of GC cells via the release of cytokines. It has been shown that fibroblast activation in the cancer microenvironment induces the rapid production of cytokines and chemokines, thereby providing a self-reinforcing mechanism of tumor growth, invasion and metastasis (11-12). Similarly, activated fibroblasts in non-malignant tissues also play a prominent role in the formation and persistence of chronic cancer-related inflammation, facilitating tumor development and spreading (7-10). In particular, fibroblast-derived cytokines have been proved to promote GC development through the recruitment of stromal cells and the modulation of progenitor niche in an H. pylori-induced GC model (9). Accordingly, it is reasonable that GIAFs play an important role in GC progression through mediating inflammation and creating tumor-enhancing niche.
Our results demonstrated that Cav-1 expression in GIAFs was significantly associated with the intensity ratio of chronic inflammation in adjacent gastritis mucosa to GC. Recently, the tumor and compartment-dependent roles of Cav-1 have been identified in the pathogenesis and prognosis of human cancers (26-28). Impressively, the loss of stromal Cav-1 (but not tumor cell Cav-1) indicates a poor prognosis in certain cancers, such as breast cancer and prostate cancer (30-31). It is still unclear that whether epithelial Cav-1 is a tumor modulator in GC because the majority of related studies demonstrate that positive staining of Cav-1 occurs in less than 10% of GC cells, with the presence or absence of significant correlation between Cav-1 expression in tumor cells and clinical outcomes of GC patients (21, 32-34). In a recent study, a low Cav-1 expression in GCAFs was found to be able to independently predict early recurrence and poor survival of GC patients (33). Furthermore, our results revealed that, in addition to a significant correlation between clinical features of GC and Cav-1 expression in GIAFs and GCAFs, the presence of Cav-1 in GIAFs and GCAFs was an independent prognostic factor for GC, and the expression of stromal Cav-1 may act as a novel molecular biomarker for the clinical outcomes of GC patients. According to our results, Cav-1 loss may provide a common mechanism for the activation of GIAFs and GCAFs and the extent of Cav-1 deficiency in GIAFs and GCAFs may determine their ability to constitute a functional mesenchymal niche for the development and progression of GC cells.
In conclusion, GIAFs and GCAFs exhibit distinct states of fibroblast activation and tumor-promoting behaviors, suggesting the critical influence of fibroblast-mediated inflammation on the GC development and progression. Our findings highlight the role of stromal Cav-1 loss in fibroblast activation and GC progression, and the exact mechanisms underlying this phenomenon warrant further study.
Supplementary Material
Supplementary Methods, Tables S1-S6.
Acknowledgements
This study was supported by the National Natural Science Foundation of China (NSFC) (30672046, 81172021 and 81172156). We thank Dr. Xing-Hua Wang, M.D., Ph.D., and Mr. Gang Xu, Department of Microbiology, Shanghai Key Laboratory of Medical Biodefense, Second Military Medical University, Shanghai, China, for helpful discussions of this manuscript. We also greatly appreciate Dr. Qianglin Duan, for critical reading and editing of the manuscript.
Competing Interests
The authors have declared that no competing interest exists.
References
1. Crew KD, Neugut AI. Epidemiology of gastric cancer. World J Gastroenterol. 2006;12:354-62
2. Yang L. Incidence and mortality of gastric cancer in China. World J Gastroenterol. 2006;12:17-20
3. Sipponen P, Kosunen TU, Valle J, Riihelä M, Seppälä K. Helicobacter pylori infection and chronic gastritis in gastric cancer. J Clin Pathol. 1992;45:319-23
4. Uemura N, Okamoto S, Yamamoto S, Matsumura N, Yamaguchi S, Yamakido M, Taniyama K, Sasaki N, Schlemper RJ. Helicobacter pylori infection and the development of gastric cancer. N Engl J Med. 2001;345:784-9
5. Chiba T, Marusawa H, Ushijima T. Inflammation-associated cancer development in digestive organs: mechanisms and roles for genetic and epigenetic modulation. Gastroenterology. 2012;143:550-63
6. Fox JG, Wang TC. Inflammation, atrophy, and gastric cancer. J Clin Invest. 2007;117:60-9
7. Buckley CD, Pilling D, Lord JM, Akbar AN, Scheel-Toellner D, Salmon M. Fibroblasts regulate the switch from acute resolving to chronic persistent inflammation. Trends Immunol. 2001;22:199-204
8. Mantovani A, Allavena P, Sica A, Balkwill F. Cancer-related inflammation. Nature. 2008;454:436-444
9. Shibata W, Ariyama H, Westphalen CB, Worthley DL, Muthupalani S, Asfaha S, Dubeykovskaya Z, Quante M, Fox JG, Wang TC. Stromal cell-derived factor-1 overexpression induces gastric dysplasia through expansion of stromal myofibroblasts and epithelial progenitors. Gut. 2013;62:192-200
10. Erez N, Truitt M, Olson P, Arron ST, Hanahan D. Cancer-associated fibroblasts are activated in incipient neoplasia to orchestrate tumor-promoting inflammation in an NF-kappaB-dependent manner. Cancer Cell. 2010;17:135-47
11. Kalluri R, Zeisberg M. Fibroblasts in cancer. Nat Rev Cancer. 2006;6:392-401
12. Toullec A, Gerald D, Despouy G, Bourachot B, Cardon M, Lefort S, Richardson M, Rigaill G, Parrini MC, Lucchesi C, Bellanger D, Stern MH, Dubois T, Sastre-Garau X, Delattre O, Vincent-Salomon A, Mechta-Grigoriou F. Oxidative stress promotes myofibroblast differentiation and tumour spreading. EMBO Molecular Medicine. 2010;2:211-30
13. Nakazawa K, Yashiro M, Hirakawa K. Keratinocyte growth factor produced by gastric fibroblasts specifically stimulates proliferation of cancer cells from scirrhous gastric carcinoma. Cancer Res. 2003;63:8848-52
14. Tendo M, Yashiro M, Nakazawa K, Yamada N, Hirakawa K. (2005) Inhibitory effect of a selective cyclooxygenase inhibitor on the invasion-stimulating activity of orthotopic fibroblasts for scirrhous gastric cancer cells. Cancer Sci. 2005;96:451-5
15. Guo X, Oshima H, Kitmura T, Taketo MM, Oshima M. Stromal fibroblasts activated by tumor cells promote angiogenesis in mouse gastric cancer. J Bio Chem. 2008;283:19864-71
16. Holmberg C, Quante M, Steele I, Kumar JD, Balabanova S, Duval C, Czepan M, Rakonczay Z Jr, Tiszlavicz L, Nemeth I, Lazar G, Simonka Z, Jenkins R, Hegyi P, Wang TC, Dockray GJ, Varro A. Release of TGFβig-h3 by gastric myofibroblasts slows tumor growth and is decreased with cancer progression. Carcinogenesis. 2012;33:1553-62
17. Hwang RF, Moore T, Arumugam T, Ramachandran V, Amos KD, Rivera A, Ji B, Evans DB, Logsdon CD. Cancer-associated stromal fibroblasts promote pancreatic tumor progression. Cancer Res. 2008;68:918-26
18. Ngoka LC. Dramatic down-regulation of oxidoreductases in human hepatocellular carcinoma hepG2 cells: proteomics and gene ontology unveiling new frontiers in cancer enzymology. Proteome Sci. 2008;6:29
19. Cerami E, Demir E, Schultz N, Taylor BS, Sander C. Automated network analysis identifies core pathways in glioblastoma. PLoS One. 2010;5:e8918
20. Chang JT, Nevins JR. GATHER: a systems approach to interpreting genomic signatures. Bioinformatics. 2006;22:2926-33
21. Burgermeister E, Xing X, Röcken C, Juhasz M, Chen J, Hiber M, Mair K, Shatz M, Liscovitch M, Schmid RM, Ebert MP. Differential expression and function of caveolin-1 in human gastric cancer progression. Cancer Res. 2007;67:8519-26
22. Simpkins SA, Hanby AM, Holliday DL, Speirs V. Clinical and functional significance of loss of caveolin-1 expression in breast cancer-associated fibroblasts. J Pathol. 2012;227:490-8
23. Rugge M, Genta RM. Staging and grading of chronic gastritis. Hum Pathol. 2005;36:228-33
24. Parton RG, Simons K. The multiple faces of caveolae. Nat Rev Mol Cell Biol. 2007;8:185-94
25. Goetz JG, Minguet S, Navarro-Lérida I, Lazcano JJ, Samaniego R, Calvo E, Tello M, Osteso-Ibáñez T, Pellinen T, Echarri A, Cerezo A, Klein-Szanto AJ, Garcia R, Keely PJ, Sánchez-Mateos P, Cukierman E, Del Pozo MA. Biomechanical remodeling of the microenvironment by stromal caveolin-1 favors tumor invasion and metastasis. Cell. 2011;146:148-63
26. Sotgia F, Martinez-Outschoorn UE, Howell A, Pestell RG, Pavlides S, Lisanti MP. Caveolin-1 and cancer metabolism in the tumor microenvironment: markers, models, and mechanisms. Annu Rev Pathol. 2012;7:423-67
27. Martinez-Outschoorn U.E. et al. Tumor cells induce the cancer associated fibroblast phenotype via caveolin-1 degradation: implications for breast cancer and DCIS therapy with autophagy inhibitors. Cell Cycle. 2010;9:2423-33
28. Martinez-Outschoorn UE, Curry JM, Ko YH, Lin Z, Tuluc M, Cognetti D, Birbe RC, Pribitkin E, Bombonati A, Pestell RG, Howell A, Sotgia F, Lisanti MP. Oncogenes and inflammation rewire host energy metabolism in the tumor microenvironment: RAS and NFkB target stromal MCT4. Cell Cycle. 2013;12:2580-97
29. Hitkova I, Yuan G, Anderl F, Gerhard M, Kirchner T, Reu S, Röcken C, Schäfer C, Schmid RM, Vogelmann R, Ebert MP, Burgermeister E. Caveolin-1 protects B6129 mice against Helicobacter pylori gastritis. PLoS Pathog. 2013;9:e1003251
30. Witkiewicz AK, Dasgupta A, Sotgia F, Mercier I, Pestell RG, Sabel M, Kleer CG, Brody JR, Lisanti MP. An absence of stromal caveolin-1 expression predicts early tumor recurrence and poor clinical outcome in human breast cancers. Am J Pathol. 2009;174:2023-34
31. Sloan EK, Ciocca DR, Pouliot N, Natoli A, Restall C, Henderson MA, Fanelli MA, Cuello-Carrión FD, Gago FE, Anderson RL. Stromal cell expression of caveolin-1 predicts outcome in breast cancer. Am J Pathol. 2009;174:2035-43
32. Barresi V, Giuffre G, Vitarelli E, Todaro P, Tuccari G. Caveolin-1 immuno-expression in human gastric cancer: histopathogenetic hypotheses. Virchows Arch. 2008;453:571-8
33. Zhao X, He Y, Gao J, Fan L, Li Z, Yang G, Chen H. Caveolin-1 expression level in cancer-associated fibroblasts predicts outcome in gastric cancer. PLoS One. 2013;8:e59102
34. Nam KH, Lee BL, Park JH, Kim J, Han N, Lee HE, Kim MA, Lee HS, Kim WH. Caveolin 1 expression correlates with poor prognosis and focal adhesion kinase expression in gastric cancer. Pathobiology. 2013;80:87-94
Author contact
![]() Corresponding author: Gu-sheng Tang, M.D., Ph.D. Department of Hematology, Changhai Hospital, Second Military Medical University, Shanghai, China; E-mail: drake015com; Jian-wei Bi, M.D., Ph.D. Department of General Surgery, Changhai Hospital, Second Military Medical University, 168 Changhai Road, Shanghai, China, 200433; E-mail: bijianwei82com; Fax: (86)-021-31161585.
Corresponding author: Gu-sheng Tang, M.D., Ph.D. Department of Hematology, Changhai Hospital, Second Military Medical University, Shanghai, China; E-mail: drake015com; Jian-wei Bi, M.D., Ph.D. Department of General Surgery, Changhai Hospital, Second Military Medical University, 168 Changhai Road, Shanghai, China, 200433; E-mail: bijianwei82com; Fax: (86)-021-31161585.