Impact Factor ISSN: 1449-2288
- Issue 9; 2026
- Issue 8; 2026
- Issue 7; 2026
- Issue 6; 2026
- Issue 5; 2026
- Volume 22; 2026
- Past Issues
- Advance Articles
- Editorial Board
- Cover Images
- Index & Coverage
- Cover Suggestion
- Special Issues
Introduction
Materials and Methods
Results
Discussion
Supplementary Materials
Acknowledgements
References

 Global reach, higher impact
Int J Biol Sci 2015; 11(6):712-725. doi:10.7150/ijbs.11827 This issue Cite
Research Paper
Induction of Phosphoenolpyruvate Carboxykinase (PEPCK) during Acute Acidosis and Its Role in Acid Secretion by V-ATPase-Expressing Ionocytes
Fumiya Furukawa1,2, Yung-Che Tseng3, Sian-Tai Liu3, Yi-Ling Chou1, Ching-Chun Lin1, Po-Hsuan Sung4, Katsuhisa Uchida2, Li-Yih Lin3, Pung-Pung Hwang1 ![]()
1. Institute of Cellular and Organismic Biology, Academia Sinica, Nankang, Taipei, Taiwan
2. Department of Marine Biology and Environmental Sciences, Faculty of Agriculture, University of Miyazaki, Miyazaki, Japan
3. Department of Life Science, National Taiwan Normal University, Taipei, Taiwan
4. Department of Life Science, National Taiwan University, Taipei, Taiwan
Received 2015-2-8; Accepted 2015-4-9; Published 2015-5-1
Abstract

Vacuolar-Type H+-ATPase (V-ATPase) takes the central role in pumping H+ through cell membranes of diverse organisms, which is essential for surviving acid-base fluctuating lifestyles or environments. In mammals, although glucose is believed to be an important energy source to drive V-ATPase, and phosphoenolpyruvate carboxykinase (PEPCK), a key enzyme for gluconeogenesis, is known to be activated in response to acidosis, the link between acid secretion and PEPCK activation remains unclear. In the present study, we used zebrafish larva as an in vivo model to show the role of acid-inducible PEPCK activity in glucose production to support higher rate of H+ secretion via V-ATPase, by utilizing gene knockdown, glucose supplementation, and non-invasive scanning ion-selective electrode technique (SIET). Zebrafish larvae increased V-ATPase-mediated acid secretion and transiently expression of Pck1, a zebrafish homolog of PEPCK, in response to acid stress. When pck1 gene was knocked down by specific morpholino, the H+ secretion via V-ATPase decreased, but this effect was rescued by supplementation of glucose into the yolk. By assessing changes in amino acid content and gene expression of respective enzymes, glutamine and glutamate appeared to be the major source for replenishment of Krebs cycle intermediates, which are subtracted by Pck1 activity. Unexpectedly, pck1 knockdown did not affect glutamine/glutamate catalysis, which implies that Pck1 does not necessarily drive this process. The present study provides the first in vivo evidence that acid-induced PEPCK provides glucose for acid-base homeostasis at an individual level, which is supported by rapid pumping of H+ via V-ATPase at the cellular level.
Keywords: Gluconeogenesis, acid-base regulation, PEPCK, V-ATPase, glutamine
Introduction
Regulation of cellular and body fluid acid-base balance is essential for all organisms, which have not only to overcome the metabolic acidosis but also to cope with the environmental acidification resulted from the rapid anthropogenic release of abiotic greenhouse gas (e.g. CO2 and CH4). Among cellular acid regulation machineries, vacuolar-type H+-ATPase (V-ATPase) takes the central role in this process by pumping H+ through biological membranes, using the energy obtained by hydrolysis of ATP (15). V-ATPase is expressed in a wide variety of species, including fungi, amoebas, plants and animals, suggesting its conserved and essential role in the handling of H+ in these species (16). Among vertebrate animals, the mechanism of H+ excretion via V-ATPase is well understood in the mammalian kidney. In the kidney, V-ATPase is abundantly expressed in the apical and basolateral membranes of α- and β-intercalated cells, respectively, located in distal convoluted tubule through collecting duct, being responsible for acid-base homeostasis (12, 52). The source for cellular ATP is necessary to support normal acid-base regulatory function of these cells because depletion of metabolic substrates dramatically reduced basolateral V-ATPase activity in rabbit cortical collecting duct (24). α-Intercalated cells were reported to express high levels of basolateral glucose transporters (GLUT1, GLUT3, GLUT4), implying that these cells are highly dependent on glucose utilization to facilitate acid secretion machinery (23, 49). As such, glucose may contribute to acid-base regulatory functions of those V-ATPase expressing cells; however, the detailed mechanism at the cellular level has been unclear due to the difficulties in handling mammalian kidney in vivo and conducting tubular cell types-specific assay. Another important phase of this issue involves phosphoenolpyruvate carboxykinase (PEPCK), a key enzyme of gluconeogenesis, which is activated in the rat kidney during acidosis (2, 8, 11). Although this process may contribute to glucose production (18), the primary role of renal PEPCK is interpreted as removal of Krebs cycle intermediates (the process called “cataplerosis”) to guarantee the accelerated catabolism of glutamine and glutamate to generate ammonia for H+ buffering (10, 17, 41). Until today, the physiological significance of acid-induced renal PEPCK and glucose production has also remained unclear. To circumvent the difficulty in the use of mammalian kidney tubules, adopting an alternative and more competent experimental model system is desirable to explore the related issues.
Zebrafish (Danio rerio) has been a well-established model species to understand the development and physiology of vertebrate animals. In zebrafish embryonic epithelium, ionocytes exchange various ions and acid-base equivalents, contributing to body fluid homeostasis of this species (30, 31). Among several subtypes of the ionocytes, H+-ATPase rich (HR) cell is specifically responsible for acid secretion (27, 36). The HR cells are considered as a functional analog of α-intercalated cells in mammalian kidney (1, 31), by their molecular equipment such as apical V-ATPase and basolateral anion exchanger 1 (35). Also, Delta-Notch-mediated lateral inhibition and Foxi-dependent emergence during differentiation are conserved between these cells (1, 14, 29). By utilizing a scanning ion-selective electrode technique (SIET), direct measurement of H+ current at the apical surface of a single HR cell is available in the yolk-sac epithelium of larval zebrafish (27, 36) and higher rate of H+ secretion from these cells has been observed upon low-pH exposure (20, 28). In analogy with the mammalian α-intercalated cells, zebrafish HR cells also express high levels of a glucose transporter homolog, GLUT13.1 (50), implying that the HR cells are highly dependent on glucose as an energy source. In zebrafish, pck1, a gene encoding PEPCK homolog (Pck1), was found to be highly expressed in the larval yolk sac and liver (21, 32), and used as a model gene to understand the role of PEPCK in human glucose metabolism (13, 21, 32).
The present study aims to test the hypothesis that 1) glucose serves as the primary energy source to operate acid secretion via V-ATPase and 2) PEPCK activity induced by acidosis supplies additional glucose for accelerated excretion of H+ from the acid-pumping cells. Here we used zebrafish as an in vivo model, and reported a role of PEPCK-mediated gluconeogenesis and surrounding metabolic processes in acid secretion during acidosis. We exposed zebrafish larvae to an acidic fresh water, and assessed expression levels of several gluconeogenic genes. Among the genes assessed, pck1 was highly expressed in response to acid stress. Knockdown and rescue experiments by injection of morpholino oligo (MO) targeting pck1 and glucose into the yolk, respectively, revealed that Pck1-mediated glucose supply is necessary to operate V-ATPase at higher rate during acid stress. The present study points to the role of PEPCK to meet the glucose demand for acid-base regulation.
Materials and Methods
Animal
The wild type AB strain of zebrafish (Danio rerio) were kept in tanks filled with fresh water at 28.5°C under a photoperiod of 14 h light/10 h darkness. Fertilized eggs were collected from mating pairs, and incubated in petri dishes filled with FW at 28.5°C until 3 days post fertilization (dpf). The water was exchanged twice a day to guarantee the quality of the water. The ion concentrations and pH of the fresh water are (in mM): 0.5 Na+; 0.3 K+; 0.2 Ca2+; 0.16 Mg2+; 0.5 Cl-; pH = 7.2. The larvae were anesthetized with 0.03% tricaine (Sigma-Aldrich, St. Louis, MO) before sampling. The experimental protocols were approved by the Academia Sinica Institutional Animal Care and Utilization Committee (approval no.: RFiZOOHP2010081).
Low-pH challenge
3-dpf zebrafish larvae were transferred to either normal fresh water (pH 7.2) or low-pH fresh water (pH 4.0). The low-pH water was prepared by adding an appropriate amount of 1 N H2SO4. At 0 (before transfer), 4, 6, 12, 24, and 48 h after transfer of the larvae, the larvae were removed for glucose measurement, RNA extraction, and amino acid analysis. For MO treated larvae, 6 h of low-pH exposure time was selected to understand the role of pck1 during acute acidosis, because increases in H+ excretion by HR cells (Guh et al., unpublished and this study) and Pck1 expression (this study) have been observed within 6 h after low-pH treatment.
Glucose measurement
30 larvae were homogenized in 0.5 mL of 100% ethanol, and dried in a vacuum concentrator, Concentrator 5301 (Eppendorf, Hamburg, Germany). The samples were reconstituted in 50 μL distilled water, and 5 μL of which was used for fluorometric glucose measurement with a glucose assay kit (Biovision, Milpitas, CA). The 96-well black microplate containing glucose assay mixture and the samples was incubated at 37°C for 30 min, and then read with a microplate reader, Spectra Max M5 (Molecular Devices, Sunnyvale, CA), with the wavelength of excitation and emission at 535 and 587 nm, respectively.
Quantitative PCR analysis
From 30 larvae in a tube, total RNA was extracted with Trizol (Life Technologies, Carlsbad, CA), and the genomic DNA was digested with DNase I (Life Technologies). First-strand cDNA was synthesized from the total RNA with Superscript III (Life Technologies). By quantitative PCR (qPCR) analysis with Lightcycler 480 system II (Roche diagnostics, Basel, Switzerland), the expression levels of glucose-6-phosphatase (g6pca.1 and g6pca.2), PEPCK (pck1 and pck2), glutamate dehydrogenase (glud1a and glud1b), and glutaminase (glsa, glsb, gls2a, gls2b, and glsl) were assessed. An unidentified gene closely related to glutaminase genes was tentatively referred to as “gls-like (glsl)” in the present study. The primers used are listed in Supplementary Table S1. The specificity of each PCR was checked by melting curve analysis. The expression level of each gene was normalized to that of rpl13a which served as an internal control (47).
Translational knockdown of pck1 in combination with low-pH challenge and glucose injection
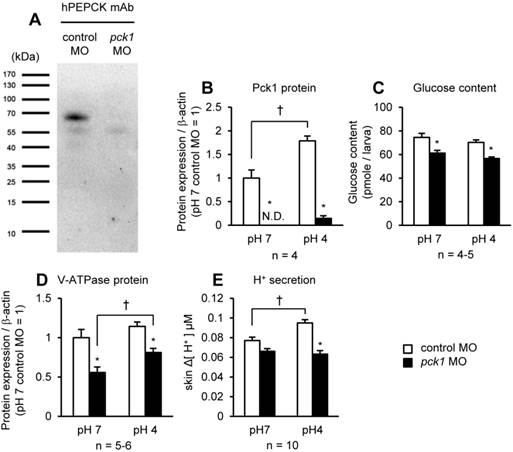
The MO targeting zebrafish pck1 mRNA was purchased from Gene Tools (Philomath, OR). The sequence of the MO was: 5'- CCTTGAGTGAAGGTTTAGCAGCTCT-3'. The MO was diluted into 4 ng/nL in distilled water, and 1 nL of MO solution (equivalent to 4 ng MO) was injected into 1~2 cell stage embryos with IM-300 microinjection system (Narishige Scientific Instrument Laboratory, Tokyo, Japan). Standard control MO with nonspecific sequence (5'-CCTCTTACCTCAGTTACAATTTATA-3') was injected in parallel as a control. The effectiveness of pck1 MO was confirmed by Western-blot analysis (Fig. 2). The embryos injected with control or pck1 MO were maintained in normal FW until 3 dpf, and then subjected to low-pH exposure for 6 h. The independent effects and interaction of pck1 knockdown and 6-h acid exposure were assessed for protein abundance of Pck1 and V-ATPase, body glucose content, skin and HR-cell H+ secretion, amino acid levels, and ammonium ion secretion by HR cell. In another experiment, the effect of pck1 knockdown was rescued by supplementation of glucose in the yolk nutrient, according to Rocha et al. (44) with some modifications. At 4-5 h post fertilization, the control MO or pck1 MO-injected embryos were further injected with 4 nL of distilled water or 2 M glucose (pck1 morphant only) into the yolk. These embryos were all subjected to a 6-h low-pH challenge at 3 dpf, and then V-ATPase protein levels, HR cell number, and H+ or NH4+ secretion were assessed. The appropriate doses of MOs and glucose injected were determined by preliminary experiments to avoid mortality and abnormal body development.
pck1 knockdown eliminates acid-induced H+ excretion. Western-blot analysis of the protein samples obtained from control MO-injected (1st lane) and pck1 MO-injected (2nd lane) larvae (A). A band immunoreactive to human PEPCK antibody was detectable at ~69 kDa in the control, but not in the pck1 morphant. The effects of pck1 knockdown and 6-h exposure to pH 7 or pH 4 environments on Pck1 protein (B), glucose content (C), V-ATPase protein (D), and H+ secretion from the yolk-sac skin (E) were assessed. pck1 knockdown decreases not only Pck1 protein level, but also glucose content, V-ATPase protein, and acid-induced excretion of H+. Open and closed column indicate control MO- and pck1 MO-treated samples, respectively. Data are expressed as means ± SE. Asterisks indicate significant differences between control and morphant in the same pH, and daggers indicate significant differences between pH 7 and pH 4 in the same treatment groups (P < 0.05). N.D., not detectable.
Western-blot analysis
The efficiency and effects of pck1 MO were assessed by Western-blot analysis. Since the antigen sequence of the commercial anti-human PEPCK-C antibody used (sc-377027; Santa Cruz Biotechnology, Inc., Dallas, TX) shared 90.6% and 75% identities with cytosolic and mitochondrial isoform of zebrafish PEPCKs (Pck1 and Pck2), the reactivity of the antibody to the cytosolic form of zebrafish PEPCK (Pck1) was investigated. The cytosolic protein fraction collected from 30 individuals of control MO or pck1 MO-injected zebrafish larvae were isolated according to Prudent et al. (43), and supplemented with electrophoresis sample buffer (in mM: 250 Tris base, 2 Na2EDTA, 2% sodium dodecyl sulfate, and 5% dithiothreitol), and then incubated at 95°C for 10 min. The denatured samples equivalent to 20 μg protein were applied to each well, separated with 10% SDS-PAGE, and transferred to PVDF membrane (Millipore, Billerica, MA). The membrane was blocked for 2 h in Western blocking reagent (Roche Applied Science, Upper Bavaria, Germany) diluted 10 times with 0.01 M phosphate-buffered saline (PBS) containing 0.01% Tween 20 (PBST) , and then incubated overnight at 4°C with anti-human PEPCK-C monoclonal antibody produced in mouse, diluted 1:1000 in the blocking buffer. After washing in PBST, the membrane was incubated for 2 h in horseradish peroxidase-conjugated goat anti-mouse IgG (Jackson Laboratory, Bar Harbor, ME), diluted 1:2000 in PBST. The membrane was washed, and the immunoreactive bands were detected by chemiluminescent reaction with WesternBright ECL HRP substrate (Advansta, Inc., Menlo Park, CA). Fluorographs were analyzed by densitometry using ImageJ. For protein abundance measurement, whole lysate was collected and subjected to Western-blot analysis. A polyclonal antibody against the A subunit of zebrafish H+-ATPase (20) diluted 1:1000 in the blocking buffer, was used to detect V-ATPase immunoreactive bands on PVDF membrane. The protein levels were normalized to that of β-actin detected by a rabbit anti-β-actin antibody (AB8227; Abcam, Cambridge, UK).
HR cell counting
The number of the HR cells was counted in the yolk-sac membrane of the control larvae and pck1 morphants injected with water or glucose into the yolk. At 3 dpf, the larvae were treated with acidic freshwater for 6 h, fixed in 4% paraformaldehyde (PFA) in PBS, and kept in 70% ethanol until subsequent procedure was performed. The samples were washed in PBST, blocked in the blocking reagent (Roche Applied Science), and incubated overnight in the anti-zebrafish H+-ATPase antibody diluted 1:1000 in the blocking reagent. After brief washing, the samples were further incubated in goat anti-rabbit IgG antibody labeled with Alexa 488 (Life Technologies) diluted 1:1000 in PBS. The fluorescent images of the larvae were obtained by a Leica TCS-SP5 confocal laser scanning microscope (Leica Lasertechnik, Heidelberg, Germany). In the fluorescent micrographs, the number of HR cells was counted in the area corresponding to 15,000 μm2 at the yolk-sac membrane.
Scanning ion-selective electrode technique (SIET) and measurement of ionic gradients
The SIET was used to measure H+ and NH4+ activities and fluxes at the skin and ionocyte surfaces of larvae. Glass capillary tubes (no. TW 150-4, World Precision Instruments, Sarasota, FL) were pulled on a Sutter P-97 Flaming Brown pipette puller (Sutter Instruments, San Rafael, CA) into micropipettes with tip diameters of 3-4 μm. These were then baked at 120 °C overnight and coated with dimethyl chlorosilane (Sigma-Aldrich) for 30 min. The micropipettes were backfilled with a 1-cm column of electrolytes and frontloaded with a 20-30 μm column of liquid ion-exchange cocktail (Sigma-Aldrich) to create an ion-selective microelectrode (probe). The following ionophore cocktails (and electrolytes) were used: H+ ionophore I cocktail B (40 mM KH2PO4 and 15 mM K2HPO4; pH 7) and NH4+ ionophore I cocktail B (100 mM NH4Cl). The details of the system were described in previous reports (46, 54). To calibrate the ion-selective probe, the Nernstian property of each microelectrode was measured by placing the microelectrode in a series of standard solutions (pH 6, 7, and 8 for the H+ probe and 0.1, 1, and 10 mM NH4Cl for the NH4+ probe; artificial freshwater standard solutions of different pH values were used for probing the medium). By plotting the voltage output of the probe against log[H+] and log[NH4+] values, a linear regression yielded Nernstian slopes of 57.5 ± 2.5 (n = 10) for H+ and 58.2 ± 0.6 (n = 10) for NH4+.
The SIET was performed at room temperature (26-28 °C) in a small plastic recording chamber filled with 2 ml of recording medium. The recording medium contained 0.5 mM NaCl, 0.2 mM CaSO4, 0.2 mM MgSO4, 300 μM Tricine buffer, and 0.03% tricaine. pH values of the recording media were adjusted to 7.0. Before the measurement, an anesthetized larva was positioned in the center of the chamber with its lateral side contacting the base of the chamber. To measure the H+ and NH4+ fluxes at the surface of the larva, the H+-selective and NH4+-selective probe were moved to the target positions (10 μm away from the skin surface), voltages were recorded for 1 min, and the median value was used to calculate the H+ and NH4+ activity. After recording at the skin surface, the probe was moved away from the skin (~10 mm) to record and calculate the background H+ and NH4+ activity. In this experiment, Δ[H+] was used to represent the H+ gradient between the target position and background.
Measurement of H+ and NH4+ flux at specific cells
To record the surface H+ and NH4+ fluxes at specific cells, the probe was moved to a position 1-2 μm above the apical membrane of cells. The voltage difference in microvolts was measured by probing orthogonally to the surface at 10-μm intervals. Ten replicates of recordings at a HR cell or keratinocyte were performed, and the median value was used for calculating the H+ and NH4+ flux of the cell. To calculate ionic flux, voltage differences were first converted into a concentration gradient ΔC (μmol·L-1·cm-3). ΔC was subsequently converted into ionic flux using Fick's law of diffusion in the following equation: J = D(ΔC)/ΔX, where J (pmol·cm-2·s-1) is the net flux of the ion, D is the diffusion coefficient of the ion (2.09 × 10⁻⁵ cm2/s for NH4+ and 9.4 × 10⁻⁵ cm2/s for H+), and ΔX (cm) is the distance between the two points. The detailed calculation of ionic flux was shown in previous reports (45, 54).
In situ hybridization
Whole-mount in situ hybridization was performed according to Thisse and Thisse (48). The fragments of the target genes were amplified with the primers listed in the Supplementary Table S2, and then inserted into pGEM T-Easy vector (Promega, Fitchburg, WI). The inserted fragments were amplified by PCR with T7 and SP6 primers, and the products served as templates for in vitro transcription with T7 or SP6 polymerase (Roche) in the presence of (DIG)-UTP to synthesize sense and antisense probes. 3 dpf zebrafish larvae maintained in 0.003% 1-phenyl 2-thiourea were anesthetized and fixed in 4% PFA in PBS overnight at 4°C, and then treated with methanol for at least 1 day. The samples were washed in PBST, and when it was necessary, treated with 10 μg/mL proteinase K in PBST for 30 min, fixed again in 4% PFA for 20 min, and then washed in PBST. According to Hayashi et al. (22), the samples were acetylated with 0.25% acetic anhydride in 0.1 M triethanolamine (pH 8.0) for 20 min, to reduce background staining. After washing in PBST, the samples were prehybridized in hybridization buffer (50% formamide, 5 x saline-sodium citrate buffer [SSC], and 0.1% Tween 20) containing 500 μg/mL yeast tRNA at 68-70°C for 2 h. The DIG-labeled probes (100 ng/300 μL) in the hybridization buffer were heated at 80°C for 10 min before hybridization of the samples with the probes at 68-70°C overnight. After hybridization, the samples were washed at 68-70°C in 2 x SSC (30 min) and 0.1 x SSC (30 min x 3). After washing in PBS at room temperature, the samples were blocked in the blocking reagent (Roche) for 2 h at 4°C, and then incubated with a peroxidase-conjugated anti-DIG antibody (Roche) diluted 1:10000 in the blocking reagent at 4°C overnight. The samples were then washed in PBST and alkaline Tris buffer (100 mM Tris HCl, pH 9.5, 50 mM MgCl2, 100 mM NaCl, and 0.1% Tween 20), followed by a staining reaction with nitro blue tetrazolium (NBT) and 5-bromo 4-chloro 3-indolyl phosphate (BCIP) in the alkaline Tris buffer. After checking signals in the samples, the reaction was terminated by washing in PBST. Background staining was further washed out with methanol, and then the samples were washed in PBST again, embedded in glycerol. For putative gls paralogs, the micrographs of the stained samples were taken under a Leica MZ16 microscope (Leica Microsystems) equipped with a Camedia C-3040ZOOM digital camera (Olympus Corporation, Tokyo). For glud1a, glud1b, g6pca.1, g6pca.2, pck1, and pck2, the micrographs were taken under a Z16 APO microscope (Leica Microsystems, Heerbrugg, Germany), equipped with a Leica DFC420 C digital camera (Leica Microsystems).
Amino acid analysis
100 larvae were collected in a tube, and homogenized in 2.5 mL ethanol with 12.5 nmol norvaline. After centrifugation at 4,300 g for 10 min, the 2 mL supernatant was transferred to a new tube, and dried in the vacuum concentrator (Concentrator 5301). The dried samples were then reconstituted in 100 μL of 8 mM HCl, filtered (Milliex-GN 0.2 μm cutoff; Millipore), and 10 μL of the filtrate was subjected to derivatization with AccQ Tag Ultra Derivatization Kit (Waters, Milford, MA). The derivatized samples were run on Acquity UPLC H-Class Amino Acid Analysis System (Waters), and each amino acid level in the samples was standardized to that of norvaline.
Malate and ammonium ion measurement
Malate content in the zebrafish larvae was measured with a commercial colorimetric malate assay kit (Biovision). 30 larvae were pooled in a 1.5 mL tube and immediately homogenized in 300 μL ice-cold PBS. After centrifugation at 13,000 g for 10 min, the supernatant was collected and heated at 70°C for 20 min to quench enzymatic activities. The samples were mixed together with the assay reagent in a clear microplate and incubated at 37°C for 30 min. The absorbance at 450 nm was measured with the microplate reader (Spectra Max M5). Body content of ammonium ion (NH4+) was measured by a method previously described by Holmes et al. (26). From 10-15 larvae, the samples were extracted and processed by the same procedure as malate measurement. 25 μL samples were mixed in a 96-well black microplate with 100 μL of NH4+ assay reagent containing orthophthaldialdehyde. The mixture of the samples and the assay reagent was incubated in room temperature for 150 min. The microplate was read with the microplate reader (Spectra Max M5) for the fluorometric assay, with the wavelength of excitation and emission at 360 and 420 nm, respectively.
Statistics
The values are expressed as means ± SE. The significance of difference at P <0.05 was examined by one-way or two-way analysis of variance (ANOVA) followed by Tukey's HSD test.
Results
Changes in glucose content and expression of gluconeogenic genes after acid exposure
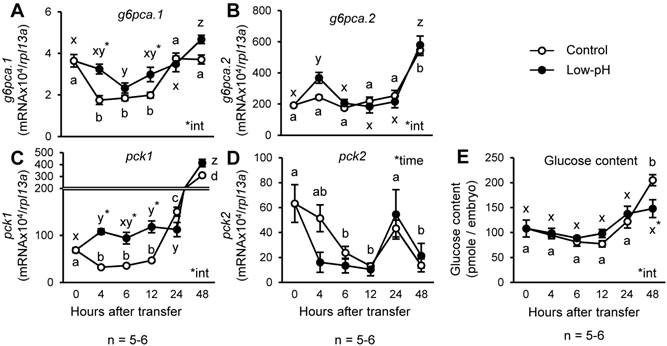
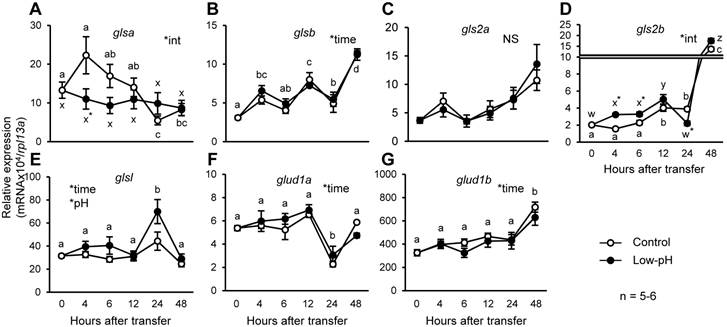
To understand the response of zebrafish gluconeogenic processes to acid stress, the zebrafish larvae at 3 dpf were transferred to low-pH environment, and changes in glucose levels and expression of the genes encoding gluconeogenic enzymes were assessed (Fig.1). Among the genes assessed, g6pca.1 and pck1 showed significantly higher expression levels in low-pH group until 12 h after acid treatment (Fig.1 A & C). However, body glucose content remained constant until 24 h after low-pH treatment, and then became significantly lower after 48 h in low-pH group (Fig. 1E).
Expression of pck1 transiently increases in response to low-pH stress. Changes in expression levels of g6pca.1 (A), g6pca.2 (B), pck1 (C), and pck2 (D) and body glucose content (E) were assessed in the zebrafish larvae after low-pH exposure. g6pca.1 (A) and pck1 (C) were up-regulated until 12 h after the onset of low-pH stress. Data are expressed as means ± SE. *time and *int indicate significant main effect of time and interaction of two factors (time x low-pH treatment), respectively. Different letters indicate significant differences at P < 0.05 between time points within each treatment group (a, b, c, … for control, and x, y, z, … for low-pH; in D, the two treatment groups are combined), and asterisks indicate the significant differences between treatments at the same time points.
Effects of pck1 knockdown and low-pH exposure on glucose production and H+ secretion
The zebrafish pck1 MO was generated and translation of Pck1 was inhibited (Fig. 2). By Western-blot analysis, a ~69 kDa immunoreactive band was detected in the samples prepared from control MO-injected larvae, while that of pck1-injected larvae was not detected (Fig. 2A). To understand the role of Pck1 during acute acidosis, the effect of pck1 knockdown in combination with 6-h low-pH treatment was assessed (Fig. 2B-E). While the control group showed 1.78-fold increase in Pck1 protein levels after 6-h acid treatment, pck1 morphants (the animals treated with MO) expressed still very low levels of this protein (Fig. 2B). Also, glucose content was significantly lower in pck1 morphants compared with control ones (Fig. 2C). Knockdown of pck1 decreased V-ATPase protein expression, although 6-h acid treatment partially recovered this effect (Fig. 2D). In addition, H+ secretion rate at the yolk-sac skin was increased after low-pH treatment in the control group, whereas that of pck1 morphant group remained constant (Fig. 2E).
Effects of glucose supplementation on H+ excretion from HR cells
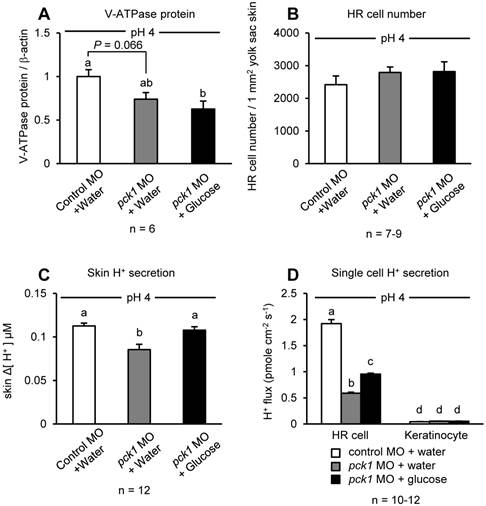
The possible recovering effect of glucose on H+ excretion in the pck1 morphants was tested by glucose injection to the yolk (Fig. 3). Similar to Fig. 2D, knockdown of pck1 tended to decrease V-ATPase protein levels, and this effect could not be rescued by glucose supplementation (Fig. 3A). The number of the HR cells was counted in these larvae, and there was no difference among the groups (Fig. 3B). However, the decreased excretion rate of H+ from the yolk-sac epithelia or single HR cells of pck1 morphants was rescued completely or partially (but significantly) by glucose supplementation (Fig. 3, C & D).
Glucose supplementation can rescue acid-induced H+ excretion affected by pck1 knockdown. Effects of pck1 knockdown and supplementation of glucose on the protein expression of V-ATPase (A), number of H+-ATPase rich (HR) cells (B), and H+ secretion from the yolk-sac skin (C) and single HR cells/Keratinocytes (D) were assessed. Glucose supplementation had no positive effects on V-ATPase expression and HR cell number; however, this treatment rescued H+ excretion from the larval yolk-sac skin or single HR cells. The sampling and H+ measurement were made after 6-h exposure to low-pH water. Open column, control MO + water; gray column, pck1 MO + water; black column, pck1 MO + glucose. Data are expressed as means ± SE. Different letters indicate significant differences at P < 0.05.
Changes in whole-body contents of amino acids and NH4+ after low-pH treatment
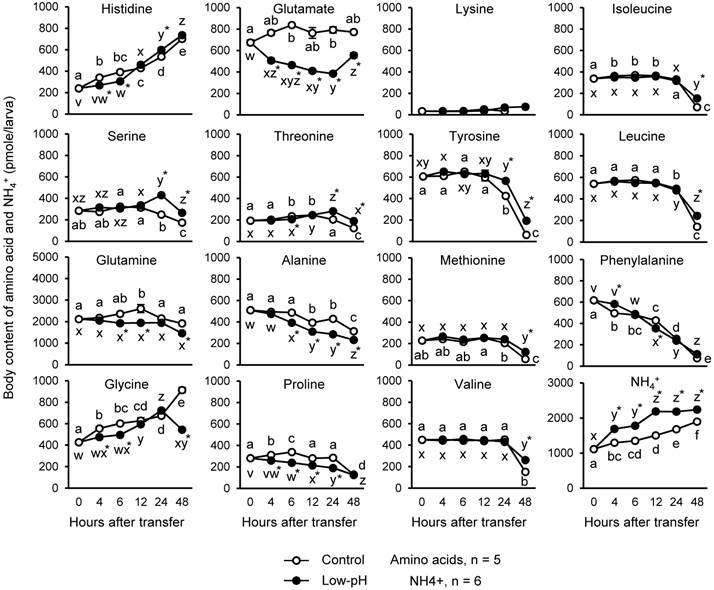
Since PEPCK subtracts Krebs cycle intermediates by converting oxaloacetate (OAA) into phosphoenolpyruvate (PEP), amino acids should be used to replenish the pool of Krebs cycle acids. For this reason, changes in body contents of amino acids after low-pH exposure were investigated (Fig. 4). Also, NH4+ levels were assessed as an indicator of the amino acid metabolism and H+ buffering (Fig. 4). In the low-pH group, glutamine showed a marked decrease (435 pmole/larva, 18.5%), followed by glutamate (~373 pmole/larva, 45%), compared to control at 6 h after transfer. The other amino acids significantly decreased after acid treatment were: (pmole/percent decreased compared to control group at 6-h time point) glycine, 106/17.6; proline, 99.6/29.5; alanine, 94.6/19.4; histidine, 86.2/22; threonine, 27.7/11.8. On the other hand, until 48 h after low-pH exposure, the levels of histidine, serine, threonine, tyrosine, methionine, valine, isoleucine, and leucine became significantly higher in low-pH group than in control group. Body content of NH4+ was increased immediately after low-pH treatment, and it remained higher in the low-pH group than the control until the end of the experiment.
Changes in the body contents of amino acids and NH4+ in the zebrafish larvae after low-pH treatment. Among the amino acids assessed, glutamine and glutamate showed marked decrease after low-pH treatment. Body NH4+ level was increased after exposure to low-pH medium. Open and closed circles indicate control and low-pH groups, respectively. Data are expressed as means ± SE. Different letters indicate significant differences at P < 0.05 between time points in each treatment group (a, b, c, … for control, and x, y, z, … for low-pH), and asterisks indicate the significant differences between treatments at the same time points.
mRNA localization of glutamate dehydrogenase and glutaminase isoforms
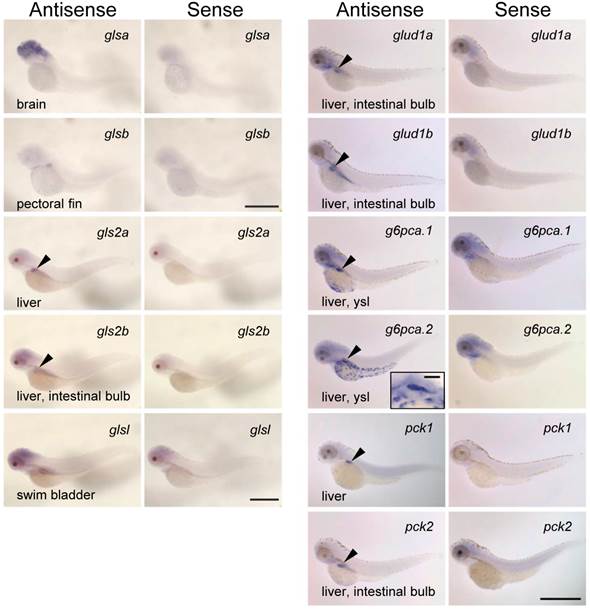
To further understand the roles of the zebrafish glutaminase/glutamate dehydrogenase isoforms, the expression patterns of glsa, glsb, gls2a, gls2b, glsl, glud1a, and glud1b were analyzed along with g6pca.1, g6pca.2, pck1, and pck2 in the 3 dpf larvae by in situ hybridization (Fig. 5). Localization of each mRNA is listed in Supplementary Table S3 with putative localization of their protein products, according to previous observations (3, 4, 7, 9, 33, 38). Among the genes assessed, gls2a, gls2b, glud1a, glud1b, g6pca.1, g6pca.2, pck1, and pck2 were expressed in the liver (Fig. 5). The mRNA localizations found in other than liver were: glsa, brain; glsb, pectoral fin; gls2b, intestinal bulb; glsl, swim bladder; glud1a, intestinal bulb; glud1b, intestinal bulb; g6pca.1, yolk syncytial layer; g6pca.2, yolk syncytial layer; pck2, intestinal bulb. Sense probes did not detect any specific signals.
Glutaminase, glutamate dehydrogenase, PEPCK and glucose-6-phosphatase genes are co-expressed in the liver. mRNA localization of zebrafish homologs of glutaminase (glsa, glsb, glsl, gls2a, and gls2b), glutamate dehydrogenase (glud1a and glud1b), glucose-6-phosphatase (g6pca.1 and g6pca.2), and phosphoenolpyruvate carboxykinase (pck1 and pck2) at 3-dpf larvae of zebrafish. The antisense probes detected gls2a, gls2b, glud1a, glud1b, g6pca.1, g6pca.2, pck1, and pck2 mRNAs expressed in the liver (arrowheads). Among these genes, gls2b, glud1a, glud1b, and pck2 were also expressed in the intestinal bulb. g6pca.1, g6pca.2 mRNAs were also expressed in the yolk syncytial layer. glsa, glsb, and glsl were expressed in the brain, pectoral fin, and swim bladder, respectively. Bars: g6pca.2 inset, 50 μm; the others, 500 μm.
Changes in gene expression levels of glutamate dehydrogenase and glutaminase
Conversions of glutamine into glutamate, and glutamate into α-ketoglutarate, are catalyzed by glutaminase and glutamate dehydrogenase, respectively. To understand the contribution of zebrafish homologs of these enzymes to the marked decrease in glutamate and glutamine in response to acid stress, changes in expression levels of the genes encoding zebrafish homologs of glutaminase and glutamate dehydrogenase after low-pH treatment were assessed (Fig. 6). Among glutaminase genes, glsa expression was significantly lower in low-pH group than in control group, at 4 h after exposure (Fig. 6A). On the other hand, the expression level of gls2b, encoding an isoform corresponding to mitochondrial glutaminase, was significantly increased after low-pH treatment, and remained higher than those in the control group until 6 h after exposure (Fig. 6D). Also, glsl was also highly expressed in low-pH groups compared to control groups (Fig. 6E). The expression levels of glutamate dehydrogenase genes were not affected by low-pH exposure (Fig. 6, F & G).
Expression of gls2b is transiently stimulated by low-pH stress. Changes in gene expression levels of glsa (A), glsb (B), gls2a (C), gls2b (D), glsl (E), glud1a (F), and glud1b (G) in the zebrafish larvae after low-pH treatment. gls2b expression significantly increased until 6 h after transfer to low-pH. glsl expression was also significantly higher in the low-pH groups. Data are expressed as means ± SE. *time and *pH indicate significant main effects of time and pH, respectively, and *int indicate interaction of two factors (time x low-pH treatment). NS, no significance. Different letters indicate significant differences at P < 0.05 between time points within each treatment group (a, b, c, … for control, and x, y, z, … for low-pH; in B, E, F, and G, the two treatment groups are combined), and asterisks indicate the significant differences between treatments at the same time points.
Effects of pck1 knockdown and acid stress on body contents of amino acids
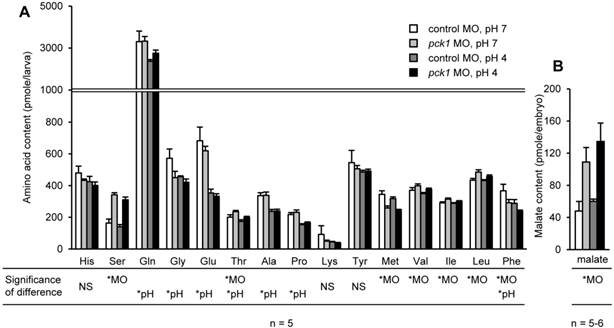
The combinational effects of pck1 knockdown and 6-h acid treatment on the body contents of amino acids and malate (a Krebs cycle intermediate) were assessed (Fig. 7). By pck1 MO treatment, levels of serine, threonine, valine, isoleucine, and leucine were significantly increased, while methionine was significantly decreased (Fig. 7A). Low-pH treatment decreased glutamine, glycine, glutamate, threonine, alanine, proline, and phenylalanine (Fig. 7A). The body content of malate was significantly increased in the pck1 morphants (Fig. 7B). In all amino acids and malate levels, the statistical significance of interaction between the two treatments was not detected (Fig. 7).
pck1 knockdown had no effect on acid-induced decrease in glutamine and glutamate levels, although Pck1-mediated cataplerosis is arrested. pck1 knockdown increased body contents of serine, threonine, valine, and isoleucine, but decreased those of methionine and phenylalanine (A). Low-pH stress decreased glutamine, glycine, glutamate, threonine, alanine, proline, and phenylalanine (A). Body content of malate, a Krebs cycle intermediate, was accumulated in the pck1 morphants (B). Data are expressed as means ± SE. *MO and *pH indicate significant main effects of pck1 MO and low-pH treatment, respectively. NS, no significance.
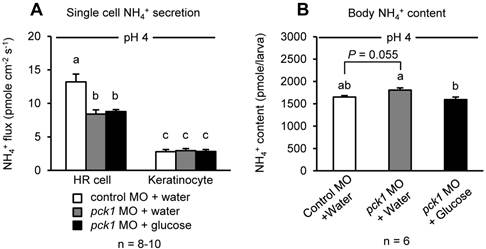
Effects of pck1 knockdown and glucose supplementation on NH4+ excretion from HR cells and body content of NH4+
Since H+ excretion rate affects NH4+ excretion in acid-base regulatory cells (45, 46, 53), the possible effects of pck1 knockdown and glucose supplementation on excretion and body content of NH4+ were assessed (Fig. 8). As in the case of H+ excretion, the rate of NH4+ excretion by HR cells also decreased in pck1 morphants (Fig. 8A). However, this decrease was not rescued by glucose treatment (Fig. 8A). The body content of NH4+ tended to increase in pck1 morphants, but that of glucose-supplemented group was comparable to the control (Fig. 8B).
Glucose supplementation does not rescue NH4+ excretion restricted by pck1 knockdown, but decreased body content of NH4+. Effects of pck1 knockdown and glucose supplementation on NH4+ excretion from single HR cells/keratinocytes (A) and body content of NH4+ (B). Excretion of NH4+ was restricted by pck1 knockdown, and glucose supplementation did not rescue this effect (A). NH4+ was accumulated in the pck1 morphant bodies, but glucose supplemented group could avert this effect. Data are expressed as means ± SE. Different letters indicate significant differences between the groups (P < 0.05).
Discussion
In the present study, the role of acid-induced PEPCK in acid secretion machinery was investigated in the zebrafish larvae. In the 3-dpf zebrafish larvae, mRNA (pck1) and protein (Pck1) expression of PEPCK homolog was induced by the exposure to low-pH (pH 4.0), in agreement with previous observations in the mammalian kidney (2, 8). In addition, expression of g6pca.1, a zebrafish homolog of glucose-6-phosphatase catalytic subunit a, was also induced by low-pH treatment. These results combined with the constant levels of body glucose content in low-pH group suggest the increased rate of production and consumption of glucose in response to acid stress.
By Western-blot analysis, a ~69 kDa band, which is the same size as deduced zebrafish Pck1, was detected in the samples prepared from control MO-injected larvae, suggesting the specificity of this antibody to zebrafish Pck1 (Fig. 2A, left lane). On the other hand, the corresponding band was not detected in pck1 MO-injected samples, showing successful knockdown of this enzyme (Fig. 2A, right lane). The zebrafish larvae increased H+ excretion from the yolk-sac epithelia in response to acute acid stress, which was not associated with changes in V-ATPase protein abundance. In such a short-term acclimation to acid stress, zebrafish may modulate the rate of H+ secretion by activation or membrane trafficking of, but not expression of, V-ATPase (20). On the other hand, when translation of Pck1 was blocked and glucose production via this pathway was limited by pck1 MO, the zebrafish larvae could not accelerate the secretion of H+ in response to the acid stress, suggesting that the expression of Pck1 induced by the acid is necessary for acute pumping of H+ in response to acid stress. Since glucose supplementation into the yolk could rescue the effect of pck1 knockdown on H+ excretion, Pck1-mediated glucose production clearly contributes to H+ secretion. The decrease in the rate of H+ secretion from single HR cells (about 68% of the control MO, Fig. 3D) was more profound than that detected from the yolk-sac skin (about 24% of the control MO, Fig. 3C) because the skin current is the net results from HR cells and other cells (mainly, the keratinocytes whose currents were not affected by pck1 knockdown, Fig. 3D). The recovery by the glucose supplementation was complete and partial, respectively, at the skin (Fig.3C) and the cellular levels (Fig. 3D). The H+ secretion by HR cells of pck1 morphants was increased 38.2% by glucose supplementation when compared to that without glucose treatment (Fig. 3D). Although the partial rescue appearance was observed by glucose treatment, the changes are statistically significant (P value = 0.0068) and of physiological importance in in vivo situation. On the other hand, the possible complementary supplement from other energy sources as well producible by PEPCK (e.g. pyruvate and lactate) cannot be excluded.
PEPCK-mediated gluconeogenesis requires Krebs cycle intermediates as a source for glucose production. In the zebrafish larvae at 3-5 dpf, the primary sources for such organic acids are the amino acids provided by the breakdown of yolk proteins. From this pool of amino acids, glutamine and glutamate markedly decreased after low-pH treatment. Taken together with the simultaneous increase in NH4+ levels, it is most likely that the catabolism of these amino acids was accelerated to provide more Krebs cycle intermediate (α-ketoglutarate) for Pck1-mediated gluconeogenesis. Proline and histidine are also glucogenic amino acids which are once converted to glutamate (5). Provided that zebrafish also possess enzymes needed for these reactions, these amino acids may also contribute to supply Krebs cycle intermediates for gluconeogenesis via glutamate. Since glycine and alanine showed significant decrease after acid exposure, these amino acids may also contribute to gluconeogenesis via pyruvate (5).
In situ hybridization analysis detected expression of two putative mitochondrial glutaminase genes, gls2a and gls2b in the liver, which also expressed glutamate dehydrogenase genes, glud1a and glud1b. Also, the gluconeogenic genes, g6pca.1 and g6pca.2, along with the two PEPCK genes, pck1 and pck2, were expressed in the liver. These results suggest that the series of reactions from glutamine/glutamate catabolism through glucose production can take place in the same tissue/cell. In the acid-treated larvae, the increased expression of gls2b may reflect the increased catabolism of glutamine in this group. It was an intriguing result that putative gls gene, glsl, was expressed in the swim bladder, and that this gene was highly expressed during acidosis, although their physiological significance is currently unclear. Interestingly, the expression levels of the glutamate dehydrogenase genes did not change after acid exposure, although the levels of glutamate strikingly decreased. Although we did not further assess the function of glutamate dehydrogenase homologs in zebrafish, the mechanisms regulating their activity may exist, such as ADP-ribosylation (25).
As stated above, the primary role of the increased PEPCK activity in the rat kidney during acidosis has been considered as cataplerosis to drive the high catabolic rate of glutamine and glutamate (10). Interestingly, in zebrafish larvae, knockdown of pck1 and blockade of cataplerosis, demonstrated by the accumulation of malate, did not affect reduction of glutamate and glutamine at least until 6 h after acid treatment. It is possible that the expression or activities of gls or glud increased in pck1 morphants for compensation, or although we have no data to support this notion, an activation of α-ketoglutarate dehydrogenase, which has been observed in the rat kidney (37), may have reduced cellular α-ketoglutarate concentration to drive glutamate catabolism under acute acidosis. In addition, serine was increased in pck1 morphants. Although there is no data to support this hypothesis as well, we inferred that the deamination of serine to pyruvate was inhibited by accumulation of Krebs cycle-acid, which may also affect pyruvate incorporation to this cycle, leading to accumulation of pyruvate in the cell. Further investigation in this enzyme will be necessary for precise understanding of glutamate catabolism and ammonia production in the acute phase of acid adaptation in zebrafish.
Since ambient H+ accelerates the ammonia excretion from zebrafish HR cells (45), the effects of pck1 knockdown and glucose supplementation on NH4+ excretion were examined in the HR cells. As expected, pck1 morphants showed lower levels of NH4+ excretion from the HR cells, and as a result, NH4+ tended to be accumulated in their bodies, probably because pck1 knockdown did not affect glutamine/glutamate catabolism and formation of NH4+. Although glucose could partially rescue excretion of H+ from HR cells, there was no increase in NH4+ excretion from these cells. Also, body content of NH4+ remained in the level comparable to control. Although further study will be necessary to fully understand the rationale for this result, we assume two possibilities at present: 1) glutamine/glutamate catabolism was not stimulated, because glucose supplement was beneficial to remove H+ immediately after acid treatment; 2) high glucose storage or any glycolysis metabolites inhibited glutamine/glutamate catabolism. If the above 1) is the case, the lower H+ excretion rate of HR cells from pck1 MO + glucose group than control after acid exposure may reflect successfully decreased H+ in their bodies until 6 h of treatment.
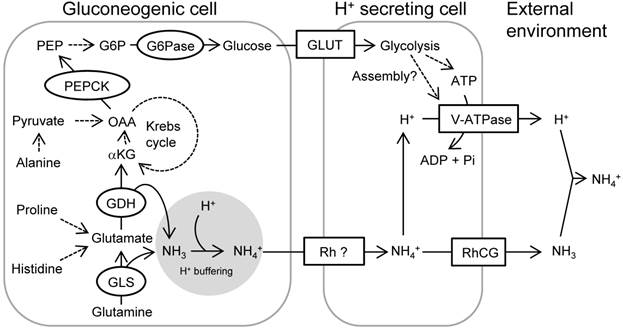
Glucose has been proposed to take an important role in acid-base regulation; however, there was no physiological and comprehensive evidence in vertebrate animals to support this hypothesis until the present study. The role of glucose on the function of V-ATPase was best studied in the yeast (see the review 51). While glucose is primarily an energy source to produce intracellular ATP, the studies in yeast demonstrated that glycolytic activity, but not its product (glucose-6-phosphate), is coupled with assembly of V-ATPase subunits, thus regulating ATP-driven H+ pumping (34, 42). In the porcine kidney epithelial cell line, LLC-PK1, glycolysis coupled with V-ATPase activity has also been observed (40). Actually, in the rat kidney, glycolytic enzymes are abundantly expressed in the distal nephron, where the acid secretion takes place (19). Since we did not investigate molecular mechanism of V-ATPase activation in the present study, it will be interesting to observe the assembly and activity of V-ATPase in the HR cells, after treatment with glycolysis inhibitors or supplementation of glucose-6-phosphate. In Fig. 9, we proposed a schematic outline of the role of PEPCK-mediated gluconeogenesis in the acute adaptation to acid stress. Catabolism of glutamine and glutamate by glutaminase and glutamate dehydrogenase, respectively, not only provides NH3 for H+ buffering, but also provides α-ketoglutarate to Krebs cycle, and the acceleration of this reaction may be further guaranteed by α-ketoglutarate dehydrogenase. PEPCK activity is readily induced by the acid stress, and perhaps with simultaneous increase in glucose-6-phosphatase activity, gluconeogenesis via this pathway is activated. Glucose drives V-ATPase in the H+ secreting cells for accelerated pumping of H+ and NH4+. In summary, by the use of zebrafish model, we demonstrated an important role of PEPCK-mediated gluconeogenesis in acid-base regulation. By utilizing the zebrafish model system, in which the SIET electrophysiology, gene knockdown, or pharmacological approaches are available in vivo, the role of many genes and physiological events regarding ion-regulating cells/epithelia may be further clarified in the future.
A schematic view showing acid-induced metabolism in the gluconeogenic cells buffering H+ and providing glucose for rapid pumping of H+. The activated mitochondrial glutaminase (GLS) and glutamate dehydrogenase (GDH) catalyze glutamine and glutamate, respectively, and provide α-ketoglutarate (αKG) into Krebs cycle while buffering H+ by generating NH3. Proline/histidine and alanine may also contribute to Krebs cycle acids via conversion to glutamate and pyruvate, respectively. Phosphoenolpyruvate carboxykinase (PEPCK) is activated in response to acid stress and drives gluconeogenesis. Glucose is utilized as a source for ATP or serves for assembly of V-ATPase, thus increasing excretion rate of H+ via this machinery. Excretion of NH4+ as the byproduct of H+ buffering may also be supported by this process. Broken arrows indicate that the pathways are unknown, include several steps with different enzymes, or not assessed in the present study. This figure was constructed with reference to previous observations (5, 6, 10, 30, 39, 45, 46, 53). Abbreviations: G6P, glucose-6-phosphate; G6Pase, glucose-6-phosphatase; GLS, glutaminase; GDH, glutamate dehydrogenase; GLUT, glucose transporter; αKG, α-ketoglutarate; NKA, Na+/K+-ATPase; OAA, oxaloacetate; PEP, phosphoenolpyruvate; PEPCK, PEP carboxykinase; RhCG, rhesus protein CG; Rh ?, unidentified rhesus protein; V-ATPase, Vacuolar-type H+- ATPase.
Supplementary Materials
Tables S1-S3.
Acknowledgements
This work was supported by grants to P.P.H. from Academia Sinica and the Ministry of Science and Technology of Taiwan, and the Grants-in-Aid for JSPS fellows (no. 13J05574) to F.F. from Japan Society for the Promotion of Science. We thank the Institute of Cellular and Organismic Biology Core Facility and the Taiwan Zebrafish Core Facility for technical support during the experiments.
Competing Interests
All authors have no conflict of interest to disclose.
References
1. Al-Awqati Q, Gao XB. Differentiation of intercalated cells in the kidney. Physiol. 2011;26:266-272
2. Alleyne GAO, Scullard GH. Renal metabolic response to acid base changes. J Clin Invest. 1969;48:364-370
3. Ballard FJ, Hanson RW. Phosphoenolpyruvate carboxykinase and pyruvate carboxylase in developing rat liver. Biochem J. 1967;104:866-871
4. Beale EG, Harvey BJ, Forest C. PCK1 and PCK2 as candidate diabetes and obesity genes. Cell Biochem Biophys. 2007;48:89-95
5. Bender DA. Amino acid metabolism (3rd Ed.). Hoboken, NJ: Wiley-Blackwell. 2012
6. Bishop JM, Verlander JW, Lee HW, Nelson RD, Weiner AJ, Handlogten ME, Weiner ID. Role of the Rhesus glycoprotein, Rh B glycoprotein, in renal ammonia excretion. Am J Physiol Renal Physiol. 2010;299:F1065-F1077
7. Botman D, Tigchelaar W, Van Noorden CJF. Determination of phosphate-activated glutaminase activity and its kinetics in mouse tissues using metabolic mapping (quantitative enzyme histochemistry). J Histochem Cytochem. 2014;62:813-826
8. Burch HB, Narins RG, Chu C, Fagioli S, Choi S, McCarthy W, Lowry OH. Distribution along the rat nephron of three enzymes of gluconeogenesis in acidosis and starvation. Am J Physiol. 1978;235:F246-F253
9. Burchell A, Allan BB, Hume R. Glucose-6-phosphatase proteins of the endoplasmic reticulum. Mol Membr Biol. 1994;11:217-227
10. Curthoys NP. Role of mitochondrial glutaminase in rat renal glutamine metabolism. J Nutr. 2001;131:2491S-2495S
11. Drewnowska KD, Craig MR, Digiovanni SR, McCarty JM, Moorman AFM, Lamers WH, Schoolwerth AC. PEPCK mRNA localization in proximal tubule and gene regulation during metabolic acidosis. J Physiol Pharmacol. 2002;53:3-20
12. Koeppen BM. The kidney and acid-base regulation. Adv Physiol Educ. 2009;33:275-281
13. Elo B, Villano CM, Govorko D, White LA. Larval zebrafish as a model for glucose metabolism: expression of phosphoenolpyruvate carboxykinase as a marker for exposure to anti-diabetic compounds. J Mol Endocrinol. 2007;38:433-440
14. Esaki M, Hoshijima K, Nakamura N, Munakata K, Tanaka M, Ookata K, Asakawa K, Kawakami K, Wang W, Weinberg ES, Hirose S. Mechanism of development of ionocytes rich in vacuolar-type H+-ATPase in the skin of zebrafish larvae. Dev Biol. 2010;329:116-129
15. Finbow ME, Harrison MA. The vacuolar H+-ATPase: a universe proton pump of eukaryotes. Biochem J. 1997;324:697-712
16. Finnigan GC, Hanson-Smith V, Stevens TH, Thornton JW. Evolution of increased complexity in a molecular machine. Nature. 2012;481:360-364
17. Goldstein L, Copenhaver Jr. JH. Relation of glutaminase I activity to glutamic acid concentration in the rat kidney. Am J Physiol. 1960;198:227-229
18. Goodman AD, Fuisz RE, Cahill Jr. GF. Renal gluconeogenesis in acidosis, alkalosis, and potassium deficiency: its possible role in regulation of renal ammonia production. J Clin Invest. 1966;45:612-619
19. Guder WG, Ross BD. Enzyme distribution along the nephron. Kidney Int. 1984;26:101-111
20. Guh YJ, Tseng YC, Yang CY, Hwang PP. Endothelin-1 regulates H+-ATPase-dependent transepithelial H+ secretion in zebrafish. Endocrinology. 2013;155:1728-1737
21. Gut P, Baeza-Raja B, Andersson O, Hasenkamp L, Hsiao J, Hesselson D, Akassoglou K, Verdin E, Hirschey MD, Stainier DYR. Whole-organism screening for gluconeogenesis identifies activators of fasting metabolism. Nat Chem Biol. 2013;9:97-104
22. Hayashi S, Gillam IC, Delaney AD, Tener GM. Acetylation of chromosome squashes of Drosophila melanogaster decreases the background in autoradiographs from hybridization with [125I]-labeled RNA. J Histochem Cytochem. 1978;26:677-679
23. Heilig C, Zaloga C, Lee M, Zhao X, Riser B, Brosius F, Cortes P. Immunogold localization of high-affinity glucose transporter isoforms in normal rat kidney. Lab Invest. 1995;73:674-684
24. Hering-Smith KS, Hamm LL. Metabolic support of collecting duct transport. Kidney Int. 1998;53:408-415
25. Herrero-Yraola A, Bakhit SM, Franke P, Schweiger M, Jorcke D, Ziegler M. Regulation of glutamate dehydrogenase by reversible ADP-ribosylation in mitochondria. EMBO J. 2001;20:2404-2412
26. Holmes RM, Aminot A, Kérouel R, Hooker BA, Peterson BJ. A simple and precise method for measuring ammonium in marine and freshwater ecosystems. Can J Fish Aquat Sci. 1999;56:1801-1808
27. Horng JL, Lin LY, Huang CJ, Katoh F, Kaneko T, Hwang PP. Knockdown of V-ATPase subunit A (atp6v1a) impairs acid secretion and ion balance in zebrafish (Danio rerio). Am J Physiol Regul Integr Comp Physiol. 2007;292:R2068-R2076
28. Horng JL, Lin LY, Hwang PP. Functional regulation of H+-ATPase-rich cells in zebrafish embryos acclimated to an acidic environment. Am J Physiol Cell Physiol. 2009;296:C682-C692
29. Hsiao C, Guh Y, Ma M, Jiang Y, Hwang PP. A positive regulatory loop between foxi3a and foxi3b is essential for specification and differentiation of zebrafish epidermal ionocytes. PLoS ONE. 2007;2:e302
30. Hwang PP, Lee TH, Lin LY. Ion regulation in fish gills: recent progress in the cellular and molecular mechanisms. Am J Physiol Regul Integr Comp Physiol. 2011;301:R28-R47
31. Hwang PP, Chou MY. Zebrafish as an animal model to study ion homeostasis. Eur J Physiol. 2013;465:1233-1247
32. Jurczyk A, Roy N, Bajwa R, Gut P, Lipson K, Yang C, Covassin L, Racki WJ, Rossini AA, Phillips N, Stainier DYR, Greiner DL, Brehm MA, Bortell R, diIorio P. Dynamic glucoregulation and mammalian-like responses to metabolic and developmental disruption in zebrafish. Gen Comp Endocrinol. 2011;170:334-345
33. Kalra J, Brosnan JT. The subcellular localization of glutaminase isoenzymes in rat kidney cortex. J Biol Chem. 1974;249:3255-3260
34. Kane PM. Disassembly and reassembly of the yeast vacuolar H+-ATPase in vivo. J Biol Chem. 1995;270:17025-17032
35. Lee YC, Yan JJ, Cruz SA, Horng JL, Hwang PP. Anion exchanger 1b, but not sodium-bicarbonate cotransporter 1b, plays a role in transport functions of zebrafish H+-ATPase-rich cells. Am J Physiol Cell Physiol. 2011;300:C295-C307
36. Lin LY, Horng JL, Kunkel JG, Hwang PP. Proton pump-rich cell secretes acid in skin of zebrafish larvae. Am J Physiol Cell Physiol. 2006;290:C371-C378
37. Lowry M, Ross BD. Activation of oxoglutarate dehydrogenase in the kidney in response to acute acidosis. Biochem J. 1980;190:771-780
38. Mastorodemos V, Kotzamani D, Zaganas I, Arianoglou G, Latsoudis H, Plaitakis A. Human GLUD1 and GLUD2 glutamate dehydrogenase localize to mitochondria and endoplasmic reticulum. Biochem Cell Biol. 2009;87:505-516
39. Nakada T, Hoshijima K, Esaki M, Nagayoshi S, Kawakami K, Hirose S. Localization of ammonia transporter Rhcg1 in mitochondrion-rich cells of yolk sac, gill, and kidney of zebrafish and its ionic strength-dependent expression. Am J Physiol Regul Integr Comp Physiol. 2007;293:R1743-R1753
40. Nakamura S. Glucose activates H+-ATPase in kidney epithelial cells. Am J Physiol. 2004;287:C97-C105
41. Owen OE, Kalhan SC, Hanson RW. The key role of anaplerosis and cataplerosis for citric acid cycle function. J Biol Chem. 2002;277:30409-30412
42. Parra KJ, Kane PM. Reversible association between the V1 and V0 domains of yeast vacuolar H+-ATPase is an unconventional glucose-induced effect. Mol Cell Biol. 1998;18:7064-7074
43. Prudent J, Popgeorgiev N, Bonneau B, Gillet G. Subcellular fractionation of zebrafish embryos and mitochondrial calcium uptake application. Protocol Exchange. 2013 DOI:10.1038/protex.2013.073
44. Rocha F, Dias J, Engrola S, Gavaia P, Geurden I, Dinis MT, Panserat S. Glucose overload in yolk has little effect on the long-term modulation of carbohydrate metabolic genes in zebrafish (Danio rerio). J Exp Biol. 2014;217:1139-1149
45. Shih TH, Horng JL, Hwang PP, Lin LY. Ammonia excretion by the skin of zebrafish (Danio rerio) larvae. Am J Physiol Cell Physiol. 2008;295:C1625-C1632
46. Shih TH, Horng JL, Lai YT, Lin LY. Rhcg1 and Rhbg mediate ammonia excretion by ionocytes and keratinocytes in the skin of zebrafish larvae: H+-ATPase-linked active ammonia excretion by ionocytes. Am J Physiol Integr Comp Physiol. 2013;304:R1130-R1138
47. Tang R, Dodd A, Lai D, McNabb WC, Love DR. Validation of zebrafish (Danio rerio) reference genes for quantitative real-time RT-PCR normalization. Acta Biochim Biophys Sin. 2007;39:384-390
48. Thisse C, Thisse B. High-resolution in situ hybridization to whole-mount zebrafish embryos. Nat Protoc. 2008;3:59-69
49. Thorens B, Lodish HF, Brown D. Differential localization of two glucose transporter isoforms in rat kidney. Am J Physiol. 1990;259:C286-C294
50. Tseng YC, Chen RD, Lee JR, Liu ST, Lee SJ, Hwang PP. Specific expression and regulation of glucose transporters in zebrafish ionocytes. Am J Physiol Regul Integr Comp Physiol. 2009;297:R275-R290
51. Wagner CA, Finberg KE, Breton S, Marshansky V, Brown D, Geibel JP. Renal vacuolar H+-ATPase. Physiol Rev. 2004;84:1263-1314
52. Wagner CA, Devuyst O, Bourgeois S, Mohebbi N. Regulated acid-base transport in the collecting duct. Eur J Physiol. 2009;458:137-156
53. Wagner CA, Devuyst O, Belge H, Bourgeois S, Houillier P. The rhesus protein RhCG: a new perspective in ammonium transport and distal urinary acidification. Kidney Int. 2011;79:154-161
54. Wu SC, Horng JL, Liu ST, Hwang PP, Wen ZH, Lin CS, Lin LY. Ammonium-dependent sodium uptake in mitochondrion-rich cells of medaka (Oryzias latipes) larvae. Am J Physiol Cell Physiol. 2010;298:C237-C250
Author contact
![]() Corresponding author: Pung-Pung Hwang, Institute of Cellular and Organismic Biology, Academia Sinica, Nankang, Taipei, Taiwan. Phone: +886-2-2789-9521; Fax: +886-2-2789-9576; e-mail: pphwangsinica.edu.tw
Corresponding author: Pung-Pung Hwang, Institute of Cellular and Organismic Biology, Academia Sinica, Nankang, Taipei, Taiwan. Phone: +886-2-2789-9521; Fax: +886-2-2789-9576; e-mail: pphwangsinica.edu.tw