Impact Factor ISSN: 1449-2288
- Issue 12; 2026
- Issue 11; 2026
- Issue 10; 2026
- Issue 9; 2026
- Issue 8; 2026
- Volume 22; 2026
- Past Issues
- Advance Articles
- Editorial Board
- Cover Images
- Index & Coverage
- Cover Suggestion
- Special Issues
Introduction
Materials and methods
Results
Discussion
Conclusion
Supplementary Material
Acknowledgements
References

 Global reach, higher impact
Int J Biol Sci 2016; 12(5):489-504. doi:10.7150/ijbs.12148 This issue Cite
Research Paper
Phylogenetic inference of calyptrates, with the first mitogenomes for Gasterophilinae (Diptera: Oestridae) and Paramacronychiinae (Diptera: Sarcophagidae)
Dong Zhang1 ![]() *, Liping Yan1*, Ming Zhang1, Hongjun Chu3, Jie Cao 4, Kai Li1, Defu Hu1, Thomas Pape 2
*, Liping Yan1*, Ming Zhang1, Hongjun Chu3, Jie Cao 4, Kai Li1, Defu Hu1, Thomas Pape 2
1. School of Nature Conservation, Beijing Forestry University, Beijing, China.
2. Natural History Museum of Denmark, University of Copenhagen, Copenhagen, Denmark.
3. Wildlife Conservation Office of Altay Prefecture, Altay, Xinjiang, China.
4. Xinjiang Research Centre for Breeding Przewalski's Horse, Ürümqi, Xinjiang, China.
* These authors contributed equally to this study.
Received 2015-3-16; Accepted 2015-12-22; Published 2016-2-20
Abstract

The complete mitogenome of the horse stomach bot fly Gasterophilus pecorum (Fabricius) and a near-complete mitogenome of Wohlfahrt's wound myiasis fly Wohlfahrtia magnifica (Schiner) were sequenced. The mitogenomes contain the typical 37 mitogenes found in metazoans, organized in the same order and orientation as in other cyclorrhaphan Diptera. Phylogenetic analyses of mitogenomes from 38 calyptrate taxa with and without two non-calyptrate outgroups were performed using Bayesian Inference and Maximum Likelihood. Three sub-analyses were performed on the concatenated data: (1) not partitioned; (2) partitioned by gene; (3) 3rd codon positions of protein-coding genes omitted. We estimated the contribution of each of the mitochondrial genes for phylogenetic analysis, as well as the effect of some popular methodologies on calyptrate phylogeny reconstruction. In the favoured trees, the Oestroidea are nested within the muscoid grade. Relationships at the family level within Oestroidea are (remaining Calliphoridae (Sarcophagidae (Oestridae, Pollenia + Tachinidae))). Our mito-phylogenetic reconstruction of the Calyptratae presents the most extensive taxon coverage so far, and the risk of long-branch attraction is reduced by an appropriate selection of outgroups. We find that in the Calyptratae the ND2, ND5, ND1, COIII, and COI genes are more phylogenetically informative compared with other mitochondrial protein-coding genes. Our study provides evidence that data partitioning and the inclusion of conserved tRNA genes have little influence on calyptrate phylogeny reconstruction, and that the 3rd codon positions of protein-coding genes are not saturated and therefore should be included.
Keywords: mitogenome, gene contribution, taxon sampling, long-branch attraction, phylogeny, Oestroidea, Calyptratae.
Introduction
During the last decade, phylogeny reconstruction of extant life forms has shifted from being mainly morphology-based to currently relying primarily on evidence from molecular data. Just as for morphological data, it is imperative that we acquire an in-depth understanding of the information content and suitability of the sequence data used in the analysis. The mitochondrial genome, with its multiple copies in each cell, as well as the design of conserved primers for broad-scale amplification [1], has been dominating until the advent of next generation sequencing [2]. Still, as the mitochondrial genome appears to evolve faster than the nuclear genome [3-5], it should have the potential for a finer phylogenetic resolution (or higher branch support values) in fast-evolving groups. Mitogenomes are thought to be reliable markers for reconstructing phylogenies [5], but the use of mitochondrial data in deep phylogeny analyses has been criticized because of biases in nucleotide frequencies, high substitution rates of nucleotides, and different phylogenetic information content among genes [6-12]. Further, although complete mitogenomes provide high phylogenetic resolution and the most accurate dating estimates, phylogenetic estimates based on complete and incomplete mitogenomes have yielded inconsistent phylogenies for insects [13, 14], and vertebrates as well [8, 15], indicating conflicts between the phylogenetic signals provided by the different mitochondrial genes. Mitogenomes are therefore of considerable interest in evolutionary studies, and the aim of the present paper is to investigate the phylogenetic signal contained in the mitogenome for members of the large subradiation of the schizophoran flies termed Calyptratae.
The nearly 20 000 described species of calyptrate flies comprise the largest and ecologically most diverse clade within the schizophoran super-radiation [11, 16, 17]. Several phylogenetic studies, utilizing morphological and molecular data, have been conducted at different taxonomic levels within this group, but the phylogenetic relationships within major parts of this fly radiation are still controversial [17-39]. Inferring a robust phylogeny of the Calyptratae will require the combination of a sufficiently informative dataset with carefully selected terminal taxa [6, 40, 41].
At present, there are 36 complete or near-complete mitogenome sequences of calyptrate species in GenBank, representing the muscoid families Anthomyiidae, Fanniidae, Muscidae, and Scathophagidae, as well as several families of the Oestroidea. We sequenced the complete mtDNA of the stomach bot fly Gasterophilus pecorum (Fabricius), as the first representative of the bot fly subfamily Gasterophilinae (Oestridae), and provide a near-complete mitogenome of Wohlfahrtia magnifica (Schiner) as the first representative of the subfamily Paramacronychiinae (Sarcophagidae). We use these data to reconstruct calyptrate phylogeny and discuss mitogenomic performance.
Materials and methods
Taxon sampling
Complete (or near-complete) mitogenomes from a total of 38 calyptrate taxa and 2 non-calyptrate taxa were obtained by downloading existing data from GenBank and adding two mitogenomes (Table 1). All four families of the muscoid grade are represented, but the Hippoboscoidea are not represented because no mitogenomes are available for that clade. The family-level classification of the Oestroidea is not yet settled, primarily because of the long-standing issue of resolving the non-monophyletic status of the blow flies [17, 33]. We include representatives from the traditional Calliphoridae, the Tachinidae, the Sarcophagidae (adding the first species from subfamily Paramacronychiinae) and the Oestridae (adding the first species from subfamily Gasterophilinae). We include one representative from each of the tachinid subfamilies Exoristinae and Phasiinae but exclude Exorista sorbillans (Wiedemann) (Tachinidae) [66] because a BLAST search places it close to Drosophila and widely removed from other species of the family. No mitogenome is available for the small family Rhinophoridae. Two non-calyptrate outgroup taxa are chosen to root the tree: the lower brachyceran species Cydistomyia duplonotata (Ricardo) (Tabanidae) and the acalyptrate species Drosophila melanogaster (Meigen) (Drosophilidae).
Summary of mitogenomes from Calyptratae, and two outgroup species.
| Superfamily | Family | Subfamily | Species | Locus | Reference |
|---|---|---|---|---|---|
| Tabanoidea | Tabanidae | Tabanidae | Cydistomyia duplonotata * | NC_008756 | [14] |
| Ephydroidea | Drosophilidae | Drosophila melanogaster * | NC_024511 | [42] | |
| Oestroidea | Calliphoridae | Calliphorinae | Aldrichina grahami | KP872701 | [43] |
| Calliphorinae | Calliphora vicina | NC_019639 | [44] | ||
| Chrysomyinae | Cochliomyia hominivorax | NC_002660 | [45] | ||
| Chrysomyinae | Chrysomya albiceps | NC_019631 | [44] | ||
| Chrysomyinae | Chrysomya bezziana | NC_019632 | [44] | ||
| Chrysomyinae | Chrysomya megacephala | NC_019633 | [44] | ||
| Chrysomyinae | Chrysomya pinguis | NC_025338 | [46] | ||
| Chrysomyinae | Chrysomya putoria | NC_002697 | [47] | ||
| Chrysomyinae | Chrysomya rufifacies | NC_019634 | [44] | ||
| Chrysomyinae | Chrysomya saffranea | NC_019635 | [44] | ||
| Chrysomyinae | Phormia regina | NC_026668 | [48] | ||
| Chrysomyinae | Protophormia terraenovae | NC_019636 | [44] | ||
| Luciliinae | Hemipyrellia ligurriens | NC_019638 | [44] | ||
| Luciliinae | Lucilia cuprina | NC_019573 | [44] | ||
| Luciliinae | Lucilia porphyrina | NC_019637 | [44] | ||
| Luciliinae | Lucilia sericata | NC_009733 | [49] | ||
| Polleniinae | Pollenia rudis | JX913761 | [44] | ||
| Sarcophagidae | Paramacronychiinae | Wohlfahrtia magnifica | — | Present study | |
| Sarcophaginae | Ravinia pernix | NC_026196 | [50] | ||
| Sarcophaginae | Sarcophaga africa | NC_025944 | [51] | ||
| Sarcophaginae | Sarcophaga crassipalpis | NC_026667 | [52] | ||
| Sarcophaginae | Sarcophaga impatiens | NC_017605 | [53] | ||
| Sarcophaginae | Sarcophaga melanura | NC_026112 | [54] | ||
| Sarcophaginae | Sarcophaga peregrina | NC_023532 | [55] | ||
| Sarcophaginae | Sarcophaga portschinskyi | NC_025574 | [56] | ||
| Sarcophaginae | Sarcophaga similis | NC_025573 | [57] | ||
| Tachinidae | Exoristinae | Elodia flavipalpis | NC_018118 | [58] | |
| Dexiinae | Rutilia goerlingiana | NC_019640 | [44] | ||
| Oestridae | Cuterebrinae | Dermatobia hominis | NC_006378 | [59] | |
| Gasterophilinae | Gasterophilus pecorum | — | Present study | ||
| Hypodermatinae | Hypoderma lineatum | NC_013932 | [60] | ||
| Muscoid grade | Anthomyiidae | Delia platura | KP901268 | [61] | |
| Fanniidae | Euryomma sp. | KP901269 | [61] | ||
| Muscidae | Muscinae | Haematobia irritans | NC_007102 | [62] | |
| Muscinae | Musca domestica | NC_024855 | [63] | ||
| Muscinae | Stomoxys calcitrans | DQ533708 | [62] | ||
| Reinwardtiinae | Muscina stabulans | NC_026292 | [64] | ||
| Scathophagidae | Scathophaginae | Scathophaga stercoraria | NC_024856 | [65] |
* Species used as outgroups in subgroup_1.
DNA extraction, amplification, sequencing, and annotation
A single larva of G. pecorum, collected in 99.5% ethanol in Kalamaili, Xinjiang Province, China, in 2013, and a dry specimen of male W. magnifica, hatched from a larva collected in Xinjiang Research Centre for Breeding Przewalski's Horse, Ürümqi, Xinjiang, China, in 2014, served as sources of mitogenomic DNA. Muscular tissue was transferred to an Eppendorf tube, incubated in splitting solution with proteinase K (Beijing Cowin Biosciencee Co., Ltd., China) at 56℃ for three hours, and DNA was isolated with phenol-chloroform (MYM Biological Technology Ltd., India). After extraction in ethanol, genomic DNA was dissolved in Tris-EDTA buffer and stored at -20℃ until use.
The mitochondrial genomes were amplified by Polymerase Chain Reaction (PCR) using 16 primer pairs (Table S1) synthesized by Beijing Genomics Institute. Genomic DNA (1 μL) was added to the PCR reaction mix (24 μL), which contained 17.2 μL sterilized distilled water, 2.5 μL of 10× Es Taq PCR Buffer (Beijing Cowin Biosciencee Co., Ltd., China), 2 μL of dNTPs mixture (2.5 mM each) (Beijing Cowin Biosciencee Co., Ltd., China), 1 μL of each primer (10 μM), and 0.3 μL of Es Taq DNA Polymerase (1.5 U) (Beijing Cowin Biosciencee Co., Ltd., China). The PCR was performed in a thermal cycler, using the cycling protocols reported in Table S1 for each primer combination. The polymerase activation (95℃, 10 min), the denaturation (95℃, 1 min), the final extension (72℃, 7 min) and the number of cycles (n = 35) were identical in all of the protocols [60]. The PCR products were detected via electrophoresis in 0.5% agarose gels and sized by comparison with markers (Beijing Cowin Biosciencee Co., Ltd., China). Gels were photographed using a gel documentation system. Amplicons were sequenced bidirectionally using the BigDye® Terminator v3.1 Cycle Sequencing Kit (Applied Biosystems, Inc., USA), and then purified using BigDye XTerminator® Purification Kit (Applied Biosystems, Inc., USA). Sequences were read with Chromas (Technelysium, Ltd., Australia), after running an ABI 3730xl DNA analyzer (Applied Biosystems, Inc., USA.).
The software BioEdit version v7.0.9.0 [69] and SeqMan (DNAStar, Steve ShearDown, 1998-2001 version, DNASTAR Inc., USA) were used for assembly of raw sequences. Gene boundaries and genomic positions of protein-coding genes (PCGs), ribosomal RNA genes, and transfer RNA genes were identified by BLAST search [70], MITOS search [71], and by comparing with other calyptrates using DNAMAN software (version 8, Lynnon Corp., Canada). Nucleotide composition and codon usage were calculated using MEGA 5.2 [72].
Estimates of genetic divergence of mitochondrial genes
Genetic divergence was evaluated by calculating the mean evolutionary distances of each of the PCGs, rRNA genes, and concatenation of 13 PCGs, 2 rRNA genes, and 22 tRNA genes respectively from MEGA 5.2 under an uncorrected p-distance model. Uncorrected p-distances were calculated in MEGA 5.2 and obtained between species and averaged for each gene or combination of genes at three levels: within subfamily, within family, and within superfamily.
The percentage of gaps and percentage of conserved positions for each of the 13 PCGs were calculated following Nardi et al. [73].
Nucleotide substitution saturation
Nucleotide substitution saturation analyses were performed for each of the 13 PCGs, for the 1st & 2nd codon positions combined, and for the 3rd codon positions, using MEGA 5.2 following Huang [74].
Phylogenetic analysis
Phylogenetic analyses were conducted with (subgroup_1) or without (subgroup_2) the non-calyptrate outgroups (Table 2).
Summary of datasets used to perform phylogenetic analyses.
| Taxa | Dataset | Subanalyses | Models |
|---|---|---|---|
| subgroup_1 (40 species, 2 outgroups) | ALL: PCGs, rRNA genes, and a concatenation of tRNA genes. | Not partitioned | GTR + I + G |
| Partitioned by genes | P1 (ND2, COI, COII, ATP8, ATP6, COIII, ND3, ND6, CYTB) GTR + I + G P2 (ND5, ND4, ND4L, ND1) GTR + I + G P3 (lrRNA, srRNA, tRNA) GTR + I + G | ||
| Without 3rd codon positions of PCGs | GTR + I + G | ||
| PCG&rRNA: PCGs, rRNA genes. | Not partitioned | GTR + I + G | |
| Partitioned by genes | P1 (ND2, COI, COII, ATP8, ATP6, COIII, ND3, ND6, CYTB) GTR + I + G P2 (ND5, ND4, ND4L, ND1) GTR + I + G P3 (lrRNA, srRNA) GTR + I + G | ||
| Without 3rd codon positions of PCGs | GTR + I + G | ||
| subgroup_2 (38 species, rooted using Euryomma as outgroup) | ALL: PCGs, rRNA genes, and a concatenation of tRNA genes. | Not partitioned | GTR + I + G |
| Partitioned by genes | P1 (ND2, COI, COII, ATP8, ATP6, COIII, ND3, ND6, CYTB) GTR + I + G P2 (ND5, ND4, ND4L, ND1) GTR + I + G P3 (lrRNA, srRNA, tRNA) GTR + I + G | ||
| Without 3rd codon positions of PCGs | GTR + I + G | ||
| PCG&rRNA: PCGs, rRNA genes. | Not partitioned | GTR + I + G | |
| Partitioned by genes | P1 (ND2, COI, COII, ATP8, ATP6, COIII, ND3, ND6, CYTB) GTR + I + G P2 (ND5, ND4, ND4L, ND1) GTR + I + G P3 (lrRNA, srRNA) GTR + I + G | ||
| Without 3rd codon positions of PCGs | GTR + I + G |
For both subgroups, two phylogenetic analyses were conducted: (1) using PCGs and rRNA genes, (2) using PCGs, rRNA genes and the concatenated tRNA genes. Phylogenetic trees were constructed using three partitioning approaches: (1) not partitioned; (2) partitioned by gene, and; (3) excluding 3rd codon positions of PCGs, not partitioned.
Each of the mitochondrial genes were aligned separately using MUSCLE [75], as implemented in MEGA 5.2. For protein-coding genes, nucleotide sequences were aligned after translation into amino acid sequences by reference, and then back-translated for analysis as nucleotide sequences. The 22 tRNA genes were aligned separately and then concatenated as a combined partition, as all individual tRNA genes are very short. Amino acid and nucleotide sequences were aligned using default settings. Individually aligned genes were then concatenated using SequenceMatrix [76] for phylogenetic analyses.
MrModeltest 2.3 [77] was used to select the best model for the non-partitioned data set, and for the data set that excluded the 3rd codon position of PCGs. PartitionFinder v1.1.1 [78] was used to evaluate the best partitioning scheme for the partitioned datasets (Table 2), after using the “greedy” algorithm with branch lengths estimated as ''unlinked”, following the Bayesian Information Criterion (BIC).
Phylogenetic trees were inferred using Bayesian, and Maximum Likelihood (ML) methods. Bayesian analyses were performed with MrBayes v3.2.1 [79] on CIPRES (Cyberinfrastructure for Phylogenetic Research) Science Gateway [80]. Two independent runs were conducted, each with four chains (one cold and three hot chains), for 10 million generations and samples were drawn every 1000 generations. The first 25% of steps were discarded as burn-in. For both partitioned and unpartitioned data, the Maximum Likelihood analyses were performed with the RaxML [81], using the rapid hill-climbing algorithm starting from 100 randomized maximum parsimony trees. Node supports were evaluated via bootstrap tests with 1000 iterations.
Phylogenetic examination of separate genes
The Ktreedist program [82] was used to evaluate the relative contribution of each single mitochondrial gene to the construction of the phylogenetic tree. Bayesian analyses were performed using each of the 13 PCGs and the two rRNA genes as described above, and k-scores were calculated by comparing each of these trees with a reference tree obtained by a Bayesian analysis of the non-partitioned dataset of 13 PCGs and two rRNA genes for subgroup_2.
Abbreviations
ATP6: ATP synthase subunit 6 gene; ATP8: ATP synthase subunit 8 gene; COI: cytochrome c oxidase subunit I gene; COII: cytochrome c oxidase subunit II gene; COIII: cytochrome c oxidase subunit III gene; CYTB: cytochrome b gene; ML: Maximum Likelihood; ND1: NADH dehydrogenase subunit 1 gene; ND2: NADH dehydrogenase subunit 2 gene; ND3: NADH dehydrogenase subunit 3 gene; ND4: NADH dehydrogenase subunit 4 gene; ND4L: NADH dehydrogenase subunit 4L gene; ND5: NADH dehydrogenase subunit 5 gene; ND6: NADH dehydrogenase subunit 6 gene; PCGs: protein-coding genes; lrRNA: large ribosomal RNA; srRNA: small ribosomal RNA; rRNA: ribosomal RNA; tRNA: transfer RNA.
Results
General features of the Gasterophilus pecorum and Wohlfahrtia magnifica mitogenomes
The complete mitogenome of G. pecorum (15 750 bp) and near-complete mitogenome of W. magnifica (14 705 bp) were sequenced (GenBank accession numbers KU578262-KU578263). The control region of W. magnifica could not be amplified, resulting in the failure to sequence tRNAIle.
Both sequences are similar to all known calyptrates, both in the order and orientation of genes. They are circular molecules containing all 37 genes usually present in bilaterians: 13 PCGs, 22 tRNA genes, and 2 rRNA genes (Fig. 1, Table S2). The control regions are located at the same site (between srRNA and tRNAIle genes) as found in other calyptrate flies for which the complete mtDNA sequences are available [44, 45, 47, 49, 58-60, 62].
Mitochondrial genome maps of Gasterophilus pecorum (Fabricius) and Wohlfahrtia magnifica (Schiner). Gene names without underline indicate that these genes are coded on (+) strand, while those with underline are on the (-) strand. Transfer RNA (tRNA) genes are designated by single-letter amino acid codes. White colored regions indicate those failed to sequence.
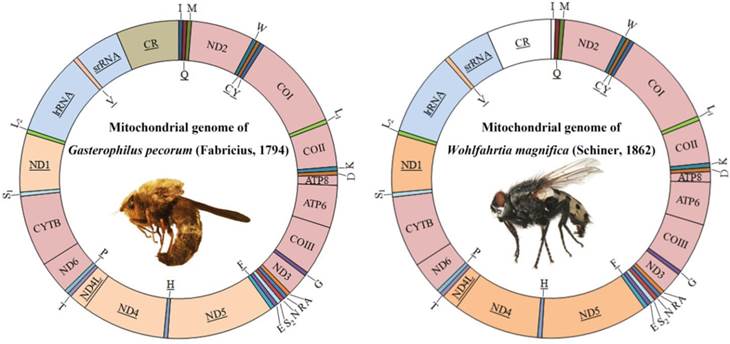
The start codons of all protein-coding genes were compared with data available from other dipterans. All protein-coding genes, except COI, have one of the common start codons for mitochondrial DNA: ATG, ATA, or ATT (Table S2). The start codon of COI was identified as TCG. COI has been reported using a nonstandard start codon in species belonging to the Calyptratae [43-65]. TAA, TAG and T stop codons were found (Table S2), and further details about the mitogenome of G. pecorum and W. magnifica are presented in Table 3, Table S2, and Fig. S1a, S1b. Specifically for G. pecorum, the AT content of the complete genome, lrRNA gene, srRNA gene and control region, 70.7%, 75.4%, 72.3% and 80.8% respectively, are the lowest when compared with other species of the Calyptratae (Table 3, Table S3).
Nucleotide composition of Gasterophilus pecorum (Fabricius) / Wohlfahrtia magnifica (Schiner).
| Region | Nucleotide composition (%) | AT-skew | GC-skew | ||||
|---|---|---|---|---|---|---|---|
| T(U) | C | A | G | A+T | |||
| Whole genome | 32.4 / N * | 18.9 / N | 38.4 / N | 10.3 / N | 70.7 / N | 0.08 / N | -0.29 / N |
| Protein-coding genes | 39.5 / 43.3 | 16.2 / 12.8 | 29.0 / 31.3 | 15.3 / 12.6 | 68.5 / 74.6 | -0.15 / -0.16 | -0.03 / -0.01 |
| 1st codon position | 33.9 / 36.6 | 14.6 / 12.3 | 30.1 / 31.6 | 21.3 / 19.5 | 64.0 / 68.2 | -0.06 / -0.07 | 0.19 / 0.23 |
| 2nd codon position | 45.9 / 46.3 | 20.2 / 19.5 | 19.4 / 20.1 | 14.5 / 14.0 | 65.3 / 66.4 | -0.41 / -0.39 | -0.16 / -0.16 |
| 3rd codon position | 38.7 / 46.9 | 13.7 / 6.5 | 37.6 / 42.3 | 10.0 / 4.2 | 76.3 / 89.2 | -0.01 / -0.05 | -0.16 / -0.21 |
| tRNA | 38.1 / N | 10.8 / N | 37.4 / N | 13.6 / N | 75.5 / N | -0.01 / N | 0.11 / N |
| lrRNA | 42.1 / 41.5 | 6.9 / 6.4 | 33.3 / 38.8 | 17.6 / 13.3 | 75.4 / 80.3 | -0.12 / -0.03 | 0.43 / 0.35 |
| srRNA | 38.2 / 37.5 | 9.3 / 8.5 | 34.1 / 37.7 | 18.4 / 16.3 | 72.3 / 75.2 | -0.06 / 0.00 | 0.33 / 0.31 |
| Control Region | 45.1 / N | 4.9 / N | 35.8 / N | 14.3 / N | 80.8 / N | -0.12 / N | 0.49 / N |
* N = Not available.
Genetic divergence
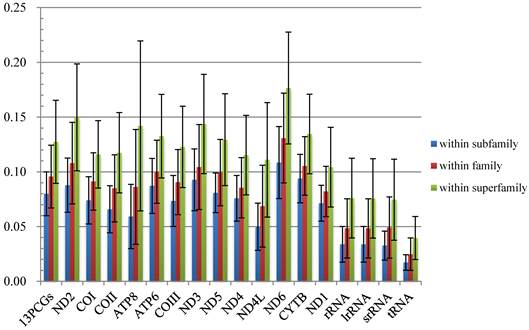
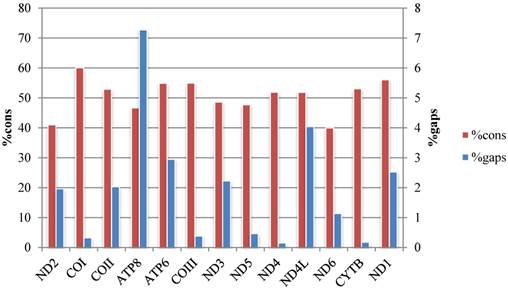
The average p-distances of PCGs show greater variation than that of rRNA genes, and ND6 and ATP8 genes show the largest distance and standard deviation respectively (Fig. 2, Table S4). Percentages of gaps in each protein-coding gene alignment are below 10%, while percentages of conserved positions range from 39.96% to 60.04% (Fig. 3, Table S5).
Comparisons of average mitochondrial gene p-distances at different taxonomic levels in 38 species of Calyptratae. Black bars indicate the standard deviation.
Percentage of conserved sites (%cons) and percentage of positions experiencing gaps (%gaps) in the alignments of the 13 protein-coding genes.
Nucleotide substitution saturation
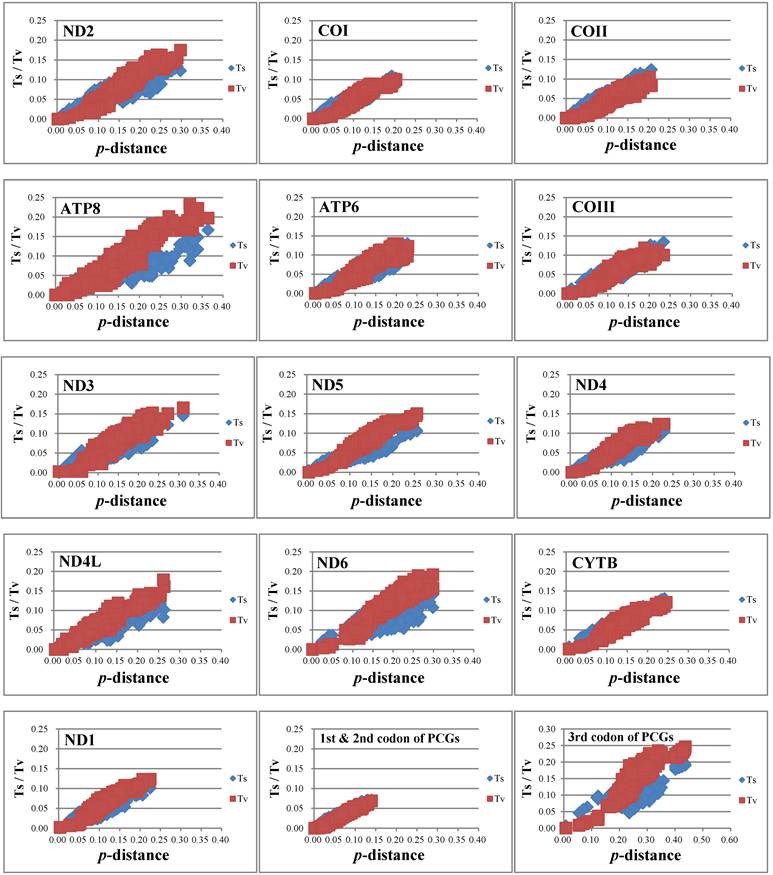
The nucleotide substitution is estimated (Fig. 4) and there is no or little sign of saturation. The number of transversions and transitions of the 13 PCGs increases with increasing evolutionary distance. For different codon positions, transversions and transitions increase with the p-distance for 1st & 2nd codon positions, while for 3rd codon positions the numbers of transitions show a plateau for p-distance values around 0.15-0.20, but increase after that.
Nucleotide substitution saturation of each 13 PCGs, 1st & 2nd codon positions of PCGs, and 3rd codon positions of PCGs.
Phylogenetic analysis
Four parallel analyses are performed: subgroup_1 with all genes (i.e., 13 PCGs, 2 rRNA genes, and concatenation of 22 tRNA genes) (subgroup_1_ALL); subgroup_1 with all but tRNA genes (subgroup_1_PCG&rRNA); subgroup_2 with all genes (subgroup_2_ALL), and; subgroup_2 with all but tRNA genes (subgroup_2_PCG&rRNA).
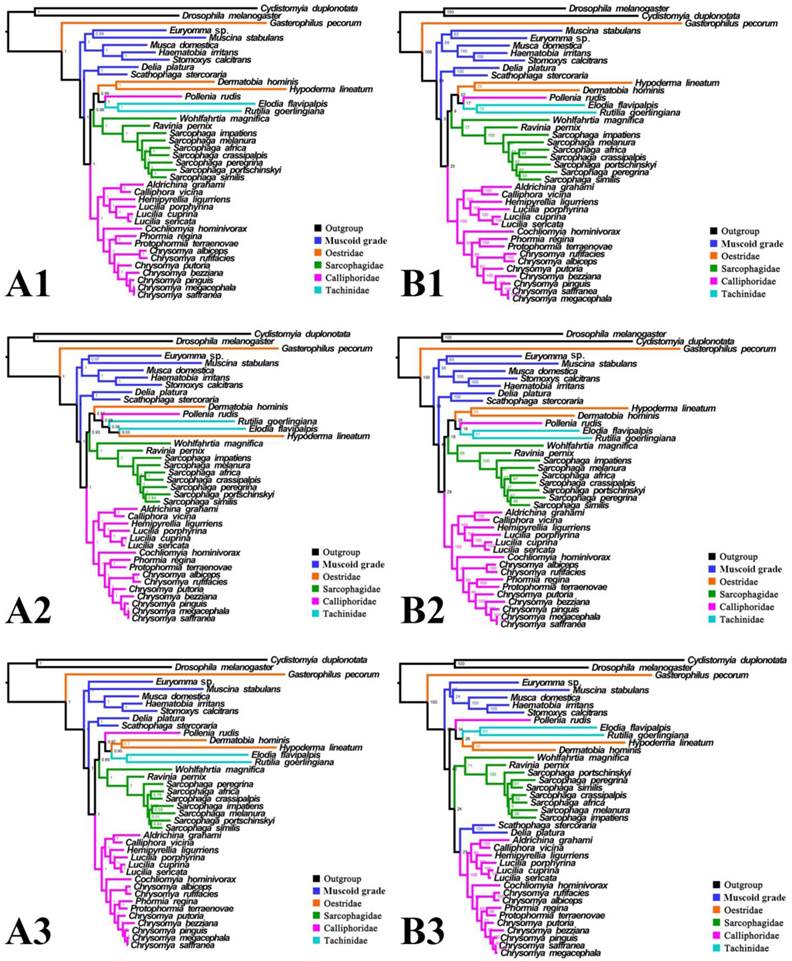
For subgroup_1, all analyses place G. pecorum at the basal split of the Calyptratae with strong support (Figs. 5, 6). Topologies of the remaining calyptrates of most datasets show a consistent relationship of (Fanniidae-Muscidae ((Anthomyiidae + Scathophagidae) (remaining Calliphoridae (Sarcophagidae (Oestridae (Pollenia + Tachinidae)))))), except for the unpartitioned Bayesian tree of subgroup_1_PCG&rRNA, and ML tree of subgroup_1 excluding 3rd codon positions of PCGs, which are inferred with the clade of muscoid grade or (Anthomyiidae + Scathophagidae) nested within the Oestroidea.
Phylogeny of subgroup_1, inferred from mitochondrial datasets comprising 13 protein-coding genes, 2 rRNA genes, and concatenation of tRNA genes. A1, Bayesian tree inferred from not partitioned data. A2, Bayesian tree inferred from partitioned data. A3, Bayesian tree inferred from data excluding 3rd codon positions of PCGs. B1, ML tree inferred from not partitioned data. B2, ML tree inferred from partitioned data. B3, ML tree inferred from data excluding 3rd codon positions of PCGs. Numbers at nodes are posterior probabilities (Bayesian trees), and Bootstrap values (ML trees).
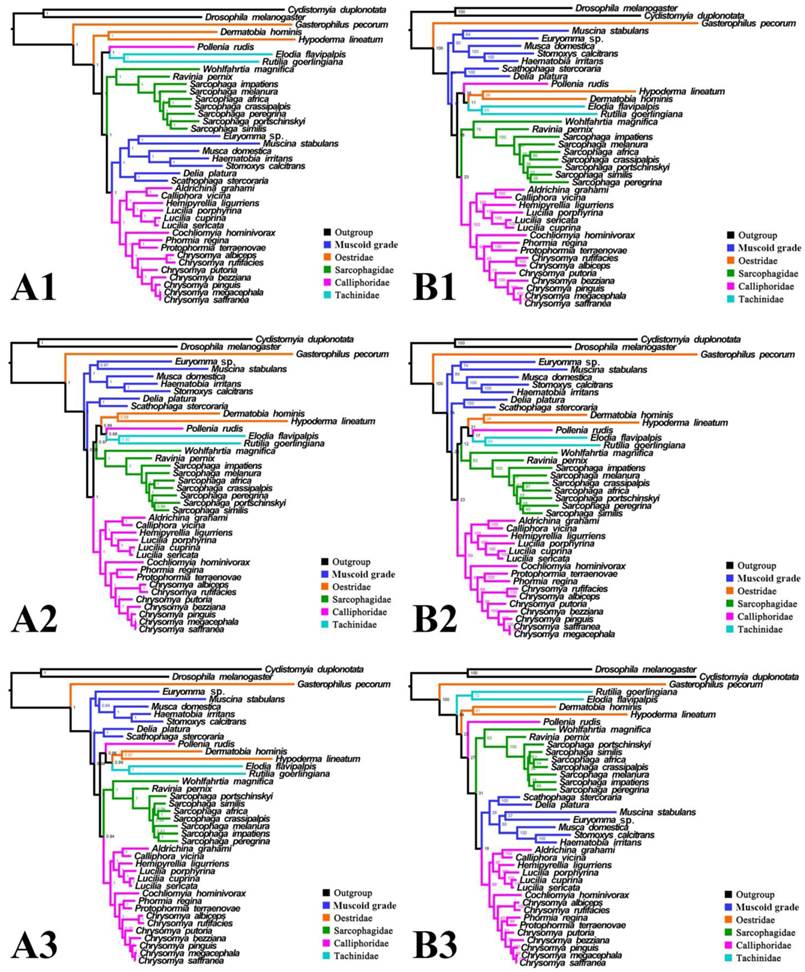
Phylogeny of subgroup_1, inferred from mitochondrial datasets comprising 13 protein-coding genes and 2 rRNA genes. A1, Bayesian tree inferred from not partitioned data. A2, Bayesian tree inferred from partitioned data. A3, Bayesian tree inferred from data excluding 3rd codon positions of PCGs. B1, ML tree inferred from not partitioned data. B2, ML tree inferred from partitioned data. B3, ML tree inferred from data excluding 3rd codon positions of PCGs. Numbers at nodes are posterior probabilities (Bayesian trees), and Bootstrap values (ML trees).
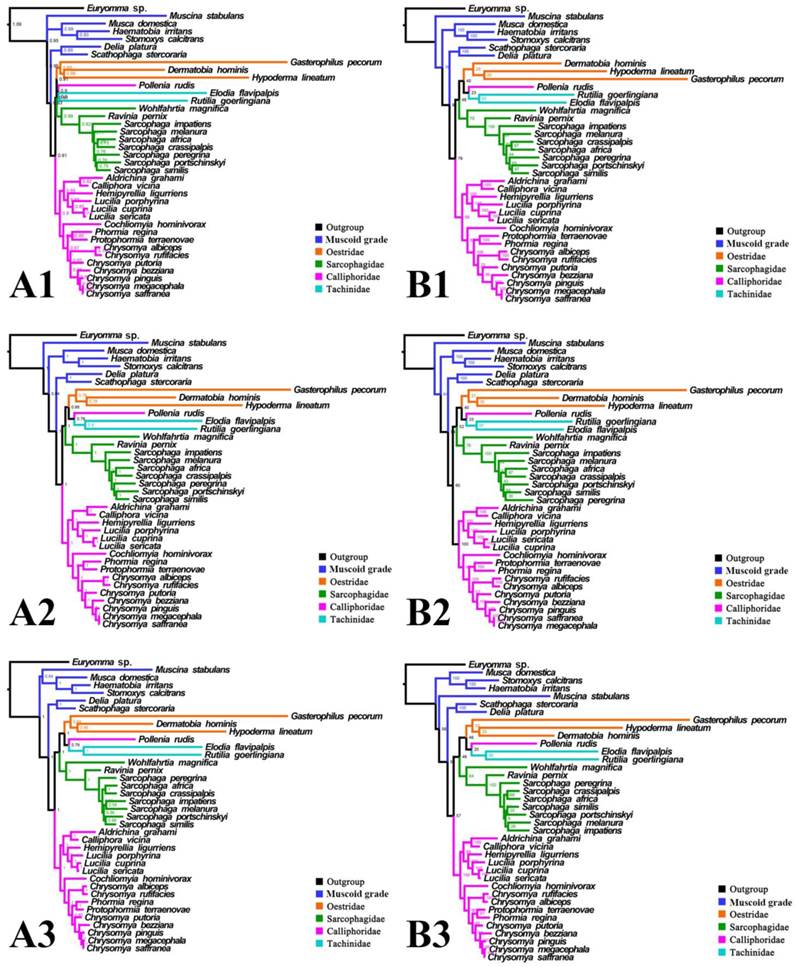
For subgroup_2, all analyses infer an identical oestroid family-level topology of (remaining Calliphoridae (Sarcophagidae (Oestridae (Pollenia + Tachinidae)))), except for the Bayesian tree of subgroup_2_PCG&rRNA without 3rd codon positions of PCGs, which places Pollenia together with Oestridae rather than Tachinidae (Figs. 7, 8). At intrafamilial level, relationships within Sarcophagidae (within Sarcophaga) present small changes when the data are partitioned. When the 3rd codon positions of PCGs are excluded, the Muscidae emerge as monophyletic and relationships within Sarcophagidae (within Sarcophaga), Calliphoridae (within subfamily Chrysomyinae), and within Oestridae are different from relationships inferred from datasets with this position included. Each family is moderately or well supported, except for the Oestridae, and Bayesian and ML inference fail to reach an agreement on the relationships within this family, with either Dermatobia or Gasterophilus at the base.
Phylogeny of subgroup_2, inferred from mitochondrial datasets comprising 13 protein-coding genes, 2 rRNA genes, and concatenation of tRNA genes. A1, Bayesian tree inferred from non-partitioned data. A2, Bayesian tree inferred from partitioned data. A3, Bayesian tree inferred from data excluding 3rd codon position of PCGs. B1, ML tree inferred from not partitioned data. B2, ML tree inferred from partitioned data. B3, ML tree inferred from data excluding 3rd codon positions of PCGs. Numbers at nodes are posterior probabilities (Bayesian trees), and Bootstrap values (ML trees).
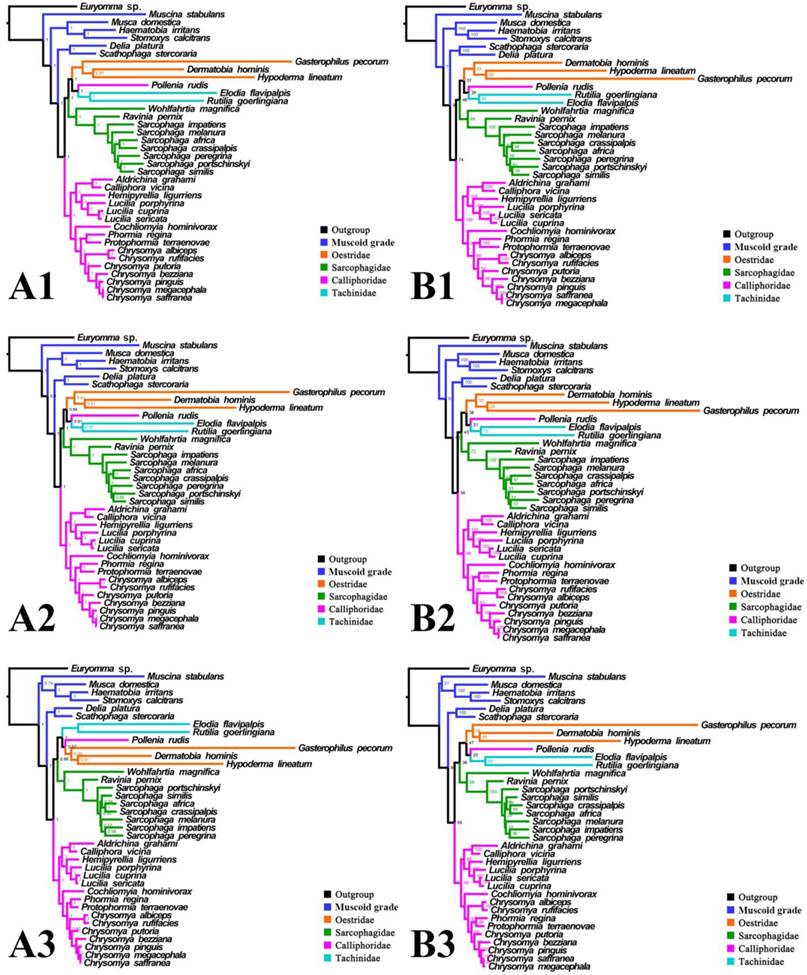
Phylogeny of subgroup_2, inferred from mitochondrial datasets comprising 13 protein-coding genes and 2 rRNA genes. A1, Bayesian tree inferred from not partitioned data. A2, Bayesian tree inferred from partitioned data. A3, Bayesian tree inferred from data excluding 3rd codon positions of PCGs. B1, ML tree inferred from not partitioned data. B2, ML tree inferred from partitioned data. B3, ML tree inferred from data excluding 3rd codon positions of PCGs. Numbers at nodes are posterior probabilities (Bayesian trees), and Bootstrap values (ML trees).
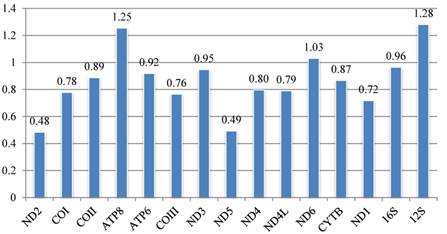
Phylogenetic examination of separate genes
The set of k-scores calculated by Ktreedist program is shown in Fig. 9. High scores indicate a poor match between the comparison and reference tree. For the PCGs, ND2 and ND5 produce trees that match well with the topology of the reference tree. ND6 and ATP8 genes show the most deviant topologies.
Calyptrate mitochondrial gene k-scores calculated by Ktreedist, measuring overall differences in the relative branch length and topology of the phylogenetic trees generated by single protein-coding genes compared to the combined dataset.
Discussion
Taxon sampling
Inferred topologies can be recognized as being of two types: (1) for analyses with the two non-calyptrate outgroups, the muscoid families are nested within a paraphyletic Oestroidea in the Bayesian trees based on the unpartitioned dataset with all codon sites, and G. pecorum takes part in the basal split of the Calyptratae; (2) for analyses without the two non-calyptrate outgroups, the Oestroidea are inferred as monophyletic, which is in agreement with previous studies [11, 17]. When tRNA genes are included in the matrix in the present study, some node supports decrease (Figs. 7, 8), and relationships within Oestridae vary when data are partitioned (Figs. 7B1, 7B2). Besides, in the analyses without the two non-calyptrate outgroups, topologies within the Calliphoridae change noticeably at genus level when the 3rd codon positions of PCGs are omitted. Taken together, the trees of subgroup_2 excluding tRNA genes but including all codon sites of PCGs are thought to be the most reliable in the present study.
Our analyses highlight the importance of taxon sampling in phylogeny reconstruction. Appropriate taxon sampling is very important for accurate phylogenetic estimation [6], but there are some disagreements whether phylogenies are improved by increased taxon sampling. Some have argued that adding taxa would decrease accuracy [83, 84], or at least does not help resolve conflicts [40], while others believe that increased sampling improves accuracy [e.g., 85-89]. The present analysis includes many more species than previous mitogenomic studies of calyptrate flies (e.g., Nelson et al. [44], with 20 species, 13 of which are calliphorids; Zhao et al. [58], with 9 calyptrate species; Ding et al. [61], with 10 calyptrate species) and also includes all available mitogenomes. Our research strongly supports monophyly of Oestroidea, as well as relationships within Sarcophagidae and within Calliphoridae (excluding Pollenia). Although we cannot resolve relationships within Oestridae, bot fly monophyly is well supported in the Bayesian analyses. The different results among the previous studies most likely reflect different coverage of taxa. Our approach, which includes more taxa, yields a better supported topology.
It is interesting that all three bot flies have remarkably long branches, with G. pecorum showing the longest terminal branch of any calyptrate in our analyses and H. lineatum the next longest. For all analyses of subgroup_1, G. pecorum is separated from the remaining bot flies and located at the base of the Calyptratae (Figs. 5, 6). With both morphology and biology providing very strong support for bot fly monophyly [29], this placement is very likely an artefact, which is here considered to be caused by long-branch attraction [90, 91] between G. pecorum and the long branches of both outgroups. Improved taxon sampling can help minimise this effect [74, 92], either by a denser taxon sampling [88, 89, 91], or by optimization of outgroup selection [74]. We optimized outgroup selection by omitting the non-calyptrate outgroups (subgroup_2) and instead rooted the tree at Euryomma from Fanniidae, as this family has been found to be the sister group to the non-hippoboscoid calyptrates in other studies [11, 17]. Following the exclusion of non-calyptrate outgroups, G. pecorum is pulled into the Oestroidea, where it clusters together with the remaining oestrids, and the monophyletic Oestroidea is nested within the muscoid grade, consistent with the widely accepted relationships [11, 17, 19]. These results indicate that the overall phylogeny, and in particular the placement of G. pecorum, is influenced by the long branches of the two non-calyptrate outgroups. Similarly, the non-monophyletic Oestroidea inferred by Ding et al. [61] may be an artefact caused by the use of distant outgroups (Tabanidae, Nemestrinidae). Clearly, close attention should be paid to the selection of outgroups, as inappropriate (e.g., very distant) outgroups may cause long-branch attraction and result in erroneous phylogeny reconstructions.
Reliability of single mitochondrial genes
We document two new mitogenomes in the subfamilies Gasterophilinae (of Oestridae) and Paramacronychiinae (of Sarcophagidae), thereby providing an opportunity to reanalyse phylogeny of the Calyptratae in the light of recent results [44, 58] and with a focus on mitogenomic performance.
The contribution of each mitochondrial gene to the calyptrate mitogenome phylogeny is estimated by calculating the k-score [82] for each gene. Phylogenetic resolution varies with the contribution of different genes: for rRNA, the lrRNA provides relatively more topological resolution than srRNA; for the protein-coding genes, according to their k-score, trees based on ND2 and ND5 are closest to the reference tree, followed by trees based on ND1, COIII, COI, and ND4L, while trees based on ATP8 and ND6 are farthest from the reference tree. Surprisingly, the widely used CYTB provides relatively little topological resolution. Furthermore, our different analyses for each protein-coding gene suggest that ATP8 and ND6 are faster evolving genes (see Figs. 3, 4). The evidence suggests that ATP8 and ND6 may contribute least in calyptrate phylogeny reconstruction, and that lrRNA, ND2, ND5, ND1, COIII, and COI perform better than other mitochondrial genes. Similar conclusions were reached in other phylogenetic analyses [15, 73]. In contrast, the most conservative genes (i.e., concatenation of tRNA genes) decrease some node supports in the present study (Figs. 7A1, 7A2, 7B1, 7B2, Figs. 8A1, 8A2, 8B1, 8B2). Salichos & Rokas [41] similarly concluded that selecting genes with strong phylogenetic signal are very important in accurate reconstruction of ancient divergences.
Data partitioning
The effects of data partitioning and partition schemes on phylogeny reconstruction have been widely investigated [e.g., 93, 94]. Different partitioning schemes may have no effect at a certain level, but can result in strong nodal support for otherwise conflicting topologies at more inclusive levels [14, 93-96], suggesting that partitioning has most effect at deeper phylogenetic levels [5]. In this study, data partition has little influence except for minor changes in node supports.
Excluding 3rd codon position of protein-coding genes
The 3rd codon positions are sometimes excluded in phylogeny reconstruction, generally because this codon site can be highly saturated and therefore is considered less informative [58, 93, 97]. In the present study, only small topological differences resulted from excluding the 3rd codon positions of PCGs, the major ones being Pollenia clustering together with Oestridae rather than with the Tachinidae, and the Muscidae being monophyletic in the Bayesian tree (Fig. 7A3, Fig. 8A3). However, phylogenetic relationships within families vary, depending upon whether the 3rd codon positions are pruned. Testing nucleotide substitution saturation of PCGs revealed that 3rd codon positions of PCGs in the present study are not saturated, or at most showing partly saturation for transversions (Fig. 4). Interestingly, Caravas et al. [98] estimated the performance of 3rd codon positions of Diptera and found that they still resolved some recent clades within the Calyptratae. Taken together, these results indicate that the 3rd codon positions of PCGs are informative in calyptrate phylogeny reconstruction and should not be pruned.
tRNA genes
Calyptrate phylogenies based on datasets with and without tRNA genes are almost identical, except for slight differences in some node supports and branch lengths, irrespective of the analytic methods (i.e., with or without 3rd codon positions of PCGs, partitioned or not). Genetic divergence analysis also shows that tRNA genes are more conserved than other mitochondrial genes. Kumazawa et al. [99] proposed that tRNA genes may be useful for resolving deep splits that occurred some hundreds of millions of years ago. Since calyptrates are estimated to have appeared 70-55 million years ago [11, 16, 100], the phylogenetic signal of tRNA genes in this group is not strong enough to help resolve calyptrate phylogeny.
Phylogenetic topology
The Calyptratae are considered “one of the most surely grounded monophyletic groups within the Schizophora” ([101], see also [27, 102]) based on morphological data, and phylogenies from molecular data have been in strong agreement [11]. The group has been subject to very extensive phylogenetic analyses, using both morphological and variable amounts of molecular data, e.g., [17-22, 26, 27, 29, 31, 33, 34, 37, 38, 44, 58, 61, 103-115]. However, some relationships within the Calyptratae remain controversial, primarily through differences in the selection of molecular markers, and the sample of taxa used for phylogeny reconstruction.
The favoured tree topologies in the present study (Figs. 7, 8) differ in some important respects from the previous study also obtained using whole mitogenomes [44], and that obtained using a small data set of two mitochondrial and two nuclear genes [26]. The relationships at the family level are almost identical across all three studies, except for the placement of Sarcophagidae in the analysis using whole mitogenomes. In the present study, Sarcophagidae is sister group to the clade (Oestridae (Tachinidae + Pollenia)), while Nelson et al. [44] place the Sarcophagidae and Calliphoridae (except for Pollenia) as sister groups. This difference may be due to the limited representation of taxa from the Sarcophagidae: Nelson et al. [44] focus on the phylogeny within the Calliphoridae, and so the Sarcophagidae are represented by a single species, compared with 9 species representing two subfamilies in the present study.
A noticeable difference of these studies lies at the subfamily level within the Calliphoridae. With 11 subfamilies [33], the non-monophyletic Calliphoridae represent a considerable challenge for calyptrate phylogeny reconstruction [26, 33, 44]. Calliphoridae are non-monophyletic in the present study, like in previous studies [11, 17, 26, 44], and combining these results the clade (Chrysomyinae, (Calliphorinae + Luciliinae)) appears to form a robust relationship, and both Mesembrinellinae and Polleninae are phylogenetically closer to the Tachinidae than to other calliphorids and would as such warrant separate status as valid families. The placement of Sarcophagidae and Rhiniidae (formerly Calliphoridae: Rhiniinae) by Kutty et al. [17] was not well supported in Marinho et al. [26], highlighting how increasing the number of molecular markers helps produce more robust phylogenies.
Conclusion
The mitogenome in general provides informative molecular markers in calyptrate phylogenetic research. Partitioning data by genes does not change the phylogenetic topology at the family level but improves some node supports. Similarly, the topology is hardly changed by including conservative tRNA genes, except for some slightly reduced node supports. Taxon sampling plays an important role in calyptrate phylogeny reconstruction, and more stable family-level relationships can be inferred by increased coverage. More taxa and nuclear genes should be selected in calyptrate phylogeny reconstruction in the future, in order to break long branches and improve resolution.
Family-level relationships within the Oestroidea are poorly understood and difficult to resolve. One of the more challenging aspects of resolving oestroid relationships is the non-monophyly of the traditional Calliphoridae [33]. Another is the position of the Oestridae, which is a small family of less than 200 species [116, 117], the larvae of which are obligate parasites of mammals. Solving the issue of bot fly ancestry is closely connected to establishing the phylogenetic relationships for the subgroups of the traditional Calliphoridae.
Supplementary Material
Supplementary Tables and Figures.
Acknowledgements
We are grateful to Drs. Jie Liu (Institute of Zoology, Chinese Academy of Sciences) and Eliana Buenaventura (Natural History Museum of Denmark, University of Copenhagen), Prof. Aibing Zhang and Miss Jie Qin (Capital Normal University) who gave us invaluable help during this study. We wish to extend our sincerest thanks to Mr. Zhe Zhao (Institute of Zoology, Chinese Academy of Sciences), Mr. Yuan Wang (Institute of Zoology, Chinese Academy of Sciences), and Dr. Xingyi Li (Third Military Medical University of Chinese P.L.A) for giving useful suggestions of phylogenetic analyses, and to Drs Kelly A. Meiklejohn (University of Florida, Gainesville, USA), Thomas J. Simonsen (Natural History Museum, London, UK) and Mark Eglar (University of Melbourne, Australia) for kindly providing valuable comments to the manuscript. We would also like to express our gratitude to the online information providers Diptera info (http://mail.diptera.info/news.php) and Discover Life (http://www.discoverlife.org) for specimen pictures in our graphical abstract. This study was supported by the Fundamental Research Funds for the Central Universities (No. JC2015-04), the Program for New Century Excellent Talents in University (No. NCET-12-0783), Beijing Higher Education Young Elite Teacher Project (No. YETP0771), and the National Science Foundation of China (No. 31201741), all to DZ, and the Carlsberg Foundation (No. 2012_01_0433) to TP.
Competing Interests
The authors have declared that no competing interest exists.
References
1. Simon C, Frati F, Beckenbach A. et al. Evolution, weighting, and phylogenetic utility of mitochondrial gene sequences and a compilation of conserved polymerase chain reaction primers. Ann Entomol Soc Am. 1994;87:651-701
2. Trautwein MD, Wiegmann BM, Beutel R. et al. Advances in insect phylogeny at the dawn of the postgenomic era. Annu Rev Entomol. 2012;57:449-468
3. Burger G, Gray MW, Lang BF. Mitochondrial genomes: anything goes. Trends Genet. 2003;19:709-716
4. Hurst GDD, Jiggins FM. Problems with mitochondrial DNA as a marker in population, phylogeographic and phylogenetic studies: the effects of inherited symbionts. P Roy Soc B-Biol Sci. 2005;1572:1525-1534
5. Cameron SL. Insect mitochondrial genomics: implications for evolution and phylogeny. Annu Rev Entomol. 2014;59:95-117
6. Hedtke SM, Townsend TM, Hillis DM. Resolution of phylogenetic conflict in large data sets by increased taxon sampling. Syst Biol. 2006;55:522-529
7. Bernt M, Bleidorn C, Braband A. et al. A comprehensive analysis of bilaterian mitochondrial genomes and phylogeny. Mol Phylogenet Evol. 2013;69:352-364
8. Duchêne S, Archer FI, Vilstrup J. et al. Mitogenome phylogenetics: the impact of using single regions and partitioning schemes on topology, substitution rate and divergence time estimation. PLoS One. 2011;6:e27138
9. Heath TA, Hedtke SM, Hillis DM. Taxon sampling and the accuracy of phylogenetic analyses. J Syst Evol. 2008;46:239-257
10. Sheffield NC, Song H, Cameron SL. et al. Nonstationary evolution and compositional heterogeneity in beetle mitochondrial phylogenomics. Syst Biol. 2009;58:381-394
11. Wiegmann BM, Trautwein MD, Winkler IS. et al. Episodic radiations in the fly tree of life. P Natl Acad Sci USA. 2011;108:5690-5695
12. Cameron SL, Beckenbach AT, Dowton M. et al. Evidence from mitochondrial genomics on interordinal relationships in insects. Arthropod Syst Phylo. 2006;64:27-34
13. Zhang HL, Huang Y, Lin LL. et al. The phylogeny of the Orthoptera (Insecta) as deduced from mitogenomic gene sequences. Zool Stud. 2013;52:37
14. Cameron SL, Lambkin CL, Barker SC. et al. A mitochondrial genome phylogeny of Diptera: whole genome sequence data accurately resolve relationships over broad timescales with high precision. Syst Entomol. 2007;32:40-59
15. Zardoya R, Meyer A. Phylogenetic performance of mitochondrial protein-coding genes in resolving relationships among vertebrates. Mol Biol Evol. 1996;13:933-942
16. Grimaldi D, Engel MS. Evolution of the insects. New York, USA: Cambridge University Press. 2005
17. Kutty SN, Pape T, Wiegmann BM. et al. Molecular phylogeny of the Calyptratae (Diptera: Cyclorrhapha) with an emphasis on the superfamily Oestroidea and the position of Mystacinobiidae and McAlpine's fly. Syst Entomol. 2010;35:614-635
18. Kutty SN, Bernasconi MV, František S. et al. Sensitivity analysis, molecular systematics and natural history evolution of Scathophagidae (Diptera: Cyclorrhapha: Calyptratae). Cladistics. 2007;23:64-83
19. Kutty SN, Pape T, Pont AC. et al. The Muscoidea (Diptera: Calyptratae) are paraphyletic: Evidence from four mitochondrial and four nuclear genes. Mol Phylogenet Evol. 2008;49:639-652
20. Kutty SN, Pont AC, Meier R. et al. Complete tribal sampling reveals basal split in Muscidae (Diptera), confirms saprophagy as ancestral feeding mode, and reveals an evolutionary correlation between instar numbers and carnivory. Mol Phylogenet Evol. 2014;78:349-364
21. Bernasconi MV, Pawlowski J, Valsangiacomo C. et al. Phylogeny of the Scathophagidae (Diptera, Calyptratae) based on mitochondrial DNA sequences. Mol Phylogenet Evol. 2000;16:308-315
22. Bernasconi MV, Valsangiacomo C, Piffaretti JC. et al. Phylogenetic relationships among Muscoidea (Diptera: Calyptratae) based on mitochondrial DNA sequences. Insect Mol Biol. 2000;9:67-74
23. Cerretti P, Lo Giudice G, Pape T. Remarkable Rhinophoridae in a growing generic genealogy (Diptera: Calyptratae, Oestroidea). Syst Entomol. 2014;39:660-690
24. Cerretti P, O'Hara JE, Wood DM. et al. Signal through the noise? Phylogeny of the Tachinidae (Diptera) as inferred from morphological evidence. Syst Entomol. 2014;39:335-353
25. Domínguez MC, Roig-Juñent SA. A phylogeny of the family Fanniidae Schnabl (Insecta: Diptera: Calyptratae) based on adult morphological characters, with special reference to the Austral species of the genus Fannia. Invertebr Syst. 2008;22:563-587
26. Marinho MAT, Junqueira ACM, Esposito MC. et al. Molecular phylogenetics of Oestroidea (Diptera: Calyptratae) with emphasis on Calliphoridae: Insights into the inter-familial relationships and additional evidence for paraphyly among blowflies. Mol Phylogenet Evol. 2012;65:840-854
27. McAlpine JF. Phylogeny and classification of the Muscomorpha. In: (ed.) McAlpine JF, Wood DM. Manual of Nearctic Diptera. Ottawa: Research Branch Agriculture Canada. 1989:1397-1518
28. Nirmala X, Hypša V, Žurovec M. Molecular phylogeny of Calyptratae (Diptera: Brachycera): the evolution of 18S and 16S ribosomal rDNAs in higher dipterans and their use in phylogenetic inference. Insect Mol Biol. 2001;10:475-485
29. Pape T. Phylogeny of Oestridae (Insecta: Diptera). Syst Entomol. 2001;26:133-171
30. Pape T. Phylogeny and Evolution of Bot Flies. In: (ed.) Colwell DD, Hall MJ, Scholl PJ. The oestrid flies: biology, host-parasite relationships, impact and management, 1st ed. Cambridge: CABI Publishing. 2006:20-50
31. Petersen FT, Meier R, Kutty SN. et al. The phylogeny and evolution of host choice in the Hippoboscoidea (Diptera) as reconstructed using four molecular markers. Mol Phylogenet Evol. 2007;45:111-122
32. Piwczyński M, Szpila K, Grzywacz A. et al. A large-scale molecular phylogeny of flesh flies (Diptera: Sarcophagidae). Syst Entomol. 2014;39:783-799
33. Rognes K. The Calliphoridae (blowflies) (Diptera: Oestroidea) are not a monophyletic group. Cladistics. 1997;13:27-66
34. Schuehli GSE, de Carvalho CJB, Wiegmann BM. Molecular phylogenetics of the Muscidae (Diptera: Calyptratae): new ideas in a congruence context. Invertebr Syst. 2007;21:263-278
35. Singh B, Wells JD. Molecular systematics of the Calliphoridae (Diptera: Oestroidea): evidence from one mitochondrial and three nuclear genes. J Med Entomol. 2013;50:15-23
36. Stevens JR. The evolution of myiasis in blowflies (Calliphoridae). Int J Parasitol. 2003;33:1105-1113
37. Stireman JO. Phylogenetic relationships of tachinid flies in subfamily Exoristinae (Tachinidae: Diptera) based on 28S rDNA and elongation factor-1α. Syst Entomol. 2002;27:409-435
38. Tachi T, Shima H. Molecular phylogeny of the subfamily Exoristinae (Diptera, Tachinidae), with discussions on the evolutionary history of female oviposition strategy. Syst Entomol. 2010;35:148-163
39. Wang MF, Zhang D, Ao H. Phylogeny and biogeography of the genus Piezura Rondani (Diptera: Fanniidae). Zootaxa. 2010;2412:53-62
40. Lei Z, Ang SHA, Srivathsan A. et al. Does better taxon sampling help? A new phylogenetic hypothesis for Sepsidae (Diptera: Cyclorrhapha) based on 50 new taxa and the same old mitochondrial and nuclear markers. Mol Phylogenet Evol. 2013;69:153-164
41. Salichos L, Rokas A. Inferring ancient divergences requires genes with strong phylogenetic signals. Nature. 2013;497:327-333
42. Wan K, Celniker S. Direct submission. Submitted (06-JUN-2014). Berkeley Drosophila Genome Project, Ernest Orlando Lawrence Berkeley National Laboratory, 1 Cyclotron Road, Mailstop 64-121, Berkeley, CA 94720, USA. 2014
43. Guo YD, Liao HD, Zhu ZY. Direct submission. Submitted (01-MAR-2015). Department of Forensic Science, Central South University, Tongzipo Road No. 172, Changsha, Hunan 410013, China. 2015
44. Nelson LA, Lambkin CL, Batterham P. et al. Beyond barcoding: A mitochondrial genomics approach to molecular phylogenetics and diagnostics of blowflies (Diptera: Calliphoridae). Gene. 2012;511:131-142
45. Lessinger AC, Junqueira ACM, Lemos TA. et al. The mitochondrial genome of the primary screwworm fly Cochliomyia hominivorax (Diptera: Calliphoridae). Insect Mol Biol. 2000;9:521-529
46. Yan J, Liao H, Xie K. et al. Direct submission. Submitted (29-JUL-2014). Department of Forensic Medicine, School of Xiangya Basic Medical Sciences, Central South University, Tongzipe Road No. 172, Changsha, Hunan 410013, China. 2014
47. Junqueira ACM, Lessinger AC, Torres TT. et al. The mitochondrial genome of the blowfly Chrysomya chloropyga (Diptera: Calliphoridae). Gene. 2004;339:7-15
48. Ramakodi MP, Singh B, Wells JD. et al. Direct submission. Submitted (25-OCT-2012). Institute for Genomics, Biocomputing and Biotechnology, Mississippi State University, Mississippi State, MS 39762, USA. 2015
49. Stevens JR, West H, Wall R. Mitochondrial genomes of the sheep blowfly, Lucilia sericata, and the secondary blowfly, Chrysomya megacephala. Mol Biol Evol. 2008;22:89-91
50. Guo YD, Guo JJ. Direct submission. Submitted (30-SEP-2014). Department of Forensic Medcine, Central South University, Tongzipo Road No. 172, Changsha, Hunan 410013, China. 2014
51. Guo YD, Fu XL. Direct submission. Submitted (06-OCT-2014). Department of Forensic Medicine, Central South University, Tongzipo Road N0.172, Changsha, Hunan 410013, China. 2014
52. Ramakodi MP, Ray DA. Direct submission. Submitted (25-OCT-2012). Institute for Genomics, Biocomputing and Biotechnology, Mississippi State University, Mississippi State, MS 39762, USA. 2012
53. Nelson LA, Cameron SL, Yeates DK. The complete mitochondrial genome of the flesh fly, Sarcophaga impatiens Walker (Diptera: Sarcophagidae). Mitochondr DNA. 2012;23:42-43
54. Guo YD, Zhang CQ, Liao HD. Direct submission. Submitted (04-NOV-2014). Department of Forensic Medicine, Central South University, Tongzipo Road No. 172, Changsha, Hunan 410013, China. 2014
55. Zhong M, Wang X, Liu Q. et al. Direct submission. Submitted (30-NOV-2013). Department of Pathology, Central South University, 172 Tong Zi Po Road, Changsha, Hunan 410013, China. 2013
56. Zha L, Guo YD, Shi J. Direct submission. Submitted (12-AUG-2014). Department of Forensic Science, School of Xiangya Basic Medical Sciences, Central South University, Tongzipo Road No. 172, Changsha, Hunan 410013, China. 2014
57. Yan J, Liao H, Zhu Z. et al. Direct submission. Submitted (12-AUG-2014). Department of Forensic Medicine, Central South University, Tongzipe Road No. 172, Changsha, Hunan 410013, China. 2014
58. Zhao Z, Su T, Chesters D. et al. The mitochondrial genome of Elodia flavipalpis Aldrich (Diptera: Tachinidae) and the evolutionary timescale of tachinid flies. PLoS One. 2013;8:e61814
59. Azeredo-Espin AML, Junqueira ACM, Lessinger AC. et al. The complete mitochondrial genome of the human botfly Dermatobia hominis (Diptera: Oestridae). 2004; Unpublished poster, ESA Annual Meeting and Exhibition; https://esa.confex.com/esa/2004/techprogram/paper_16801.htm.
60. Weigl S, Testine G, Parisi A. et al. The mitochondrial genome of the common cattle grub, Hypoderma lineatum. Mol Biol Evol. 2010;24:329-335
61. Ding S, Li X, Wang N. et al. The phylogeny and evolutionary timescale of muscoidea (Diptera: Brachycera: Calyptratae) inferred from mitochondrial genomes. PloS one. 2015;10:e0134170
62. Oliveira MT, Barau JG, Martins-Junqueira AC. et al. Structure and evolution of the mitochondrial genomes of Haematobia irritans and Stomoxys calcitrans: the Muscidae (Diptera: Calyptratae) perspective. Mol Phylogenet Evol. 2008;48:850-857
63. Li XK, Yang D. Direct submission. Submitted (15-JUL-2014). Entomology, China Agricultural University, Yuanmingyuan West Road, Beijing, Beijing 100193, China. 2014
64. Zha L, Lan ML. Direct submission. Submitted (30-SEP-2014). Department of Forensic Medicine, Central South University, Tongzipo Road No. 172, Changsha, Hunan 410013, China. 2014
65. Li XK, Yang D. Direct submission. Submitted (15-JUL-2014). Entomology, China Agricultural University, Yuanmingyuan West Road, Beijing, Beijing 100193, China. 2014
66. Shao YJ, Hu XQ, Peng GD. et al. Structure and evolution of the mitochondrial genome of Exorista sorbillans: the Tachinidae (Diptera: Calyptratae) perspective. Mol Biol Rep. 2012;39:11023-11030
67. Zhang NX, Zhang YJ, Yu G. et al. Structure characteristics of the mitochondrial genomes of Diptera and design and application of universal primers for their sequencing. Acta Entomologica Sinica. 2013;56:398-407 [in Chinese]
68. Lalitha S. Primer Premier 5.0. Biotech Software Internet Rep. 2000;1:270-272
69. Hall TA. BioEdit: a user-friendly biological sequence alignment editor and analysis program for Windows 95/98/NT. Nucleic Acids Symp Ser. 1999;41:95-98
70. Altschul SF, Gish W, Miller W. et al. Basic local alignment search tool. J Mol Biol. 1990;215:403-410
71. Bernt M, Donath A, Jühling F. et al. MITOS: Improved de novo metazoan mitochondrial genome annotation. Mol. Phylogenet Evol. 2013;69:313-319
72. Tamura K, Peterson D, Stecher G. et al. MEGA5: Molecular evolutionary genetics analysis using maximum likelihood, evolutionary distance, and maximum parsimony methods. Mol Biol Evol. 2011;28:2731-2739
73. Nardi F, Spinsanti G, Boore JL. et al. Hexapod origins: monophyletic or paraphyletic? Science. 2003;299:1887-1889
74. Huang Y. Molecular phylogenetics. Beijing: Science Press. 2012 [in Chinese]
75. Edgar RC. MUSCLE: multiple sequence alignment with high accuracy and high throughput. Nucleic Acids Res. 2004;32:1792-1797
76. Meier R, Shiyang K, Vaidya G. et al. DNA Barcoding and taxonomy in Diptera: a tale of high intraspecific variability and low identification success. Syst Biol. 2006;55:715-728
77. Nylander JAA. MrModeltest v2. Program distributed by the author. Evolutionary Biology Centre, Uppsala University. 2004
78. Lanfear R, Calcott B, Ho SYW. et al. PartitionFinder: combined selection of partitioning schemes and substitution models for phylogenetic analysis. Mol Biol Evol. 2012;29:1695-1701
79. Ronquist F, Teslenko M, van der Mark P. et al. MrBayes 3.2: efficient Bayesian phylogenetic inference and model choice across a large model space. Syst Biol. 2012;6:539-542
80. Miller MA, Pfeiffer W, Schwartz T. Creating the CIPRES Science Gateway for inference of large phylogenetic trees. New Orleans, USA: IEEE. 2010
81. Stamatakis A, Hoover J, Rougemont J. A rapid bootstrap algorithm for the RaxML Web-servers. Syst Biol. 2008;75:758-771
82. Soria-Carrasco V, Talavera G, Igea J. et al. The K tree score: quantification of differences in the relative branch length and topology of phylogenetic trees. Bioinformatics. 2007;23:2954-2956
83. Kim J. General inconsistency conditions for maximum parsimony: Effects of branch lengths and increasing numbers of taxa. Syst Biol. 1996;45:363-374
84. Kim J. Large-scale phylogenies and measuring the performance of phylogenetic estimators. Syst Biol. 1998;47:43-60
85. Dimitrov D, Lopardo L, Giribet G. et al. Tangled in a sparse spider web: single origin of orb weavers and their spinning work unravelled by denser taxonomic sampling. P Roy Soc B-Biol Sci. 2012;279:1341-1350
86. Graybeal A. Is it better to add taxa or characters to a difficult phylogenetic problem? Syst Biol. 1998;47:9-17
87. Murphy WJ, Eizirik E, Johnson WE. et al. Molecular phylogenetics and the origins of placental mammals. Nature. 2001;409:614-618
88. Poe S. Sensitivity of phylogeny estimation to taxonomic sampling. Syst Biol. 1998;47:18-31
89. Pollock DD, Zwickl DJ, McGuire JA. et al. Increased taxon sampling is advantageous for phylogenetic inference. Syst Biol. 2002;51:664
90. Felsenstein J. Cases in which parsimony or compatibility methods will be positively misleading. Syst Biol. 1978;27:401-410
91. Hendy MD, Penny D. A framework for the quantitative study of evolutionary trees. Syst Biol. 1989;38:297-309
92. Li YW, Yu L, Zhang YP. “Long-branch Attraction” artifact in phylogenetic reconstruction. Hereditas (Beijing). 2007;29:659-667 [in Chinese]
93. Pons J, Ribera I, Bertranpetit J. et al. Nucleotide substitution rates for the full set of mitochondrial protein-coding genes in Coleoptera. Mol Phylogenet Evol. 2010;56:796-807
94. Meiklejohn KA, Danielson MJ, Faircloth BC. et al. Incongruence among different mitochondrial regions: A case study using complete mitogenomes. Mol Phylogenet Evol. 2014;78:314-323
95. Fenn JD, Song H, Cameron SL. et al. A preliminary mitochondrial genome phylogeny of Orthoptera (Insecta) and approaches to maximizing phylogenetic signal within mitochondrial genome data. Mol Phylogenet Evol. 2008;49:59-68
96. Dowton M, Cameron SL, Austin AD. et al. Phylogenetic approaches for the analysis of mitochondrial genome sequence data in the Hymenoptera: a lineage with both rapidly and slowly evolving mitochondrial genomes. Mol Phylogenet Evol. 2009;52:512-19
97. Hassanin A. Phylogeny of Arthropoda inferred from mitochondrial sequences: strategies for limiting the misleading effects of multiple changes in pattern and rates of substitution. Mol Phylogenet Evol. 2006;38:100-116
98. Caravas J, Friedrich M. Shaking the Diptera tree of life: performance analysis of nuclear and mitochondrial sequence data partitions. Syst Entomol. 2013;38:93-103
99. Kumazawa Y, Nishida M. Sequence evolution of mitochondrial tRNA genes and deep-branch animal phylogenetics. J Mol Evol. 1993;37:380-398
100. Beverley SM, Wilson AC. Molecular Evolution in Drosophila and the Higher Diptera. J Mol Evol. 1984;21:1-13
101. Griffiths GCD. The phylogenetic classification of Diptera Cyclorrhapha: with special reference to the structure of the male postabdomen. Series Entomol. 1972;8:1-340
102. Hennig W. Diptera (Zweiflügler). Handbuch Zool. 1973;4:1-337
103. Verves YG. The phylogenetic systematics of the miltogrammatine flies (Diptera, Sarcophagidae) of the world. Jpn J Med Sci Biol. 1989;42:111-126
104. Michelsen V. Revision of the aberrant new world genus Coenosopsia (Diptera: Anthomyiidae) with a discussion of anthomyiid relationships. Syst Entomol. 1991;16:85-104
105. Pape T. Phylogeny of the Tachinidae family-group (Diptera: Calyptratae). Tijdschr Entomol. 1992;135:43-86
106. Pape T. A new genus of Paramacronychiinae (Diptera: Sarcophagidae), argued from a genus-level cladistic analysis. Syst Entomol. 1998;23:187-200
107. Pape T, Arnaud PH. Bezzimyia - a genus of native New World Rhinophoridae (Insecta, Diptera). Zool Scr. 2001;30:257-297
108. Gleeson DM, Howitt RLJ, Newcomb RD. The phylogenetic position of the New Zealand batfly, Mystacinobia zelandica (Mystacinobiidae; Oestroidea) inferred from mitochondrial 16S ribosomal DNA sequence data. J Roy Soc New Zeal. 2000;30:155-168
109. Carvalho CJB, Couri MS. Cladistic and biogeographic analyses of Apsil Malloch and Reynoldsia Malloch (Diptera: Muscidae) of southern South America. P Entomol Soc Wash. 2002;104:309-317
110. Nihei SS, Carvalho CJB. Taxonomy, cladistics and biogeography of Coenosopsia Malloch (Diptera, Anthomyiidae) and its significance to the evolution of anthomyiids in the Neotropics. Syst Entomol. 2004;29:260-275
111. Savage J, Wheeler TA. Phylogeny of the Azeliini (Diptera: Muscidae). Studia Dipt. 2004;11:259-299
112. Savage J, Wheeler TA, Wiegmann BM. Phylogenetic analysis of the genus Thricops Rondani (Diptera: Muscidae) based on molecular and morphological characters. Syst Entomol. 2004;29:395-414
113. Dittmar K, Porter ML, Murray S. et al. Molecular phylogenetic analysis of nycteribiid and streblid bat flies (Diptera: Brachycera, Calyptratae): implications for host associations and phylogeographic origins. Mol Phylogenet Evol. 2006;38:155-170
114. Dyer NA, Lawton SP, Ravel S. et al. Molecular phylogenetics of tsetse flies (Diptera: Glossinidae) based on mitochondrial (COI, 16S, ND2) and nuclear ribosomal DNA sequences, with an emphasis on the palpalis group. Mol Phylogenet Evol. 2008;49:227-239
115. Song ZK, Wang XZ, Liang GQ. Molecular evolution and phylogenetic utility of the internal transcribed spacer 2 (ITS2) in Calyptratae (Diptera: Brachycera). J Mol Evol. 2008;67:448-464
116. Colwell DD, Hall MJ, Scholl PJ. The oestrid flies: biology, host-parasite relationships, impact and management. CABI. 2006
117. Pape T, Blagoderov V, Mostovski MB. Order DIPTERA Linnaeus, 1758. Animal biodiversity: An outline of higher-level classification and survey of taxonomic richness. Zootaxa. 2011;3148:222-229
Author contact
![]() Corresponding author: Dong Zhang, Tel: +86 10 62336801; Email: ernest8445com.
Corresponding author: Dong Zhang, Tel: +86 10 62336801; Email: ernest8445com.