Impact Factor ISSN: 1449-2288
- Issue 12; 2026
- Issue 11; 2026
- Issue 10; 2026
- Issue 9; 2026
- Issue 8; 2026
- Volume 22; 2026
- Past Issues
- Advance Articles
- Editorial Board
- Cover Images
- Index & Coverage
- Cover Suggestion
- Special Issues
Introduction
Materials and Methods
Results
Discussion
Conclusions
Supplementary Material
Acknowledgements
References

 Global reach, higher impact
Int J Biol Sci 2016; 12(5):545-557. doi:10.7150/ijbs.13540 This issue Cite
Research Paper
Upregulation of the Non-Coding RNA OTUB1-isoform 2 Contributes to Gastric Cancer Cell Proliferation and Invasion and Predicts Poor Gastric Cancer Prognosis
Yi-qin Wang1*, Qiong-yan Zhang2,3*, Wei-wei Weng2,3*, Yong Wu2,3, Yu-si Yang2,3, Chen Shen2,3, Xiao-Chen Chen1, Lei Wang2,3, Kai-jing Liu3,4, Mi-die Xu2,3 ![]() , Wei-qi Sheng2,3
, Wei-qi Sheng2,3 ![]()
1. Department of Pathology, Obstetrics and Gynecology Hospital of Fudan University, Shanghai, 200011, China
2. Department of Pathology, Fudan University Shanghai Cancer Center, Shanghai, 200032, China;
3. Department of Oncology, Fudan University Shanghai Cancer Center, Shanghai, 200032, China;
4. Department of Radiation Oncology, Fudan University Shanghai Cancer Center, Shanghai, 200032, China.
* Yi-qin Wang, Qiong-yan Zhang and Wei-wei Weng shared the first-authorships of this article.
Received 2015-8-13; Accepted 2016-1-11; Published 2016-3-3
Abstract

Background: The deubiquitinase OTUB1 plays critical oncogenic roles and facilitates tumor progression in cancer. However, less is known regarding the aberrant expression, clinical significance and biological functions of the non-coding RNA OTUB1-isoform 2. We aimed to evaluate the OTUB1-isoform 2 levels in gastric cancer and their possible correlation with clinicopathologic features and patient survival to reveal its biological effects in gastric cancer progression.
Methods: Total RNA extraction was performed on 156 gastric cancer case samples, and RT-qPCR was conducted. Chi-square test analysis was used to calculate the correlation between pathological parameters and the OTUB1-isoform 2 mRNA levels. Kaplan-Meier and Cox proportional hazards analyses were used to analyze the overall survival (OS) and disease-free survival (DFS) rates. Nuclear and cytoplasmic RNAs were isolated to detect the subcellular localization of OTUB1-isoform 2. We also assessed whether overexpression of OTUB1-isoform 2 influenced in vitro cell proliferation, cell cycle progression, tumor cell invasion and migration, as well as in vivo nude mouse xenograft and metastasis models.
Results: The OTUB1-isoform 2 expression levels were higher in the gastric cancer samples than in the paratumorous gland samples. OTUB1-isoform 2 expression levels tightly correlated with tumor size, lymph node metastasis and TNM staging. Higher OTUB1-isoform 2 expression levels led to significantly poorer OS and DFS rates, and a multivariate analysis revealed that OTUB1-isoform 2 was an independent risk factor for DFS. OTUB1-isoform 2 was predominantly localized in the cell nucleus. Ectopic overexpression of OTUB1-isoform 2 in gastric cancer cells stimulated proliferation by inducing G1-S transition, suppression of cell apoptosis and promotion of tumor cell invasion and migration. Finally, OTUB1-isoform 2 overexpression promoted tumor growth and tumor metastasis in nude mice models.
Conclusions: Our study suggests that OTUB1-isoform 2 independently predicts poor prognosis and promotes tumor progression in gastric cancer. The non-coding RNA OTUB1-isoform 2 should be targeted in future molecular therapies.
Keywords: OTUB1-isoform 2, gastric cancer, prognosis, proliferation, invasion.
Introduction
Gastric carcinoma (GC) is the third leading cause of cancer-related mortality in the world, with nearly 951,600 new cases and 723,100 deaths occurring each year worldwide, according to the National Cancer Institute [1]. Although radical gastrectomy and chemotherapy are widely used, the 5-year survival rate is low, as GC tends to infiltrate and metastasize rapidly in advanced stages [2]. As such, although GC produces a heavy burden on human health, the molecular mechanisms involved in its processes remain unclear [3, 4]. Identifying genes that participate in GC biology is critical to improve clinical practice.
It has been reported that the non-coding RNAs, especially those with sizes larger than 200 nucleotides (long non-coding RNAs, lncRNAs) could play significant roles in various biological processes, such as translational regulation, cell cycle control, cell differentiation and tumorigenesiss [5-8]. Growing evidence has revealed that mutant or aberrant lncRNA expression is associated with gastric cancer pathogenesis, recurrence and metastasis [9-11]. Exploration of GC-related non-coding RNAs especially the lncRNAs could help to guide future molecular therapeutic strategies.
The non-coding RNA OTUB1-isoform 2 (or otubain1 alternative reading frame 1, otubain 1, ARF-1) is a splice variant of oncogenic OTUB1 (OTU domain-containing ubiquitin aldehyde-binding proteins), generally existing in the form of a non-coding RNA with a length of 2518bp in somatic tissues, except in lymph tissues [12]. Compared with isoform 1, OTUB1-isoform 2 remains a relatively low level and its biological functions are unclear [12]. Soares et al. found that OTUB1-isoform 2 regulates GRAIL by stabilizing autoubiquitinated GRAIL, thus controlling the anergy phenotype of T cells, which is functionally opposite of OTUB1 [12], begging the question of whether OTUB1-isoform 2 plays an oncogenic role similar to OTUB1 or if it functions reversely in somatic malignancies.
In this study, we explored the levels of OTUB1-isoform 2 in GC and its possible correlation with clinicopathologic features as well as patient survival and attempted to reveal its biological effects in GC progression using in vitro and vivo experiments.
Materials and Methods
Patient population
A total of 156 patients who underwent surgical resection of primary GC at Fudan University Shanghai Cancer Center from 2008 to 2011 were retrospectively analyzed. No patients had received preoperative therapy. The resected tissue samples were frozen in liquid nitrogen immediately and stored at -80°C until RNA extraction. We collected data, including age, gender and clinicopathologic features such as tumor location, size, histologic stage, lymph node status and distant metastasis from the medical record system. All patients were staged based on the TNM classification system. Patient follow-ups were performed every 3 months during the first year after surgery and 6 months thereafter until May 31, 2015. All patients had complete follow-up information. The Clinical Research Ethics Committee of Fudan University Shanghai Cancer Center approved the study. Written informed consent was obtained from all of the participants for the use of their tissues in the current study.
Cell lines and culture conditions
The human GC cell lines, AGS, MGC-803, MKN45, NCI-N87 and HGC-27 were purchased from the Fudan University IBS cell bank, Shanghai, China. All cell lines were cultured in RPMI-1640 or high glucose DMEM (Gibco, Carlsbad, CA, USA) that was supplemented with 10% fetal bovine serum (FBS) (Gibco, Carlsbad, CA, USA) and 1% penicillin and streptomycin (Sigma, St. Louis, MO, USA) at 37°C in a humidified atmosphere with 5% CO2. Stable OTUB1-isoform 2-infecting AGS and HGC-27 cells were maintained with 2µg/ml puromycin (Sigma, USA).
Plasmids and lenti-virus constructions
The full-length OTUB1-isoform 2 sequence was amplified by PCR from cDNA of NIH: H293T cells and then subcloned into the pcDNA3.1 (+) vector (Transheep, Shanghai, China). pHBLV-IRES-PVT1-puro lento-virus was constructed by Hansheng (Shanghai, China).
Antibodies and reagents
The following antibodies were obtained from Cell Signaling (Boston, MA, USA): c-Myc (D84C12, #12189); cleaved-caspase-3 (D3E9, #8172); cleaved-PARP (D64E10, #5625); cyclin D (92G2, #2978); E-cadherin (#3195); N-cadherin (D4R1H, #13116); MMP2 (D8N9Y, #13132); MMP9 (D6O3H, #13667); and GAPDH (D16H11, #5174). The following reagents were utilized: Lipofectamine 3000 transfection reagent (Lot. 11668-027 Invitrogen, Carlsbad, CA, USA) and RIPA lysis buffer (Lot. 89901, Thermo Scientific, USA). The pcDNA3.1-OTUB1-isoform 2 construct was constructed by Hanhen Co. Ltd. (Shanghai, China).
Proliferation, cell cycle and apoptosis assays
Cells were seeded in 96- or 6-well plates 24 h prior to the experiment. AGS and HGC-27 cells were transfected with pcDNA3.1-OTUB1-isoform 2 or pcDNA3.1 vectors.
Proliferation was measured using the CCK-8 (Dojindo, Japan) and EdU DNA imaging kits (Invitrogen). The CCK8 assay counts living cells at different time points, and the EdU imaging system helps to visualize cell growth differences. Approximately 3.5×10³ transfected cells in 100 µl were incubated in triplicate in 96-well plates. The CCK-8 reagent (10 µl) was added to each well and incubated at 37°C for 2 h every 24 h for 4 consecutive days. Then, we measured the optical density at 450 nm using an automatic microplate reader (Synergy4; BioTek, Winooski, VT, USA). In the EdU DNA assay, 72 h after transfection, cells were incubated with 10 µM EdU solution for 2 h, fixed with 3.7% formaldehyde (Sigma) and penetrated with 0.5% Triton X-100 (Sigma) for 20 minutes. Then, the cells were stained with EdU/Alexia Fluor Azide 594 for 30 minutes, followed by Hoechst 33342 (1:2,000) for another 30 minutes. Then, the cells were imaged at 100× and counted at 200× magnification using immunofluorescence microscopy (IX51, Olympus, Japan).
For cell cycle analysis, 48 h after transfection, cells were collected and fixed with ethanol for 24 h. The cells were washed with PBS twice, stained with propidium iodide (PI, Calbiochem) for 20 minutes and subjected to flow cytometry analysis. Representative data from one of three independent experiments are shown.
For the cell apoptosis analysis, after 48 h of transfection, the cells were collected, washed twice with PBS and then stained with propidium iodide (PI) together with Annexin V/FITC (BD Bioscience, USA). After incubation in the dark for 15-30 min, the cells were analyzed with a flow cytometer.
Cell invasion detection
A transwell assay was used to assess cell invasion with a transwell system from Corning co. Ltd., USA. Twenty-four h after transfection, nearly 4.0×10⁴ cells in 100 µl of serum-free medium were added to each upper chamber. Medium containing 10% fetal bovine serum was applied to the lower chamber as chemo-attractant. After a 24-h incubation at 37°C, the non-invasive cells that were remaining on the chamber were removed with cotton-tipped swabs. The cells that migrated and adhered to the lower surface of the filter were fixed with ethanol, stained with 0.5% crystal violet, photographed at 200×, and counted at 400× magnification (BX51, Olympus, Japan).
Cell Migration Detection
A wound-healing assay was used to assess cell motility. Transfected cells were plated at equal density in 6-well plates and grown to confluency. Wounds were then scratched with a sterile pipette tip, the cells were washed twice with PBS and serum-free culture medium was added. The wound closing procedure was observed for 48 h, and images were captured every 24 h at 100× magnification (BX51, Olympus, Japan).
Western Blotting
Sample buffer was added to cell lysates, and the solution was boiled at 95°C for 5 min. The samples were separated on SDS-PAGE gels at 80 V for 3 h and then transferred to PVDF membranes for 2 h. Then, the membranes were blocked with 5% BSA for 30 minutes and incubated with primary antibodies at 4°C overnight and washed three times with 1% TBST followed by incubation with secondary antibodies for 1 h. The final detection was performed following the addition of an ECL substrate (#32209, Thermo Fisher, USA).
Total RNA Isolation and RT-qPCR
Total RNA was extracted from the tumorous and adjacent normal tissues using Trizol (Invitrogen, Carlsbad, CA, USA) following the manufacturer's protocol. Real-time (RT) and quantitative polymerase chain reaction (qPCR) kits were used to evaluate the OTUB1-isoform 2 expression levels from the tissue samples. The RT and qPCR reactions were conducted as previously described [13]. Relative gene expression was calculated using the comparative cycle threshold (CT) (2-ΔΔCT) method. Glyceraldehyde-3-phosphate dehydrogenase (GAPDH) was used as an endogenous control to normalize the data. The primer sequences that were utilized are as follows: 5'-GC ACCAGGTTTGGAATGGG-3' (forward) and 5'-CATGTTGGGAGAAGGGGTG-3' (reverse) for N-cadherin, 5′-GACCGAGAGAGTTTCCCTACG-3′ (forward) and 5′-TCAGGCACCTGACCCTTGTA-3′ (reverse) for E-cadherin, 5'-TACAGGATCATTGGCTACACACC-3' (forward) and 5'-GGTCACATCGCTCCAGACT-3' (reverse) for MMP2, and 5'-TGTACCGCTATGGTTACACTCG-3' (forward) and 5'-GGCAGGGACAGTTGCTTCT-3' (reverse) for MMP9. The utilized OTUB1 and OTUB1-isoform 2 primers were designed in a previous study [12]. The OTUB1-isoform 2 mRNA levels were defined as high if they were above the median value [13-15].
RNA fractionation and isolation
AGS and HGC-27 cells were used to detect OTUB1-isoform 2 localization. The nuclear and cytoplasmic RNAs were extracted and isolated with protein and RNA isolation systems (PARIS, Ambion, Thermo Fisher, USA).
In vivo nude mouse xenograft and tumor metastasis models
The Shanghai Medical Experimental Animal Care Commission approved the animal experiments. Female BALB/c-nu mice (4-5 weeks of age, 18-20 g) were maintained under specific pathogen-free conditions at the Fudan University Experimental Animal Department. All experimental procedures involving animals were undertaken in accordance with the institute's guidelines. For the xenograft models, a total of 1×10⁷ Lenti-NC and Lenti-OTUB1-isoform 2 stably infected AGS cells were injected s.c. into the flank regions of female BALB/c nude mice, which were 8 weeks old (n=4 per group), for 30 days. For the tumor metastasis models, 1×10⁶ Lenti-NC and Lenti-OTUB1-isoform 2 stably infected AGS cells All of the mice were injected into tail veins of mice (n=3 per group) and then were kept under observation for 28 days. All the mice were anaesthetized and sacrificed. The xenografts and lungs were excised and measured. The tumor volumes were calculated using the formula 1⁄2×r12×r2 (r1<r2).
Statistical analyses
Each experiment was repeated three times, and the data are presented as the mean with error bars indicating the standard deviation. All statistical analyses were performed using SPSS 20.0 (IBM, SPSS, Chicago, IL, USA). Student's t-test and one-way ANOVA analyses were used for either 2 or multiple group comparisons, respectively, for statistical significance. Correlations among the clinicoparameters and OTUB1-isoform 2 expressions levels were examined using the chi-square or Fisher's exact probability tests. DFS and OS curves were calculated by the Kaplan-Meier method and analyzed with the log-rank test. The DFS rates were calculated from the date of surgery to the date of disease progression (local and/or distal tumor recurrence) or to the date of death. The OS rate was defined as the length of time between the diagnosis and death or last follow-up. Variables with a value of p<0.05 in the univariate analyses were used in the multivariate analysis on the basis of the Cox proportional hazards model. All p values were 2-sided, and statistical significance was established at p<0.05.
Results
OTUB1-isoform 2 was upregulated in GC
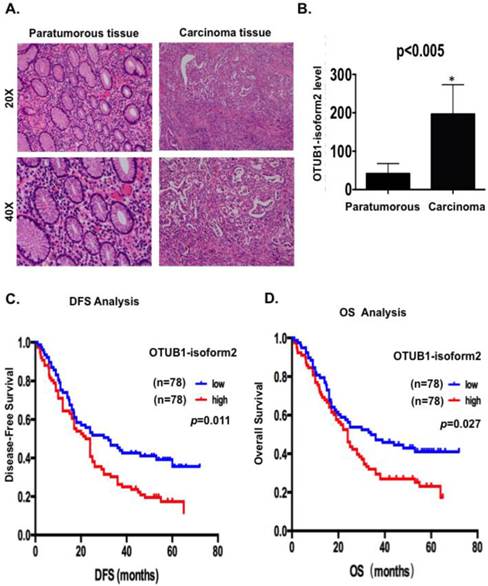
Because OTUB1-isoform 2 exists as a non-coding RNA in somatic organs, except in lymph tissues, we first detected the OTUB1-isoform 2 levels using RT-qPCR with specific primers [12] in extracted total RNA from 156 GC patients to confirm whether this isoform could be detected in GC and whether its level would be higher in malignant lesions than in benign areas. We observed significantly higher OTUB1-isoform 2 mRNA levels in the 156 malignant lesions than in the relatively benign paratumorous areas (p<0.05, Fig. 1A-B), suggesting that OTUB1-isoform 2 could be detected in GC and its mRNA level is abnormally upregulated.
OTUB1-isoform 2 was highly expressed and predicted poor gastric cancer prognosis. A. Representative hematoxylin-eosin stained images of tumor and paratumorous tissues selected for OTUB1-isoform 2 detection by RT-qPCR. B. Statistical analytical graph of OTUB1-isoform 2 mRNA levels in paratumorous and GC tumor tissues (n=156, p<0.01). C. Kaplan-Meier disease-free survival (DFS) curve of GC patients with different OTUB1-isoform 2 mRNA levels (Low, n=78 vs. High, n=78). D. Kaplan-Meier disease-free survival overall survival (OS) (right) curves of GC patients with different OTUB1-isoform 2 mRNA levels (Low, n=78 vs. High, n=78).
OTUB1-isoform 2 upregulation correlated with GC clinicopathologic characteristics and patient survival
Next, we analyzed the correlation between OTUB1-isoform 2 levels and the clinicopathologic status of GC patients (Table 1). The OTUB1-isoform 2 mRNA levels were upregulated in tumors with a higher tumor burden, as defined by larger tumor sizes (p=0.001), presence of lymph node metastasis (p=0.001) and TNM staging (p=0.017; Table 1). However, no significant correlation was found between the OTUB1-isoform 2 levels and age, tumor grade or recurrence.
Relationship between Otub1-isoform2 and histopathological factors of gastric cancer patients.
| Characteristics | Number of case | % | Otub1-isoform2 | χ2 | P | ||
|---|---|---|---|---|---|---|---|
| Low | High | ||||||
| Age (years) | |||||||
| <60 | 73 | 46.79 | 40 | 33 | 1.262 | 0.261 | |
| ≥60 | 83 | 53.21 | 38 | 45 | |||
| Gender | |||||||
| Male | 120 | 76.92 | 64 | 56 | 2.311 | 0.128 | |
| Female | 36 | 23.08 | 14 | 22 | |||
| Location | |||||||
| Up | 38 | 24.36 | 21 | 17 | 1.350 | 0.717 | |
| Middle | 51 | 32.69 | 26 | 25 | |||
| Down | 49 | 31.41 | 24 | 25 | |||
| Diffuse | 18 | 11.54 | 7 | 11 | |||
| Size (cm) | |||||||
| <5 | 91 | 58.33 | 56 | 35 | 11.631 | 0.001* | |
| ≥5 | 65 | 41.67 | 22 | 43 | |||
| Invasive depth | |||||||
| 1 | 12 | 7.69 | 7 | 5 | 0.361 | 0.548 | |
| 2 | 144 | 92.31 | 71 | 73 | |||
| Tumor grade | |||||||
| Poor+others | 117 | 75.00 | 53 | 64 | 4.137 | 0.042 | |
| Well+mod | 39 | 25.00 | 25 | 14 | |||
| Lymphatic invasion | |||||||
| - | 61 | 39.10 | 34 | 27 | 1.319 | 0.251 | |
| + | 95 | 60.90 | 44 | 51 | |||
| Nerve invasion | |||||||
| - | 50 | 32.05 | 26 | 24 | 0.118 | 0.732 | |
| + | 106 | 67.95 | 52 | 54 | |||
| T stage | |||||||
| T1 | 2 | 1.28 | 2 | 0 | 4.992 | 0.172 | |
| T2 | 10 | 6.41 | 5 | 5 | |||
| T3 | 21 | 13.46 | 14 | 7 | |||
| T4 | 123 | 78.85 | 57 | 66 | |||
| LNM | |||||||
| - | 20 | 12.82 | 14 | 6 | 3.671 | 0.055 | |
| + | 136 | 87.18 | 64 | 72 | |||
| N station | |||||||
| N0 | 20 | 12.82 | 14 | 6 | 15.441 | 0.001* | |
| N1 | 19 | 12.18 | 11 | 8 | |||
| N2 | 37 | 23.72 | 25 | 12 | |||
| N3 | 80 | 51.28 | 28 | 52 | |||
| M | |||||||
| - | 129 | 82.69 | 63 | 66 | 0.403 | 0.525 | |
| + | 27 | 13.31 | 15 | 12 | |||
| pTNM | |||||||
| Ⅰ | 5 | 3.21 | 3 | 2 | 6.359 | 0.095 | |
| Ⅱ | 26 | 16.67 | 18 | 8 | |||
| Ⅲ | 104 | 66,67 | 45 | 59 | |||
| Ⅳ | 21 | 13.45 | 12 | 9 | |||
| TNM staging | |||||||
| Ⅰ+Ⅱ | 32 | 20.51 | 22 | 10 | 5.661 | 0.017* | |
| Ⅲ+Ⅳ | 124 | 79.49 | 56 | 68 | |||
| Recurrence | |||||||
| - | 83 | 53.21 | 46 | 37 | 2.085 | 0.149 | |
| + | 73 | 46.79 | 32 | 41 | |||
Next, we conducted a Kaplan-Meier analysis using the log-rank test to explore the potential influence of OTUB1-isoform 2 expression on patient survival. OTUB1-isoform 2 mRNA levels were divided into low (n=78) and high (n=78) levels, based on the median value [13-15]. The total median follow-up time for the patients who were still alive at the endpoint for analysis was 57 months. The median follow-up time for the patients who were still alive at the endpoint was 56.5 months in the group with high OTUB1-isoform 2 expression and 57 months in the group with low expression.
The results showed that patients with high OTUB1-isoform 2 levels (n=78) had significantly shorter DFS (p<0.05; Fig. 1C) and OS rates (p<0.05; Fig. 1D) than those with low levels (n=78). A univariate Cox analysis showed that invasion depth, nerve invasion, N station, pTNM stage, recurrence and OTUB1-isoform 2 levels correlated with the DFS and OS rates (Table 2-3). A multivariate analysis using the Cox proportional hazard model demonstrated that the OTUB1-isoform 2 level was an independent risk factor for DFS (p=0.039, Table 2) but not for OS (Table 3). Notably, the pTNM staging and recurrence were independent risk factors for both DFS and OS (Tables 2-3). These results identified that upregulated OTUB1-isoform 2 levels in GC patients predicted poor survival and might be a prognostic biomarker for the disease.
Univariate and Multivariate analysis of disease-free survival in GC.
| Variable | Univariate analysis | Multivariate analysis | ||||
|---|---|---|---|---|---|---|
| HR | 95%CI | p value | HR | 95%CI | p value | |
| Invasive depth | 3.138 | 1.155-8.525 | 0.025* | -- | -- | -- |
| Nerve invasion | 1.813 | 1.184-2.777 | 0.006* | -- | -- | -- |
| N station | 1.496 | 1.225-1.827 | <0.001* | -- | -- | -- |
| pTNM stage | 1.999 | 1.466-2.726 | <0.001* | 1.787 | 1.283-2.488 | 0.001* |
| Recurrence | 2.975 | 2.002-4.420 | <0.001* | 2.361 | 1.572-3.545 | <0.001* |
| Otub1-isoform2 | 1.615 | 1.111-2.348 | 0.011* | 1.498 | 1.021-2.200 | 0.039* |
HR.hazard ratio, CI.confidence interval, *p <0.05.
Univariate and Multivariate analysis of overall survival in GC.
| Variable | Univariate analysis | Multivariate analysis | ||||
|---|---|---|---|---|---|---|
| HR | 95%CI | p value | HR | 95%CI | p value | |
| Invasive depth | 2.774 | 1.020 -7.541 | 0.046* | -- | -- | -- |
| Nerve invasion | 1.841 | 1.179-2.874 | 0.007* | -- | -- | -- |
| N station | 1.478 | 1.201-1.818 | <0.001* | -- | -- | -- |
| pTNM stage | 1.962 | 1.430-2.692 | <0.001* | 1.743 | 1.253-2.400 | 0.001* |
| Recurrence | 2.212 | 1.488-3.290 | <0.001* | 1.839 | 1.220-2.771 | 0.004* |
| Otub1-isoform2 | 1.538 | 1.044-2.265 | 0.029* | -- | -- | -- |
HR.hazard ratio, CI.confidence interval, *p <0.05.
Identification of the specificity of OTUB1-isoform 2 cellular localization in GC cell lines
To identify the biological functions of OTUB1-isoform 2 in GC cells, we first detected the baseline mRNA levels of OTUB1-isoform 2 in 5 GC cell lines by RT-qPCR, and the results are shown for both an RNA gel and a statistical graph (Fig. 2A-B).
OTUB1-isoform 2 overexpression in GC. A. The gel image of the baseline OTUB1-isoform 2 mRNA levels in 5 GC cell lines by RNA electrophoresis. GAPDH was used as the endogenous control. The ladder as well as the OTUB1-isoform 2 weight is shown in the graph. B. A statistical analytical graph of the baseline OTUB1-isoform 2 mRNA levels in 5 GC cell lines, as detected by RT-qPCR. C. A statistical analytical graph of OTUB1-isoform 2 mRNA levels in the cytoplasm and nucleus of AGS and HGC-27 cells. GAPDH was used as the endogenous control. U6 was used as the endogenous control of nucleus and MTMR1 was used as the endogenous control of cytoplasm, according to the PARIS manuals. *: p<0.01. D. A statistical analytical graph of OTUB1-isoform 2 mRNA levels in AGS and HGC-27 cells that were transfected with pcDNA3.1-OTUB1-isoform 2 by RT-qPCR. *: p<0.01.
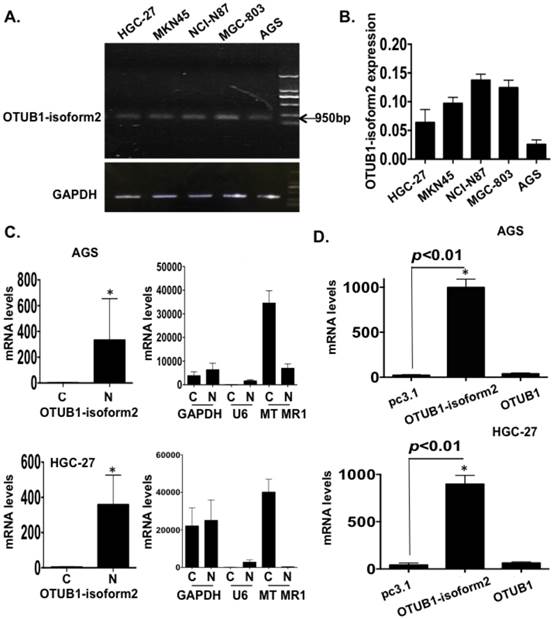
The OTUB1-isoform 2 was detected at the 950bp level in an RNA gel (Fig. 2A), which was consistent with a previous study [12]. The RT-qPCR also showed that the OTUB1-isoform 2 expression was lower in both the AGS and HGC-27 cells (Fig. 2A-B). Moreover, the RNA fractionation and isolation assays showed that OTUB1-isoform 2 was predominantly localized in the nucleus of the AGS and HGC-27 cells (Fig. 2C), while OTUB1 was observed as a cytoplasmic protein (Fig. S1) [16, 17]. This result suggested that these two isoforms were localized separately and might function independently.
Efficiency identification of OTUB1-isoform 2 overexpression in GC cells
Next, we transfected pcDNA3.1 or pcDNA3.1-OTUB1-isoform 2 constructs into AGS and HGC-27 cells for 48h followed by RT-qPCR. To confirm the specific overexpression efficiency of the OTUB1-isoform 2 plasmid, we also detected the OTUB1 expression levels with specific primers [12]. The specificity of primers were identified by RNA electrophoresis and sequencing of regular PCR products (Fig. S2). As shown in figure 2, the OTUB1-isoform 2 mRNA levels were significantly increased by OTUB1-isoform 2 overexpression in the AGS and HGC-27 cells compared with the control vectors while the OTUB1 expression levels were not significantly influenced (Fig. 2D), suggesting a satisfactory and independent overexpression efficiency of OTUB1-isoform 2 plasmid levels in the cells.
OTUB1-isoform 2 promotes gastric tumor cell proliferation
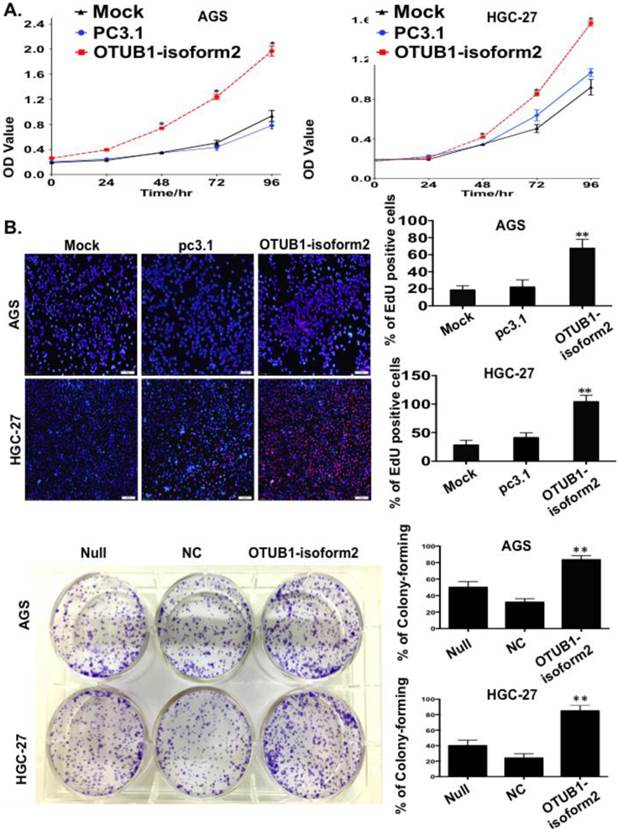
To observe the influence of OTUB1-isoform 2 on tumor cell proliferation, we conducted a panel of experiments. First, the CCK8 assay results suggested that OTUB1-isoform 2 overexpression significantly accelerated the AGS and HGC-27 cell proliferation compared with the controls (p<0.01, Fig. 3A). Next, the EdU imaging assay showed more living and S phase cells in the OTUB1-isoform 2-overexpressing AGS and HGC-27 cells than in the controls (p<0.05, Fig. 3B). Finally, a colony-forming assay showed persistent cell proliferation stimulation in the stably OTUB1-isoform 2-infected AGS and HGC cells compared with controls (p<0.05, Fig. 3C). Together, these results suggested that OTUB1-isoform 2 promoted GC cell proliferation in vitro.
OTUB1-isoform 2 stimulated tumor cell proliferation in GC. A. The CCK8 cell counting assays revealed cell growth curves of AGS and HGC-27 cells that were transfected with the indicated plasmids at the indicated time points. Error bars are shown. *: p<0.01. B. The EdU imaging results revealed cell growth curves of AGS and HGC-27 cells that were transfected with the indicated plasmids (scale bars, 100 µm). The EdU-positive cells were counted under 200× magnification with an immunofluorescence microscope. **: p<0.05. C. representative images of the colony-forming results of AGS and HGC-27 cells that were infected with the indicated lenti-virus for 14 days. **: p<0.05.
OTUB1-isoform 2 prompted cell cycle progression in GC cells
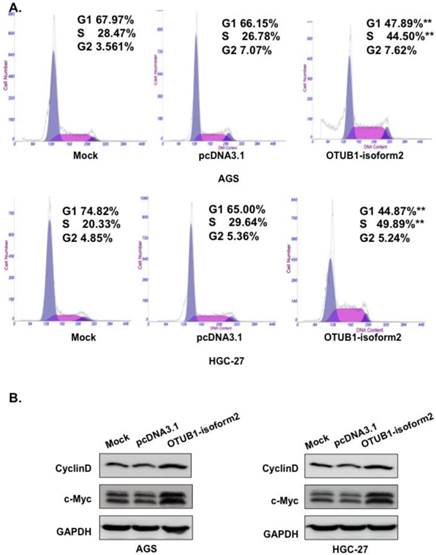
Based on the cell proliferation alterations caused by OTUB1-isoform 2 that were observed in the CCK8 and EdU assays, we next performed fluorescence-activated cell sorting (FACS) to analyze DNA content changes throughout the cell cycle. The FACS data showed a significantly decreased proportion of cells in the G1 phase; however, elevated S phase levels were observed in the OTUB1-isoform 2-overexpressing AGS and HGC-27 cells compared with the control vectors (Fig. 4A, p<0.05). Western blotting results also showed that OTUB1-isoform 2 overexpression in the AGS and HGC-27 cells induced Cyclin D1 and c-Myc expression (Fig. 4B). Taken together, these results suggest that OTUB1-isoform 2 promoted cell cycle progression by inducing the G1-S transition in GC.
OTUB1-isoform 2 promoted cell cycle progression in GC. A. Representative flow-cytometric images with proportion determinations of the indicated cells in distinct cell cycle phases. **: p<0.05. B. Western blotting results of cyclin D and c-Myc for the indicated cells. GAPDH was used as the reference control.
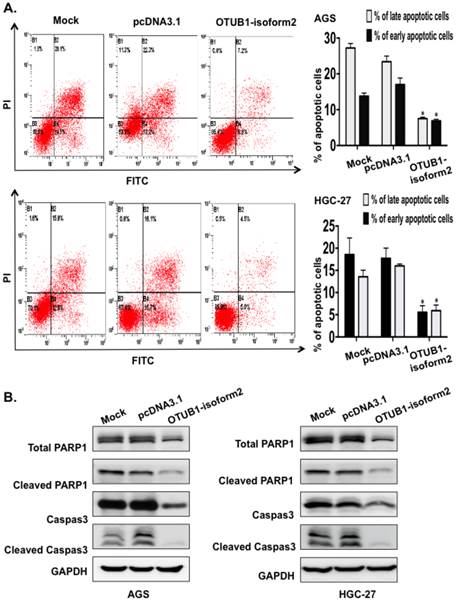
OTUB1-isoform 2 suppressed cell apoptosis in GC cells
Next, we conducted FACS to investigate the potential effect of OTUB1-isoform 2 overexpression on cellular apoptosis. The FACS data presented significantly decreased early and late apoptotic cell proportions in the OTUB1-isoform 2-overexpressing AGS and HGC-27 cells compared with the control vectors (Fig. 5A). The Western blotting results also showed that OTUB1-isoform 2 overexpression in AGS and HGC-27 cells decreased the total PARP, Caspase 3, cleaved Caspase and cleaved PARP expression levels (Fig. 5B), suggesting that OTUB1-isoform 2 suppresses cellular apoptosis in GC cells.
OTUB1-isoform 2 suppressed cell apoptosis in GC. A. Representative flow-cytometric images with proportion determinations of early and late apoptosis in the indicated cells. *: p<0.01. B. Western blotting results of cleaved PARP and cleaved caspase-3 in the indicated cells. GAPDH was used as the reference control.
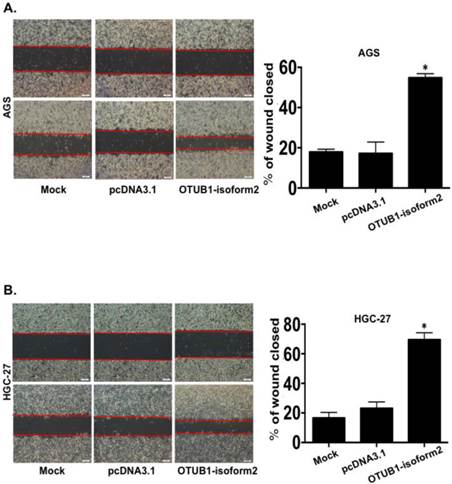
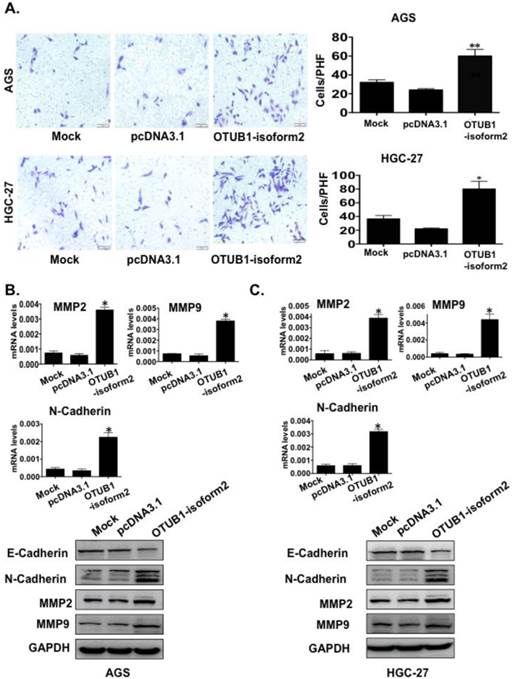
OTUB1-isoform 2 enhanced tumor cell migration and invasion in vitro
To determine whether OTUB1-isoform 2 promoted tumor cell invasion and migration in gastric carcinoma, we conducted transwell and wound-healing assays. OTUB1-isoform 2 overexpression in both AGS and HGC-27 cells resulted in significantly increased cellular mobility (Fig. 6A-B, p<0.05) and invasiveness (Fig. 7A, p<0.05). Accordingly, the Western blotting and RT-qPCR results supported this observation, showing that OTUB1-isoform 2 overexpression in AGS and HGC-27 cells induced invasion-promoting gene expression, such as N-cadherin, MMP2 and MMP9; however, it suppressed the invasion-suppressing protein, E-Cadherin (Fig. 7B-C). Interestingly, we failed to observe an obvious morphological change in the OTUB1-isoform 2-transfected AGS and HGC-27 cells (Fig. S3). Collectively, these data suggest that OTUB1-isoform 2 induces tumor cell migration and invasion in GC cells.
OTUB1-isoform 2 induced tumor cell migration in GC. A. Representative images (left) and quantification (right) of wound-healing assays for AGS cells. (Scale bars, 400 µm). *: p<0.01. B. Representative images (left) and quantification (right) of wound-healing assays for HGC-27 cells. (Scale bars, 400 µm). *: p<0.01.
OTUB1-isoform 2 induced tumor cell invasion in GC. A. Representative images (left) and quantification (right) of transwell invasion assays for the indicated cells. (Scale bars, 50 µm). *: p<0.01. **: p<0.05. B. RT-qPCR and immunoblotting E-cadherin, N-cadherin, MMP2 and MMP9 results in AGS cells. GAPDH was used as the reference control. *: p<0.01. C. RT-qPCR and immunoblotting results of E-cadherin, N-cadherin, MMP2 and MMP9 results in HGC-27 cells. GAPDH was used as the reference control. *: p<0.01.
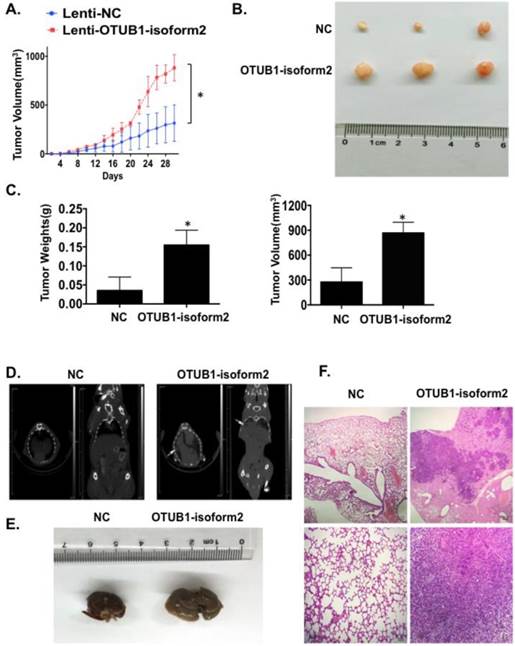
OTUB1-isoform 2 promoted tumor growth and tumor metastasis in nude mice models
Finally, we investigated tumorigenicity and tumor metastasis by overexpressing OTUB1-isoform 2 in nude mice. Overexpression of OTUB1-isoform 2 significantly accelerated tumor growth compared with controls (Fig. 8A); OTUB1-isoform 2 overexpression significantly elevated the volumes and weights of the xenografts compared with controls (Fig. 8B-C). Meanwhile, the CT scanning found highly suspicious metastatic lesions in lungs of OTUB1-isoform 2 overexpressing nude mice but not in the control group (Fig. 8D arrows). The subsequent gross sampling and H&E slides also determined that the metastatic cancer lesions were formed in the OTUB1-isoform 2 overexpressing groups while no metastatic lesions were found in controls (Fig. 8E-F). Taken together, these data suggest that OTUB1-isoform 2 promotes tumor growth and tumor metastasis in nude mice models.
OTUB1-isoform 2 promoted xenograft growth and metastasis in nude mice models. A. A statistical analytical graph of the xenograft tumor growth speed. The error bars are shown. *: p<0.01. B. Representative xenograft images of the Lenti-NC and Lenti-OTUB1-isoform 2 AGS groups. C. A statistical analytical graph of the xenograft tumor weights and volumes. The error bars are shown. *: p<0.01. D. The representative CT-scanning results of Lenti-NC and Lenti-OTUB1-isoform 2 AGS groups. Left: The CT scanning of lung tissues from Lenti-NC and Lenti-OTUB1-isoform 2 AGS groups. Right: The CT scanning of dead mice from Lenti-NC and Lenti-OTUB1-isoform 2 AGS groups. Arrows pointed out the suspicious lesions in lungs under CT-scanning. E. The representative gross photos of lung tissues from Lenti-NC and Lenti-OTUB1-isoform 2 AGS groups. F. The representative H&E photos of lung tissues from Lenti-NC and Lenti-OTUB1-isoform 2 AGS groups. Top: The scale bars=200µm. Bottom: The scale bars=50µm.
Discussion
Notably, our study is the first to show the mRNA level changes and biological functions of OTUB1-isoform 2 in GC tissues and cell lines. We found that OTUB1-isoform 2 was highly expressed in GC tumor tissues compared with paratumorous tissue. High OTUB1-isoform 2 mRNA levels correlated directly with increased GC malignancy and poorer GC prognoses. We also observed OTUB1-isoform 2 nuclear localization in GC cells. Additionally, in vitro experiments revealed that OTUB1-isoform 2 promoted GC cell proliferation, migration and metastasis. Moreover, OTUB1-isoform 2 overexpression promoted xenograft growth and tumor metastasis in nude mice models. These results suggest that OTUB1-isoform 2 might be a novel prognostic indicator of gastric carcinoma.
The significant correlation between the higher OTUB1-isoform 2 mRNA levels and a higher tumor burden suggests that OTUB1-isoform 2 might contribute to GC development via stimulating tumor growth and invasion, which was supported by the clinical analysis results as well as the in vitro and vivo experiments. The FACS and EdU data demonstrated that OTUB1-isoform 2 could be inducing G1-S transition and accumulate GC cells in the S phase, which was possibly due to the elevation of cell cycle promoting proteins, including cyclin D and c-Myc through OTUB1-isoform 2 overexpression. The elevated cell cycle promoting proteins could accelerate the progression of the cell cycle from the G1 to the S phase, thus prolonging the S phase and leading to cell proliferation. Considering that we used RT-qPCR to determine the expressions of OTUB1-isoform2 in tumor tissues, the tumor cellularity might contribute to the results. Future studies could try to use other approaches such as laser capture microdissection for improvement.
Additionally, OTUB1-isoform 2 overexpression enhanced cell migration and invasion, which was demonstrated with transwell, wound-healing and tumor metastasis models. The transient OTUB1-isoform 2 overexpression induced expression of invasion-promoting genes, such as N-cadherin, MMP2 and MMP9, and it diminished the expression of the invasion-suppressing gene, E-cadherin. The changes in these invasion-related genes, both at the mRNA and protein levels, might explain why OTUB1-isoform 2 overexpression facilitated tumor invasion and metastasis.
The molecular activity of OTUB1-isoform 2 was first reported by Soares et al., who described the opposite regulating effects of OTUB1 and OTUB1-isoform 2 on GRAIL stability, thus controlling the anergy phenotype in T cells [12]. Considering that OTUB1-isoform 2 encodes for the protein, ARF-1, in the immune system, it might function differently in the non-coding RNA form in somatic organs. Growing evidence has demonstrated that isoforms could exhibit similar biological activities, as their structures are closely related to each other [18, 19]. In our study, we found that OTUB1-isoform 2 exerted oncogenic functions in GC. As the deubiquitinase, OTUB1, has been reported to exert oncogenic functions in gastrointestinal cancer in previous studies [20, 21], the results from our study might present the question as to whether isoform function is dependent upon each other. However, in our study, the RNA fractionation and isolation assay results showed that OTUB1-isoform 2 had an independent subcellular localization, as it was predominantly localized in the nucleus, while OTUB1 was already shown to be localized in the cytoplasm [16, 17]. Moreover, OTUB1-isoform 2 overexpression failed to change the OTUB1 levels in the cells in our study. A previous study suggested that OTUB1-isoform 2 operates independently of OTUB1 in the immune system. Therefore, we believe that these two isoforms function cooperatively but independently in cells. It would be interesting to evaluate in the future whether a cross interaction lies between OTUB1-isoform 2 and the downstream targets of OTUB1, but with a different molecular mechanism.
Finally, we observed high OTUB1-isoform 2 mRNA levels in GC tumor tissues and these levels predicted poor prognoses in GC, which suggests that OTUB1-isoform 2 could be a valuable prognostic predictor in clinical practice. Future studies should evaluate and detect its mRNA levels in the serum wither a larger sample size to confirm its clinical value in the clinical monitoring of tumor progression and prognosis.
Conclusions
Our study suggests that OTUB1-isoform 2 predicts poor prognoses and promotes tumor progression in GC. OTUB1-isoform 2 evaluations might be applied in clinical practice as a tumor invasiveness marker and for the prediction of patient risk.
Supplementary Material
Figs. S1-S3.
Acknowledgements
This study was supported by National Natural Science Foundation of China (No. 81201898), National Clinical Key Discipline (2013-2015), Priority of Shanghai key discipline of medicine (2013-2015) and Shanghai R&D public service platform construction projects (12DZ2295100).
Competing Interests
The authors have declared that no competing interest exists.
References
1. Torre LA, Bray F, Siegel RL, Ferlay J, Lortet-Tieulent J, Jemal A. Global cancer statistics, 2012. CA Cancer J Clin. 2015;65:87-108
2. Strong VE, Wu AW, Selby LV, Gonen M, Hsu M, Song KY, Park CH, Coit DG, Ji JF, Brennan MF. Differences in gastric cancer survival between the U.S. and China. J Surg Oncol. 2015;112:31-37
3. Kong X, Qian J, Chen LS, Wang YC, Wang JL, Chen H, Weng YR, Zhao SL, Hong J, Chen YX, Zou W, Xu J, Fang JY. Synbindin in extracellular signal-regulated protein kinase spatial regulation and gastric cancer aggressiveness. J Natl Cancer Inst. 2013;105:1738-1749
4. Wadhwa R, Song S, Lee JS, Yao Y, Wei Q, Ajani JA. Gastric cancer-molecular and clinical dimensions. Nat Rev Clin Oncol. 2013;10:643-655
5. Huarte M, Guttman M, Feldser D, Garber M, Koziol MJ, Kenzelmann-Broz D, Khalil AM, Zuk O, Amit I, Rabani M, Attardi LD, Regev A, Lander ES, Jacks T, Rinn JL. A large intergenic noncoding RNA induced by p53 mediates global gene repression in the p53 response. Cell. 2010;142:409-419
6. Hung T, Wang Y, Lin MF, Koegel AK, Kotake Y, Grant GD, Horlings HM, Shah N, Umbricht C, Wang P, Wang Y, Kong B, Langerod A, Borresen-Dale AL, Kim SK, van de Vijver M, Sukumar S, Whitfield ML, Kellis M, Xiong Y, Wong DJ, Chang HY. Extensive and coordinated transcription of noncoding RNAs within cell-cycle promoters. Nat Genet. 2011;43:621-629
7. Gibb EA, Brown CJ, Lam WL. The functional role of long non-coding RNA in human carcinomas. Mol Cancer. 2011;10:38
8. Mercer TR, Dinger ME, Mattick JS. Long non-coding RNAs: insights into functions. Nat Rev Genet. 2009;10:155-159
9. Xu MD, Qi P, Du X. Long non-coding RNAs in colorectal cancer: implications for pathogenesis and clinical application. Mod Pathol. 2014;27:1310-1320
10. Qi P, Du X. The long non-coding RNAs, a new cancer diagnostic and therapeutic gold mine. Mod Pathol. 2013;26:155-165
11. Li CH, Chen Y. Targeting long non-coding RNAs in cancers: progress and prospects. Int J Biochem Cell Biol. 2013;45:1895-1910
12. Soares L, Seroogy C, Skrenta H, Anandasabapathy N, Lovelace P, Chung CD, Engleman E, Fathman CG. Two isoforms of otubain 1 regulate T cell anergy via GRAIL. Nat Immunol. 2004;5:45-54
13. Qi P, Xu MD, Ni SJ, Huang D, Wei P, Tan C, Zhou XY, Du X. Low expression of LOC285194 is associated with poor prognosis in colorectal cancer. J Transl Med. 2013;11:122
14. Linardou H, Kalogeras KT, Kronenwett R, Kouvatseas G, Wirtz RM, Zagouri F, Gogas H, Christodoulou C, Koutras AK, Samantas E, Pectasides D, Bafaloukos D, Fountzilas G. The prognostic and predictive value of mRNA expression of vascular endothelial growth factor family members in breast cancer: a study in primary tumors of high-risk early breast cancer patients participating in a randomized Hellenic Cooperative Oncology Group trial. Breast Cancer Res. 2012;14:R145
15. Xu MD, Qi P, Weng WW, Shen XH, Ni SJ, Dong L, Huang D, Tan C, Sheng WQ, Zhou XY, Du X. Long non-coding RNA LSINCT5 predicts negative prognosis and exhibits oncogenic activity in gastric cancer. Medicine (Baltimore). 2014;93:e303
16. Sun XX, Dai MS. Deubiquitinating enzyme regulation of the p53 pathway: A lesson from Otub1. World J Biol Chem. 2014;5:75-84
17. Edelmann MJ, Kramer HB, Altun M, Kessler BM. Post-translational modification of the deubiquitinating enzyme otubain 1 modulates active RhoA levels and susceptibility to Yersinia invasion. FEBS J. 2010;277:2515-2530
18. Kong X, Li L, Li Z, Le X, Huang C, Jia Z, Cui J, Huang S, Wang L, Xie K. Dysregulated expression of FOXM1 isoforms drives progression of pancreatic cancer. Cancer Res. 2013;73:3987-3996
19. Li Q, Zhang N, Jia Z, Le X, Dai B, Wei D, Huang S, Tan D, Xie K. Critical role and regulation of transcription factor FoxM1 in human gastric cancer angiogenesis and progression. Cancer Res. 2009;69:3501-3509
20. Liu X, Jiang WN, Wang JG, Chen H. Colon cancer bears overexpression of OTUB1. Pathol Res Pract. 2014;210:770-773
21. Zhou Y, Wu J, Fu X, Du W, Zhou L, Meng X, Yu H, Lin J, Ye W, Liu J, Peng H, Liu RY, Pan C, Huang W. OTUB1 promotes metastasis and serves as a marker of poor prognosis in colorectal cancer. Mol Cancer. 2014;13:258
Author contact
![]() Corresponding authors: Dr. Wei-qi Sheng. MD, PhD, Department of Pathology, Fudan University Shanghai Cancer Center, 270 Dong'an Road, Shanghai 200032, People's Republic of China. E-mail: wqshengshanghaicom Tel: +86-21-64175590; Fax: +86-21-64174774.
Corresponding authors: Dr. Wei-qi Sheng. MD, PhD, Department of Pathology, Fudan University Shanghai Cancer Center, 270 Dong'an Road, Shanghai 200032, People's Republic of China. E-mail: wqshengshanghaicom Tel: +86-21-64175590; Fax: +86-21-64174774.