Impact Factor ISSN: 1449-2288

 Global reach, higher impact
Int J Biol Sci 2022; 18(12):4714-4730. doi:10.7150/ijbs.72709 This issue Cite
Research Paper
Targeting ACLY efficiently inhibits SARS-CoV-2 replication
Terrence Tsz-Tai Yuen1,*, Jasper Fuk-Woo Chan1,2,3,4,5,6,*, Bingpeng Yan1,*, Cynthia Cheuk-Ying Shum1, Yuanchen Liu1, Huiping Shuai1, Yuxin Hou1, Xiner Huang1, Bingjie Hu1, Yue Chai1, Chaemin Yoon1, Tianrenzheng Zhu1, Huan Liu1, Jialu Shi1, Jinjin Zhang1, Jian-Piao Cai1, Anna Jinxia Zhang1,3, Jie Zhou1,3, Feifei Yin6,7,8, Shuofeng Yuan1,2,3, Bao-Zhong Zhang9, Hin Chu1,2,3, ![]()
1. State Key Laboratory of Emerging Infectious Diseases, Department of Microbiology, and Carol Yu Centre for Infection, School of Clinical Medicine, Li Ka Shing Faculty of Medicine, The University of Hong Kong, Pokfulam, Hong Kong Special Administrative Region, People's Republic of China.
2. Department of Clinical Microbiology and Infection Control, The University of Hong Kong-Shenzhen Hospital, Shenzhen, Guangdong, People's Republic of China.
3. Centre for Virology, Vaccinology and Therapeutics, Hong Kong Science and Technology Park, Hong Kong Special Administrative Region, People's Republic of China.
4. Department of Microbiology, Queen Mary Hospital, Pokfulam, Hong Kong Special Administrative Region, People's Republic of China.
5. Guangzhou Laboratory, Guangdong Province, China.
6. Academician Workstation of Hainan Province, Hainan Medical University-The University of Hong Kong Joint Laboratory of Tropical Infectious Diseases, Hainan Medical University, Haikou, Hainan, People's Republic of China and The University of Hong Kong, Pokfulam, Hong Kong Special Administrative Region, China.
7. Key Laboratory of Tropical Translational Medicine of Ministry of Education, Hainan Medical University, Haikou, Hainan, China.
8. Department of Pathogen Biology, Hainan Medical University, Haikou, Hainan, China.
9. CAS Key Laboratory of Quantitative Engineering Biology, Shenzhen Institute of Synthetic Biology, Shenzhen Institutes of Advanced Technology, Chinese Academy of Sciences; Shenzhen, People's Republic of China.
*These authors contributed equally to this work as first authors
Received 2022-3-8; Accepted 2022-5-10; Published 2022-7-11
Abstract

The Coronavirus Disease 2019 (COVID-19) pandemic caused by severe acute respiratory syndrome coronavirus 2 (SARS-CoV-2) is the biggest public health challenge the world has witnessed in the past decades. SARS-CoV-2 undergoes constant mutations and new variants of concerns (VOCs) with altered transmissibility, virulence, and/or susceptibility to vaccines and therapeutics continue to emerge. Detailed analysis of host factors involved in virus replication may help to identify novel treatment targets. In this study, we dissected the metabolome derived from COVID-19 patients to identify key host factors that are required for efficient SARS-CoV-2 replication. Through a series of metabolomic analyses, in vitro, and in vivo investigations, we identified ATP citrate lyase (ACLY) as a novel host factor required for efficient replication of SARS-CoV-2 wild-type and variants, including Omicron. ACLY should be further explored as a novel intervention target for COVID-19.
Keywords: COVID-19, metabolomics, ACLY, SARS-CoV-2, Delta, Omicron
Introduction
Severe acute respiratory syndrome coronavirus 2 (SARS-CoV-2), the causative agent of Coronavirus Disease 2019 (COVID-19), is a lineage B betacoronavirus that emerged in late 2019 [1-3]. As of 28 February 2022, the virus has caused more than 434 million cases, including nearly 6 million deaths globally [4]. In the past two years, new SARS-CoV-2 variants with enhanced transmissibility, virulence, and/or immune-evasiveness have emerged. For instance, the recently emerged Omicron is a variant of concern (VOC) that is associated with reduced susceptibility to vaccine-induced neutralizing antibody response and higher transmissibility despite lower pathogenicity [5-8]. This and other emerging VOCs pose severe challenges to the public health authorities in terms of pandemic control and treatment of SARS-CoV-2-infected patients [6, 9-11].
Metabolomics is the systemic profiling of chemical processes concerning metabolites [12]. These metabolomes represent the metabolite profiles generated at the end of cellular processes and can provide an overview of the physiological state of the targets at a particular moment. In this study, we aim to dissect the metabolome of COVID-19 patients to identify key host factors that are required for efficient SARS-CoV-2 replication. The extracted metabolites from COVID-19 patients' plasma samples were analyzed with both gas chromatography-mass spectrometry (GC-MS)-based and liquid chromatography-mass spectrometry (LC-MS)-based metabolomics. By multiple steps of data validation, combination, and analysis, we found that the metabolites in the tricarboxylic acid (TCA) cycle were significantly perturbed in COVID-19 patients. Importantly, we identified two inhibitors that target ATP citrate lyase (ACLY) within the TCA cycle, SB 204990 and Bempedoic acid, that effectively inhibited SARS-CoV-2 replication.
Materials and Methods
Plasma collection and metabolites extraction
Plasma samples were collected from COVID-19 patients whose respiratory tract specimens tested positive for SARS-CoV-2 and blood donors who tested negative for SARS-CoV-2 by RT-qPCR. Blood was collected using potassium-EDTA blood collection tubes and plasma was separated by centrifugation at 2000 rpm for 10 min. Metabolites extraction for GC-MS was performed according to a previously described protocol with slight modifications [13, 14]. Plasma (20 µL) was thawed on ice and 80 µL of chloroform/methanol (v/v 2:1) was added, followed by vortexing for 30s, leaving the samples on ice, and vortexing again for 30 s. The samples were then incubated for 5 min at 1500 rpm at 4 °C in the orbital mixer. After that, samples were centrifuged at 4500 rpm for 10 min at 4 °C. Both upper and bottom phases were transferred to centrifuge tubes and dried in a Labconco Centrivap cold trap concentrator for storage at -80 °C. Metabolites extraction for LC-MS was performed according to a previously described protocol [15]. 20 µL of ice-cold methanol that contained internal standards and butylated hydroxytoluene (BHT) was first added to plasma (40 µL). Samples were vortexed for 5s and kept on ice. Then, 800 µL of acetonitrile/isopropanol/water (v/v/v 3:3:2) was added, followed by vortexing for 30 s and incubation for 5 min at 1500 rpm at 4 °C in the orbital mixer. After that, samples were centrifuged at 14000 rpm for 10 min at 4 °C. The supernatant was transferred to centrifuge tubes and was split into two aliquots (410 µL for negative mode and another 410 µL for positive mode). Finally, all aliquot samples were dried in a Labconco Centrivap cold trap concentrator for storage at -80 °C.
GC-MS-based targeted metabolomics
For polar metabolites, GC-MS chromatogram was acquired in SCAN and MRM mode in an Agilent 7890B GC - Agilent 7010 Triple Quadrapole Mass Spectrometer system (Santa Clara, CA, USA). The sample was separated through an Agilent (Santa Clara, CA, USA) DB-5MS capillary column (30 m × 0.25 mm ID, 0.25 μm film thickness) under constant flow at 1 mL min-1. The GC oven program started at 50°C (hold time 1 minute) and temperature was first increased at a rate of 10°C min-1 to 120°C, then 3°C min-1 to 150°C, next 10°C min-1 to 200°C, and finally 30°C min-1 to 280°C (hold time 5 minutes). Inlet temperature and transfer line temperature were 250°C and 280°C respectively. Characteristic quantifier and qualifier transitions were monitored in MRM mode during the run. Mass spectra from m/z 50-500 were acquired in SCAN mode [16]. For Non-polar fatty acids, GC/MS equipment was same as polar metabolites analysis. The sample was separated through an Agilent DB-23 capillary column (60 m × 0.25 mm ID, 0.15 μm film thickness) under constant pressure at 33.4 psi. The GC oven program started at 50°C (hold time 1 minute) and was increased to 175°C at a ramp rate of 25°C min-1. The temperature was then raised to 190°C (hold time 5 minutes) at a ramp rate of 3.5°C min-1. Finally, the temperature was raised to 220°C (hold time 4 minutes) at a ramp rate of 2°C min-1. Inlet temperature and transfer line temperature were 250°C and 280°C respectively. Characteristic fragment ions (m/z 55, 67, 69, 74, 79, 81, 83, 87, 91, 93, 95, 96, 97, 115, 127, 143) were monitored in SIM mode throughout the run. Mass spectra from m/z 50-350 were acquired in SCAN mode [17].
LC-MS-based untargeted metabolomics
Ultra-performance liquid chromatography coupled to quadrupole time-of-flight mass spectrometer (UPLC-Q-TOF-MS) analytical platform (Waters Corp., Milford, MA, USA) was used to perform untargeted metabolomics for hydrophilic metabolites and polar lipids characterization. The chromatography was performed on a Waters Acquity UPLC BEH Amide column (150 × 2.1 mm; 1.7 μm), the mobile phases and gradient elution were the same as previously described [15]. The mass spectrometer was operated in MSE mode and the data was acquired in both positive and negative modes. Mass spectral data was acquired over the m/z range of 100 to 1000. Collision energy was applied at the range from 20 to 40 eV for fragmentation to allow putative identification and structural elucidation of metabolites. Exogenous metabolite standards were applied for sample preparation and LC-MS analysis for monitoring the metabolites coverage and extraction efficiency. A total of 7 lipid internal standards were applied for sample preparation and LC-MS analysis for monitoring extraction efficiency including Succinic acid-d6-ISTD, L-Leucine-d10-ISTD, Salicylic acid-d4-ISTD, L-GLUTAMINE-d5-ISTD, Creatine-d3-ISTD, L-arginine-15N2-ISTD, and Trimethylamine N-oxide-d9-ISTD. Commercial standards were used for metabolites identification. They were purchased from Cambridge isotope lab (Andover, MA, USA) and Cayman Chemical (Ann Arbor, MI, USA). Additionally, QC samples were injected at the beginning of the run and after every 6 or 8 samples for monitoring the system variation. QC samples were pooled and prepared by mixing equal aliquots for all the biological samples [18, 19].
Data processing, statistical analysis and metabolites identification in untargeted metabolomic
Untargeted metabolomics study data was processed to a usable data matrix by the MS-DIAL software for further statistical analysis [15, 20]. MetaboAnalyst 4.0 (http://www.metaboanalyst.ca) and SIMCA-P V12.0 (Umetrics, Umeå, Sweden) were used for univariate and multivariate analysis, respectively. Prior to statistical analysis, the data matrix was performed QC or DNA-based normalization for better comparison [21]. In the univariate analysis, only the FDR adjusted p-value that is less than 0.05 and fold change that is more than 1.5 or less than 0.67 were used as the criteria for selecting significant metabolites. In multivariate analysis, the metabolite features were first subjected to Pareto scaling, and followed by partial least squares-discriminant analysis (PLS-DA) to find important variables with discriminative power. PLS-DA model was evaluated with the relevant R2 and Q2. The Variable Importance in Projection (VIP), which reflects both the loading weights for each component and the variability of the response explained by this component, was used to select the metabolites [22]. The significant metabolites were identified by searching accurate MS and MS/MS fragmentation pattern data in the MS-DIAL database [20], MassBank of North America (MoNA, http://mona.fiehnlab.ucdavis.edu/) and METLIN database (http://metlin.scripps.edu/). For confirmation of metabolite identities using authentic chemical standards, the MS/MS fragmentation patterns of the chemical standards were compared with those of the candidate lipids measured under the same LC-MS condition. Pathway analysis was performed by MetaboAnalyst and KEGG mapper [23].
Viruses and biosafety
SARS-CoV-2 wild-type (WT, HKU-001a, GenBank: MT230904), B.1.617.2 (Delta, GenBank: OM212471), and B.1.1.529.1 (Omicron BA.1, GenBank: OM212472) viruses were available at the Department of Microbiology of The University of Hong Kong (HKU). They were all isolated from laboratory-confirmed COVID-19 patients in Hong Kong [24, 25]. VeroE6-TMPRSS2 cells were used to culture and titrate virus stocks, and the sequences of the viruses were confirmed with nanopore sequencing. All the in vivo and in vitro experiments with live SARS-CoV-2 were performed according to the approved standard operating procedures of our Biosafety Level 3 facility [26, 27].
Cell culture
The cell lines used in this study were available in our laboratory as previously described [24]. Caco2 cell was acquired from ATCC (ATCC HTB-37) and cultured in Dulbecco's modified Eagle's medium (DMEM) (Gibco, Amarillo, Texas, USA) according to supplier's manual and guidance. VeroE6-TMPRSS2 cell was acquired from the Japanese Collection of Research Bioresources (JCRB) Cell Bank (JCRB1819) and cultured in Dulbecco's modified Eagle's medium (DMEM) (Gibco, Amarillo, Texas, USA) according to instructions. All cell lines that were used in this study underwent mycoplasma testing regularly and were cultivated in mycoplasma-free environment.
RNA extraction and qRT-PCR
RNA was extracted from infected Caco2 cells using the QIAsymphony RNA kit (Qiagen, Germany), and RNA was extracted from hamster lung tissues using the RNeasy Mini kit (Qiagen, Germany). Viral gene copies of SARS-CoV-2 was quantified by the RNA-dependent RNA polymerase (RdRp) using the QuantiNova Probe RT-PCR kit (Qiagen, Germany) as previously described [28, 29].
Cell viability assay (CC50)
Cell viability was quantified by CellTiter-Glo luminescent cell viability assay kit (Promega, USA) as we previously described [30]. Caco2 cells were treated with selected inhibitors at a series of concentration (0-100µM) for 24 hours, and followed by manufacturer's instructions to detect luminescent signal using the Victor X3 2030 Multilabel reader (Perkin Elmer, USA).
IC50 of the chosen inhibitors
Caco2 cells were challenged with 0.1 multiplicity of infection (MOI) from one of the three SARS-CoV-2 (WT, Delta, and Omicron) strains. At 2 hours post-infection, the virus inoculum was removed, cells were washed with phosphate-buffered saline (PBS) for 3 times, and they were treated with the chosen inhibitors at a titration of different concentrations (0-100 µM). At 24 hours post-infection, supernatant was harvested, followed by both RNA extraction and qRT-PCR to quantify for RdRp gene copies. IC50 was then calculated using GraphPad Prism 6 as previously mentioned [31, 32].
Small interfering RNA (siRNA) knockdown
SMARTPool ON-TARGETplus human ACLY siRNA was purchased from Dharmacon, and Caco2 cells were used to perform the transfection of siRNA as previously described with minor modifications [33, 34]. Cells were seeded on day 1 and 70nM of ACLY or nontargeting (scrambled) siRNA were transfected into the cells with RNAiMAX and Opti-MEM on day 2. At 24 hours post-transfection, the cells were challenged by WT SARS-CoV-2 at 0.1 MOI. At 2 hours post-virus challenge, virus inoculum was removed, and the cells were washed 3 times with PBS. At 24 hours post-infection, supernatant and cell lysate were harvested, followed by both RNA extraction and qRT-PCR to quantify for viral RdRp and host ACLY gene copies.
In vivo virus challenge in hamsters
The animal experiments were approved by the HKU Committee on the Use of Live Animals in Teaching and Research (CULATR). Briefly, 6-8 weeks old male and female Syrian hamsters were obtained from the Chinese University of Hong Kong Laboratory Animal Service Centre through the HKU Centre for Comparative Medicine Research (CCMR) [35, 36]. The hamsters were kept with 65% humidity and 21-23 oC ambient temperature until virus challenge [37]. Standard pellet food and water were given, and 12-hours-interval day/night cycle was provided for housing and husbandry. The hamsters were intranasally inoculated with 50 µL per hamster of SARS-CoV-2 WT or Omicron under anaesthesia with intraperitoneal ketamine (200 mg/kg) and xylazine (10 mg/kg) [38, 39]. PBS was used to dilute SARS-CoV-2 WT and Omicron stocks to the concentration of 3×10³ PFU per hamster. At 6 hours post-infection each hamster was treated intraperitoneally with 10mg/kg of SB 204990 or 5% DMSO at a final volume of 1000 µL PBS. The infected hamsters were subsequently treated with SB 204990 or DMSO at 1, 2, and 3 days post infection for a total of 2 or 4 doses. All hamsters were sacrificed on day 2 or day 4 post-infection for virological and histological assessments.
Infectious viral titer by plaque assay
Plaque assay was performed as we described previously [40, 41]. Briefly, hamster lung tissues were harvested and homogenized in DMEM using the Tissue Lyzer II (Qiagen, Germany). Homogenized lung tissues were centrifuged down in full speed for 5 minutes. Supernatants were collected, and were 10-fold serially diluted to inoculate VeroE6-TMPRSS2 cells. At 2 hours post-infection, virus inoculum was removed, and the cells were washed with PBS for 3 times. 1:1 of 2% low-melting agarose: DMEM with 2% FBS and 1% P/S was then added to the cells. At 72 hours post-infection, the cells were fixed by 4% (wt/vol) paraformaldehyde for 24 hours. Fixed VeroE6-TMPRSS2 cells were stained with 0.5% crystal violet in 25% ethanol for viral titer determination.
Immunofluorescence staining
Immunofluorescence staining was performed as we previously described with slight modifications [42-44]. Briefly, the hamster lung tissues were first harvested and fixed using 4% (wt/vol) paraformaldehyde at room temperature for 24 hours before proceeding to paraffin-embedding and sectioning. The slides with lung tissues were then dewaxed, dehydrated, and antigen retrieved. Sudan Black B and 1% BSA were used to reduce autofluorescence and for blocking respectively, followed by overnight incubation with in-house rabbit polyclonal biotinylated anti-SARS-CoV-2 nucleocapsid protein antibody (1:4000). On the next day, the tissue slides were incubated with the donkey anti-rabbit FITC secondary antibody from ThermoFisher and were mounted with a DAPI mounting medium (Vector) to detect viral antigen. All fluorescence images were captured using the Olympus BX53 fluorescent microscope.
Statistical analyses
All data that is presented in this study represented mean and standard deviations from at least three independent experiments. One-way analysis of variance (ANOVA) or student's t test were performed between three or more experimental groups and between two experimental groups respectively. All presented data was considered statistically significant only when P < 0.05.
Results
GC-MS-based identification of metabolome perturbations in COVID-19 patients
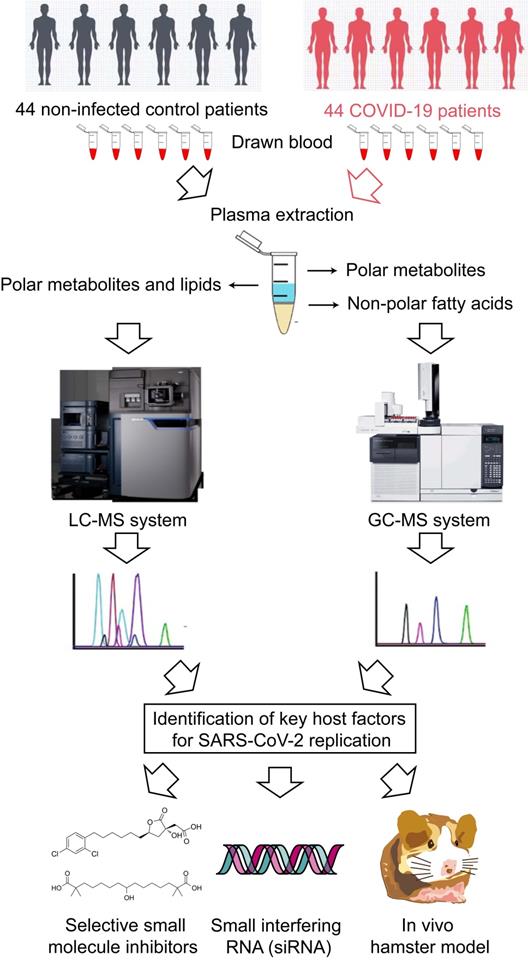
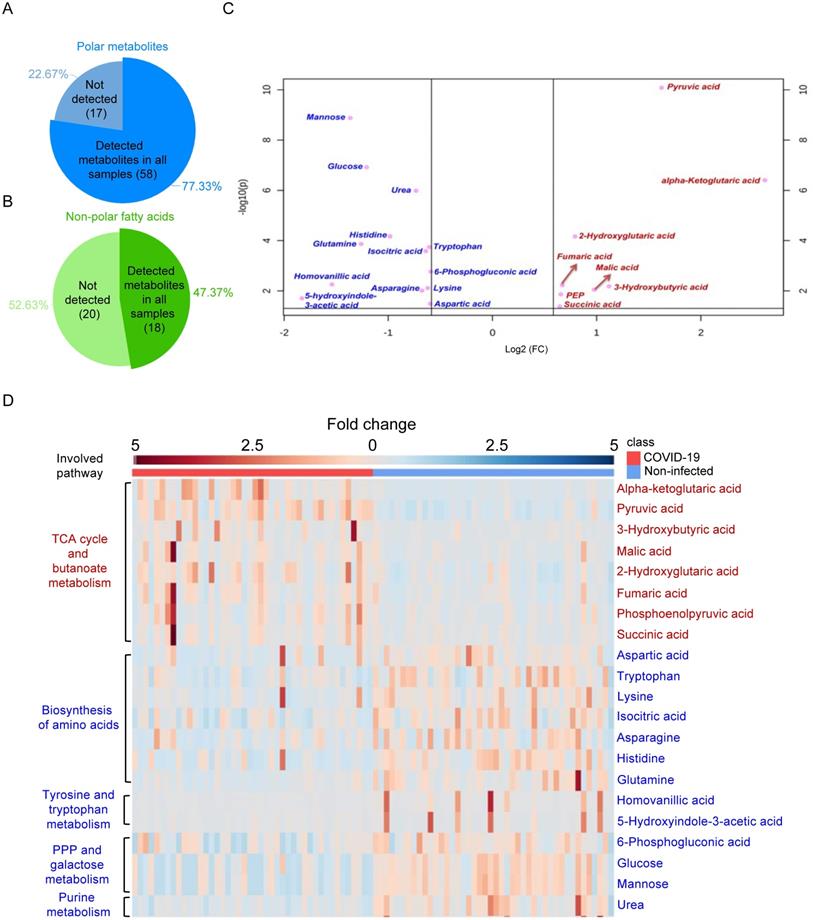
A total of 44 laboratory-confirmed COVID-19 patients and 44 non-infected control patients were recruited for both GC-MS-based and LC-MS-based metabolomics (Figure 1). There were 24 males and 20 females in each group. The median age was 58 and 57.5 years for COVID-19 patients and non-infected control patients, respectively. A total of 78 polar metabolites and 38 non-polar fatty acids were analyzed by GC-MS-based targeted metabolomics, and they were normalized by corresponding internal standards and peak areas. Among them, 58 polar metabolites (Figure 2A) and 18 non-polar fatty acids (Figure 2B) could be detected. Further analysis of these 76 metabolites showed that 21 of them were significantly different between the plasma samples of COVID-19 patients and those of the non-infected controls (Table 1). We then compared the direction, magnitude, and statistical significance of these 21 metabolites. Our data revealed that 8 of these metabolites (mainly organic acids) were significantly upregulated, with the alpha-ketoglutaric acid exhibiting the largest fold change (around 6 folds) in COVID-19 patient plasma samples (Figure 2C). For the 13 downregulated metabolites, they belong to multiple classes including amino acids, organic acids, carbohydrates, and other metabolites (Figure 2C). Interestingly, 75% (6/8) of the upregulated metabolites, including alpha-ketoglutaric acid, pyruvic acid, malic acid, fumaric acid, phosphoenolpyruvic acid, and succinic acid are involved in the TCA cycle (Figure 2D). On the other hand, 46% (6/13) of the downregulated metabolites including aspartic acid, tryptophan, lysine, asparagine, histidine, and glutamine are involved in the biosynthesis of amino acids (Figure 2D). Taken together, our results indicated that SARS-CoV-2 infection activates the TCA cycle and exhausts the amino acid biosynthesis pathways.
Schematic illustration of the study.
GS-MS-based targeted metabolomics was used to identify metabolites in COVID-19 patient plasma samples. (A) Pie chart showing the ratio of detected and non-detected polar metabolites using the GC-MS-based targeted metabolites. (B) Pie chart showing the ratio of detected and non-detected non-polar fatty acids using the GC-MS-based targeted metabolites. (C) Overview of the upregulated and downregulated metabolites in COVID-19 patients' plasma. (D) Heatmap showing the upregulated metabolites and their belonged pathways in both COVID-19 patients and non-infected donors.
The 21 metabolites (GC-MS analysis) that were significantly different between COVID-19 patients and non-infected volunteers
| ID | Metabolite name | Fold change of COVID-19 vs non-infected | P-value | VIP | Confirmation | KEGG-ID | HMDB-ID | Involved pathway |
|---|---|---|---|---|---|---|---|---|
| GC-1 | 2-Hydroxyglutaric acid | 1.73 | 6.83E-05 | 1.48 | STD | C02630 | HMDB0059655 | Butanoate metabolism |
| GC-2 | 3-Hydroxybutyric acid | 2.17 | 6.64E-03 | 1.4 | STD | C01089 | HMDB0000357 | Butanoate metabolism |
| GC-3 | Alpha-ketoglutaric acid | 6.13 | 3.93E-07 | 1.78 | STD | C00026 | HMDB0000208 | TCA cycle |
| GC-4 | Pyruvic acid | 3.08 | 8.20E-11 | 2.21 | STD | C00022 | HMDB0000243 | TCA cycle |
| GC-5 | Malic acid | 1.97 | 8.96E-03 | 1.04 | STD | C00149 | HMDB0000744 | TCA cycle |
| GC-6 | Fumaric acid | 1.59 | 5.96E-03 | 1.09 | STD | C00122 | HMDB0000134 | TCA cycle |
| GC-7 | Phosphoenolpyruvic acid | 1.58 | 1.38E-02 | 0.99 | MSMS | C00074 | HMDB0000263 | TCA cycle |
| GC-8 | Succinic acid | 1.57 | 4.19E-02 | 0.92 | STD | C00042 | HMDB0000254 | TCA cycle |
| GC-9 | Isocitric acid | 0.64 | 2.60E-04 | 1.37 | STD | C00311 | HMDB0000193 | TCA cycle |
| GC-10 | Aspartic acid | 0.66 | 3.28E-02 | 0.94 | STD | C00049 | HMDB0000191 | Biosynthesis of amino acids |
| GC-11 | Tryptophan | 0.66 | 1.79E-04 | 1.49 | MSMS | C00078 | HMDB0000929 | Biosynthesis of amino acids |
| GC-12 | Lysine | 0.65 | 7.72E-03 | 1.1 | STD | C00047 | HMDB0000182 | Biosynthesis of amino acids |
| GC-13 | Asparagine | 0.63 | 9.74E-03 | 1.08 | STD | C00152 | HMDB0000168 | Biosynthesis of amino acids |
| GC-14 | Histidine | 0.51 | 6.80E-05 | 1.6 | MSMS | C00135 | HMDB0000177 | Biosynthesis of amino acids |
| GC-15 | Glutamine | 0.42 | 1.34E-04 | 1.4 | MSMS | C00064 | HMDB0000641 | Biosynthesis of amino acids |
| GC-16 | Homovanillic acid | 0.34 | 5.54E-03 | 1.11 | STD | C05582 | HMDB0000118 | Tyrosine metabolism |
| GC-17 | 5-hydroxyindole-3-acetic acid | 0.28 | 1.97E-02 | 1.02 | STD | C05635 | HMDB0000763 | Tryptophan metabolism |
| GC-18 | 6-Phosphogluconic acid | 0.66 | 1.75E-03 | 1.32 | MSMS | C00345 | HMDB0001316 | Pentose phosphate pathway |
| GC-19 | Glucose | 0.43 | 1.21E-07 | 1.9 | STD | C00031 | HMDB0000122 | Galactose metabolism |
| GC-20 | Mannose | 0.39 | 1.28E-09 | 2.06 | MSMS | C00159 | HMDB0000169 | Galactose metabolism |
| GC-21 | Urea | 0.6 | 1.03E-06 | 1.73 | MSMS | C00086 | HMDB0000294 | Purine metabolism |
LC-MS-based untargeted metabolomics identified perturbed metabolites in COVID-19 patients
Next, we utilized LC-MS-based untargeted metabolomics for sample analysis and detected a total of 495 metabolic features in positive mode and 1354 metabolic features in negative mode, and the coefficient of variation (CV) values of all MS features in quality control (QC) samples were calculated. Our results indicated that 98.79% of all features in positive mode and 95.42% of all features in negative mode had CV values lower than 30%, which indicated stable data acquisition (Table 2). The metabolic profiles between COVID-19 patient and non-infected control patient plasma samples were clearly separated (Figure 3A), which exhibited metabolic features that contributed to the discrimination pattern between the two groups under PLS-DA pattern recognition. Since the PLS-DA model may overfit data, we further validated the model with the permutation test, which showed that the separation between the two groups was statistically significant (Figure 3B). Using LC-MS, we identified a total of 31 metabolites, including 25 downregulated and 6 upregulated metabolites. Their fold changes and involved pathways were visualized by heatmap (Figure 3C).
The 31 metabolites (LC-MS analysis) that were significantly different between COVID-19 patients and non-infected volunteers
| ID | Metabolite name | Fold change of patient vs healthy | Adjust P-value | VIP | Confirmation | KEGG-ID | HMDB-ID | Involved pathway | ||
|---|---|---|---|---|---|---|---|---|---|---|
| 1 | 74 | 3-Hydroxyanthranilic acid | 0.24 | 0.0030 | <1 | MSMS | C00632 | HMDB0001476 | Amino acid and metabolism | |
| 2 | 199 | Citrulline | 0.62 | 0.0026 | <1 | MSMS | C00327 | HMDB0000904 | Amino acid and metabolism | |
| 3 | 18 | Creatinine | 0.54 | 0.0165 | 1.15 | MSMS | C00791 | HMDB0000562 | Amino acid and metabolism | |
| 4 | 92 | 3-Methylhistidine | 0.24 | 0.0049 | <1 | MSMS | C01152 | HMDB0000479 | Amino acid and metabolism | |
| ** | 5 | 251 | Piperine | 0.24 | 0.0049 | 1.78 | MSMS | C03882 | HMDB0029377 | Amino acid derivative |
| 6 | 122 | 3,4-Dihydroxybenzoic acid | 0.34 | 0.0001 | 1.33 | MSMS | C00230 | HMDB0001856 | Biosynthesis of secondary metabolites | |
| * | 7 | 133 | Caffeine | 0.32 | 0.0401 | 1.54 | MSMS | C07481 | HMDB0001847 | Caffeine metabolism |
| 8 | 276 | 1,7-Dimethyluric acid | 0.48 | 0.0408 | <1 | MSMS | C16356 | HMDB0011103 | Caffeine metabolism | |
| 9 | 551 | PC(O-16:0/0:0) | 0.62 | 0.0423 | 2.05 | MSMS | C04317 | NA | Ether lipid metabolism | |
| 10 | 887 | PC(O-36:5) | 0.64 | 0.0000 | 1.84 | MSMS | C05212 | HMDB0013415 | Ether lipid metabolism | |
| 11 | 866 | PC(P-34:2) | 0.60 | 0.0001 | 1.19 | MSMS | C05212 | HMDB0008029 | Ether lipid metabolism | |
| *** | 12 | 815 | PE(O-16:0/18:3) | 0.39 | 0.0000 | <1 | MSMS | C04475 | NA | Ether lipid metabolism |
| 13 | 872 | PE(O-16:0/22:6) | 0.63 | 0.0071 | 1.05 | MSMS | C04475 | NA | Ether lipid metabolism | |
| 14 | 844 | PE(O-36:4) | 0.51 | 0.0005 | <1 | MSMS | C04475 | NA | Ether lipid metabolism | |
| 15 | 491 | PE(P-16:0/0:0) | 0.44 | 0.0059 | <1 | MSMS | C04635 | HMDB0011152 | Ether lipid metabolism | |
| 16 | 523 | PE(P-18:0/0:0) | 0.40 | 0.0066 | <1 | MSMS | C04635 | HMDB0240598 | Ether lipid metabolism | |
| 17 | 637 | PC(20:5/0:0) | 0.63 | 0.0258 | 1.12 | MSMS | C04230 | HMDB0010397 | Glycerophospholipid metabolism | |
| 18 | 863 | PE(36:4) | 1.61 | 0.0016 | <1 | MSMS | C00350 | HMDB0008844 | Glycerophospholipid metabolism | |
| 19 | 32 | Nicotinamide | 1.92 | 0.0018 | <1 | MSMS | C00153 | HMDB0001406 | Nicotinate and nicotinamide metabolism | |
| ** | 20 | 53 | Trigonelline | 0.08 | 0.0084 | 1.53 | MSMS | C01004 | HMDB0000875 | Nicotinate and nicotinamide metabolism |
| 21 | 241 | 1-Methyladenosine | 0.56 | 0.0267 | <1 | MSMS | C02494 | HMDB0003331 | No pathway | |
| 22 | 451 | CMPF | 0.52 | 0.0007 | 2.98 | MSMS | NA | HMDB0061112 | No pathway | |
| 23 | 317 | Indolelactic acid | 0.45 | 0.0375 | <1 | MSMS | C02043 | HMDB0000671 | No pathway | |
| 24 | 342 | Indoxyl sulfate | 0.28 | 0.0018 | 7.37 | MSMS | NA | HMDB0000682 | No pathway | |
| 25 | 23 | 3-Hydroxyvaleric acid | 1.51 | 0.0278 | <1 | MSMS | NA | HMDB0000531 | No pathway | |
| ** | 26 | 588 | Inosine | 0.09 | 0.0053 | 2.37 | MSMS | C00294 | HMDB0000195 | Purine metabolism |
| 27 | 474 | Pseudouridine | 0.33 | 0.0208 | <1 | MSMS | C02067 | HMDB0000767 | Pyrimidine metabolism | |
| 28 | 472 | O-oleoylcarnitine | 1.75 | 0.0006 | 2.80 | STD | C02301 | HMDB0005065 | Thermogenesis | |
| 29 | 431 | O-palmitoleoylcarnitine | 2.17 | 0.0003 | <1 | STD | C02301 | HMDB0013207 | Thermogenesis | |
| 30 | 758 | Eicosenoic acid | 1.70 | 0.0012 | <1 | MSMS | C16526 | HMDB0002231 | Unsaturated fatty acids | |
| 31 | 232 | Stearidonic Acid | 0.63 | 0.0027 | <1 | MSMS | C16300 | HMDB0006547 | Unsaturated fatty acids |
The 'O-' prefix is used to indicate the presence of an alkyl ether substituent, e.g., PC (O-16:0/0:0), whereas the 'P-' prefix is used for the 1Z-alkenyl ether (Plasmalogen) substituent, e.g., PE (P-16:0/0:0). Abbreviation: PC, glycerophosphocholine; PE, glycerophosphoethanolamine; EtherLPC, ether-linked lysophosphatidylcholine; EtherLPE, ether-linked lysophosphatidylethanolamine; EtherPC, ether-linked phosphatidylcholine EtherPE, ether-linked phosphatidylethanolamine; NA, not available.
LC-MS-based untargeted metabolomics was used to identify perturbed metabolites in COVID-19 patient plasma samples. (A) PLS-DA model showing the metabolic profiles between the COVID-19 patients and non-infected controls were different. (B) Permutation test showing a statistically significant separation between the COVID-19 patients and non-infected donors. (C) Heatmap showing the upregulated metabolites and their belonged pathways in both COVID-19 patients and non-infected donors.
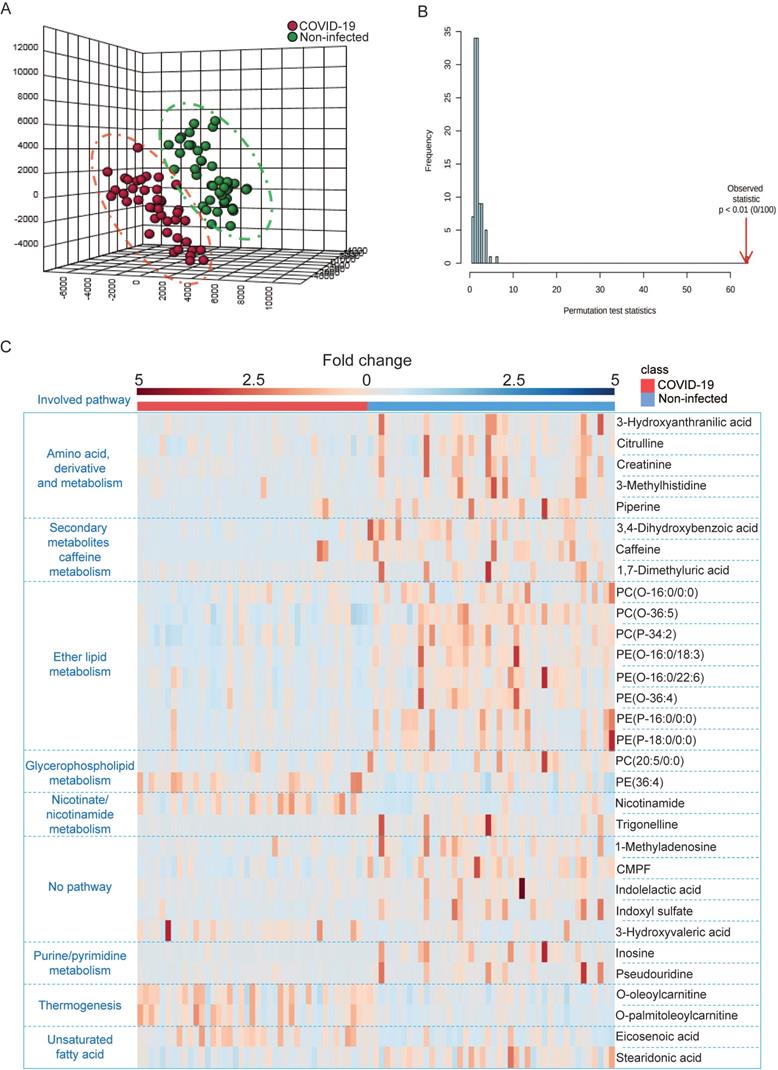
Notably, around 32% (10/31) of metabolites belonging to the polar lipid class that are involved in ether lipid/glycerophospholipid metabolism had a trend of downregulation. This suggested that lipids metabolism was perturbed in COVID-19 patient plasma samples. Consistent with the GC-MS-based targeted metabolomics, amino acids and their derivates exhibited declining trends in COVID-19 patient plasma samples. On the other hand, some of the upregulated metabolites belong to the carnitine class that is involved in thermogenesis. Collectively, the untargeted metabolomics indicated that multiple metabolic pathways were perturbed after SARS-CoV-2 infection.
Global metabolic pathway analysis and receiver operating characteristic (ROC) curve analysis
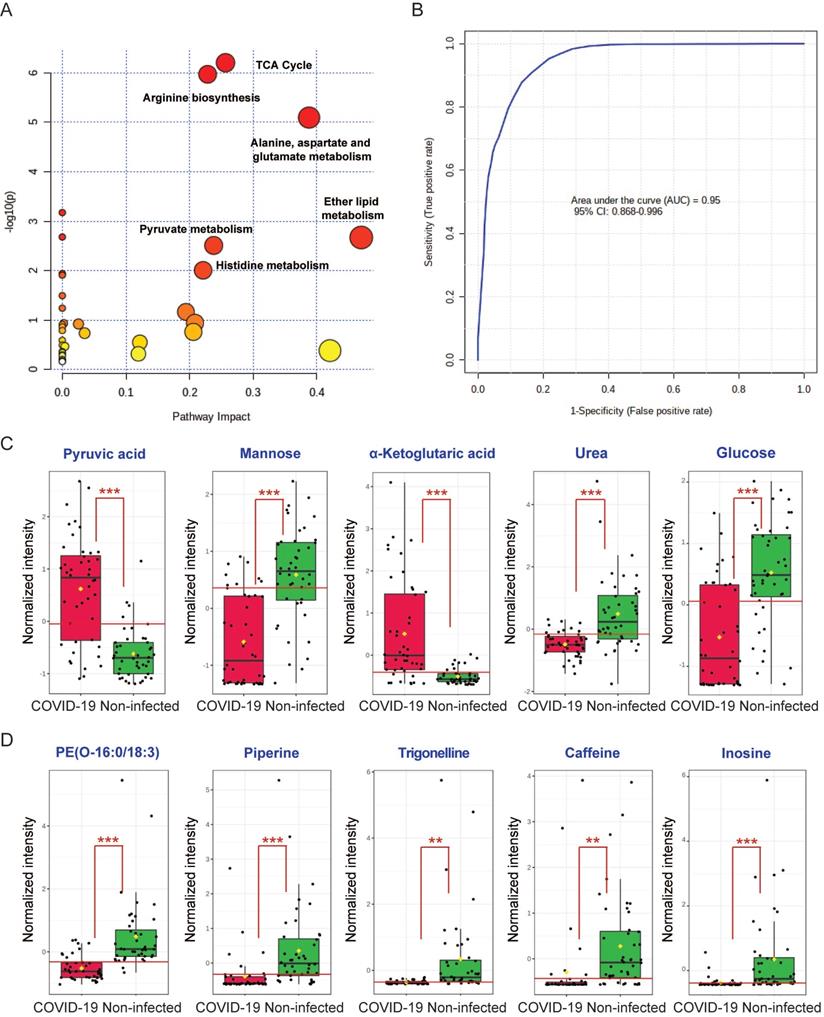
To comprehensively characterize the perturbed metabolic pathways in COVID-19 patient plasma samples, we combined the 52 significantly changed metabolites identified from the GC-MS and LC-MS platforms. In terms of the hit rate (hit metabolites/total metabolites in the pathway), the TCA cycle (7/20), arginine biosynthesis (6/14), and metabolism of alanine, aspartate and glutamate (7/28) were the top three perturbed pathways (Figure 4A). While ether lipid metabolism exhibited the largest pathway impact value, it was a lipid-independent pathway that did not belong to our targeted metabolic class. Next, we performed ROC curve analysis to assess the diagnostic value of metabolic biomarkers based on all the identified metabolites from the GC-MS and LC-MS platforms. The top 5 metabolites ranked by area under ROC curve (AUROC) were selected to generate the ROC curve plots. The representative ROC curve exhibited excellent discriminate capacity, which indicated that our model could differentiate plasma samples of COVID-19 patient from non-infected control using 5 of the identified metabolites (Figure 4B). The top 5 metabolites from the GC-MS platform included pyruvic acid and α-ketoglutaric acid (TCA cycle), mannose and glucose (galactose metabolism), and urea (purine metabolism) (Figure 4C). The top 5 metabolites from the LC-MS platform consisted of PE(O-16:0/18:3), piperine, trigonelline, caffeine, and inosine (Figure 4D). Interestingly, among these 10 metabolites, 8 were downregulated and only pyruvic acid and α-ketoglutaric acid (TCA cycle) were upregulated in COVID-19 patient plasma samples (Figure 4C). Taken together, by combining the metabolic pathway and ROC curve analysis, our data suggested that the TCA cycle is the most perturbed pathway in COVID-19 patient plasma samples.
Combing all the identified metabolites from GC-MS and LC-MS. (A) Overview of the global metabolic pathway analysis from identified metabolites. The y-axis indicating the log10 transformed p-value after enrichment analysis, and the x-axis representing the pathway impact value calculated from the pathway topology analysis. (B) Receiver operating characteristic (ROC) curve analysis from the GC-MS and LC-MS platforms that were used in this study. (C) The top 5 perturbed metabolites from the GC-MS platform. (D) The top 5 perturbed metabolites from the LC-MS platform.
The three mini pathways within the TCA cycle are critical for SARS-CoV-2 infection
Viruses utilize host glycolysis as a source of ATP by inducing the TCA cycle to acquire an extensive amount of energy required during the viral replication cycle [45]. From our metabolomics data, we identified several metabolites and pathways that may play important roles in SARS-CoV-2 infection. Based on their functions, we divided the complicated TCA cycle into three mini pathways for more detailed examinations, including (i) citrate induced de novo lipogenesis, (ii) glutamine metabolism, and (iii) malate-aspartate shuttle (Figure 5A).
Inhibition of the three mini pathways within the TCA cycle reduced SARS-CoV-2 replication. (A) Schematic illustration of the three mini pathways including citrate induced de novo lipogenesis, glutamine metabolism, and malate-aspartate shuttle. (B) Caco2 cells were infected with WT SARS-CoV-2 at 0.1 MOI and treated with selective small molecule inhibitors including CTPI-2, SB 204990, Bempedoic acid, BPTES, R162, Vorasidenib, (-)-Epigallocatechin gallate, and aminooxyacetic acid hemihydrochloride at 50 µM. Supernatants were harvested at 24 hours post-infection. (C) The viabilities of all tested inhibitors in Caco2 cells without virus infection at 24 hours post-treatment. Data represented mean and standard deviation from three independent experiments. Statistical analyses in B were performed with one-way ANOVA, the differences were considered significant only when P < 0.05. *P < 0.05, **P < 0.01, ***P < 0.001, and ****P < 0.0001.
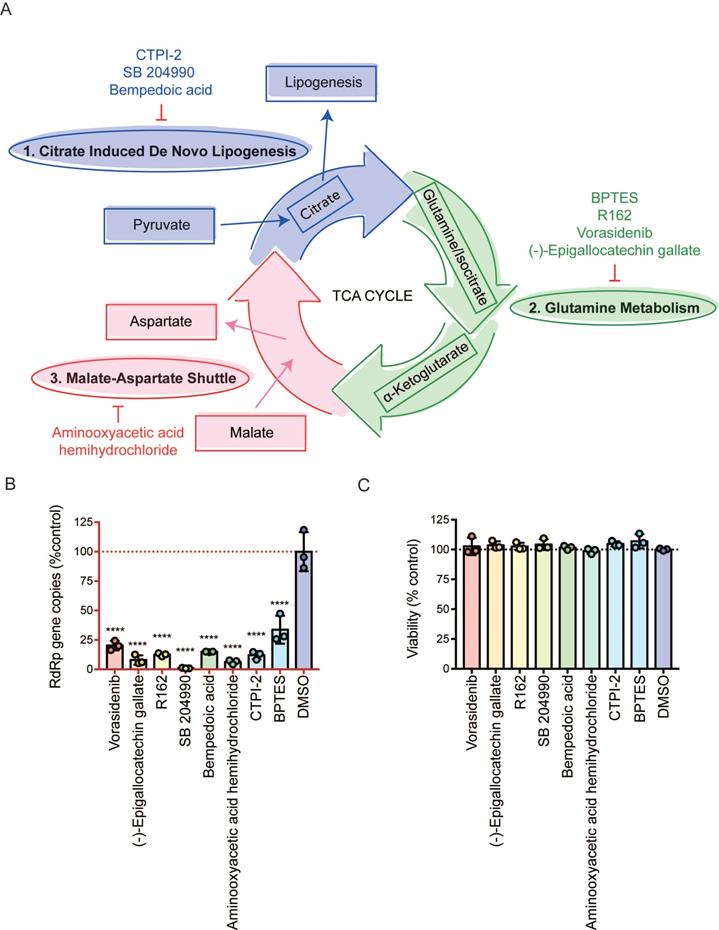
The citrate induced de novo lipogenesis mini pathway is responsible for the conversion of acetyl-CoA from citrate by ACLY, the glutamine metabolism mini pathway is responsible for the conversion of α-ketoglutarate from glutamine by glutamate dehydrogenase and from isocitrate by isocitrate dehydrogenase, and the malate-aspartate shuttle is responsible for the translocation of electrons between the semipermeable inner membrane of mitochondrion. To investigate the mechanism between SARS-CoV-2 replication and these three mini pathways, we chose 8 different selective small molecule inhibitors that can specifically inhibit different enzymes within the three mini pathways. CTPI-2, SB 204990, and Bempedoic acid were selected to inhibit the citrate induced de novo lipogenesis mini pathway, BPTES, R162, Vorasidenib, and (-)-Epigallocatechin gallate were selected to inhibit the glutamine metabolism mini pathway, and aminooxyacetic acid hemihydrochloride was selected to inhibit the malate-aspartate shuttle mini pathway. Caco2 cell was selected to perform the in vitro experiments as it is a well-established cell model with robust SARS-CoV-2 replication, and supports SARS-CoV-2 entry through both plasma membrane and endosomal entry pathways [24]. SARS-CoV-2-infected cells were treated with the 8 chosen inhibitors at a final concentration of 50 µM for 24 hours. Our results suggested that all 8 inhibitors significantly reduced SARS-CoV-2 replication (Figure 5B) at nontoxic concentrations (Figure 5C). At 50 µM, the citrate induced de novo lipogenesis mini pathway inhibitors reduced viral gene copies by 85.1 to 99%, while the glutamine metabolism mini pathway inhibitors reduced viral gene copies by 66.3 to 92.1%, and the malate-aspartate shuttle mini pathway inhibitor reduced viral gene copies by 93.7% (Figure 5B).
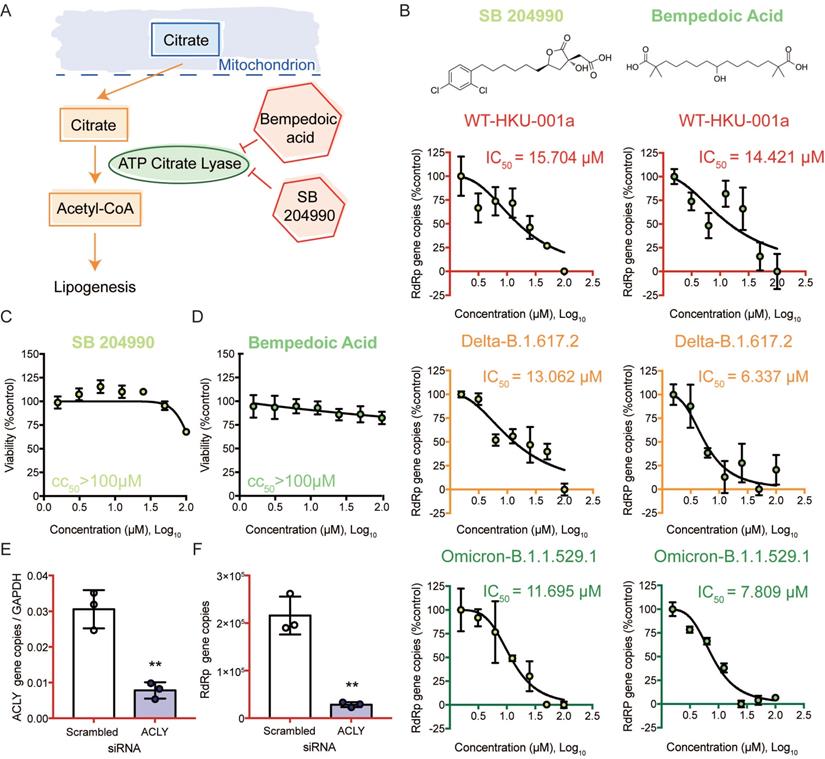
Targeting the citrate induced de novo lipogenesis mini pathway potently inhibits SARS-CoV-2 replication
We then selected the citrate induced de novo lipogenesis mini pathway for further investigation since inhibitors that targeted this mini pathway showed the most potent antiviral effect against SARS-CoV-2 (Figure 6A). Citrate, a crucial metabolite in the TCA cycle, is first exported from the mitochondria through transporters. Once it is transported out of the mitochondria, citrate is then converted to acetyl-CoA by ACLY [46]. This is a key step in fatty acid biosynthesis to generate acetyl-CoA for important biosynthetic pathways including lipogenesis and cholesterogenesis [46]. To investigate the role of ACLY on SARS-CoV-2 replication, we treated SARS-CoV-2 WT-, Delta-, or Omicron-infected Caco2 cells with SB 204990 or Bempedoic acid (specific inhibitors of ACLY), and determined their half maximal inhibitory concentrations (IC50) values. Our results indicated that both SB 204990 and Bempedoic acid efficiently suppressed the replication of SARS-CoV-2 WT, Delta, and Omicron (Figure 6B). The IC50 of SB 204990 against SARS-CoV-2 WT, Delta, and Omicron was 15.7 µM, 13.1 µM, and 11.7 µM, respectively, while the IC50 of Bempedoic acid against SARS-CoV-2 WT, Delta, and Omicron was 14.4 µM, 6.3 µM, and 7.8 µM, respectively (Figure 6B). The reduction in viral gene copies was not due to cell death as the 50% cytotoxic concentrations (CC50s) of these two inhibitors in Caco2 cells were above 100µM (Figures 6C and 6D). To further verify our findings from the selective small molecule inhibitors that the host ACLY is exploited for efficient SARS-CoV-2 replication, we performed gene depletion with ACLY siRNA. ACLY siRNA effectively depleted ACLY expression in Caco2 cells with a knockdown efficiency of 74.5% (P = 0.0025) (Figure 6E). Importantly, in ACLY-depleted Caco2 cells, SARS-CoV-2 replication was reduced by 86.8% (P = 0.0013) when compared to the control group (scrambled siRNA treated) at 24 hours post-infection (Figure 6F). Collectively, these results indicated that ACLY is required for efficient SARS-CoV-2 replication.
ACLY inhibition efficiently reduced the replication of SARS-CoV-2 wildtype and variants. (A) Schematic illustration of the citrate induced de novo lipogenesis mini pathway. (B) Caco2 cells were infected with SARS-CoV-2 WT, Delta, or Omicron BA.1 at 0.1 MOI and treated with SB 204990 or Bempedoic acid at a titration of different concentration (100, 50, 25, 12.5, 6.25, 3.125, or 1.5625 µM) or were treated with DMSO. Supernatants were harvested at 24 hours post-infection. The IC50 of SB 204990 and Bempedoic acid for SARS-CoV-2 WT, Delta, or Omicron BA.1 were calculated. (C and D) The CC50 of SB 204990 and Bempedoic acid in Caco2 cells were determined without virus infection at day 1. (E and F) Caco2 cells were transfected with ACLY or scrambled siRNA and infected with WT SARS-CoV-2 at 0.1 MOI. (E) The knockdown efficiency of ACLY is evaluated with qPCR. (F) Supernatants from SARS-CoV-2-infected cells treated with ACLY or scrambled siRNA were harvested at 24 hours post-infection. Virus replication was quantified with qPCR analysis. The IC50 and CC50 values in (B and D) were calculated with GraphPad Prism 7. Data represented mean and standard deviation from three independent experiments. Statistical differences were considered significant when P < 0.05. **P < 0.01.
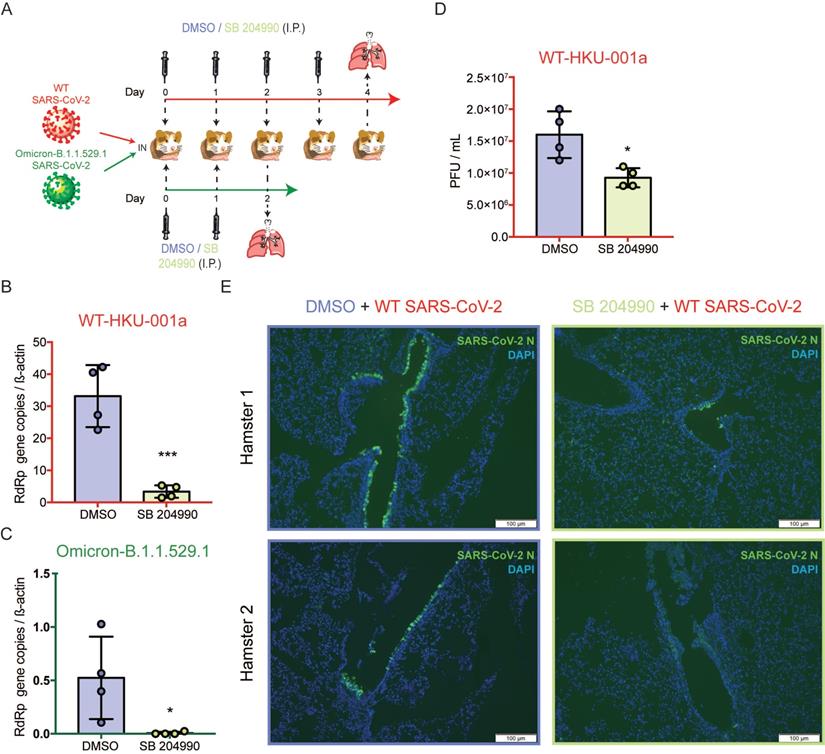
The selective ACLY inhibitor SB 204990 potently limits SARS-CoV-2 replication in vivo
To further investigate the physiological role of ACLY in vivo, we next evaluated the outcome of ACLY inhibition using our established golden Syrian hamster model as previously described with slight modifications [47, 48]. The hamsters were intranasally challenged with SARS-CoV-2 WT or Omicron at 3×10³ PFU and were intraperitoneally treated with SB 204990 or DMSO for 2 or 4 days. The infected hamsters were sacrificed at 2 or 4 days post-infection and their lung tissues were collected for viral gene copy and/or infectious titer quantification (Figure 7A). Consistent with our in vitro data, the in vivo data showed that the selective ACLY inhibitor SB 204990 significantly diminished the amount of viral RdRp gene copies in hamster lungs by about 90.0% (P = 0.0009) for WT (Figure 7B) and 98.8% (P = 0.0365) for Omicron (Figure 7C), respectively, when compared to the DMSO-treated groups. In keeping with the viral gene copy result, SB 204990 significantly reduced the amount of live infectious viral particles by 57.8% (P = 0.0141) in the lungs of SARS-CoV-2 WT-infected hamsters comparing to the DMSO-treated group (Figure 7D). To further evaluate the impact of ACLY on SARS-CoV-2 antigen expression in hamster lungs, we performed immunofluorescence staining for the lungs of SARS-CoV-2 WT-infected hamsters treated with SB 204990 or DMSO. Our results showed that the amount of detectable SARS-CoV-2 nucleocapsid protein was substantially lower in the SB 204990-treated hamsters than the DMSO-treated hamsters (Figure 7E). Taken together, these results indicated that inhibition of ACLY by SB 204990 effectively inhibits both SARS-CoV-2 WT and Omicron replication in vivo.
SB 204990 suppressed WT and Omicron BA.1 SARS-CoV-2 replications in a golden Syrian hamster model. Hamsters were intranasally inoculated with 3×10³ PFU per hamster of SARS-CoV-2 WT or Omicron BA.1. At 6 hours post-infection each hamster was treated intraperitoneally with 10mg/kg of SB 204990 or 5% DMSO at a final volume of 1000 µL PBS. The infected hamsters were subsequently treated with SB 204990 or DMSO at 1, 2, and 3 days post infection for a total of 2 or 4 doses. The infected hamsters were sacrificed on day 2 (Omicron-infected hamsters) or day 4 post-infection (SARS-CoV-2 WT-infected) for virological and histological assessments. (A) Schematic illustration of the in vivo study. (B) Viral RdRp gene copies in hamster lung tissues that were infected by SARS-CoV-2 WT were quantified by qRT-PCR. (C) Viral RdRp gene copies in hamster lung tissues that were infected by Omicron BA.1 were quantified by qRT-PCR. (D) Infectious titer of SARS-CoV-2 WT in hamster lung tissues were quantified by plaque assays. (E) Viral antigen in hamster lung tissues from SARS-CoV-2 WT-infected hamsters were detected with an in-house anti-SARS-CoV-2 nucleocapsid protein antibody. Cell nuclei were identified with DAPI stain. Data represented mean and standard deviation from two independent experiments. Statistical differences were considered significant when P < 0.05. *P < 0.05 and ***P < 0.001. Scale bar in (E) represented 100µm.
Discussion
Viruses are known to perturb the host metabolome to facilitate their own replication. For example, RNA viruses such as rhinovirus [49], influenza virus [50], Zika virus [51], Dengue virus [52], hepatitis C virus [53], and human immunodeficiency virus [54] can hijack the TCA cycle during viral replication. Recent studies have established methods for studying the metabolomics of SARS-CoV-2 infection [55-58]. However, detailed downstream analysis and the role of the identified host pathways during viral replication were not fully investigated. In this study, we investigated the SARS-CoV-2-induced metabolome perturbations in COVID-19 patient plasma samples. Utilizing combined data analysis from GC-MS-based targeted metabolomics and LC-MS-based untargeted metabolomics, we identified several metabolites participating in the TCA cycle that were significantly perturbed in COVID-19 patient samples. At the same time, a number of metabolites involved in biosynthesis of amino acid were downregulated in COVID-19 patient samples. The observed downregulated metabolites could be a result of the rapid SARS-CoV-2 replication, which used these metabolites (aspartic acid, tryptophan, lysine, asparagine, histidine, and glutamine) as building-blocks of viral synthesis.
Extending from the findings of a recent report on the association between SARS-CoV-2 infection and the host TCA cycle [59], in this study we further delineated the interaction between SARS-CoV-2 and specific host components in the TCA cycle, and identified ACLY as an important host factor involved in SARS-CoV-2 replication. ACLY is an essential metabolic enzyme that participates in fatty acid biosynthesis and is responsible for the synthesis of acetyl-CoA [46], which is then used in various critical biosynthetic pathways including lipogenesis and cholesterogenesis [46]. Lipogenesis is the conversion of fatty acids and glycerol into fats, or metabolic reactions of which acetyl-CoA is converted to triglycerides for fat storages [60]. Viruses rely on lipids for multiple stages of the viral replication cycle, including entry, formation of viral replication complex, replication, egress, and particle release [61]. Viruses such as hepatitis C virus and human immunodeficiency virus are known to perturb lipogenesis for optimal replications [62, 63]. MERS-CoV can reprogram the host lipid metabolism through the SREBPs-mediated lipogenesis to promote viral protein palmitoylation and formation of double-membrane vesicles for efficient viral replication [64]. Hepatitis B virus interferes with the lipid metabolism through ACLY during viral replication [65]. Therefore, ACLY inhibition may effectively disturb viral replication by reducing the amount of lipids that are crucial for various steps of the virus life cycle.
SARS-CoV-2 VOCs are associated with altered pathogenicity, transmissibility, and/or immune evasiveness [5]. Most clinically approved monoclonal antibodies were found to be ineffective against the most recently emerging Omicron [6, 9-11]. Specific inhibitors of key enzymes within the three mini pathways of the TCA cycle significantly reduced SARS-CoV-2 replication in vitro at non-toxic concentrations. Importantly, SB 204990 and Bempedoic acid also significantly inhibited the Delta and Omicron variants, suggesting that these host-targeting inhibitors are effective against emerging VOCs. Gene depletion using ACLY siRNA in Caco2 cells validated the findings of the selective small molecule inhibitors. Finally, we showed that SB 204990-treated Syrian hamsters exhibited significantly reduced viral burdens. Taken together, our findings identified ACLY as an important host factor that could be targeted to inhibit not only WT SARS-CoV-2, but also variants including Delta and Omicron.
Acknowledgements
We sincerely thank the staff members of the Centre for Comparative Medicine Research of The University of Hong Kong, and the Laboratory Animal Service Centre of The Chinese University of Hong Kong for their facilitation of the study. This study was partly supported by funding from the Health and Medical Research Fund (CID-HKU1-5, COVID1903010-Projects 7 and 14, and 20190652), the Food and Health Bureau, The Government of the Hong Kong Special Administrative Region; the General Research Fund (17118621) and the Theme-Based Research Scheme (T11-709/21-N) of the Research Grants Council, The Government of the Hong Kong Special Administrative Region; Health@InnoHK, Innovation and Technology Commission, the Government of the Hong Kong Special Administrative Region; National Natural Science Foundation of China Excellent Young Scientists Fund (Hong Kong and Macau) (32122001); National Program on Key Research Project of China (grant no. 2020YFA0707500 and 2020YFA0707504); the Consultancy Service for Enhancing Laboratory Surveillance of Emerging Infectious Diseases and Research Capability on Antimicrobial Resistance for Department of Health of the Hong Kong Special Administrative Region Government, Sanming Project of Medicine in Shenzhen, China (SZSM201911014); the High Level-Hospital Program, Health Commission of Guangdong Province, China; the National Key Research and Development Programme on Public Security Risk Prevention and Control Emergency Project; the University of Hong Kong Li Ka Shing Faculty of Medicine Enhanced New Staff Start-up Fund; the University of Hong Kong Outstanding Young Researcher Award; the University of Hong Kong Li Ka Shing Faculty of Medicine Research Output Prize; the Major Science and Technology Program of Hainan Province (ZDKJ202003); the research project of Hainan Academician Innovation Platform (YSPTZX202004); the Hainan Talent Development Project (SRC200003); and the Emergency Key Program of Guangzhou Laboratory (EKPG22-01); and the donations of the Shaw Foundation Hong Kong, Richard Yu and Carol Yu, May Tam Mak Mei Yin, Michael Seak-Kan Tong, Lee Wan Keung Charity Foundation Limited, Marina Man-Wai Lee, the Hong Kong Hainan Commercial Association South China Microbiology Research Fund, and Lo Ying Shek Chi Wai Foundation. The funding sources had no role in the study design, data collection, analysis, interpretation, or writing of the report.
Author contributions
Conceptualization: TTTY, JFWC, BY, HC
Methodology: TTTY, JFWC, BY, HC
Investigation: TTTY, BY, CCYS, HS, YH, XH, BH, YC, CY, YL, TZ, HL, JS, JZ, JPC, AJZ, JZ, SY, HC
Funding acquisition: JFWC, HC
Project administration: JFWC, HC
Supervision: JFWC, HC
Writing - original draft: TTTY, JFWC, BY, HC
Writing - review & editing: TTTY, JFWC, HC
Correspondence and requests for materials
These should be addressed to H.C.
Data availability
The data are available from the corresponding author upon reasonable request.
Competing Interests
J.F.-W.C. has received travel grants from Pfizer Corporation Hong Kong and Astellas Pharma Hong Kong Corporation Limited and was an invited speaker for Gilead Sciences Hong Kong Limited and Luminex Corporation. The other authors declare no competing interests.
References
1. Zhou P, Yang XL, Wang XG, Hu B, Zhang L, Zhang W. et al. A pneumonia outbreak associated with a new coronavirus of probable bat origin. Nature. 2020;579:270-3
2. Chan JF, Yuan S, Kok KH, To KK, Chu H, Yang J. et al. A familial cluster of pneumonia associated with the 2019 novel coronavirus indicating person-to-person transmission: a study of a family cluster. Lancet. 2020;395:514-23
3. Chan JF, Kok KH, Zhu Z, Chu H, To KK, Yuan S. et al. Genomic characterization of the 2019 novel human-pathogenic coronavirus isolated from a patient with atypical pneumonia after visiting Wuhan. Emerg Microbes Infect. 2020;9:221-36
4. WHO. Weekly operational update on COVID-19 - 1 March 2022. https://www.who.int/publications/m/item/weekly-operational-update-on-covid-19--1-march-2022.
5. Shuai H, Chan JF, Hu B, Chai Y, Yuen TT, Yin F. et al. Attenuated replication and pathogenicity of SARS-CoV-2 B.1.1.529 Omicron. Nature. 2022;603:693-9
6. Liu L, Iketani S, Guo Y, Chan JF, Wang M, Liu L. et al. Striking antibody evasion manifested by the Omicron variant of SARS-CoV-2. Nature. 2022;602:676-81
7. Iketani S, Liu L, Guo Y, Liu L, Chan JF, Huang Y. et al. Antibody evasion properties of SARS-CoV-2 Omicron sublineages. Nature. 2022;604:553-6
8. Chu H, Yuen KY. Pathogenicity of SARS-CoV-2 Omicron. Clin Transl Med. 2022;12:e880
9. Cameroni E, Bowen JE, Rosen LE, Saliba C, Zepeda SK, Culap K. et al. Broadly neutralizing antibodies overcome SARS-CoV-2 Omicron antigenic shift. Nature. 2022;602:664-70
10. Planas D, Saunders N, Maes P, Guivel-Benhassine F, Planchais C, Buchrieser J. et al. Considerable escape of SARS-CoV-2 Omicron to antibody neutralization. Nature. 2022;602:671-5
11. Cao Y, Wang J, Jian F, Xiao T, Song W, Yisimayi A. et al. Omicron escapes the majority of existing SARS-CoV-2 neutralizing antibodies. Nature. 2022;602:657-63
12. Patti GJ, Yanes O, Siuzdak G. Innovation: Metabolomics: the apogee of the omics trilogy. Nat Rev Mol Cell Biol. 2012;13:263-9
13. Yan B, Zou Z, Chu H, Chan G, Tsang JO, Lai PM. et al. Lipidomic Profiling Reveals Significant Perturbations of Intracellular Lipid Homeostasis in Enterovirus-Infected Cells. International journal of molecular sciences. 2019;20(23):5952
14. Burnum-Johnson KE, Kyle JE, Eisfeld AJ, Casey CP, Stratton KG, Gonzalez JF. et al. MPLEx: a method for simultaneous pathogen inactivation and extraction of samples for multi-omics profiling. Analyst. 2017;142:442-8
15. Tsugawa H, Cajka T, Kind T, Ma Y, Higgins B, Ikeda K. et al. MS-DIAL: data-independent MS/MS deconvolution for comprehensive metabolome analysis. Nat Methods. 2015;12:523-6
16. Roessner U, Patterson JH, Forbes MG, Fincher GB, Langridge P, Bacic A. An investigation of boron toxicity in barley using metabolomics. Plant Physiol. 2006;142:1087-101
17. Reich M, Hannig C, Al-Ahmad A, Bolek R, Kummerer K. A comprehensive method for determination of fatty acids in the initial oral biofilm (pellicle). J Lipid Res. 2012;53:2226-30
18. Dunn WB, Broadhurst D, Begley P, Zelena E, Francis-McIntyre S, Anderson N. et al. Procedures for large-scale metabolic profiling of serum and plasma using gas chromatography and liquid chromatography coupled to mass spectrometry. Nat Protoc. 2011;6:1060-83
19. Yan B, Deng Y, Hou J, Bi Q, Yang M, Jiang B. et al. UHPLC-LTQ-Orbitrap MS combined with spike-in method for plasma metabonomics analysis of acute myocardial ischemia rats and pretreatment effect of Danqi Tongmai tablet. Molecular bioSystems. 2015;11:486-96
20. Kind T, Liu KH, Lee DY, DeFelice B, Meissen JK, Fiehn O. LipidBlast in silico tandem mass spectrometry database for lipid identification. Nat Methods. 2013;10:755-8
21. Fan SL, Kind T, Cajka T, Hazen SL, Tang WHW, Kaddurah-Daouk R. et al. Systematic Error Removal Using Random Forest for Normalizing Large-Scale Untargeted Lipidomics Data. Anal Chem. 2019;91:3590-6
22. Galindo-Prieto B, Eriksson L, Trygg J. Variable influence on projection (VIP) for orthogonal projections to latent structures (OPLS). Journal of Chemometrics. 2014;28:623-32
23. Kanehisa M, Sato Y, Kawashima M, Furumichi M, Tanabe M. KEGG as a reference resource for gene and protein annotation. Nucleic Acids Res. 2016;44:D457-62
24. Chu H, Chan JF, Yuen TT, Shuai H, Yuan S, Wang Y. et al. Comparative tropism, replication kinetics, and cell damage profiling of SARS-CoV-2 and SARS-CoV with implications for clinical manifestations, transmissibility, and laboratory studies of COVID-19: an observational study. Lancet Microbe. 2020;1:e14-e23
25. Shuai H, Chan JF, Yuen TT, Yoon C, Hu JC, Wen L. et al. Emerging SARS-CoV-2 variants expand species tropism to murines. EBioMedicine. 2021;73:103643
26. Chu H, Hu B, Huang X, Chai Y, Zhou D, Wang Y. et al. Host and viral determinants for efficient SARS-CoV-2 infection of the human lung. Nat Commun. 2021;12:134
27. Chu H, Shuai H, Hou Y, Zhang X, Wen L, Huang X. et al. Targeting highly pathogenic coronavirus-induced apoptosis reduces viral pathogenesis and disease severity. Sci Adv. 2021;7(25):eabf8577
28. Chan JF, Yip CC, To KK, Tang TH, Wong SC, Leung KH. et al. Improved Molecular Diagnosis of COVID-19 by the Novel, Highly Sensitive and Specific COVID-19-RdRp/Hel Real-Time Reverse Transcription-PCR Assay Validated In Vitro and with Clinical Specimens. J Clin Microbiol. 2020;58(5):e00310-20
29. Chu H, Chan JF, Wang Y, Yuen TT, Chai Y, Shuai H. et al. SARS-CoV-2 Induces a More Robust Innate Immune Response and Replicates Less Efficiently Than SARS-CoV in the Human Intestines: An Ex Vivo Study With Implications on Pathogenesis of COVID-19. Cell Mol Gastroenterol Hepatol. 2021;11:771-81
30. Chu H, Yuen TTT, Chik KKH, Yuan S, Shuai H, Zou Z. et al. Targeting the Inositol-Requiring Enzyme-1 Pathway Efficiently Reverts Zika Virus-Induced Neurogenesis and Spermatogenesis Marker Perturbations. ACS Infect Dis. 2020;6:1745-58
31. Yuan S, Chan CC, Chik KK, Tsang JO, Liang R, Cao J. et al. Broad-Spectrum Host-Based Antivirals Targeting the Interferon and Lipogenesis Pathways as Potential Treatment Options for the Pandemic Coronavirus Disease 2019 (COVID-19). Viruses. 2020;12(6):628
32. Wen L, Tang K, Chik KK, Chan CC, Tsang JO, Liang R. et al. In silico structure-based discovery of a SARS-CoV-2 main protease inhibitor. Int J Biol Sci. 2021;17:1555-64
33. Chan CM, Chu H, Wang Y, Wong BH, Zhao X, Zhou J. et al. Carcinoembryonic Antigen-Related Cell Adhesion Molecule 5 Is an Important Surface Attachment Factor That Facilitates Entry of Middle East Respiratory Syndrome Coronavirus. J Virol. 2016;90:9114-27
34. Chu H, Chan CM, Zhang X, Wang Y, Yuan S, Zhou J. et al. Middle East respiratory syndrome coronavirus and bat coronavirus HKU9 both can utilize GRP78 for attachment onto host cells. J Biol Chem. 2018;293:11709-26
35. Chan JF, Yuan S, Zhang AJ, Poon VK, Chan CC, Lee AC. et al. Surgical Mask Partition Reduces the Risk of Noncontact Transmission in a Golden Syrian Hamster Model for Coronavirus Disease 2019 (COVID-19). Clin Infect Dis. 2020;71:2139-49
36. Lee AC, Zhang AJ, Chan JF, Li C, Fan Z, Liu F. et al. Oral SARS-CoV-2 Inoculation Establishes Subclinical Respiratory Infection with Virus Shedding in Golden Syrian Hamsters. Cell Rep Med. 2020;1:100121
37. Chan JF, Poon VK, Chan CC, Chik KK, Tsang JO, Zou Z. et al. Low Environmental Temperature Exacerbates Severe Acute Respiratory Syndrome Coronavirus 2 Infection in Golden Syrian Hamsters. Clin Infect Dis. 2021
38. Yuan S, Yan B, Cao J, Ye ZW, Liang R, Tang K. et al. SARS-CoV-2 exploits host DGAT and ADRP for efficient replication. Cell Discov. 2021;7:100
39. Zhang AJ, Lee AC, Chan JF, Liu F, Li C, Chen Y. et al. Coinfection by Severe Acute Respiratory Syndrome Coronavirus 2 and Influenza A(H1N1)pdm09 Virus Enhances the Severity of Pneumonia in Golden Syrian Hamsters. Clin Infect Dis. 2021;72:e978-e92
40. Yuan S, Yin X, Meng X, Chan JF, Ye ZW, Riva L. et al. Clofazimine broadly inhibits coronaviruses including SARS-CoV-2. Nature. 2021;593:418-23
41. Zhang BZ, Shuai H, Gong HR, Hu JC, Yan B, Yuen TT. et al. Bacillus Calmette-Guerin-induced trained immunity protects against SARS-CoV-2 challenge in K18-hACE2 mice. JCI Insight. 2022 7
42. Chu H, Zhou J, Wong BH, Li C, Cheng ZS, Lin X. et al. Productive replication of Middle East respiratory syndrome coronavirus in monocyte-derived dendritic cells modulates innate immune response. Virology. 2014;454-455:197-205
43. Chu H, Chan JF, Wang Y, Yuen TT, Chai Y, Hou Y. et al. Comparative Replication and Immune Activation Profiles of SARS-CoV-2 and SARS-CoV in Human Lungs: An Ex Vivo Study With Implications for the Pathogenesis of COVID-19. Clin Infect Dis. 2020;71:1400-9
44. Chu H, Zhou J, Wong BH, Li C, Chan JF, Cheng ZS. et al. Middle East Respiratory Syndrome Coronavirus Efficiently Infects Human Primary T Lymphocytes and Activates the Extrinsic and Intrinsic Apoptosis Pathways. J Infect Dis. 2016;213:904-14
45. Fu X, Li K, Niu Y, Lin Q, Liang H, Luo X. et al. The mTOR/PGC-1alpha/SIRT3 Pathway Drives Reductive Glutamine Metabolism to Reduce Oxidative Stress Caused by ISKNV in CPB Cells. Microbiol Spectr. 2022;10:e0231021
46. Akram M. Citric acid cycle and role of its intermediates in metabolism. Cell Biochem Biophys. 2014;68:475-8
47. Chan JF, Zhang AJ, Yuan S, Poon VK, Chan CC, Lee AC. et al. Simulation of the Clinical and Pathological Manifestations of Coronavirus Disease 2019 (COVID-19) in a Golden Syrian Hamster Model: Implications for Disease Pathogenesis and Transmissibility. Clin Infect Dis. 2020;71:2428-46
48. Chu H, Chan JF, Yuen KY. Animal models in SARS-CoV-2 research. Nat Methods. 2022;19:392-4
49. Gualdoni GA, Mayer KA, Kapsch AM, Kreuzberg K, Puck A, Kienzl P. et al. Rhinovirus induces an anabolic reprogramming in host cell metabolism essential for viral replication. Proc Natl Acad Sci U S A. 2018;115:E7158-E65
50. Fontaine KA, Camarda R, Lagunoff M. Vaccinia virus requires glutamine but not glucose for efficient replication. J Virol. 2014;88:4366-74
51. Thaker SK, Chapa T, Garcia G Jr, Gong D, Schmid EW, Arumugaswami V. et al. Differential Metabolic Reprogramming by Zika Virus Promotes Cell Death in Human versus Mosquito Cells. Cell Metab. 2019;29:1206-16 e4
52. Fontaine KA, Sanchez EL, Camarda R, Lagunoff M. Dengue virus induces and requires glycolysis for optimal replication. J Virol. 2015;89:2358-66
53. Diamond DL, Syder AJ, Jacobs JM, Sorensen CM, Walters KA, Proll SC. et al. Temporal proteome and lipidome profiles reveal hepatitis C virus-associated reprogramming of hepatocellular metabolism and bioenergetics. PLoS Pathog. 2010;6:e1000719
54. Hollenbaugh JA, Munger J, Kim B. Metabolite profiles of human immunodeficiency virus infected CD4+ T cells and macrophages using LC-MS/MS analysis. Virology. 2011;415:153-9
55. Sharma N, Bhat SH, Tripathi G, Yadav M, Mathew B, Bindal V. et al. Global metabolome profiling of COVID-19 respiratory specimen using high-resolution mass spectrometry (HRMS). STAR Protoc. 2022;3:101051
56. Alboniga OE, Jimenez D, Sanchez-Conde M, Vizcarra P, Ron R, Herrera S. et al. Metabolic Snapshot of Plasma Samples Reveals New Pathways Implicated in SARS-CoV-2 Pathogenesis. J Proteome Res. 2022;21(3):623-63
57. Valdes A, Moreno LO, Rello SR, Orduna A, Bernardo D, Cifuentes A. Metabolomics study of COVID-19 patients in four different clinical stages. Sci Rep. 2022;12:1650
58. Barberis E, Timo S, Amede E, Vanella VV, Puricelli C, Cappellano G. et al. Large-Scale Plasma Analysis Revealed New Mechanisms and Molecules Associated with the Host Response to SARS-CoV-2. Int J Mol Sci. 2020;21(22):8623
59. Mullen PJ, Garcia G Jr, Purkayastha A, Matulionis N, Schmid EW, Momcilovic M. et al. SARS-CoV-2 infection rewires host cell metabolism and is potentially susceptible to mTORC1 inhibition. Nat Commun. 2021;12:1876
60. Kersten S. Mechanisms of nutritional and hormonal regulation of lipogenesis. EMBO Rep. 2001;2:282-6
61. Konan KV, Sanchez-Felipe L. Lipids and RNA virus replication. Curr Opin Virol. 2014;9:45-52
62. Lerat H, Kammoun HL, Hainault I, Merour E, Higgs MR, Callens C. et al. Hepatitis C virus proteins induce lipogenesis and defective triglyceride secretion in transgenic mice. J Biol Chem. 2009;284:33466-74
63. Hellerstein MK, Grunfeld C, Wu K, Christiansen M, Kaempfer S, Kletke C. et al. Increased de novo hepatic lipogenesis in human immunodeficiency virus infection. J Clin Endocrinol Metab. 1993;76:559-65
64. Yuan S, Chu H, Chan JF, Ye ZW, Wen L, Yan B. et al. SREBP-dependent lipidomic reprogramming as a broad-spectrum antiviral target. Nat Commun. 2019;10:120
65. Teng CF, Wu HC, Hsieh WC, Tsai HW, Su IJ. Activation of ATP citrate lyase by mTOR signal induces disturbed lipid metabolism in hepatitis B virus pre-S2 mutant tumorigenesis. J Virol. 2015;89:605-14
Author contact
![]() Corresponding author: hinchuhk (H.C.)
Corresponding author: hinchuhk (H.C.)