Impact Factor ISSN: 1449-2288
- Issue 11; 2026
- Issue 10; 2026
- Issue 9; 2026
- Issue 8; 2026
- Issue 7; 2026
- Volume 22; 2026
- Past Issues
- Advance Articles
- Editorial Board
- Cover Images
- Index & Coverage
- Cover Suggestion
- Special Issues
Introduction
Results
Discussion
Materials and Methods
Conclusion
Abbreviations
Supplementary Material
Acknowledgements
References

 Global reach, higher impact
Int J Biol Sci 2023; 19(10):3266-3284. doi:10.7150/ijbs.83302 This issue Cite
Research Paper
Loss of MIR503HG facilitates papillary renal cell carcinoma associated lymphatic metastasis by triggering NOTCH1/VEGFC signaling
Yiqiu Wang1#, Xinyi Zheng2#, Wenjie Huang3#, Jiayi Lu1#, Naiqiao Hou1, Jiabao Qi1, Junjie Ma1, Wei Xue1 ![]() , Junhua Zheng1
, Junhua Zheng1 ![]() , Wei Zhai1,4
, Wei Zhai1,4 ![]()
1. Department of Urology, Renji Hospital, Shanghai Jiao Tong University School of Medicine, Shanghai, 200127, China.
2. Department of Pharmacy, Huashan Hospital, Fudan University, 12 Middle Urumqi Road, Shanghai, 200040, China.
3. Department of Urology, Yangpu Hospital, School of Medicine, Tongji University, Shanghai, 200090, China.
4. State Key Laboratory of Oncogenes and Related Genes, Department of Urology, Renji Hospital, School of Medicine, Shanghai Jiao Tong University, Shanghai, 200127, China.
#These authors have contributed equally to this work
Received 2023-2-7; Accepted 2023-6-2; Published 2023-6-19
Abstract

Clinical lymphatic metastasis indicates an extremely poor prognosis. Patients with papillary renal cell carcinoma (pRCC) have a high probability of progressing to lymphatic metastasis. However, the molecular mechanism of pRCC-associated lymphatic metastasis has not been elucidated. In this study, we found a downregulated long non-coding RNA (lncRNA) MIR503HG in pRCC primary tumor tissues due to hypermethylation at the CpG islands within its transcriptional start site. Decreased MIR503HG expression could stimulate tube formation and migration of human lymphatic endothelial cell (HLEC) and play a central role to promote lymphatic metastasis in vivo by enhancing tumor lymphangiogenesis. MIR503HG, located in the nucleus, bound with histone variant H2A.Z and affected the recruitment of histone variant H2A.Z to chromatin. Subsequently, increasing the H3K27 trimethylation caused by MIR503HG-overexpression epigenetically downregulated the NOTCH1 expression, which ultimately resulted in decreasing VEGFC secretion and lymphangiogenesis. Additionally, downregulated MIR503HG facilitated the HNRNPC expression, which ultimately promoted the maturation of NOTCH1 mRNA. Notably, upregulating MIR503HG expression might decrease pRCC resistance to the mTOR inhibitor. Together, these findings highlighted a VEGFC-independent mechanism of MIR503HG-mediated lymphatic metastasis. MIR503HG, identified as a novel pRCC-suppressor, would serve as the potentially biomarker for lymphatic metastasis.
Keywords: Papillary renal cell carcinoma, Lymphatic metastasis, Long non-coding RNA, DNA methylation, Target therapy
Introduction
Papillary renal cell carcinoma (pRCC), which varies widely from other RCC histologic variants, has its genetic and pathologic characteristics [1]. Ranked as the second-most type of RCC, it represents 10-15% of all kidney cancers [2, 3]. Different clinical behaviors were discovered in RCC subtypes because of biological distinction [4, 5]. As the pattern of manifestation of biological underpinnings, pRCC has greater tendency to become metastatic pRCC (mpRCC) and spreads in different sites in patients. Compared with other subtypes, lymph node (LN) is recognized as the most common metastatic site in pRCC [6]. Up to now, this unique biologic profile of pRCC has not been elucidated.
Through the lymphatic system, cancer cells could be disseminated to lymph-vessels and transported to distant LNs, finally settled down and colonized in LN [7]. Therefore, lymphangiogenesis, as an essential process for lymphatic metastasis, was associated with metastasis-free survival in a dozen solid tumors [8, 9].
Previous studies reported the molecular markers can distinguish lymphatic vessels from blood vessels. Vascular endothelial growth factor C, named VEGFC, could induce lymphangiogenesis in tumor tissues [10]. Given that the VEGFC/VEGF receptor 3 signaling was the key pathway for lymphatic metastasis [11, 12], multiple targeted drugs (anti-lymphangiogenic) have undergone clinical trials, such as monoclonal antibodies VGX-100 and IMC-3C5 [13, 14]. Understanding the specific mechanisms of VEGFC signaling pathway in pRCC would provide valuable treatment options for effective anti-VEGFC treatment in the clinic.
Long non-coding RNA (lncRNA) is a type of transcripts that are longer than two hundred nucleotides [15]. Although exhibiting no protein-coding potential, it was reported that it involved in many biological processes, including regulating chromatin looping and modification [16], functioning as enhancer-associated RNAs [17, 18], trapping for some transcription factors [19], etc. Recent years, several researches have gradually unveiled the pathophysiological contributions of lncRNAs in the lymphatic metastasis [20-22]. Untill now, few studies have explored the function and mechanism of lncRNAs of pRCC-associated lymphatic metastasis.
In the present study, we discovered MIR503HG, a downregulated lncRNA in pRCC, exerted a pivotal role in the VEGFC axis. Our finding revealed a novel mechanism of MIR503HG-related lymphatic metastasis for pRCC.
Results
The pRCC-associated lncRNA-MIR503HG negatively correlated with VEGFC secretion
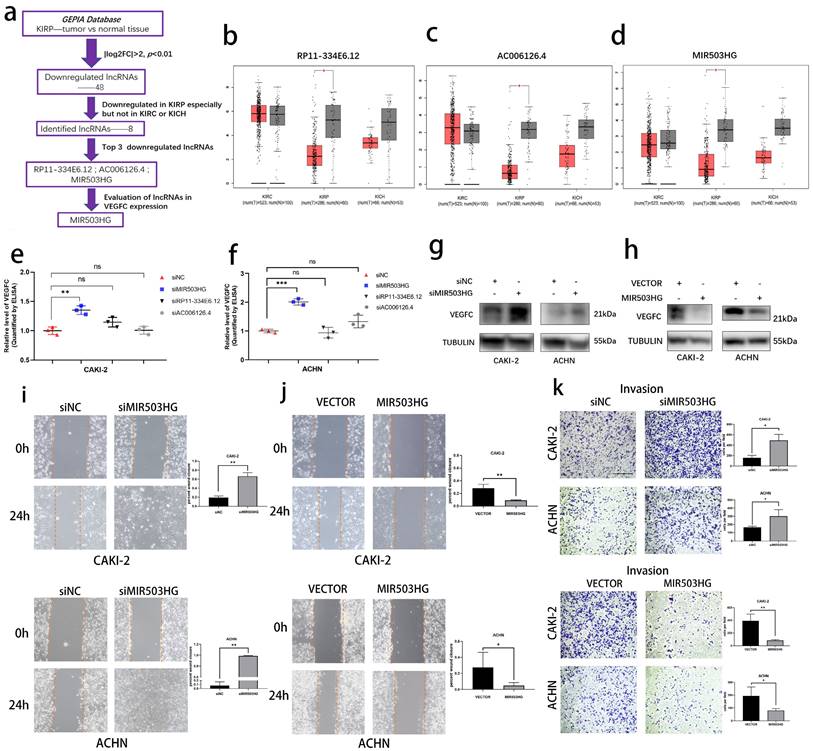
Using transcriptome data from Gene Expression Profiling Interactive Analysis (GEPIA) database, we determined lymphatic metastasis-related lncRNAs in pRCC (Fig. 1a). In short, we firstly selected 48 eligible lncRNAs (Table 1) and then 8 lncRNAs were identified as the pRCC-associated lncRNAs, all of them were only downregulated in kidney renal papillary carcinoma (KIRP), but not in kidney renal clear cell carcinoma (KIRC) or kidney chromophobe (KICH). Top 3 downregulated lncRNAs were selected as candidates to explore the crucial lncRNA involved in pRCC-associated lymphatic metastasis (Fig. 1b-d). We respectively established lncRNA-knockdown pRCC cell lines: CAKI-2 and ACHN. These two cell lines were widely reported the harbor genomic characteristics of pRCC [25, 26]. Next, with the ELISA assays, we found that MIR503HG was negatively associated with the VEGFC secretion in both CAKI-2 and ACHN cells (Fig. 1e-f), which was then verified by western blotting assay (Fig. 1g-h). Shifting the emphasis from three candidates to LncRNA-MIR503HG, we next established stable MIR503HG knockdown (shRNA) and overexpression pRCC cell lines for further research. The efficiency of siRNA, shRNA and overexpression were confirmed by qRT-PCR (Supplemental Fig. 1a-h). MIR503HG, as a tumor suppressor gene, could inhibit several solid tumors' capacity of progression [23, 24]. Our results showed that MIR503HG knockdown significantly enhanced invasion (Transwell assays) and migration (Wound-healing assays) of CAKI-2 and ACHN cells compared with the control group. Correspondingly, compared with negative control group, MIR503HG overexpression reduced not only migratory but also invasive capacity in both CAKI-2 and ACHN cells (Fig. 1i-k).
The pRCC-associated lncRNA-MIR503HG negatively correlated with VEGFC secretion. (a) Flow chart for the identification of VEGFC-associated lncRNA MIR503HG from GEPIA datasets. b-d. Downregulated of Non-coding RNA RP11-334E6.12 (b), AC006126.4 (c) MIR503HG (d) were found in TCGA-KIRP dataset. e-f. ELISA: After three LncRNA knockdown, the levels of VEGFC secretion were measured. Condition media were derived from CAKI-2 (e) and ACHN (f) cells, respectively. g-h. Representative image of Western blotting analysis of VEGFC protein expression in MIR503HG depletion (g) and overexpression (h) in pRCC cells. i-j. Representative images of the wound-healing assay using pRCC cell lines showing cell motility after ectopic expression (j) or knockdown of MIR503HG (i) at indicated time are shown. k. Invasion assays of pRCC cells with MIR503HG knockdown and overexpression. In all panels, data are shown as the mean ± s.d. For all representative images, at least three independent experiments were performed with similar results. NS, not significant, *P < 0.05, **P < 0.01, ***P < 0.001, one-way ANOVA followed by Dunnett's post hoc test was performed in e-f. The two-tailed Student's t-test was used in i-k, and the nonparametric Mann-Whitney U test was used in b-d.
Downregulated lncRNAs according to the GEPIA dataset.
| Gene Symbol | Gene ID | Median-T | Median-N | log2FC | adjP |
|---|---|---|---|---|---|
| RP11-35J10.7 | ENSG00000276668.1 | 0 | 3.015 | -2.005 | 7.79E-40 |
| GATA3-AS1 | ENSG00000197308.8 | 0 | 3.07 | -2.025 | 5.94E-55 |
| CTD-2247C11.5 | ENSG00000250529.1 | 0 | 3.102 | -2.036 | 2.37E-55 |
| H19 | ENSG00000130600.15 | 24.975 | 106.944 | -2.055 | 1.68E-15 |
| RP11-190A12.7 | ENSG00000256029.5 | 0 | 3.213 | -2.075 | 4.91E-70 |
| AC074286.1 | ENSG00000213963.6 | 1.5 | 9.66 | -2.092 | 2.45E-34 |
| TCL6 | ENSG00000187621.14 | 0.09 | 3.709 | -2.111 | 1.49E-40 |
| AC234582.1 | ENSG00000279487.1 | 1.59 | 10.399 | -2.138 | 4.51E-11 |
| LINC00473 | ENSG00000223414.2 | 0 | 3.419 | -2.144 | 4.64E-54 |
| RP11-397G17.1 | ENSG00000226733.1 | 0 | 3.484 | -2.165 | 3.57E-41 |
| RP1-261G23.7 | ENSG00000272114.1 | 8.69 | 42.833 | -2.177 | 1.41E-10 |
| LINC00671 | ENSG00000213373.7 | 1.24 | 9.39 | -2.214 | 3.18E-13 |
| TBX2-AS1 | ENSG00000267280.5 | 1.28 | 9.855 | -2.251 | 2.29E-26 |
| NR2F1-AS1 | ENSG00000237187.8 | 0.845 | 8.185 | -2.316 | 5.03E-52 |
| U47924.27 | ENSG00000257084.1 | 0 | 4.08 | -2.345 | 8.77E-41 |
| APCDD1L-AS1 | ENSG00000231290.5 | 0.06 | 4.424 | -2.355 | 1.11E-60 |
| LINC00645 | ENSG00000258548.5 | 0.06 | 4.593 | -2.4 | 1.93E-58 |
| RP13-895J2.6 | ENSG00000277011.1 | 0.05 | 4.577 | -2.409 | 3.83E-58 |
| MIR503HG | ENSG00000223749.7 | 0.895 | 9.495 | -2.469 | 1.18E-34 |
| RP11-61L19.2 | ENSG00000273335.1 | 0.21 | 5.815 | -2.494 | 1.38E-60 |
| RP11-573D15.8 | ENSG00000197099.8 | 0.04 | 4.904 | -2.505 | 9.35E-91 |
| TTTY14 | ENSG00000176728.7 | 0.155 | 5.606 | -2.516 | 6.56E-21 |
| AC006126.4 | ENSG00000267045.1 | 0.56 | 8.035 | -2.534 | 1.15E-54 |
| HOXB-AS3 | ENSG00000233101.10 | 2.98 | 22.169 | -2.541 | 8.72E-31 |
| RP11-849I19.1 | ENSG00000263146.2 | 0 | 5.02 | -2.59 | 1.96E-52 |
| RP3-333A15.2 | ENSG00000269933.1 | 0 | 5.028 | -2.592 | 2.11E-75 |
| RP11-12A20.10 | ENSG00000278735.1 | 0 | 5.055 | -2.598 | 1.01E-38 |
| LINC00839 | ENSG00000185904.11 | 0.18 | 6.355 | -2.64 | 1.36E-26 |
| LA16c-329F2.1 | ENSG00000261399.1 | 0.855 | 10.658 | -2.652 | 1.61E-28 |
| RP11-752D24.2 | ENSG00000248115.1 | 0.01 | 5.355 | -2.654 | 2.72E-76 |
| MEG3 | ENSG00000214548.14 | 0.685 | 9.864 | -2.689 | 1.1E-45 |
| LINC01606 | ENSG00000253301.5 | 0 | 5.88 | -2.782 | 1.17E-71 |
| AC132217.4 | ENSG00000240801.1 | 1.615 | 17.157 | -2.796 | 2.59E-18 |
| PP7080 | ENSG00000188242.4 | 18.91 | 137.324 | -2.796 | 1.02E-32 |
| RP11-728F11.4 | ENSG00000254528.7 | 2.895 | 26.88 | -2.839 | 3.4E-44 |
| RP4-655J12.4 | ENSG00000233154.5 | 0.13 | 7.15 | -2.85 | 1.46E-83 |
| RP11-35N6.1 | ENSG00000148123.14 | 0.435 | 9.479 | -2.868 | 1.54E-35 |
| RP13-452N2.1 | ENSG00000242048.3 | 0.02 | 6.708 | -2.918 | 3.78E-82 |
| RP11-334E6.12 | ENSG00000263873.1 | 3.75 | 37.866 | -3.033 | 1.29E-21 |
| LINC01055 | ENSG00000235366.2 | 0 | 8.119 | -3.189 | 1.78E-67 |
| AC093326.1 | ENSG00000223985.1 | 0.1 | 9.219 | -3.216 | 7.79E-46 |
| LINC01187 | ENSG00000249601.2 | 0 | 8.707 | -3.279 | 1.14E-93 |
| RP11-690G19.4 | ENSG00000265460.6 | 0 | 9.751 | -3.426 | 4.1E-102 |
| RP4-568C11.4 | ENSG00000274173.1 | 0.04 | 14.147 | -3.864 | 4.33E-66 |
| RP11-445F12.1 | ENSG00000277268.1 | 0.06 | 14.535 | -3.873 | 6.05E-46 |
| C16orf89 | ENSG00000153446.15 | 0.39 | 20.448 | -3.948 | 2.01E-50 |
| CH507-152C13.3 | ENSG00000276076.4 | 0.075 | 36.816 | -5.137 | 3.69E-71 |
| LINC00982 | ENSG00000177133.10 | 0.07 | 56.767 | -5.755 | 5.2E-121 |
Downregulated MIR503HG related with poor prognosis and lymphatic metastasis of pRCC
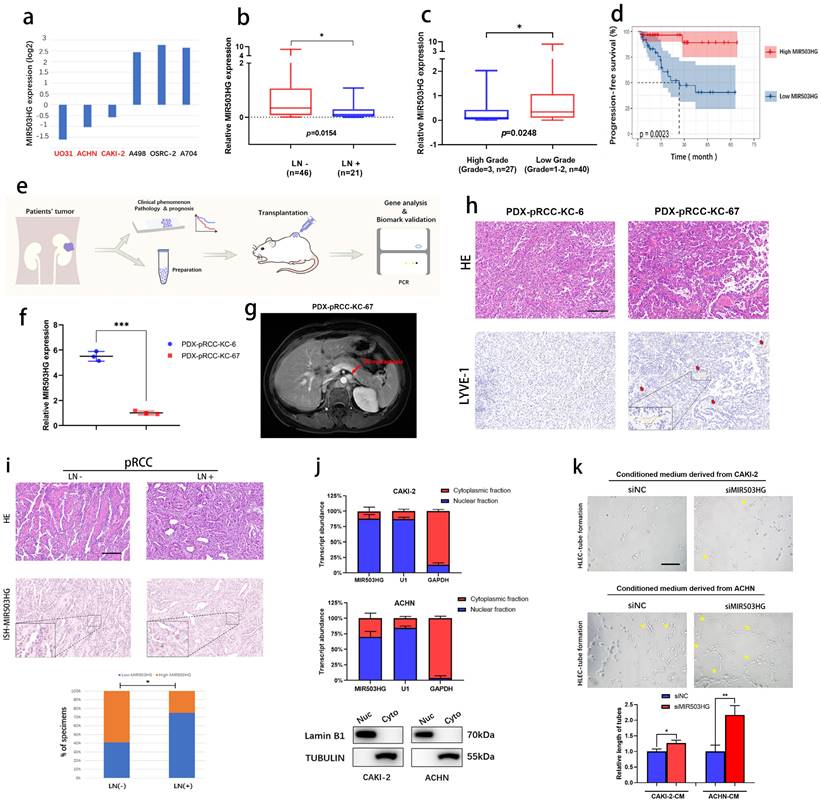
As expected, we found that MIR503HG expression was especially downregulated in several pRCC cell lines (UO31, ACHN and CAKI-2) in the Cancer Cell Line Encyclopedia (CCLE) datasets (Fig. 2a). Based on the qRT-PCR results of Renji pRCC-cohort, we observed that lower expression of MIR503HG was associated with high rate of lymphatic metastasis (Fig. 2b), high tumor grade (Fig. 2c) and poor PFS (Fig. 2d). Using the pRCC tissues from patients, we established patient derived xenograft (PDX) models for determining its suppressive role in pRCC-associated lymphatic metastasis (Fig. 2e). Patient-KC67 with the lower MIR503HG expression was diagnosed as the lymphatic metastasis, which was examined by magnetic resonance imaging (MRI) during follow-up (Fig. 2f-g). Patient-KC67 also showed high microlymphatic vessel density, which was indicated by LYVE-1 positive region (Fig. 2h). Two patients' clinical information were collected (Table 2).
Downregulated MIR503HG related with poor prognosis and lymphatic metastasis of pRCC. a. CCLE database (the Cancer Cell Line Encyclopedia): lower expression of lncRNA MIR503HG were found in pRCC cell lines (ACHN, CAKI-2 and UO-31). b-c. Comparison of MIR503HG expression in LN-positive & LN-negative pRCC tissues (b) and high grade & low grade pRCC tissues (c). d. Kaplan-Meier survival analysis of PFS for pRCC patients with low versus high MIR503HG expression. Median expression was used as a cutoff value. e. Flow chart: PDX models were established for subsequent research. f. qRT-PCR analysis verified the expression level of MIR503HG between patient KC6 and patient KC67. g. Magnetic Resonance Imaging (MRI) showed the para-aortic nodes metastases in pRCC Patient (ID: KC67). h. Representive images of HE&IHC staining (LYVE-1) evaluating potential microlymphatic metastases in PDXs tumor tissue. i. Representative images of MIR503HG expression in LN-negative and LN-positive pRCC tissues, MIR503HG expression level were quantified by ISH. Scale bars: 100 μm. j. Subcellular fractionation analysis of MIR503HG subcellular allocation in CAKI-2 and ACHN cells (bottom: western blot; top: qRT-PCR). U1 snRNA (nuclear retained) and GAPDH mRNA (exported to cytoplasm) were used as controls. k. Representative images and quantification of tube formation for HLECs treated with culture media from CAKI-2/ACHN siNC and siMIR503HG cells. Scale bars: 50 μm. The nonparametric Mann-Whitney U test was used to compare the expression levels of the 2 groups in b and c, and 2-tailed Student's t-test in f and k; and the χ2 test in i and j. Error bars show the standard deviation (SD) from at least three independent experiments. *P < 0.05; **P < 0.01, ***P < 0.001.
Clinicopathologic characteristics of two PDX models.
| Patient ID | Age | Sex | T stage | N stage | Tumor size | Metastasis site | Relative MIR503HG expression |
|---|---|---|---|---|---|---|---|
| KC6 | 59 | Female | T1b | 0 | >4cm | None | High |
| KC67 | 37 | Female | T3a | 0 | ≤4cm | Paraaortic LN/ Retroperitoneal LN | Low |
ISH assays were also performed by using formalin fixed paraffin-embedded (FFPE) tissues obtained from pRCC patients. Statistical analysis revealed that MIR503HG expression was significantly associated with lymphatic metastasis, suggesting it might be a prognostic factor of pRCC (Fig. 2i). As expected, we noticed that MIR503HG could be detected in pRCC cells' nucleus in subcellular fractionation assay (Fig. 2j), which was consistent with results of ISH.
Furthermore, tube formation experiments were performed in order to explore regulatory function of MIR503HG in lymphangiogenesis of pRCC. HLECs-tube formation was significantly inhibited after incubating with conditioned medium from MIR503HG overexpression pRCC cells (Supplemental Fig. 2a), while promoted in the siMIR503HG pRCC cells, compared with the control group, respectively (Fig. 2k).
MIR503HG was downregulated in pRCC due to hypermethylation
In consideration of DNA methylation is the dominating mechanism regulating lncRNA expression, bioinformatic data mining was conducted, and DNA hypermethylation status was observed at the transcription start site of MIR503HG in both MethPrimer and EMBOSS database (Fig. 3a-b). As the data from MEXPRESS database shown that methylation level was higher in primary pRCC than normal tissue (Fig. 3c), there may be a negative correlation between methylation status and MIR503HG expression.
MIR503HG was downregulated in pRCC due to hypermethylation. a. Detection of CpG islands in MIR503HG promoter by MethPrimer. The horizontal axis of the curved lines represents the sequence of MIR503HG, and the vertical axis of the curved lines represents GC percentage. TSS: Transcription Start Sites. b. Detection of CpG islands in MIR503HG promoter by EMBOSS. TSS: Transcription Start Sites. c. The relative methylation level of primary tumor was higher than normal tissue (shown by MEXPRESS). d. 13 CpG sites of MIR503HG promoter region in TCGA-KIRP data (shown by MEXPRESS). e. The DNA methylation level of MIR503HG promoter was detected in 10 paired pRCC tissues and adjacent non-cancer tissues by bisulfite sequencing. f. Representative sequencing analysis from clinical samples revealed that methylated CpG sites in pRCC tissues were higher than the adjacent normal renal tissues. g. Heatmap: Methylation level of the 13 CpG sites in pRCC and paired normal tissue. h. Representative sequencing analysis: the methylation level of 3 CpG sites were significant higher in pRCC samples. i. MSP-PCR: Comparison of the DNA methylation level of MIR503HG promoter region in pRCC and paired normal renal tissues. M = Methylated, U = Unmethylated. j. Treatment with 5-aza-dC increased MIR503HG expression by demethylating promoter region of MIR503HG in pRCC cells. M = Methylated, U = Unmethylated. The Wilcoxon Signed rank test were used in c,e, f and h. The statistical difference was assessed through 2-tailed Student's t- test in j. *P < 0.05; **P < 0.01.
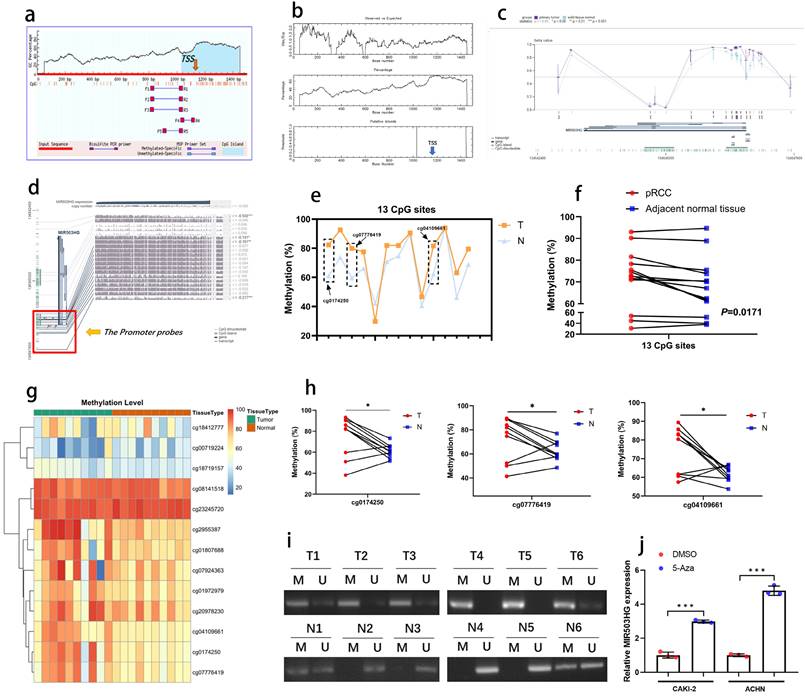
We proposed that the downregulation of MIR503HG in tumor tissues was caused by DNA hypermethylation, a mainly epigenetic mechanism for eukaryotic genomes. Furthermore, refer to MEXPRESS, we selected 13 CpGs at MIR503HG promoter (Fig. 3d) to explore the DNA methylation status (cg-IDs were presented in Table 3). By bisulfite analysis, the methylation level of 13 CpGs was measured in 10 pairs of pRCC tumors and adjacent normal tissues. The average methylation status of CpG sites was higher in pRCC tissue than that in paired normal renal tissue (Fig. 3e-g). The methylation level of 3 specific CpGs (cg0174250, cg07776419, cg04109661) was remarkably increased in pRCC samples, but no significant difference was found in other CpGs (Fig. 3h, Supplemental Fig. 3a-j). MSP-PCR assays also confirmed that MIR503HG was significantly hypermethylated in pRCC tissues than in paired normal tissue (Fig. 3i). Importantly, the expression of MIR503HG in pRCC cells were induced after treated with 5'azacytidine (Fig. 3j). These results supported the hypothesis that DNA hypermethylation played a crucial role in the decrease of MIR503HG in pRCC.
The detailed information of 13 CpG sites in MIR503HG promoter based on TCGA-KIRP data.
| Composite Element | Chromosome | Start | End |
|---|---|---|---|
| cg00719224 | X | 134547488 | 134547537 |
| cg07924363 | X | 134546783 | 134546832 |
| cg08141518 | X | 134546895 | 134546944 |
| cg18719157 | X | 134546846 | 134546895 |
| cg01807688 | X | 134546661 | 134546710 |
| cg18412777 | X | 134546636 | 134546685 |
| cg23245720 | X | 134546519 | 134546568 |
| cg07776419 | X | 134546447 | 134546496 |
| cg22955387 | X | 134546438 | 134546487 |
| cg07194250 | X | 134546433 | 134546482 |
| cg01972979 | X | 134546416 | 134546465 |
| cg20978230 | X | 134546340 | 134546389 |
| cg04109661 | X | 134546170 | 134546219 |
MIR503HG directly bound with H2A.Z
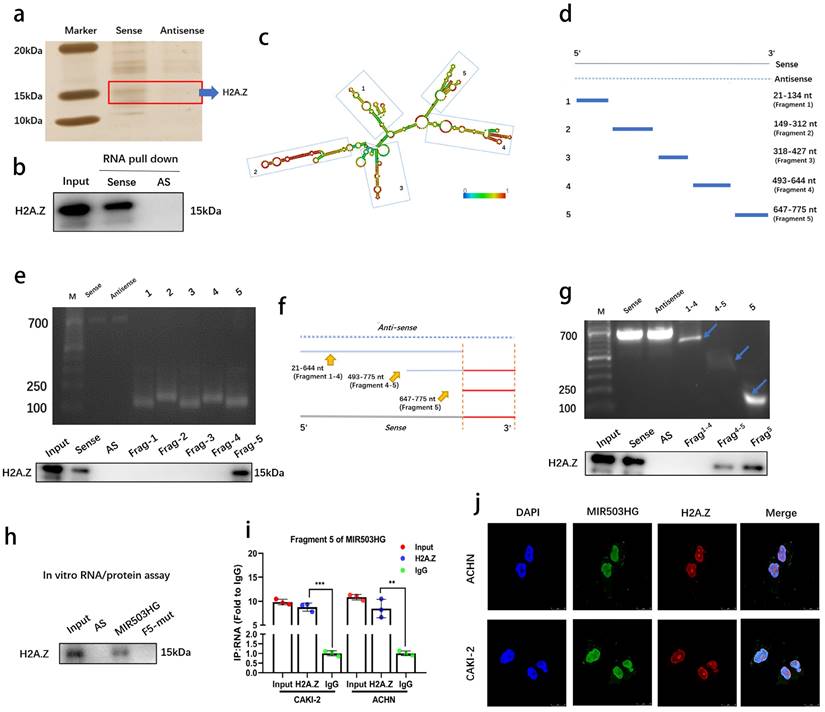
We conducted RNA pull-down assays to determine MIR503HG interacting proteins in pRCC. Silver staining revealed a specific protein region between 10-20 kDa in the MIR503HG pull-down samples as compared with antisense group (Fig. 4a and Supplemental Fig. 4a). Mass spectrometry assay was conducted in order to find the potential interacting proteins (Top 5 differential proteins identified were listed in Table 4). Notably, we found the potential binding partner protein, histone variant H2A.Z (Supplemental Fig. 4b), which has a well-known capability of regulating structure of chromatin, could participate in various biological processes by substituting the conventional histone proteins at specific locations of chromatin [27, 28]. Notably, lncRNAs have also been reported to interact with H2A.Z in the regulation process of cancer cells [29].
MIR503HG directly bound with H2A.Z. a. The silver staining image of RNA pull-down assay from pRCC tissue with MIR503HG sense and antisense RNAs. b. Representative western blots of H2A.Z pulled down by MIR503HG. c. Deletion mapping of the H2A.Z-binding domain in MIR503HG: graphic illustration of predicted secondary structure (LNCipedia, http://www.lncipedia.org). d-g. The truncations according to the stem-loop structure were shown in gel electrophoresis: In vitro transcribed full-length and deletion fragments of MIR503HG. Serial deletions of MIR503HG were used in RNA pull-down assays to identify core regions that were required for physical interaction with H2A.Z. h. RNA pull down assay between H2A.Z and indicated biotin-labeled lncRNAs. i. The enrichment of MIR503HG by the anti-H2A.Z antibody after RIP assays (IgG was used as negative). j. Representative images of IF: MIR503HG and H2A.Z co-localized in ACHN and CAKI-2 cells. The statistical difference was assessed through 2-tailed Student's t- test in i. Error bars show the standard deviation (SD) from three independent experiments. *P < 0.05; **P < 0.01; ***P < 0.001.
Results from biotinylated MIR503HG RNA pull-down experiments. Top 5 differential proteins were identified by Mass spectrometry, respectively.
| NO. | Reference | Coverage | Unique Peptides | Peptides |
|---|---|---|---|---|
| 1 | H2A.Z | 13.64 | 2 | 17 |
| 2 | TPIS | 21.29 | 4 | 4 |
| 3 | EXOS7 | 8.25 | 1 | 1 |
| 4 | GAPD | 5.38 | 1 | 1 |
| 5 | PRDX1 | 19.59 | 2 | 2 |
| 1 | TUBA1C | 49.86 | 1 | 21 |
| 2 | RBMXL1 | 42.14 | 6 | 25 |
| 3 | HNRNPC | 41.73 | 11 | 12 |
| 4 | PSMD7 | 37.02 | 3 | 3 |
| 5 | ALDOC | 39.45 | 3 | 1 |
To confirm the interaction and map the RNA-binding region of H2A.Z, western blotting was performed (Fig. 4b) and serial deletion assays were generated and confirmed that 647-775 nt sequences (5′-terminal of MIR503HG) was the essential part for the interaction with H2A.Z (Fig. 4c-e), and removal of fragment 5 (647-775 nt) abolished the MIR503HG -H2A.Z interaction (Fig. 4f-g). We further predicted the putative binding sites of RNA-binding protein by MEME website (Supplemental Fig. 4c). The results from RNA pull-down assay and RIP assay simultaneously proved the exact interactions between 647-775 nt and H2A.Z (Fig. 4h-i). FISH and IF assays also indicated MIR503HG and H2A.Z co-localized in the pRCC cells' nucleus (Fig. 4j), suggesting MIR503HG could bind with H2A.Z.
Downregulated MIR503HG epigenetically upregulated NOTCH1 expression and promoted VEGFC secretion in pRCC
Emerging evidences revealed that non-coding RNAs were widely participated in the regulation of cellular signals in tumor progression [33, 34]. In view of such phenomenon, the alteration of key genes in some important pathways related with RCC progression were detected after silencing MIR503HG expression in pRCC cells (Fig. 5a and Supplemental Fig. 5a-d). Notably, four pathways (Hedgehog, NOTCH/Jagged, WNT/β-catenin and TGF-β) with altered genes expression were further analyzed by ELISA assays. Rather than other pathway inhibitors, IMR-1, which specifically inhibited transcriptional activation complex on NOTCH chromatin [40], could reverse the stimulation by MIR503HG knockdown to VEGFC secretion (Fig. 5b and Supplemental Fig. 5e). Furthermore, consistent with the results of qRT-PCR, protein level of NOTCH1 expression were markedly increased by silencing MIR503HG expression. Conversely, levels of NOTCH1 were decreased in MIR503HG-overexpression pRCC cells (Fig. 5c). It is well-known that activation of NOTCH1 would promote RCC progression and metastasis [35, 36]. Kaplan-Meier curves also revealed that the high level of NOTCH1 expression was associated with poor overall survival in pRCC (Supplemental Fig. 5f). Additionally, NOTCH1-related signaling pathway could interact and regulate the expression level of VEGF family [37-39]. According to all above, we came to a conclusion that NOTCH1 was indispensable for MIR503HG-mediated VEGFC secretion in pRCC-associated lymphatic metastasis.
Downregulated MIR503HG epigenetically upregulated NOTCH1 expression and promoted VEGFC secretion in pRCC. a. qRT-PCR analysis was performed to detected the core genes involved in the NOTCH/Jagged pathway in MIR503HG-silenced CAKI-2 cells. b. ELISA for IMR-1, XAV939, LY2109761 and CYCLOPAMINE treatment on MIR503HG knockdown-induced VEGFC secretion in pRCC cells. c. Western blotting analysis evaluated the activation of the NOTCH1 by and MIR503HG overexpression (top) and MIR503HG knockdown (bottom) in pRCC cells. d. Representative image of Western blotting analysis of H3K27me3 level in H2A.Z depletion-pRCC cells e. Top: Schematic diagram of the potential binding sites in the NOTCH1 promoter; Bottom: The lysates were prepared for chromatin immunoprecipitation with H2A.Z and control antibodies, followed by examination of NOTCH1 promoter enrichment in CAKI-2 cells. f. ChIP analysis evaluated the enrichment of H2A.Z and H3K27me3 in MIR503HG-overexpression groups in pRCC cells. g. Luciferase activity was detected in MIR503HG knockdown CAKI-2 and ACHN cells transfected with NOTCH1-P1-MUT and NOTCH1-WT promoter plasmids. The statistical difference was assessed through 2-tailed Student's t- test in a, e, f and g. One-way ANOVA with Tukey's post hoc test was performed in b. Error bars show the standard deviation (SD) from three independent experiments. *P < 0.05; **P < 0.01; ***P < 0.001.
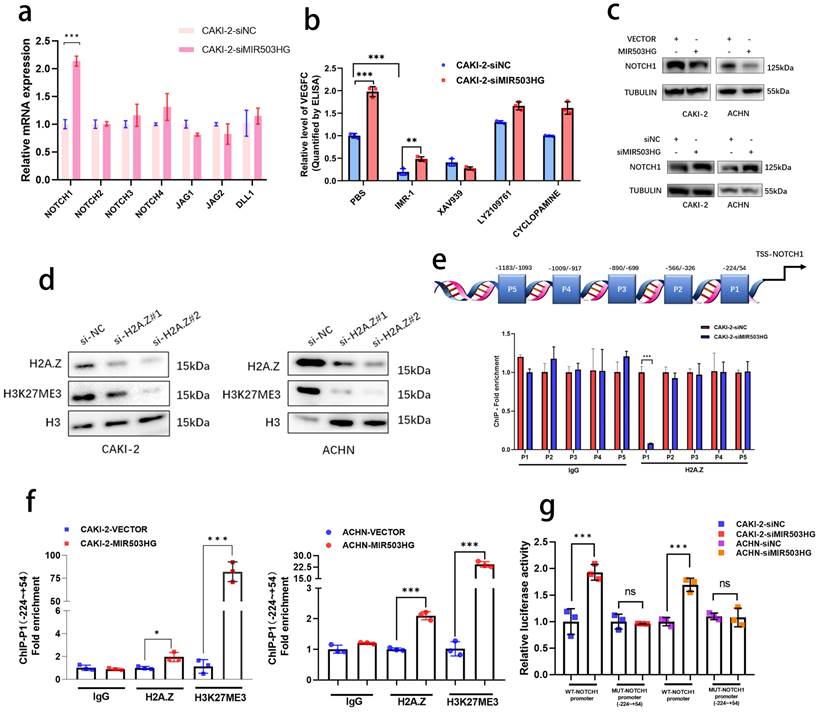
Given that H2A.Z was recognized as a crucial role in epigenetic modification of histone [30, 31], indeed, it epigenetically modulated target genes expression by catalyzing H3K27 trimethylation (H3K27me3) [32]. We transfected pRCC cells with corresponding small interfering RNA to prove that H2A.Z knockdown in pRCC cells rescued the inhibitory effect of MIR503HG overexpression on cell viability (Supplemental Fig. 5g) and silencing H2A.Z observably decreased H3K27 trimethylation level (Fig. 5d). Out of curiosity, we began to consider whether MIR503HG could regulate expression of NOTCH1 via H2A.Z-mediated H3K27 trimethylation. ChIP assays were designed and performed with anti-H2A.Z antibody and anti-H3K27me3 antibody, showing that H2A.Z was markedly enriched between -224 and +54 nucleotides (P1) in the promoter of NOTCH1 (Fig. 5e), MIR503HG-overexpression may dramatically increase H3K27me3 via coordinating depositions of H2A.Z in NOTCH1 promoter region (Fig. 5f and Supplemental Fig. 5h). Furthermore, luciferase report assays demonstrated that MIR503HG knockdown induced the luciferase activity of WT promoter of NOTCH1, while MIR503HG overexpression markedly decreased the luciferase activity (Fig. 5g and Supplemental Fig. 5i).
MIR503HG suppressed lymphatic metastasis through altering VEGFC in pRCC
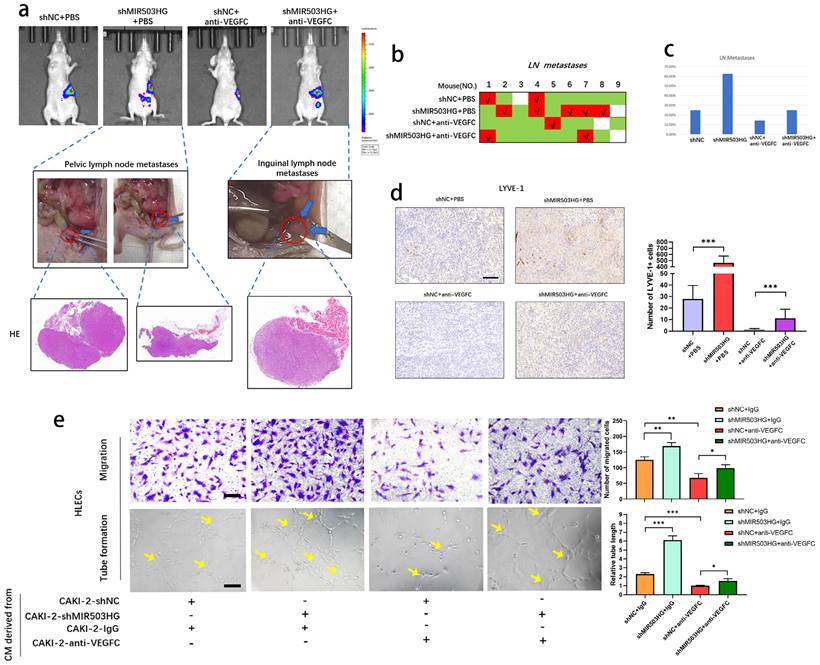
To further elucidate whether MIR503HG could suppress the lymphatic metastasis by downregulating VEGFC, we developed orthotopic xenograft model by injecting cells into the subrenal capsule to determine whether antagonism of VEGFC could suppress shMIR503HG-stimulated lymphatic metastasis.
IVIS showed that anti-VEGFC could reduce the shMIR503HG-induced metastatic capability of pRCC to LNs, and all suspicious tissues were collected and taken for histopathological observation to verify the lymphatic metastases (Fig. 6a-c). Consistently, IHC from LYVE-1 indicated that shMIR503HG significantly increased density of micro-lymphatic vessels in left-kidney capsule while treating with VEGFC neutralizing antibody markedly weakened shMIR503HG-stimulated lymphangiogenesis (Fig. 6d). On the other hand, antagonism of VEGFC significantly suppressed shMIR503HG-stimulated tube formation and migration of HLECs (Fig. 6e). Taken together, these results demonstrated that MIR503HG suppressed lymphatic metastasis in pRCC by regulating VEGFC.
MIR503HG suppressed lymphatic metastasis through altering VEGFC in pRCC. a. Nude mice were orthotopically xenografted with PBS or VEGFC neutralizing antibody. LNs and primary tumor tissues were detected by bioluminescent imaging, tumor samples were enucleated and analyzed by HE staining. b-c. Metastasis diagrams of mice in the indicated groups were shown. d. Representative images and histogram analysis of LYVE‐1‐indicated lymphatic vessel density in primary tumor tissues of differently treated mice from the IHC analysis. Scale bars: 100 μm. e. Representative images and quantification of tube formation and transwell-migration for differently treated groups. Scale bars: 50 μm. The statistical difference was assessed through one-way ANOVA with Tukey's post hoc test in d and e. Error bars show the standard deviation (SD) from at least three independent experiments. *P < 0.05; **P < 0.01; ***P < 0.001.
MIR503HG-modulated HNRNPC could maturate NOTCH1 mRNA in a m6A-dependent manner
With silver staining, another differential binding band between MIR503HG and antisense sequence were also noticed (Fig. 7a). Heterogeneous nuclear ribonucleoprotein C (HNRNPC), as known as N6-methyladenosine (m6A)-associated protein, was identified (Table 4 and Supplemental Fig. 4d) and its interaction with MIR503HG was further validated by western blotting (Fig. 7b).
MIR503HG-regulated HNRNPC can maturate NOTCH1 mRNA in an m6A-dependent manner. a. Representative image of silver-stained PAGE gels revealed the differential bands between biotin-labeled MIR503HG and antisense sequence of MIR503HG. b. Western blot analysis to determine the specific association of HNRNPC with biotinylated MIR503HG. c. Western blotting analysis evaluated the expression level of the HNRNPC by MIR503HG overexpression in ACHN and CAKI-2 cells. d. Expression level of NOTCH1 protein were measured by Western blotting analysis in pLenti-control and pLenti-sgHNRNPC. e. Expression level of NOTCH1 mRNA were measured by qRT-PCR analysis in pLenti-control and pLenti-sgHNRNPC. f. The potential m6A modification sites of NOTCH1 were predicted by SRAMP. g. RIP-qRT-PCR showing MIR503HG overexpression impaired the enrichment of m6A modification in the region P2. h. The enrichment of m6A were analyzed in NOTCH1-WT and NOTCH1-P2-MUT in the control and HNRNPC KO cells. i. RIP-qRT-PCR: detecting the enrichment of HNRNPC in MIR503HG KD in the NOTCH1-P2-MUT group. j. Pre-mRNA and mature NOTCH1 mRNA were analyzed using qRT-PCR after HNRNPC KO for 48 h. k. The survival curves of high and low HNRNPC expression were plotted by the Kaplan-Meier analysis with two-tailed log-rank test. Date was from The Cancer Genome Atlas (TCGA)-KIRP dataset. The statistical difference was assessed through 2-tailed Student's t- test in e, g-j. Error bars show the standard deviation (SD) from three independent experiments. *P < 0.05; **P < 0.01; ***P < 0.001.
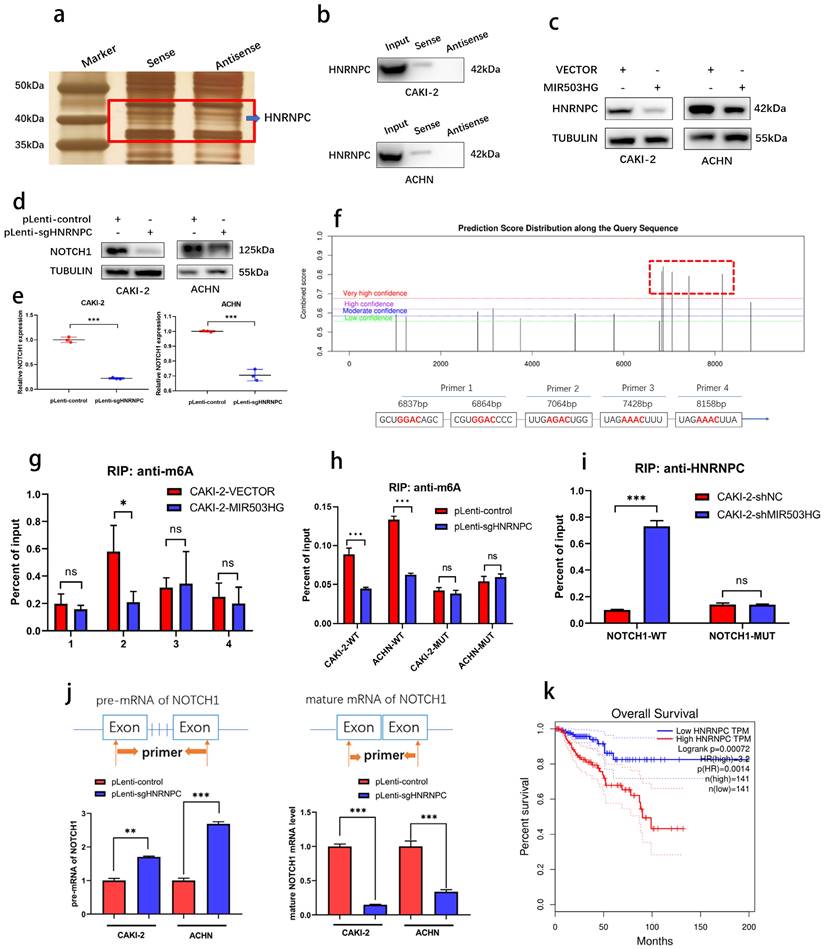
It surprised us that there was a negative correlation between MIR503HG and HNRNPC (Fig. 7c). To illustrate the possibility that MIR503HG could regulate this m6A reader to influence its downstream target NOTCH1, we successfully established HNRNPC-KO cells through CRISPR/Cas9 approach (Supplemental Fig. 6a-c). Positive regulatory effects of HNRNPC on NOTCH1 expression were shown by western blotting assay (Fig. 7d-e).
As known as the primary form of RNA modification, m6A regulates gene expression and decides eukaryote fate [41]. To clarify whether NOTCH1 could be modified by m6A methylation, five m6A modification sites with very high confidence of NOTCH1 mRNA were predicted by SRAMP database (Fig. 7f and Supplemental Fig. 6d) and RIP-qPCR assays indicated that MIR503HG-overexpression significantly reduced HNRNPC-binding to the m6A-modified region (P2) of NOTCH1 (Fig. 7g-h and Supplemental Fig. 6e). Consistently, mutation of P2 abrogated the enrichment of HNRNPC in MIR503HG-silenced cells (Fig. 7i and Supplemental Fig. 6f).
As widely reported, HNRNPC influenced the pre-mRNA processing, transport, stability, and other aspects of mRNA metabolism [42-44]. Hence, we designed primers with or without introns, and performed qRT-PCR to determine that HNRNPC-KO decreased the efficiency of NOTCH1 mRNA processing and maturation (Fig. 7j). Moreover, similar to NOTCH1, Kaplan-Meier analysis of overall survival of TCGA-KIRP dataset revealed that higher expression of HNRNPC was associated with poor overall survival (Fig. 7k).
Taken together, these findings indicated that downregulation of MIR503HG promoted maturation of NOTCH1 mRNA via HNRNPC mediating m6A-dependent manner.
Everolimus repressed lymphatic metastasis via inducing MIR503HG
It was reported that LncRNAs enabled to predict the response to target therapy of RCC [45, 46]. In present study, to identify whether MIR503HG could be the potential therapeutic target of lymphatic metastasis, several drugs, such as Everolimus, Cabozantinib, Lenvatinib and Axinitib, which were currently used for RCC treatment, were examined during research. Western blotting assay showed that VEGFC and NOTCH1 expression were downregulated by treating several drugs, respectively (Fig. 8a and Supplemental Fig. 7a). Notably, qRT-PCR analysis revealed that MIR503HG expression level was significantly induced in Everolimus group, while no significant difference was found in other groups (Fig. 8b-d). Inhibition of mTOR signaling was reported that increases the expression of p53 protein level [47]. Consistently, two potential p53-binding sites in MIR503HG promoter region were detected by JASPAR database (Supplemental Table 1). Interestingly, qRT-PCR analysis provided additional evidences for the mechanistic connection that Everolimus-enhanced MIR503HG expression was considerably decreased in cells with concurrent p53 silence (Supplemental Fig. 7b-c).
Everolimus repressed lymphatic metastasis via inducing MIR503HG. a. Western blotting assays were performed to determine different treatment effects (Belzutifan, Axitinib, Lenvatinib, Everolimus and Cabozantinib) on NOTCH1 and VEGFC protein expression. b-d. MIR503HG expression was measured by qRT-PCR in pRCC cells respectively treated with Everolimus (b), Cabozantinib, Lenvatinib and Axitinib (c-d). e. Dose-response curves for Everolimus in pRCC cells with or without MIR503HG knockdown. f. Western blotting assays was used to detect NOTCH1 protein expression in different treated groups. g. Orthotopic xenograft animal models were generated. Representative images of metastasis viewed by IVIS in 4 weeks after the orthotopic xenograft transplantation. h. Kaplan-Meier survival curves for 4 groups of mice were plotted. i. Representative images and quantification of tube formation for HLECs in conditioned medium from CAKI-2 or ACHN. Scale bars: 50 μm. The statistical difference was assessed through one-way ANOVA followed by Dunnett's post hoc test in b-d and followed by Tukey's post hoc test in g and i. Error bars show the standard deviation (SD) from at least three independent experiments. *P < 0.05; **P < 0.01; ***P < 0.001.
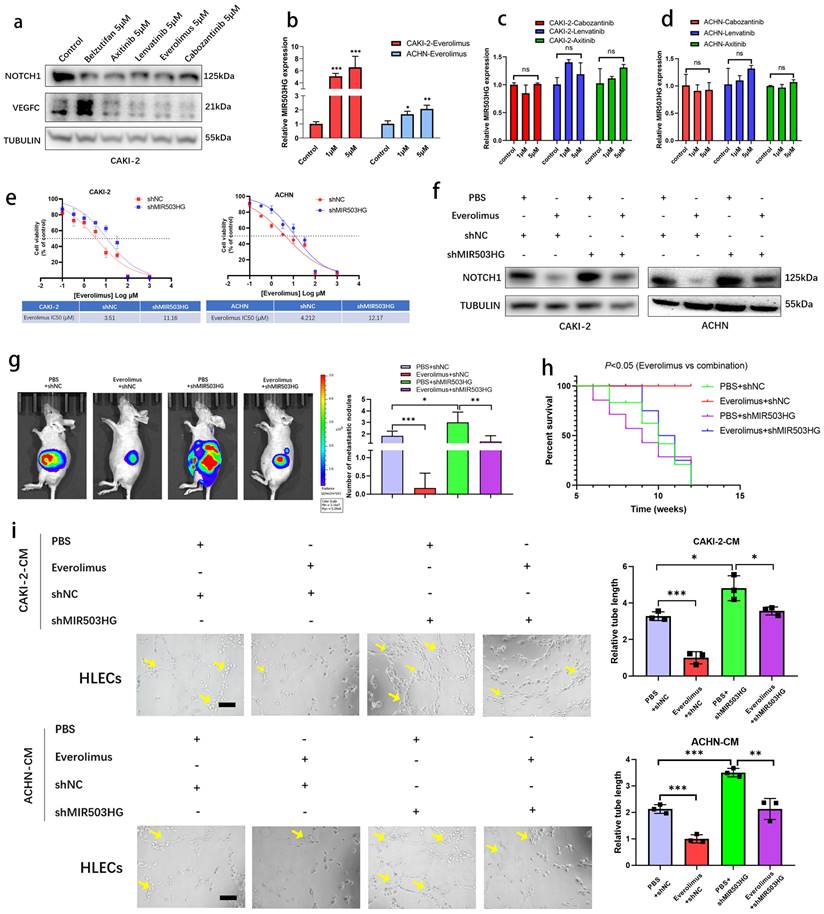
It made us wonder that whether upregulating MIR503HG could enhance the sensitivity of pRCC cells to Everolimus treatment. Compared to control pRCC cells, shMIR503HG cells showed less sensitive to Everolimus (Fig. 8e). In addition, Everolimus treatment repressed NOTCH1 expression while depletion of MIR503HG minimized this effect (Fig. 8f). The pRCC cells were implanted into subrenal capsule of nude mice, consistent to survival analysis, metastasis sites assessed by IVIS confirmed that shMIR503HG reduced the therapeutic effectiveness of Everolimus in pRCC xenografts (Fig. 8g-h). Reducing MIR503HG expression in pRCC could partially reverse the negative effect of tumor-induced lymph-vessel formation caused by Everolimus (Fig. 8i). Collectively, our results suggested that MIR503HG might be a potential biomarker for pRCC treatment.
Discussion
MIR503HG, located on chromosome Xq26.3, differentially expressed in pRCC and exhibited values of prognosis. As several studies have previously focused on its function in cancer, it generally prevented tumor cells from proliferating, encroaching and migrating [48-50]. In present study, we investigated LncRNA-MIR503HG, which was inversely correlated with cell invasion, migration and lymphangiogenesis, may have a close association with lymphatic metastasis of pRCC patients.
Emerging evidences suggested that DNA methylation-mediated epigenetic alteration is one of the key processes controlling lncRNA expression and related-biological process. Moreover, this phenomenon exhibited a tissue specificity [51-54]. By using bioinformatic data mining, MSP-PCR and Bisulfite sequencing, we confirmed the hypermethylation status in MIR503HG promoter. Subsequently, MIR503HG expression was proved to be negatively linked with methylation status.
In our study, we observed that MIR503HG was involved in the cellular regulation by epigenetically inducing lymphangiogenesis and invasion of pRCC by increasing H3K27me3 via H2A.Z. Yuan et al. reported that lncRNAs may function by binding with H2A.Z in cancer cells [29], the interaction was proved to regulate the acetylation of H2A.Z. Our study proposed that MIR503HG might have an effect on the formation of H2A.Z-H3K27me3 complex with targeted DNA sequences. Dynamic regulation of H2A.Z in chromatin has been implicated in transcription process [55], it was reported to facilitate the recruitment of PRC2 for appropriate installation of H3K27 trimethylation at promoters of genes controlling cell development [56]. However, due to the lack of detailed structure of H2A.Z protein itself, the mechanisms through which potential DNA-binding domains to target sites across the chromatin were still unclear.
VEGFC, as a lymphatic vessel-specific growth factor, has been demonstrated that it played essential role in lymphatic metastasis, including compromising the endothelial lymphatic barrier, allowing for lymphatic invasion, and ultimately promoting lymphatic metastasis and causing treatment failure [57-59]. Interdicting the VEGFC/VEGFR-3 axis has been widely reported to reduce the rate of lymphatic metastasis in a number of tumor-bearing experimental invivo models [60-62]. Our results enhanced mechanistic understandings about pRCC-lymphatic metastasis, suggesting blockage of VEGFC reversed the effect of downregulated MIR503HG on lymphatic metastasis.
It's well-acknowledged that disorders of m6A modification in RNA are closely related to the development of solid tumor [63]. Jin et al. demonstrated that HNRNPC, as known as a m6A “readers”, could mature DDX58 transcript by binding to m6A sites [64]. It was also found that HNRNPC interacted with lncRNA CYTOR, and stabilized ZEB1 mRNAs by inhibiting nondegradative ubiquitination [65]. However, its specific mechanism in pRCC has not been elucidated. We showed that downregulated MIR503HG could promote lymphatic metastasis by inducing HNRNPC. Moreover, HNRNPC was able to regulate downstream signal transduction through the N6-methylation of NOTCH1, which further promotes the secretion of VEGFC in pRCC cells. Our findings would provide a new perspective on the regulation of m6A modification in lymphatic metastasis.
There is no consensus among clinicians regarding which drug was the optimal treatment option for pRCC-associated lymphatic metastasis. Indeed, previous research has reported that the activation of mTOR was a widespread event in clinical samples of invading locoregional LN [66]. In prostate cancer, increasing p-mTOR expression was demonstrated that has positive correlations with lymphangiogenesis and lymphatic metastasis [67]. Specifically, AKT/mTOR signaling pathway acted as a critical role of promoting lymphatic metastasis in cervical cancer and medullary thyroid carcinoma [68, 69]. However, further works remain to be done to define precisely how mTOR inhibitors acts in lymphatic metastasis of pRCC.
TKIs and mTORs are most common therapeutic options among the several classes of available treatments. Everolimus, as a classic mTOR inhibitor, is recommended as a second-line treatment for metastatic RCC patients previously received at least one TKI. On the pRCC front, however, there is little research evidence of everolimus treatment.
As a single-arm phase II trial with everolimus in previously untreated pRCC, the RAPTOR trial has generally received limited attention, this trial enrolled totally 88 patients in its intention-to-treat (ITT) cohort [70]. Despite a very low response rate (1%), an OS of 21.4 months (95% CI, 15.4-28.4) were noteworthy. A large percentage of patients (65%) in this trial showed stable disease (SD) as a best response. As results of RAPTOR, mTOR inhibition will be a primary tactic in pRCC.
The effectiveness of doublet therapy was then discussed in light of single-agent targeted therapy's success in non-ccRCC. Hence, more possible strategies need to carry on to countering resistance mechanisms. Hutson. et al. assessed the regimen in nccRCC based on the efficacy of lenvatinib with everolimus after one line of VEGF-directed therapy [71], which means combinations may improve the treatment effectiveness of pRCC.
It's well known that ccRCC derived great benefit from VEGFR-associated multi-targeted TKIs, such as sunitinib, pazopanib, axitinib. According to our results, however, TKIs did not have any impact on MIR503HG expression level in PRCC. In our opinion, its mechanism may by realized not by directly regulating MIR503HG, but by other indirect signals. MIR503HG interacts with signaling pathways, such as inhibiting the phosphorylated proteins of RAF, MEK, ERK1/2, PI3K and AKT [72]. In view of PI3K inhibitors were determined that could reverse TKIs resistance in tumor [73], and activated AKT promoting TKIs resistance in RCC [74], we speculate that MIR503HG-KO cells will be more sensitive to those TKIs than control cells.
Based on our work, we confirmed that inducing MIR503HG may have therapeutic benefit for sensitizing Everolimus treatment on pRCC and its associated lymphatic metastasis. This finding might become a unique therapeutic approach for us to suppress pRCC.
Materials and Methods
Clinical data and specimens
67 RNA later-preserved pRCC specimens were collected from pRCC patients underwent radical nephrectomy at Renji Hospital (Shanghai, China) between June 2013 and July 2020. The clinicopathological characteristics were summarized in detail (Table 5). After surgery, clinical samples, including tumor and adjacent normal tissue were immediately snap-frozen in liquid nitrogen and stored in cryogenic refrigerator at -80 °C. Formalin-fixed and paraffin-embedded (FFPE) tumor tissues were obtained and histologically confirmed by three pathologists.
Correlation between MIR503HG expression and clinicopathologic characteristics in pRCC patients.
| Product | Source | No. of Catalogue |
|---|---|---|
| Primary antibody: | ||
| Western blot: | ||
| anti-β-TUBULIN | Cell Signaling Technology | #2146 |
| anti-NOTCH1 | Abcam | ab52627 |
| anti-VEGFC | Cell Signaling Technology | #2445 |
| anti-H2A.Z | Abcam | ab150402 |
| anti-YTHDC1 | Abcam | ab259990 |
| anti-HNRNPC | Proteintech | 11760-1-AP |
| Anti-LAMIN B1 | Abcam | ab16048 |
| IF: | ||
| anti-H2A.Z | Abcam | ab150402 |
| IP: | ||
| anti-H2A.Z | Abcam | ab150402 |
| anti-m6A | Abcam | ab284130 |
| anti-H3K27ME3 | Abcam | ab192985 |
| Anti-HNRNPC | Proteintech | 11760-1-AP |
| IHC: | ||
| anti-LYVE-1 | Abcam | ab218535 |
| Secondary antibody: | ||
| Western blot: | ||
| anti-rabbit IgG-HRP | Cell Signaling Technology | 7074 |
| anti-mouse IgG-HRP | Cell Signaling Technology | 7076 |
| IHC: | ||
| anti-rabbit IgG-HRP | Proteintech | SA00001-2 |
| anti-mouse IgG-HRP | Proteintech | SA00001-1 |
| IF: | ||
| anti-rabbit IgG-HRP | Panovue Biological | 0015001010 |
Abbreviations: T stage = tumor stage. † Chi-square test, * p <0.05, ** p <0.01
Cell culture
Cell lines involved in this study were all purchased from American Type Culture Collection (ATCC, Manassas, USA). ACHN and CAKI-2 cells were respectively cultured in Minimum Essential Medium (MEM) and McCoy's 5A media. Both of media were supplemented with 10% fetal bovine serum (FBS) (Gibco, Shanghai, China). HLECs were cultured in endothelial cell medium with 5% FBS and 1% matched growth factor (ScienCell, CA, USA). A humidified incubator was used for keeping cell lines mentioned above in the condition at 37°C with 5% CO2.
RNA pull-down assays
Briefly, according to the manufacturer's instructions, biotinylated MIR503HG and antisense sequences were pulldown of proteins by using Magnetic RNA-Protein Pull-Down kit (Thermo Fisher Scientific, USA). RNAs were transcribed in vitro transcription with T7 and SP6 RNA Polymerase and the purified transcribed biotinylated RNAs were conjugated with magnetic beads, the conjugation was next incubated with prepared lysates at 4 °C for 24h. Beads were washed briefly to get proteins, protein products were detected by Mass spectrometry and western blotting subsequently.
RNA immunoprecipitation (RIP) assays
RIP assays were performed to identify the RNA-binding protein by using a MagnaRIP RNA-Binding Protein Immunoprecipitation Kit (Millipore, USA) according to the manufacturer's protocols. The corresponding pRCC cells lysates were immunoprecipitated with magnetic beads conjugated with anti-H2A.Z antibody or negative control (anti-IgG) at 4 °C overnight. Phenol-chloroform was used to extract the precipitated RNAs. Finally, the eluted RNA was analyzed by qRT-PCR.
Chromatin immunoprecipitation (ChIP) assays
ChIP assay was performed with EZ-Magna ChIP A/G (17-10086, Millipore, MA, USA) according to the manufacturer's protocol. The enrichment of the H3K27me3, H2A.Z on the promoter region of NOTCH1 was determined by using anti-H3K27me3 and anti-H2A.Z (Abcam, USA). As a negative control, normal mouse IgG were also used for immunoprecipitation. ChIP-derived DNA would be quantified using real-time qPCR analysis.
Tube formation assay
The pRCC cells were previously cultured for 24 h. The conditioned medium was then collected from different groups. HLECs were resuspended in collected conditioned medium and cultured for 12h in 96-well plates (IBIDI, German) placed with 10 μl Matrigel (BD Biosciences, USA). Using inverted fluorescence microscopy to observe tube formation, the formed lymphatic vessels were analyzed and counted by Image J software (NIH, USA).
Immunofluorescence (IF) staining
Cells were cultured on glass cover slips, and IF analysis was then performed as follow: pRCC cells were fixed with 4% formaldehyde for 10 min, and permeabilized with prepared 0.5% Triton X-100 for 15 min at room temperature. Blocked in blocking buffer (TBS with 0.05% tween 20) containing 10% goat serum and 1% BSA for 2 h at 25°C. The slides were then incubated with primary antibody at 4°C overnight, and then subjected to the corresponding secondary antibody incubation for 1h. After incubation, three washes with PBS were performed. Nuclei were stained with 4′,6-diamidino-2-phenylindole for 10-15 min. Images were taken with confocal microscopy (Leica Microsystems, Wetzlar, Germany). All antibodies used were listed in Table 6.
Antibodies used in the experiments.
| Product | Source | No. of Catalogue |
|---|---|---|
| Primary antibody: | ||
| Western blot: | ||
| anti-β-TUBULIN | Cell Signaling Technology | #2146 |
| anti-NOTCH1 | Abcam | ab52627 |
| anti-VEGFC | Cell Signaling Technology | #2445 |
| anti-H2A.Z | Abcam | ab150402 |
| anti-YTHDC1 | Abcam | ab259990 |
| anti-HNRNPC | Proteintech | 11760-1-AP |
| Anti-LAMIN B1 | Abcam | ab16048 |
| IF: | ||
| anti-H2A.Z | Abcam | ab150402 |
| IP: | ||
| anti-H2A.Z | Abcam | ab150402 |
| anti-m6A | Abcam | ab284130 |
| anti-H3K27ME3 | Abcam | ab192985 |
| Anti-HNRNPC | Proteintech | 11760-1-AP |
| IHC: | ||
| anti-LYVE-1 | Abcam | ab218535 |
| Secondary antibody: | ||
| Western blot: | ||
| anti-rabbit IgG-HRP | Cell Signaling Technology | 7074 |
| anti-mouse IgG-HRP | Cell Signaling Technology | 7076 |
| IHC: | ||
| anti-rabbit IgG-HRP | Proteintech | SA00001-2 |
| anti-mouse IgG-HRP | Proteintech | SA00001-1 |
| IF: | ||
| anti-rabbit IgG-HRP | Panovue Biological | 0015001010 |
RNA extraction and qRT-PCR assay
Extractions of total RNA from samples were conducted through the TRIZOL Reagent (Life Technologies). Under manufacturers' instructions, RNA was reversely transcribed into cDNA with Color Reverse Transcription Mix (EZBioscience), which was further quantified by qPCR assays to determinate the relative expression level of target gene with Color SYBR Green qPCR Master Mix (EZBioscience). And 2-∆CT method was conducted to evaluate the relative expression among genes. GAPDH were determined as internal control. All the primers used were listed in Table 7.
Primers and probes used in the experiments.
| Gene | Sequence (5'-3') | Application |
|---|---|---|
| MIR503HG | F: CCCCCAACAAAGGAACACTA R: ACTTGGGTGGTTTTCAATGC | qRT-PCR |
| AC006126.4 | F: TTCAGGGCTGGAGGAAGAAG R: GGAGGCCAAAATCTGCTGAG | qRT-PCR |
| RP11-334E6.12.1 | F: CAGCGAAGCGGGGGCAGGG R: GGCCTTGGGGCATGACCCAG | qRT-PCR |
| NOTCH1 | F: ATGCAGAACAACAGGGAGGA R: ACCAGGTTGTACTCGTCCAG | qRT-PCR |
| NOTCH2 | F: TTGTGACATAGCAGCCTCCA R: CATTCTGGCAGGGCTGATTC | qRT-PCR |
| NOTCH3 | F: TTGTGACATAGCAGCCTCCA R: CATTCTGGCAGGGCTGATTC | qRT-PCR |
| NOTCH4 | F: TGTGAGAAAGGCTGCAACAC R: GGGCTGCTCTCTCCTGATAG | qRT-PCR |
| JAGGED1 | F: CCGAGGTCCTATACGTTGCT R: CCAGCCTTCCATGCAAGTTT | qRT-PCR |
| JAGGED2 | F: CAACCCCTGTGTGAATGGTG R: ATTGTAGCAAGGCAGAGGGT | qRT-PCR |
| DLL1 | F: CAGAAAGACTCATCAGCCGC R: CAGCCCTCTCCGTAGTAGTG | qRT-PCR |
| U1 | F: TGAAGGCGCTTTTCTCATGG R: CAGGGGAAAGCACGAACG | qRT-PCR |
| WNT9A | F: CCTCTATGCCATCTCCTCGG R: TTCCTTGACGAACTTGCTGC | qRT-PCR |
| WNT5A | F: TCCTCCGTGTTGTGATGTGA R: GATACGCTGCAACACCTCTG | qRT-PCR |
| WNT3A | F: GGACAAAGCTACCAGGGAGT R: ACCATCCCACCAAACTCGAT R: AGAAGGTGACAAGAGGCTCC | qRT-PCR |
| FZD5 | F: TAGCGGTTTTGTGTTCAGCC R: TGCCATCTCACCAGCCTAAA R: AGAAGGTGACAAGAGGCTCC | qRT-PCR |
| RNF43 | F: AGTGGGGAGACTAGCACCTA R: ATGAATCGGAGCCTAGCCTC R: AGAAGGTGACAAGAGGCTCC | qRT-PCR |
| ZNRF3 | F: TCTGAAGACCCGCTCAAGAG R: GAGACCACGACGAAGAAAGC R: AGAAGGTGACAAGAGGCTCC | qRT-PCR |
| ACTB | F: TGGCACCACACCTTCTACAA R: CCAGAGGCGTACAGGGATAG | qRT-PCR |
| GAPDH | F: CATGAGAAGTATGACAACAGCC R: AGTCCTTCCACGATACCAAAGT R: AGTCCTTCCACGATACCAAAGT | qRT-PCR |
| SUFU | F: GGCTGATAACTGACATGCGG R: GTGGAAGGACAGGTTTGCTG | qRT-PCR |
| SMO | F: TCCTCACTGTGGCAATCCTT R: GGCAGCTGAAGGTAATGAGC | qRT-PCR |
| SHH | F: ATGAAGAAAACACCGGAGCG R: GCAGTGGATATGTGCCTTGG | qRT-PCR |
| DHH | F: TTCCGGGAAATGCAACTGTG R: TCCACAGCCACAAATGAAGC | qRT-PCR |
| IHH | F: CTCGCCTACAAGCAGTTCAG R: CCTGTGTTCTCCTCGTCCTT | qRT-PCR |
| TGF-β1 | F: CTTTCCTGCTTCTCATGGCC R: TCCAGGCTCCAAATGTAGGG | qRT-PCR |
| TGF-β2 | F: CCTTCTTCCCCTCCGAAACT R: ATGGCATCAAGGTACCCACA | qRT-PCR |
| TGF-β3 | F: AGATCCTTCGGCCAGATGAG R: GTCATCCTCATTGTCCACGC | qRT-PCR |
| BMP2 | F: AATGCAAGCAGGTGGGAAAG R: GCTGTGTTCATCTTGGTGCA | qRT-PCR |
| BMP6 | F: AGAAGAAGGCTGGCTGGAAT R: GACTCCATCCCTTGTCACCA | qRT-PCR |
| SMAD2 | F: CTTTGTGCAGAGCCCCAATT R: CTTGTTACCGTCTGCCTTCG | qRT-PCR |
| SMAD3 | F: GCAGAACGTCAACACCAAGT R: CGAACTCACACAGCTCCATG | qRT-PCR |
| MST1 | F: CCAGGGACCAAGTGTGAGAT R: GTTGTGGGTAAAGCAGGCAA F | qRT-PCR |
| MST2 | F: GGCAAGCTGACACATCGATT R: GCGTTCGCAACTGTGTAGAT | qRT-PCR |
| YAP1 | F: CACAGCTCAGCATCTTCGAC R: TATTCTGCTGCACTGGTGGA F | qRT-PCR |
| YAP2 | F: TCCACCAGTGCAGCAGAATA R: CACTGGAGCACTCTGACTGA | qRT-PCR |
| TEAD3 | F: FGCAAGATGTACGGCCGAAAT R: GGTGGGCTGAACTTGTTCTG | qRT-PCR |
| TEAD4 | F: GTCTCAGGGTTTTGGCAAGG R: CAGGAAGGCAGAGAACTCCA | qRT-PCR |
| NOTCH1-P1 | F: AACGAGAAGTAGTCCCAGGC R: TCCCTCAGAGCATAGCAGC | ChIP |
| NOTCH1-P2 | F: GGATGTCTGGCGGCGATC R: GGCGACTGAAATTTGCATGTG | ChIP |
| NOTCH1-P3 | F: GACCCGTTTGTGCTTTCTGG R: CGAGCACTTGACCGCGAG | ChIP |
| NOTCH1-P4 | F: ATCGCACTCACCACCCTG R: TAAGCGCCAGGAGTCCAAAA | ChIP |
| NOTCH1-P5 | F: GGTGTGAGATTTGTCCTGC R: CGAAAGGCTGGGAGGGAC | ChIP |
| si-MIR503HG | sense GACAAGAACUAAAGUGGAATT antisense UUCCACUUUAGUUCUUGUCTT | si-RNA |
| si-MIR503HG#2 | sense CACUCAGUGUAAUAUUAUATT antisense UAUAAUAUUACACUGAGUGTT | si-RNA |
| si-MIR503HG#3 | sense CAGAAGACUCCUGUUUCAATT antisense UUGAAACAGGAGUCUUCUGTT | si-RNA |
| si-AC006126.4 | sense GAAGAAUCUGGGAGUGUCATT antisense UGACACUCCCAGAUUCUUCTT | si-RNA |
| si-AC006126.4#2 | sense CCCUGAGGUCCUCUCGGAATT antisense UUCCGAGAGGACCUCAGGGTT | si-RNA |
| si-AC006126.4#3 | sense GAUACGCAGGAGCUCAGCATT antisense UGCUGAGCUCCUGCGUAUCTT | si-RNA |
| si-RP11-334E6.12.1 | sense GGUCAAACCUGCAUCUUCATT antisense UGAAGAUGCAGGUUUGACCTT | si-RNA |
| si-RP11-334E6.12.1#2 | sense GCUGGAGAUGCUCAGUUCUTT antisense AGAACUGAGCAUCUCCAGCTT | si-RNA |
| si-RP11-334E6.12.1#3 | sense GGAGUGCUGUCAGGACAGATT antisense UCUGUCCUGACAGCACUCCTT | si-RNA |
| Mature mRNA of NOTCH1 | F: TGTGCACTGTGAGATCAACG R: TCGCAGGGATTGGACAGG | qRT-PCR |
| Pre-mRNA of NOTCH1 | F: TCAACGCCGTAGATGACCTG R: CCGTTCTTCAGGAGCACAAC 5'-DIG labeled and 3'-DIG labeled | qRT-PCR |
Methylation-specific PCR (MSP-PCR)
Genomic DNA was extracted and analyzed from pRCC tissue and paired adjacent normal tissues. The MSP primers were designed from MethPrimer 2.0. purified DNA was exposed to bisulfite with a Bisulfte Conversion Kit (Tiangen, China) according to the manufacturer's protocol. After modified DNA is eluted, a nested, two-stage PCR method were followed to conduct the methylation-specific PCR. Amplified PCR products were identified by agarose gel electrophoresis (1.5%) and visualized with GelRed.
Bisulfite genomic sequencing (BGS)
Methylated CpG sites distribution was analyzed in MIR503HG via BGS. Genomic DNA was firstly extracted from frozen pRCC samples and paired adjacent normal tissues. According to the manufacturer's protocol of Epitect Fast Bisulfite Conversion Kits (Qiagen, Germany), genomic DNA was bisulfite modified. methylated cytosine residues were retained as cytosine, wheras the unmethylated cytosine residues were converted to thymine at original sites. BGS assay was then performed to detect the distribution of methylated CpG sites of MIR503HG in each specimen.
The CpG islands of MIR503HG promoter region were predicted by MethPrimer 2.0 (http://www.urogene.org/cgi-bin/methprimer/methprimer.cgi) and EMBOSS database (http://emboss.bioinformatics.nl/cgi-bin/emboss/cpgplot) and 13 CpG sites were selected from MEXPRESS (https://mexpress.be/).
Model of in vivo metastasis
4-to-6-week BALB/c nude mice were housed and fed under specific pathogen-free conditions. Luciferase stable expressing cells (1 × 10⁶ cells per mouse, mixed with Matrigel, 1:1) were injected orthotopically into capsule of left kidney.
We used bioluminecent imaging system (NightOWL II, LB983, Berthold Technologies, Germany) to monitor the primary tumor and potential metastases after abdominal injection of D-Luciferin at different time points (4, 8 and 12 weeks). Animal experiments were in accordance with guidelines of Renji Hospital for the use of animal in cancer research.
Patient derived xenograft model
Fresh pRCC samples obtained from two patients underwent surgery at Renji Hospital were implanted into the left flank as subcutaneous tumor in four-week-old anaesthetized immune deficient mice. All mice were observed for maximum 120 days and the tumors from PDXs were analyzed by HE&IHC and qRT-PCR. Animal experiments were in accordance with guidelines of Renji Hospital for the use of animal in cancer research.
CRISPR-Cas9-mediated gene deletion
The lentiCRISPR vectors containing single-guide RNAs targeting HNRNPC were designed by Beyotime. Following the instruction, sgRNAs were transfected into pRCC cells (CAKI-2 and ACHN) in order to construct HNRNPC knockout (KO) pRCC cells. The efficiency of sgRNA were evaluated by qRT-PCR and western blotting.
Further applied methods
Immunohistochemistry (IHC), in situ hybridization (ISH) analysis, subcellular fractionation assays, dual-luciferase reporter assays, enzyme-linked immunosorbent assay (ELISA), lentivirus infection and cell transfection, transwell assays and wound-healing assays were provide in Supplemental Methods.
Bioinformatics and statistical analysis
The clinical association of MIR503HG in pRCC was revealed through GEPIA database (http://gepia.cancer-pku.cn/index.html). R language (version 4.0.0, https://www.R-project.org) was used for graphic plotting with following packages: ggplot2, Complex Heatmap, and maftools. Kaplan-Meier analysis was carried out and log-rank analysis evaluate the survival rate of pRCC patients. All date performed at least in triplicate were presented as mean ± standard deviation. One-way ANOVA was used for data comparison when comparing 3 or more experimental groups, with Dunnett's post hoc test for comparing all the groups against the same control group, or Tukey's post hoc test or least significant difference for multiple comparisons with the same n in all groups. Differences among two experimental groups (numeric variables) were evaluated unpaired Student's t-test. Categorical variables were compared by Chi-square (χ2) test or Fisher's exact test. All tests were two-tailed and significant values were set at *P < 0.05, **P < 0.01, ***P < 0.001.
Conclusion
Summarily, we propose a model that downregulated lncRNA MIR503HG promotes lymphatic metastasis through two pathways: influencing the histone modifications to alter the gene expression of NOTCH1 and upregulating HNRNPC to maturate NOTCH1 mRNA. Additionally, MIR503HG may enable us to suppress pRCC-associated lymphatic metastasis, targeting this newly identified signal pathway is worthwhile in clinic.
Abbreviations
GEPIA: Gene Expression Profiling Interactive Analysis; GAPDH: glyceraldehyde-3 phosphate dehydrogenase; VEGFC: vascular endothelial growth factor C; RCC: renal cell carcinoma; pRCC: papillary renal cell carcinoma; LN: lymph node; KIRP: kidney renal papillary carcinoma; KIRC: kidney renal clear cell carcinoma; KICH: kidney chromophobe; CCLE: Cancer Cell Line Encyclopedia; CPG: cytosine-guanine; FFPE: formalin fixed paraffin-embedded; PDX: patient derived xenograft; HLEC: human lymphatic endothelial cell; m6A: N(6)-methylation of adenosine; HNRNPC: heterogeneous nuclear ribonucleoprotein C; IVIS: In-Vivo Imaging System; TKI: tyrosine kinase inhibitors.
Supplementary Material
Supplementary methods, figures and table.
Acknowledgements
This work was financially supported by the Natural Science Foundation (grant numbers 81972369, 82173214), Clinical Research Incubation Project of Renji Hospital (RJPY-DZX-004, PYIII20-15), The Young Scholar of Cheung Kong Scholars Program (2022) and the innovative research team of high-level local universities in Shanghai, Hospital-pharma Integration Project on Innovative Achievement Translation (SHDC2022CRD022), Standardized Management Research Project of Shenkang Hospital Development Center (SHDC22021202). Experiments were performed following the Good Clinical Practice and the Declaration of Helsinki under protocols approved by the Ethics Borad of Renji Hospital (KY2022-185-B).
Author contributions
Yiqiu Wang: Conceptualization, Methodology, Validation, Visualization, Formal analysis, Investigation, Writing-original draft. Wei Zhai and Wei Xue: Conceptualization, Resources. Xinyi Zheng and Wenjie Huang: Methodology, Visualization, Software. Jiayi Lu and Junjie Ma: Validation, Investigation. Naiqiao Hou and Jiabao Qi: Data curation. Junhua Zheng and Wei Zhai: Investigation, Writing-review & editing, Funding acquisition.
Data Availability Statement
All data are included in the manuscript. Raw data would be available upon request.
ORCID
Wei Zhai: orcid.org/0000-0001-6274-6404.
Competing Interests
The authors have declared that no competing interest exists.
References
1. Srigley JR, Delahunt B, Eble JN, Egevad L, Epstein JI, Grignon D. et al. The International Society of Urological Pathology (ISUP) Vancouver Classification of Renal Neoplasia. Am J Surg Pathol. 2013;37(10):1469-89
2. Patard JJ, Leray E, Rioux-Leclercq N, Cindolo L, Ficarra V, Zisman A. et al. Prognostic value of histologic subtypes in renal cell carcinoma: a multicenter experience. J Clin Oncol. 2005;23(12):2763-71
3. Choueiri TK, Motzer RJ. Systemic Therapy for Metastatic Renal-Cell Carcinoma. N Engl J Med. 2017;376(4):354-366
4. Linehan WM, Spellman PT, Ricketts CJ Creighton CJ, Fei SS, Davis C. et al. Comprehensive Molecular Characterization of Papillary Renal-Cell Carcinoma. N Engl J Med. 2016;374(2):135-45
5. Davis CF, Ricketts CJ, Wang M, Yang L, Cherniack AD, Shen H. et al. The somatic genomic landscape of chromophobe renal cell carcinoma. Cancer Cell. 2014;26(3):319-330
6. Dudani S, de Velasco G, Wells JC, Gan CL, Donskov F, Porta C. et al. Evaluation of clear cell, papillary, and chromophobe renal cell carcinoma metastasis sites and association with survival. JAMA Netw Open. 2021;4(1):e2021869
7. Karaman S, Detmar M. Mechanisms of lymphatic metastasis. J Clin Invest. 2014;124(3):922-928
8. Fernández MI, Bolenz C, Trojan L, Steidler A, Weiss C, Alken P. et al. Prognostic implications of lymphangiogenesis in muscle-invasive transitional cell carcinoma of the bladder. Eur Urol. 2008;53(3):571-578
9. Zhou M, He L, Zu X, Zhang H, Zeng H, Qi L. Lymphatic vessel density as a predictor of lymph node metastasis and its relationship with prognosis in urothelial carcinoma of the bladder. BJU Int. 2011;107(12):1930-1935
10. Tammela T, Alitalo K. Lymphangiogenesis: Molecular mechanisms and future promise. Cell. 2010;140(4):460-476
11. Vaahtomeri K, Karaman S, Makinen T, Alitalo K. Lymphangio-genesis guidance by paracrine and pericellular factors. Genes Dev. 2017;31(16):1615-1634
12. Karaman S, Detmar M. Mechanisms of lymphatic metastasis. J Clin Invest. 2014;124(3):922-928
13. Martell RE, Chiorean EG, Youssoufian H, Rutstein MD, Pytowski B, Benjamin L. et al. Phase I study of the anti-VEGFR-3 monoclonal antibody IMC-3C5in subjects with advanced solid tumors refractory to standard therapy or for which no standard therapy is available. J Clin Oncol 29: (suppl; abstr TPS150). 2011
14. Falchook GS, Goldman JW, Desai J, LeitchI M, Hong DS, Subbiah V. et al. A first-in-human phase I study of VGX-100, as elective anti-VEGF-C antibody, alone and in combination with bevacizumab in patients with advanced solid tumors. J Clin OncolNo15_suppl (May20Supplement). 2014
15. Iyer MK, Niknafs YS, Malik R, Singhal U, Sahu A, Hosono Y. et al. The landscape of long noncoding RNAs in the human transcriptome. Nat Genet. 2015;47:199-208
16. Wang KC, Yang YW, Liu B, Sanyal A, Corces-Zimmerman R, Chen Y. et al. A long noncoding RNA maintains active chromatin to coordinate homeotic gene expression. Nature. 2011;472:120-24
17. Zhao J, Wu J, Qin Y, Zhang W, Huang G, Qin L. LncRNA PVT1 induces aggressive vasculogenic mimicry formation through activating the STAT3/Slug axis and epithelial-to-mesenchymal transition in gastric cancer. Cell Oncol (Dordr). 2020;43(5):863-876
18. He H, Wu S, Ai K, Xu R, Zhong Z, Wang Y. et al. LncRNA ZNF503-AS1 acts as a tumor suppressor in bladder cancer by up-regulating Ca2+ concentration via transcription factor GATA6. Cell Oncol (Dordr). 2021;44(1):219-233
19. Sigova AA, Abraham BJ, Ji X, Molinie B, Hannett NM, Guo YE. et al. Transcription factor trapping by RNA in gene regulatory elements. Science. 2015;350:978-81
20. He W, Zhong G, Jiang N, Wang B, Fan X, Chen C. et al. Long noncoding RNA BLACAT2 promotes bladder cancer-associated lymphangiogenesis and lymphatic metastasis. J Clin Invest. 2018;128(2):861-875
21. Chen C, Luo Y, He W, Zhao Y, Kong Y, Liu H. et al. Exosomal long noncoding RNA LNMAT2 promotes lymphatic metastasis in bladder cancer. J Clin Invest. 2020;130(1):404-421
22. Chen C, Shen N, Chen Y, Jiang P, Sun W, Wang Q. et al. LncCCLM inhibits lymphatic metastasis of cervical cancer by promoting STAU1-mediated IGF-1 mRNA degradation. Cancer Lett. 2021;518:169-179
23. Wang H, Liang L, Dong Q, Huan L, He J, Li B. et al. Long noncoding RNA miR503HG, a prognostic indicator, inhibits tumor metastasis by regulating the HNRNPA2B1/NF-κB pathway in hepatocellular carcinoma. Theranostics. 2018;8(10):2814-2829
24. Xu S, Zhai S, Du T, Li Z. LncRNA MIR503HG Inhibits Non-Small Cell Lung Cancer Cell Proliferation by Inducing Cell Cycle Arrest Through the Downregulation of Cyclin D1. Cancer Manag Res. 2020;12:1641-1647
25. Brodziak A, Sobczuk P, Bartnik E, Fiedorowicz M, Porta C, Szczylik C. et al. Drug resistance in papillary RCC: from putative mechanisms to clinical practicalities. Nat Rev Urol. 2019;16(11):655-673
26. Brodaczewska KK, Szczylik C, Fiedorowicz M, Porta C, Czarnecka AM. Choosing the right cell line for renal cell cancer research. Mol Cancer. 2016;15(1):83
27. Sun Z, Bernstein E. Histone variant macroH2A: from chromatin deposition to molecular function. Essays Biochem. 2019;63:59-74
28. Song F, Chen P, Sun D, Wang M, Dong L, Liang D. et al. Cryo-EM study of the chromatin fiber reveals a double helix twisted by tetranucleosomal units. Science. 2014;344:376-80
29. Yuan Y, Cao W, Zhou H, Qian H, Wang H. H2A.Z acetylation by lincZNF337-AS1 via KAT5 implicated in the transcriptional misregulation in cancer signaling pathway in hepatocellular carcinoma. Cell Death Dis. 2021Jun12;12(6):609
30. Yap KL, Li S, Muñoz-Cabello AM, Raguz S, Zeng L, Mujtaba S. et al. Molecular interplay of the noncoding RNA ANRIL and methylated histone H3 lysine 27 by polycomb CBX7 in transcriptional silencing of INK4a. Mol Cell. 2010;38:662-74
31. Melé M, Mattioli K, Mallard W, Shechner DM, Gerhardinger C, Rinn JL. Chromatin environment, transcriptional regulation, and splicing distinguish lincRNAs and mRNAs. Genome Res. 2017;27:27-37
32. Wang Y, Long H, Yu J, Dong L, Wassef M, Zhuo B. et al. Histone variants H2A.Z and H3.3 coordinately regulate PRC2-dependent H3K27me3 deposition and gene expression regulation in mES cells. BMC Biol. 2018;16(1):107
33. Voce DJ, Bernal GM, Wu L, Crawley CD, Zhang W, Mansour NM. et al. Temozolomide treatment induces lncRNA MALAT1 in an NF-kappaB and p53 co-dependent manner in glioblastoma. Cancer Res. 2019;79(10):2536-2548
34. Wu J, Zhu P, Lu T, Du Y, Wang Y, He L. et al. The long non-coding RNA LncHDAC2 drives the self-renewal of liver cancer stem cells via activation of hedgehog signaling. J Hepatol. 2019;70(5):918-929
35. Hu G, Ma J, Zhang J, Chen Y, Liu H, Huang Y. et al. Hypoxia-induced lncHILAR promotes renal cancer metastasis via ceRNA for the miR-613/206/ 1-1-3p/Jagged-1/Notch/CXCR4 signaling pathway. Mol Ther. 2021;29(10):2979-2994
36. Li S, Huang C, Hu G, Ma J, Chen Y, Zhang J. et al. Tumor-educated B cells promote renal cancer metastasis via inducing the IL-1β/HIF-2α/Notch1 signals. Cell Death Dis. 2020;11(3):163
37. Hu L, Zang MD, Wang HX, Li JF, Su LP, Yan M. et al. Biglycan stimulates VEGF expression in endothelial cells by activating the TLR signaling pathway. Mol Oncol. 2016;10(9):1473-1484
38. Li D, Wei Y, Wang D, Gao H, Liu K. MicroRNA-26b suppresses the metastasis of non-small cell lung cancer by targeting MIEN1 via NF-κB/MMP-9/VEGF pathways. Biochem Biophys Res Commun. 2016;472(3):465-70
39. Zang M, Hu L, Zhang B, Zhu Z, Li J, Zhu Z. et al. Luteolin suppresses angiogenesis and vasculogenic mimicry formation through inhibiting Notch1-VEGF signaling in gastric cancer. Biochem Biophys Res Commun. 2017;490(3):913-919
40. Astudillo L, Da Silva TG, Wang Z, Han X, Jin K, VanWye J. et al. The Small Molecule IMR-1 Inhibits the Notch Transcriptional Activation Complex to Suppress Tumorigenesis. Cancer Res. 2016;76(12):3593-603
41. Huang H, Weng H, Chen J. mA modification in coding and non-coding RNAs: roles and therapeutic implications in cancer. Cancer Cell. 2020;37(3):270-288
42. Fischl H, Neve J, Wang Z, Patel R, Louey A, Tian B. et al. hnRNPC regulates cancer-specific alternative cleavage and polyadenylation profiles. Nucleic Acids Res. 2019;47(14):7580-7591
43. Huang XT, Li JH, Zhu XX, Huang CS, Gao ZX, Xu QC. et al. HNRNPC impedes m6A-dependent anti-metastatic alternative splicing events in pancreatic ductal adenocarcinoma. Cancer Lett. 2021;518:196-206
44. Bi Z, Liu Y, Zhao Y, Yao Y, Wu R, Liu Q. et al. A dynamic reversible RNA N6 -methyladenosine modification: current status and perspectives. J Cell Physiol. 2019;234(6):7948-7956
45. Zhai W, Sun Y, Guo C, Hu G, Wang M, Zheng J. et al. LncRNA-SARCC suppresses renal cell carcinoma (RCC) progression via altering the androgen receptor (AR) /miRNA-143-3p signals. Cell Death Differ. 2017;24(9):1502-1517
46. Zhai W, Sun Y, Jiang M, Wang M, Gasiewicz TA, Zheng J. et al. Differential regulation of LncRNA-SARCC suppresses VHL-mutant RCC cell proliferation yet promotes VHL-normal RCC cell proliferation via modulating androgen receptor/HIF-2α/C-MYC axis under hypoxia. Oncogene. 2016;35(37):4866-80
47. Ekshyyan O, Anandharaj A, Nathan C.-A. O. Dual PI3K/mTOR Inhibitors: Does P53 Modulate Response? Clin. Cancer Res. 2013 19, 3719-3721
48. Qiu F, Zhang MR, Zhou Z, Pu JX, Zhao XJ. LncRNA MIR503HG functioned as a tumor suppressor and inhibited cell proliferation, metastasis and epithelial-mesenchymal transition in bladder cancer. J Cell Biochem. 2019;120:10821-10829
49. Fu J, Dong G, Shi H, Zhang J, Ning Z, Bao X. et al. LncRNA MIR503HG inhibits cell migration and invasion via mir-103/olfm4 axis in triple negative breast cancer. J Cell Mol Med. 2019;23:4738-4745
50. Chuo D, Liu F, Chen Y, Yin M. LncRNA MIR503HG is downregulated in han chinese with colorectal cancer and inhibits cell migration and invasion mediated by tgf-beta2. Gene. 2019 713
51. Lu C, Wei Y, Wang X, Zhang Z, Yin J, Li W. et al. DNA-methylation-mediated activating of lncRNA SNHG12 promotes temozolomide resistance in glioblastoma. Mol Cancer. 2020;19(1):28
52. Wang B, Zhao L, Chi W, Cao H, Cui W, Meng W. Aberrant methylation-mediated downregulation of lncRNA SSTR5-AS1 promotes progression and metastasis of laryngeal squamous cell carcinoma. Epigenetics Chromatin. 2019;12(1):35
53. Amin V, Harris RA, Onuchic V, Jackson AR, Charnecki T, Paithankar S. et al. Epigenomic footprints across 111 reference epigenomes reveal tissue-specific epigenetic regulation of lincRNAs. Nat Commun. 2015;6:6370
54. Wang Z, Yang B, Zhang M, Guo W, Wu Z, Wang Y. et al. lncRNA Epigenetic Landscape Analysis Identifies EPIC1 as an Oncogenic lncRNA that Interacts with MYC and Promotes Cell-Cycle Progression in Cancer. Cancer Cell. 2018;33(4):706-720
55. Ping Chen, Yan Wang, Guohong Li. Dynamics of histone variant H3.3 and its coregulation with H2A.Z at enhancers and promoters. Nucleus. 2014;5:1 21-27
56. Banaszynski LA, Wen D, Dewell S, Whitcomb SJ, Lin M, Diaz N. et al. Hira-dependent histone H3.3 deposition facilitates PRC2 recruitment at developmental loci in ES cells. Cell. 2013;155:107-20
57. Tacconi C, Correale C, Gandelli A, Spinelli A, Dejana E, D'Alessio S. et al. Vascular endothelial growth factor C disrupts the endothelial lymphatic barrier to promote colorectal cancer invasion. Gastroenterology. 2015;148(7):1438-51 e8
58. Breslin JW, Yuan SY, Wu MH. VEGF-C alters barrier function of cultured lymphatic endothelial cells through a VEGFR-3-dependent mechanism. Lymphat Res Biol. 2007;5(2):105-113
59. Dufies M, Giuliano S, Ambrosetti D, Claren A, Ndiaye PD, Mastri M. et al. Sunitinib stimulates expression of VEGFC by tumor cells and promotes lymph-angiogenesis in clear cell renal cell carcinomas. Cancer Res. 2017;77(5):1212-1226
60. Chen Y, Jiang L, She F, Tang N, Wang X, Li X. et al. Vascular endothelial growth factor-C promotes the growth and invasion of gallbladder cancer via an autocrine mechanism. Mol Cell Biochem. 2010;345(1-2):77-89
61. Pytowski B, Goldman J, Persaud K, Wu Y, Witte L, Hicklin DJ. et al. Complete and specific inhibition of adult lymphatic regeneration by a novel VEGFR-3 neutralizing antibody. J Natl Cancer Inst. 2005;97(1):14-21
62. Burton JB, Priceman SJ, Sung JL, Brakenhielm E, An DS, Pytowski B. et al. Suppression of prostate cancer nodal and systemic metastasis by blockade of the lymphangiogenic axis. Cancer Res. 2008;68(19):7828-7837
63. He L, Li H, Wu A, Peng Y, Shu G, Yin G. Functions of N6-methyladenosine and its role in cancer. Mol Cancer. 2019;18:176
64. Jin S, Li M, Chang H, Wang R, Zhang Z, Zhang J. et al. The m6A demethylase ALKBH5 promotes tumor progression by inhibiting RIG-I expression and interferon alpha production through the IKKε/TBK1/IRF3 pathway in head and neck squamous cell carcinoma. Mol Cancer. 2022;21(1):97
65. Zhu W, Wang J, Liu X, Xu Y, Zhai R, Zhang J. et al. lncRNA CYTOR promotes aberrant glycolysis and mitochondrial respiration via HNRNPC-mediated ZEB1 stabilization in oral squamous cell carcinoma. Cell Death Dis. 2022;13(8):703
66. Patel V, Marsh CA, Dorsam RT, Mikelis CM, Masedunskas A, Amornphimoltham P. et al. Decreased lymphangiogenesis and lymph node metastasis by mTOR inhibition in head and neck cancer. Cancer Res. 2011;71(22):7103-12
67. Lilis I, Giopanou I, Papadaki H, Gyftopoulos K. The expression of p-mTOR and COUP-TFII correlates with increased lymphangiogenesis and lymph node metastasis in prostate adenocarcinoma. Urol Oncol. 2018;36(6):311.e27-311.e35
68. Xu L, Li J, Tursun M, Hai Y, Tursun H, Mamtimin B. et al. Receptor for activated C kinase 1 promotes cervical cancer lymph node metastasis via the glycolysis-dependent AKT/mTOR signaling. Int J Oncol. 2022;61(1):83
69. Tamburrino A, Molinolo AA, Salerno P, Chernock RD, Raffeld M, Xi L. et al. Activation of the mTOR pathway in primary medullary thyroid carcinoma and lymph node metastases. Clin Cancer Res. 2012;18(13):3532-40
70. Escudier B, Molinie V, Bracarda S, Maroto P, Szczylik C, Nathan P. et al. Open-label phase 2 trial of first-line everolimus monotherapy in patients with papillary metastatic renal cell carcinoma: RAPTOR final analysis. Eur. J. Cancer. 2016;69:226-235
71. Hutson T.E, Michaelson M.D, Kuzel T.M, Agarwal N, Molina A.M, Hsieh J.J. et al. A Single-arm, Multicenter, Phase 2 Study of Lenvatinib Plus Everolimus in Patients with Advanced Non-Clear Cell Renal Cell Carcinoma. Eur. Urol. 2021;80:162-170
72. Han X, Li B, Zhang S. MIR503HG: A potential diagnostic and therapeutic target in human diseases. Biomed Pharmacother. 2023;160:114314
73. Chen C, Guo Y, Huang Q, Wang B, Wang W, Niu J. et al. PI3K inhibitor impairs tumor progression and enhances sensitivity to anlotinib in anlotinib-resistant osteosarcoma. Cancer Lett. 2022;536:215660
74. Xiong W, Zhang B, Yu H, Zhu L, Yi L, Jin X. RRM2 Regulates Sensitivity to Sunitinib and PD-1 Blockade in Renal Cancer by Stabilizing ANXA1 and Activating the AKT Pathway. Adv Sci (Weinh). 2021;8(18):e2100881
Author contact
![]() Corresponding authors: Wei Xue, E-mail: uroxueweicom, Junhua Zheng, E-mail: zhengjh0471com, Wei Zhai, E-mail: zhaiweicom.
Corresponding authors: Wei Xue, E-mail: uroxueweicom, Junhua Zheng, E-mail: zhengjh0471com, Wei Zhai, E-mail: zhaiweicom.