Impact Factor ISSN: 1449-2288

 Global reach, higher impact
Int J Biol Sci 2025; 21(13):5905-5921. doi:10.7150/ijbs.98013 This issue Cite
Research Paper
Cyclin D1/CDK coordination with the cellular prion protein upregulated cell proliferation signaling and preserved neurological function in acute IS rats
Kun-Chen Lin1, Kuan-Hung Chen1, John Y. Chiang2,3, Han-Tan Chai4, Chi-Ruei Huang4,5, Yi-Ling Chen4,6, Yi-Ting Wang4,6, Jun Guo7, ![]() , Hon-Kan Yip4,5,6,8,9,
, Hon-Kan Yip4,5,6,8,9, ![]()
1. Department of Anesthesiology, Kaohsiung Chang Gung Memorial Hospital and Chang Gung University College of Medicine, Kaohsiung, 83301, Taiwan, R.O.C.
2. Department of Computer Science and Engineering, National Sun Yat-Sen University, Kaohsiung 804201, Taiwan, R. O. C.
3. Department of Healthcare Administration and Medical Informatics, Kaohsiung Medical University, Kaohsiung 807378, Taiwan, R. O. C.
4. Division of Cardiology, Department of Internal Medicine, Kaohsiung Chang Gung Memorial Hospital and Chang Gung University College of Medicine, Kaohsiung 833401, Taiwan, R. O. C.
5. Center for Shockwave Medicine and Tissue Engineering, Kaohsiung Chang Gung Memorial Hospital, Kaohsiung 833401, Taiwan, R. O. C.
6. Institute for Translational Research in Biomedicine, Kaohsiung Chang Gung Memorial Hospital, Kaohsiung 833401, Taiwan, R. O. C.
7. Department of Cardiology, The First Affiliated Hospital, Jinan University, Guangzhou 510630, China
8. School of Medicine, College of Medicine, Chang Gung University, Taoyuan 333323, Taiwan, R. O. C.
9. Department of Medical Research, China Medical University Hospital, China Medical University, Taichung 404333, Taiwan, R. O. C.
*Contributed equally.
Received 2024-5-2; Accepted 2025-8-23; Published 2025-9-21
Abstract

We tested how the coordination between cyclin D1/cyclin-dependent kinase (CDK) and the cellular prion protein (PrPC) activates mitogenic/cell proliferation signaling to improve neurological outcomes in acute ischemic stroke (AIS) rats. Compared with those in adipose-derived mesenchymal stem cells (ADMSCs) and the N2a cell line, the cell viability, cell proliferation, cell-stress signaling, and wound healing rates were significantly increased upon overexpression of PrPC (PrPC-OE) in ADMSCs (all P<0.001). The cell viability, proliferation. mitochondrial mass, and protein expression of mitogenic signaling markers (cyclin D1, cyclin E1, CDK2, and CDK4) were significantly increased upon PrPC-OE in ADMSCs compared to ADMSCs that were subjected to a significant reversal of PrPC-OE by treatment with promazine (a PrPC formation inhibitor) (all P<0.001). After 3 h of serum-free/hypoxic conditions, the protein expression levels of cyclin D1/CDK, p-Akt and mitogenic signaling markers were significantly increased upon PrPC-OE in ADMSCs compared with ADMSCs that were treated with palbociclib (a cyclin D1/CDK inhibitor). Adult male Sprague-Dawley rats (n=40) were grouped into Groups 1 (AC), 2 (AIS), 3 (AIS + ADMSCs), and 4 (AIS + ADMSCs with PrPC-OE). By Day 28 after AIS induction, the neurological function and numbers of NeuN+ cells and myelin basic protein (MBP)+ cells were lowest in Group 2, highest in Group 1 and significantly increased in Group 4 compared with Group 3, whereas the cellular levels of fibrosis and inflammation markers and protein levels of markers of apoptosis, mitochondrial and DNA damage and autophagy exhibited the opposite pattern to neurological function, and protein expression levels of cell-stress signaling proteins (PI3K, Akt, and m-TOR) and PrPC progressively increased from Groups 1 to 4 (all P<0.0001). In conclusion, activated cyclin D1/CDK coordinated with PrPC to improve neurological function in the AIS setting.
Keywords: acute ischemic stroke, cellular prion protein, cyclin D, cyclin-dependent kinase, cell proliferation signaling, cell cycle
Introduction
Ischemic stroke (IS) remains the 3rd leading cause of mortality globally [1-3]. Although new strategies, including the use of antiplatelet agents [4-6], the emergent use of reperfusion therapies [7], such as tissue plasminogen activator (tPA) therapy [8-10], the catheter-based endovascular removal of the thrombosis [11-14] in the larger vessels, and renewed guidelines for poststroke rehabilitation [15, 16], have reduced mortality within the last decade in patients after acute IS, the long-term comorbidity and IS-related disability and sequalae have regrettably still not improved substantially within the last 10 years [17-22]. These unfavorable outcomes not only cause serious suffering for IS patients but also constitute an enormous economic burden on society. In summary, the current treatment of IS patients leaves much to be desired. This motivates the need to find a new treatment method with improved safety and efficacy for patients after IS, especially for those who are unsuitable candidates for tPA therapy or endovascular thrombectomy.
Many studies have shown that cell-based therapy has emerged as an effective therapeutic option for treating ischemia-related organ dysfunction, especially for patients who are refractory to conventional therapy [23-26]. Preclinical and clinical studies have demonstrated that endothelial progenitor cells (EPCs) [25, 27] and mesenchymal stem cells (MSCs) [28-32] have therapeutic potential for treating ischemic heart disease and IS. Additionally, our animal model studies revealed that adipose-derived mesenchymal stem cells (ADMSCs) therapy or even human umbilical-derived mesenchymal stem cell therapy [28-31] markedly protected the neurological function and integrity of the brain architecture in rodents after acute IS or acute intracranial hemorrhage. The underlying mechanism [28-32] for improving the outcomes of these cell-based therapies is mainly through anti-inflammatory effects, suppression of oxidative stress and upregulation of tissue and neuronal regeneration. However, one problem is that the survival and proliferation rates of ADMSCs have been shown to be substantially diminished during ischemia, resulting in a decrease in their therapeutic effect.
Originally, investigators discovered that the cellular prion protein (PrPC) is a glycosylphosphatidylinositol-anchored glycoprotein that is predominantly localized in the brain and nerve cells [33, 34]. Since then, PrPC has been shown to act as a neuroprotective or survival protein to guard against Bcl-2-associated protein X (i.e., Bax)-mediated cell death [35]. Intriguingly, our recent study [36] revealed that the overexpression of PrPC (PrPC-OE) in ADMSCs enhanced mitochondrial biogenesis and cell proliferation and suppressed inflammatory reactions in the context of acute kidney ischemia‒reperfusion injury. However, the precise mechanism underlying the ability of PrPC/PrPC-OE in ADMSCs therapy to increase cell proliferation and survival and reverse ischemia-related organ dysfunction is currently unclear. Interestingly, a previous study [37] revealed that cyclin D1/cyclin-dependent kinase (CDK) plays crucial roles in promoting the rate of onset and magnitude of mitogenic signaling by activating Akt. The findings from the previous study [37] were comparable with the findings of our recent study [36]. However, the coordination between cyclin D1/CDK and PrPC for upregulating the cell proliferation signaling and the cell cycle remains unclear. Thus, this study attempted to clarify how the coordination between cyclin D1/CDK and PrPC activates cell stress and cell proliferation signaling to improve neurological outcomes in acute IS rats.
Materials and Methods
Ethical issues
All animal procedures were approved by the Institute of Animal Care and Use Committee at Kaohsiung Chang Gung Memorial Hospital (Affidavit of Approval of Animal Use Protocol No. 2021081802) and performed in accordance with the Guide for the Care and Use of Laboratory Animals.
The animals were housed in an Association for Assessment and Accreditation of Laboratory Animal Care International (AAALAC; Frederick, MD, USA)-approved animal facility in our hospital with a controlled temperature and light cycles (24 °C and a 12 hour light/12 dark cycle).
Transfection of ADMSCs with plasmids for PrPC expression
The methods used were described in our previous report [36]. Specifically, the pCS6-PRNP plasmid was purchased from Transomic Technologies. The plasmid transfection process was performed with Lipofectamine 3000 according to the manufacturer's instructions with minimal modifications. The ADMSCs were replated 24 h prior to transfection at a density of 5 × 10⁵ cells in 4 ml of fresh culture medium in a 6-cm plastic dish. Since PRNP is the gene for PrPC, PRNP was replaced by PrPC to facilitate an early understanding of this specific relationship in the present study.
Cell grouping
To test whether PrPC expression was dissimilar in different cells, the cells were grouped into Groups A1 (N2a cells, i.e., the mouse neuroblastoma cell line), A2 (ADMSCs) and A3 (ADMSCs with PrPC-OE). The results are shown in Figure 1.
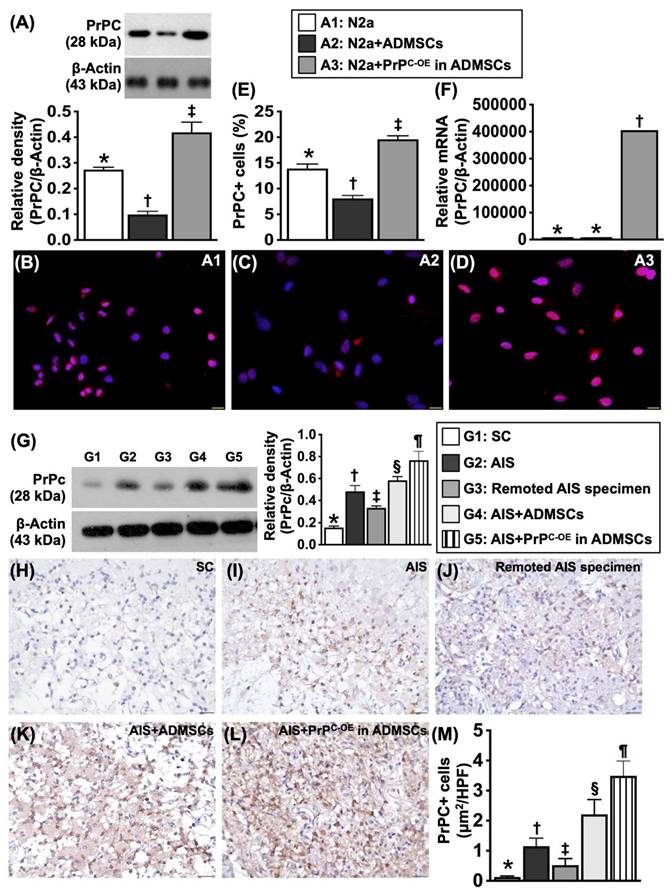
Protein, cellular and gene expressions of cellular prion protein (PrPC) in N2a cell line and ADMSCs, and protein expression of PrPC in different circumstances of brain tissues. A) Protein expression of PrPC, * vs. other groups with different symbols (†, ‡), P<0.001. B to D) Illustrating immunofluorescent (IF) microscopic finding (400x) for delineating the cellular expression of PrPC (pink color). Blue color indicated DAPI stain for identification of nuclei. E) Analytical result of PrPC in cellular level, * vs. other groups with different symbols (†, ‡), P<0.001. Scale bar in right lower corner represents 20µm. F) Relative PrPC mRNA level, * vs. ‡, P<0.001. All statistical analyses were performed by one-way ANOVA, followed by Bonferroni multiple comparison post hoc test (n=4 for each group). Symbols (*, †, ‡) indicate significance (at 0.05 level). A1 = N2a cells, A2 = adipose-derived mesenchymal stem cells (ADMSCs), A3 = cellular prion protein overexpression (PrPC-OE) in ADMSCs. G) Protein expression of PrPC in different circumstances of harvested brain specimen, * vs. other groups with different symbols (†, ‡, §, ¶), P<0.0001. H to L) Illustrating the microscopic finding (400x) of IHC stain for identification of cellular expression of PrPC (gray color). M) Analytical result of PrPC in cellular level, * vs. other groups with different symbols (†, ‡, §, ¶), P<0.0001. Scale bar in right lower corner represents 20µm. Grouping: G1 = SC, G2 = acute ischemic stroke (AIS), G3 = remoted AIS specimen, G4 = AIS + ADMSCs, G5 = AIS + PrPC-OE in ADMSCs. All statistical analyses were performed by one-way ANOVA, followed by Bonferroni multiple comparison post hoc test (n=3-5 for each group). Symbols (*, †, ‡) indicate significance (at 0.05 level). AIS = acute ischemic stroke; PrPC-OE = cellular prion protein overexpression; ADMSCs = adipose-derived mesenchymal stem cells.
To test whether PrPC participated in cell proliferation and augmented the wound healing rate, mitochondrial duplication and cell cycle activation, the cells were grouped into Groups B1 (ADMSCs), B2 (ADMSCs with PrPC-OE), and B3 [ADMSCs with PrPC-OE + promazine (i.e., an inhibitor of PrPC formation)]. The results are shown in Figures 3 to 5.
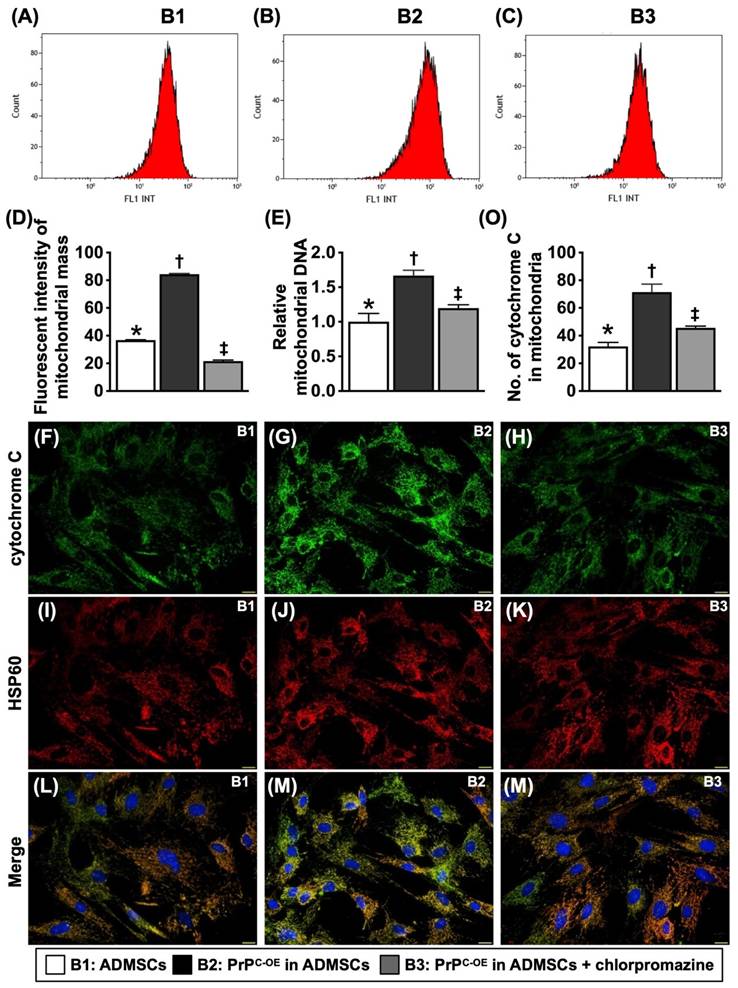
The PrPC augmented mitochondrial duplication in the cells. A to C) Illustrating the flow cytometric analysis for determining the mitochondrial mass. D) Analytical result of mean fluorescent intensity of mitochondrial mass [Nonyl Acridine Orange (NAO), i.e., a green-fluorescent mitochondrial dye for measuring the mitochondrial content of cells], * vs. other groups with different symbols (†, ‡), P<0.0001. E) The relative mitochondrial DNA, * vs. other groups with different symbols (†, ‡), P<0.0001. F to N) Illustrating the IF microscopic finding (400x) for identification of cytochrome C (green color) (F to H), intracellular mitochondria (i.e., by HSP60 stain) (red color) (I to K) and the merged picture (i.e., combined cytochrome C and HSP60 staining) for identification of the expression of cytochrome C in mitochondria (green-pink color) (L to N). Scale bar in right lower corner represents 20µm. O) Analytical result of number of cytochrome C in mitochondria, * vs. other groups with different symbols (†, ‡), P<0.0001. All statistical analyses were performed by one-way ANOVA, followed by Bonferroni multiple comparison post hoc test (n=4-6 for each group). Symbols (*, †, ‡) indicate significance (at 0.05 level). B1 = ADMSCs, B2 = PrPC-OE in ADMSCs, B3 = PrPC-OE in ADMSCs + chlorpromazine. PrPC-OE = cellular prion protein overexpression; ADMSCs = adipose-derived mesenchymal stem cells.
To elucidate whether the protein levels of cyclin D1/CDK were consistent with the upregulation of cell stress signaling, the cell cultures were grouped into Groups C1 (ADMSCs), C2 [ADMSCs in serum-free medium + CoCl2 (30 µM for 6 h)], C3 [ADMSCs with PrPC-OE in serum-free medium + CoCl2 (30 µM for 6 h)], C4 [ADMSCs in serum-free medium + CoCl2 (30 µM for 12 h)], C5 [ADMSCs with PrPC-OE in serum-free medium + CoCl2 (30 µM for 12 h)], C6 [ADMSCs in serum-free medium + CoCl2 (30 µM for 24 h)] and C7 [ADMSCs with PrPC-OE in serum-free medium + CoCl2 (30 µM for 24 h)]. The results are shown in Figure 6. The dosage of CoCl2 used in the present study was based on our previous report [38] with some modifications.
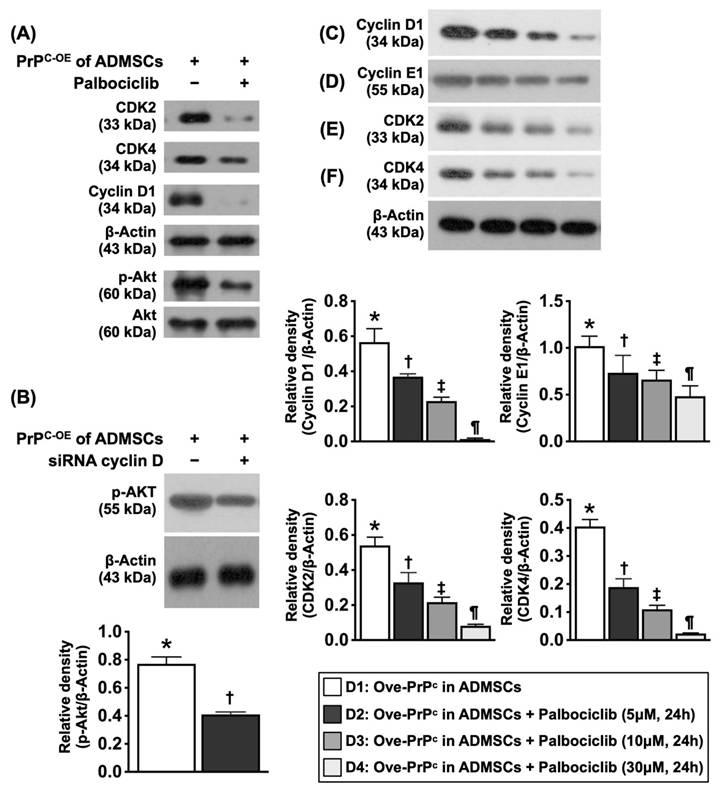
The cardinal enzymes of cyclin D1/CDK on regulating cell cycle subunits and the PrPC-mediated cell stress/proliferation signaling in inhibited condition of CDK. A) Illustrating the protein expressions of CDK2, CDK4, cyclin D1 and phosphorylated (p) were notably reduced after palbociclib (30 µM) treatment, implicating that inhibited CDK affected the expression of cyclin D1 and p-Akt (refer to Figure 10F). B) Protein expression of p-Akt was markedly reduced in siRNA (i.e., silencing) cyclin D in PrPC-OE of ADMSCs than in that of PrPC-OE of ADMSCs only, * vs. †, P<0.001. C) Protein expression of cyclin D1, * vs. other groups with different symbols (†, ‡, §), P<0.001. D) Protein expression of cyclin E1, * vs. other groups with different symbols (†, ‡, §), P<0.001. E) Protein expression of ckd2, * vs. other groups with different symbols (†, ‡, §), P<0.001. F) Protein expression of ckd4, * vs. other groups with different symbols (†, ‡, §), P<0.001. All statistical analyses were performed by one-way ANOVA, followed by Bonferroni multiple comparison post hoc test (n=3 for each group). Symbols (*, †, ‡, §) indicate significance (at 0.05 level). D1 = PrPC-OE in ADMSCs, D2 = PrPC-OE in ADMSCs + Palbociclib (5 uM for 24h), D3 = PrPC-OE in ADMSCs + Palbociclib (10 uM for 24h), D4 = PrPC-OE in ADMSCs + Palbociclib (30 uM for 24h). Palbociclib = a specific inhibitor of cyclin-dependent protein kinase.
To elucidate whether cyclin D1/CDK were the crucial regulatory enzymes involved in the upregulation of cell proliferation signaling through the regulation of cell cycle checkpoints (i.e., PI3K/Akt), stepwise concentrations (0, 5, 10, and 30 µM) of palbociclib (i.e., an inhibitor of cyclin D1/CDK) were utilized, and the cell cultures were grouped into Groups D1 (ADMSCs with PrPC-OE), D2 [ADMSCs with PrPC-OE + palbociclib (5 µM for 24 h)], D3 [ADMSCs with PrPC-OE + palbociclib (10 µM for 24 h)] and D4 [ADMSCs with PrPC-OE + palbociclib (30 µM for 24 h)].
Animal model of acute IS and animal grouping
The protocol and procedure were based on our previous study [27]. In detail, adult male Sprague‒Dawley rats weighing 350-375 g (Charles River Technology, BioLASCO Taiwan Co., Ltd., Taiwan) were used in this study. All animals were anesthetized with 2% inhalational isoflurane in a supine position on a warming pad (37 °C). After the left common carotid artery (LCCA) was exposed through a transverse neck incision, a small arteriotomy was performed on the LCCA, through which a 0.28 mm diameter nylon monofilament was carefully pushed forward into the distal LCCA for occlusion of the left middle cerebral artery to induce brain ischemia and infarction of its supplied region. The nylon monofilament was removed 60 min after occlusion, followed by closure of the muscle and skin in layers. The duration of nylon monofilament occlusion to the left middle cerebral artery was based on our previous study [27]. The rats were then cared for in a portable animal intensive care unit (ThermoCare®) with food and water for 24 h. For those animals in the sham-operated control (SC) group, only the skin and muscle layers were opened, and these layers were immediately closed after the LCCA was identified.
After acute IS induction, the animals were then categorized into Group 1 (SC, i.e., incision of the neck skin and dissection of the LCCA only), Group 2 (acute IS only), Group 3 (acute IS + ADMSCs (1.2 × 10⁶) each time at 1.5 and 24 h after IS) and Group 4 (acute IS + ADMSCs with PrPC-OE (1.2 × 10⁶) each time at 1.5 and 24 h after IS). The dose of ADMSCs used in the present IS animal model was based on our previous investigations [28-32].
Corner test for the evaluation of neurological function
The sensorimotor functional test (corner test) was conducted for each rat at baseline and at 3, 7, 14 and 28 days after acute IS induction, as we previously described [1, 2]. Briefly, the rats in each group were allowed to walk through a tunnel and then into a corner, the angle of which was 60 degrees. To exit the corner, the rat could turn either left or right. A technician who was blinded to the study design recorded the results. This test was repeated 10 to 15 times, with at least 30 s between each test. The technician recorded the number of right and left turns from 10 successful trials for each animal, and the results were used for statistical analysis.
Western blot analysis
The procedure and protocol for Western blot analysis were based on our recent reports [27, 31, 36]. Briefly, equal amounts (50 μg) of protein extracts were loaded and separated by SDS‒PAGE with acrylamide gradients. After electrophoresis, the separated proteins were transferred electrophoretically to a polyvinylidene difluoride membrane (GE, UK). Nonspecific sites were blocked by incubation of the membrane in blocking buffer [5% nonfat dry milk in T-TBS (TBS containing 0.05% Tween 20)] overnight. The membranes were incubated with the indicated primary antibodies [anti-PrPC (1:1000, Abcam), anti-Bax (1:1000, Abcam), anti-cleaved caspase 3 (1:1000, Cell Signaling), anti-cleaved PARP (1:1000, Cell Signaling), anti-beclin-1 (1:1000, Cell Signaling), anti-Atg5 (1:1000, Cell Signaling), anti-phosphorylated (p)-DRP1 (1:1000, Cell Signaling), anti-DRP1 (1:1000, Abcam), anti-cyclophilin D (1:10000, Abcam), anti-cytochrome C (1:10000, BD), p-γ-H2AX (1:1000, Cell Signaling), anti-tumor necrosis factor (TNF)-α (1:1000, Cell Signaling), anti-matrix metalloproteinase (MMP)-9 (1:1000, Cell Signaling), anti-LC3B-I (1: 1000, Cell Signaling), anti-LC3B-II (1: 1000, Cell Signaling) and anti-actin (1: 1000, Millipore)] for 1 hour at room temperature. Horseradish peroxidase-conjugated anti-rabbit immunoglobulin IgG (1:2000, Cell Signaling, Danvers, MA, USA) was used as a secondary antibody for a one-hour incubation at room temperature. The washing procedure was repeated eight times within one hour. Immunoreactive bands were visualized by enhanced chemiluminescence (ECL; Amersham Biosciences, Amersham, UK) and exposed to Biomax L film (Kodak, Rochester, NY, USA). For the purpose of quantification, the ECL signals were digitized by LabWorks software (UVP, Waltham, MA, USA).
Immunofluorescent (IF) and immunohistochemical (IHC) staining of brain specimens
The procedures and protocols for IF and IHC staining were based on our previous reports [27, 31, 36]. In detail, frozen sections (4 μm thick) were obtained from the brain hemorrhagic area/at risk area of each animal, permeabilized with 0.5% Triton X-100, and incubated with antibodies against NeuN (1:100, Merck), CD31 (1:100, Abcam), von Willebrand factor (vWF) (1:200, Abcam), CXCR4 (1:100, Invitrogen), CD14 (1:200, Proteintech), and F4/80 (1:100, Santa Cruz) at 4 °C overnight. Alexa Fluor 488, Alexa Fluor 568, or Alexa Fluor 594-conjugated goat anti-mouse or rabbit IgG was used to localize the signals. The sections were finally counterstained with DAPI and observed with a fluorescence microscope equipped for epifluorescence microscopy (Olympus IX-40). Three brain sections from each rat were analyzed. For quantification, three randomly selected high-power fields (HPFs; 400x for IF study) were analyzed in each section. The mean number of positively stained cells per HPF for each animal was then determined by adding all the numbers and then dividing by 9.
Statistical analysis
The quantitative data are expressed as the means ± SDs. Statistical analysis was performed with ANOVA, followed by the Bonferroni multiple-comparison post hoc test. SAS statistical software for Windows version 8.2 (SAS Institute, Cary, NC, USA) was utilized. A p value of less than 0.05 was considered statistically significant.
Results
Assessment of the protein and gene expression of the cellular prion protein (PrPC) in the N2a cell line, MSCs and brain tissues (Figure 1)
To test whether PrPC expression was dissimilar in different cells, Western blot and gene analyses and IHC staining were utilized. The cells were grouped into groups A1 (N2a cells), A2 (ADMSCs) and A3 (ADMSCs with PrPC-OE). The results revealed that the protein expression levels of PrPC were significantly greater in A3 than in A1 and A2 and significantly greater in A1 than in A2. Additionally, the mRNA expression of PrPC was also significantly greater in A3 than in A1 and A2.
To test whether PrPC expression is upregulated in brain tissue after acute IS, WB and IHC staining were conducted. The results demonstrated that the protein expression level of PrPC was highest in the acute IS + ADMSCs with PrPC-OE group, lowest in the SC group, significantly lower in remote brain tissue of the acute IS group than in that of the acute IS and acute IS + ADMSCs groups and significantly lower in the acute IS group than in the acute IS + ADMSCs group, indicating that ischemic stroke stimulated PrPC expression and that treatment with ADMSCs with PrPC-OE further enhanced the expression of this protein in brain tissue.
PrPC increased cell viability, cell proliferation and the wound healing rate (Figure 2)
To test whether PrPC participated in cell proliferation and augmented the wound healing rate, three in vitro cell culture groups, B1 (ADMSCs), B2 (ADMSCs with PrPC-OE) and B3 [ADMSCs with PrPC-OE + chlorpromazine (i.e., an inhibitor of PrPC formation)], were used.
Crucial role of PrPC on cell growth and proliferation. A) Cell viability at 24h, * vs. other groups with different symbols (†, ‡), P<0.0001. B) Cell viability at 48h, * vs. other groups with different symbols (†, ‡), P<0.0001. C) Cell viability at 72h, * vs. other groups with different symbols (†, ‡), P<0.0001. D to F) Illustrating the wound healing process at baseline (i.e., 0h), P>0.5. G to I) Illustrating the wound healing process at 24h. J) Analytical result of wound healing rate, * vs. other groups with different symbols (†, ‡), P<0.0001. K to M) Illustrating the immunofluorescent (IF) microscopic finding (400x) for identification of cellular expression of PCNA (green color). Scale bar in right lower corner represents 20µm. N) Analytical result of number of PCNA+ cells, * vs. other groups with different symbols (†, ‡), P<0.0001. O to Q) Illustrating the microscopic finding (100x) for identification of BrdU+ cells (gray color). Scale bar in right lower corner represents 100µm. R) Analytical result of number of BrdU+ cells, * vs. other groups with different symbols (†, ‡), P<0.0001. All statistical analyses were performed by one-way ANOVA, followed by Bonferroni multiple comparison post hoc test (n=6 for each group). Symbols (*, †, ‡) indicate significance (at 0.05 level). B1 = ADMSCs, B2 = PrPC-OE in ADMSCs, B3 = PrPC-OE in ADMSCs + chlorpromazine. PrPC-OE = cellular prion protein overexpression; ADMSCs = adipose-derived mesenchymal stem cells.
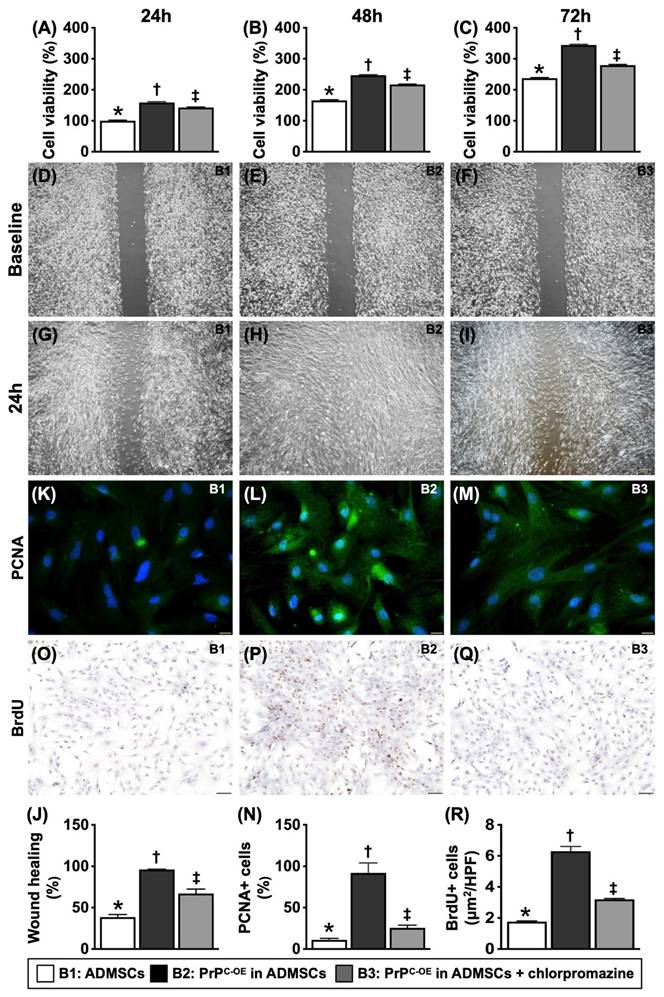
The results of the MTT assay revealed that cell viability was significantly greater in B1 and significantly greater in B2 than in B3, regardless of the time point (24, 48 or 72 h). Additionally, at 72 h, the cellular expression of PCNA and BrdU uptake, two indicators of cell proliferation, displayed an identical pattern in the MTT assay among the groups. Furthermore, at 24 h, the wound healing rate also exhibited a pattern identical to that of the MTT assay among the groups. These findings suggested that PrPC played a crucial role in cell growth and proliferation.
PrPC augmented mitochondrial duplication in the cells (Figure 3)
To determine whether the number of intracellular mitochondria consistently increases with increasing cell viability and proliferation, the cell grouping as shown in Figure 3 was utilized. By 48 h, flow cytometric and qPCR analyses revealed that the mitochondrial mass and relative amount of mitochondrial DNA were significantly greater in B2 than in B1, and these changes were significantly reversed in B3. Additionally, IF staining analysis revealed that the number of mitochondrial cytochrome C molecules, an indicator of mitochondrial integrity, displayed a similar pattern to that of the mitochondrial mass among the groups.
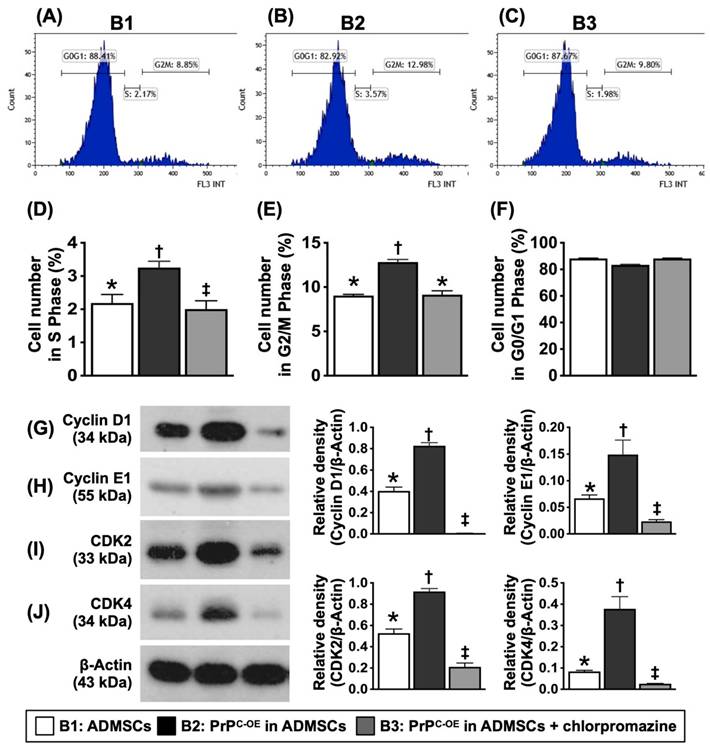
PrPC augmented the synthetic and mitotic phases and cell cycle activation in ADMSCs (Figure 4)
Flow cytometric analysis demonstrated that the number of cells in the synthetic and mitotic phases was significantly greater in B2 than in B1. However, these two parameters were significantly reversed in B3. Additionally, the protein levels of cyclin D1, cyclin E1, CDK2, and CDK4, four indices of the cell cycle, exhibited an identical pattern to that of the mitochondrial mass among the groups, indicating that PrPC-OE accelerated the activation of the cell cycle and the synthetic and mitotic phases.
The PrPC upregulated synthetic/mitotic phases and augmented cell-cycle activation in the cells. A to C) Illustrating the flow cytometric analysis for assessment of the mitotic and synthetic phases (i.e., cell cycle). D) Analytical result of synthesis phase (S), * vs. other groups with different symbols (†, ‡), P<0.0001. E) Analytical result of mitosis (G2/M) phase (i.e., mitotic cell cycle transition), * vs. other groups with different symbols (†, ‡), P<0.0001. F) Flow cytometric analysis of G0/G1 phase, p>0.5. G) Protein expression of Cyclin D1, * vs. other groups with different symbols (†, ‡), P<0.0001. H) Protein expression of Cyclin E1, * vs. other groups with different symbols (†, ‡), P<0.0001. I) Protein expression of CDK2, * vs. other groups with different symbols (†, ‡), P<0.0001. J) Protein expression of CDK4, * vs. other groups with different symbols (†, ‡), P<0.0001. All statistical analyses were performed by one-way ANOVA, followed by Bonferroni multiple comparison post hoc test (n=4-6 for each group). Symbols (*, †, ‡) indicate significance (at 0.05 level). B1 = ADMSCs, B2 = PrPC-OE in ADMSCs, B3 = PrPC-OE in ADMSCs + chlorpromazine treated for 24h, PrPC-OE = cellular prion protein overexpression; ADMSCs = adipose-derived mesenchymal stem cells.
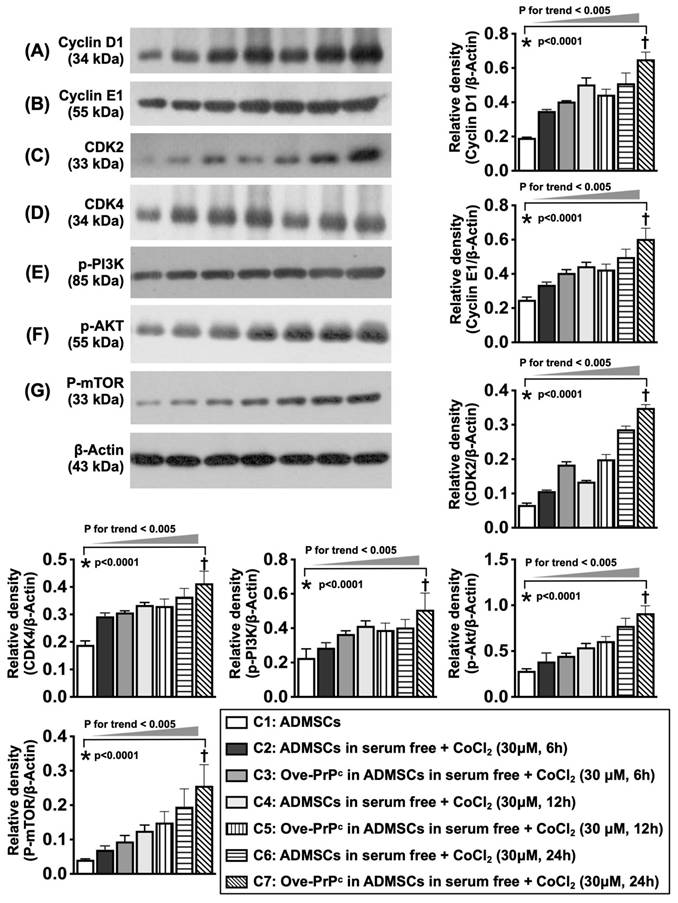
Hypoxia was involved in changes in cyclin D1, cell cycle subunits and cell stress signaling (Figure 5)
To elucidate whether the protein levels of cyclin D1/cell cycle subunits are consistent with the upregulation of cell stress signaling, the cell culture Groups C1 to C7 were analyzed. Compared with those at baseline, the protein levels of D1, an indicator of cell proliferation that regulates cell cycle checkpoints and transcriptional events in response to extracellular and intracellular signals, cell cycle subunits (cyclin E1, CDK2, and CDK4), and cell stress/proliferation signaling proteins (i.e., p-PI3K, p-Akt, and p-mTOR) were significantly upregulated at 6, 12 and 24 h after 6 h of hypoxic stimulation.
Serial changes of cyclin D1, cell cycle subunits and cell stress signaling in condition of cellular prion protein overexpression and hypoxic condition. A) Illustrating the protein expression of cyclin D1 at the time points of 0, 12 and 24 h, analytical results, * vs. †, P<0.001, P for trend <0.005. B) Illustrating the protein expression of cyclin E1 at time points of 0, 12 and 24 h, analytical result, * vs. †, P<0.001, P for trend <0.005. C) Illustrating the protein expression of cdk2 at time points of 0, 12 and 24 h, analytical result, * vs. †, P<0.001, P for trend <0.005. D) Illustrating the protein expression of cdk4 at time points of 0, 12 and 24 h, analytical result, * vs. †, P<0.001, P for trend <0.005. E) Illustrating the protein expression of phosphorylated (p)-PI3K at time points of 0, 12 and 24 h, * vs. †, P<0.001, P for trend <0.005. F) Illustrating the protein expression of P-Akt at time points of 0, 12 and 24 h, * vs. †, P<0.001, P for trend <0.005. G) Illustrating the protein expression of p-mTOR at time points of 6, 12 and 24 h, * vs. †, P<0.001, P for trend <0.005. C1 = ADMSCs, C2 = ADMSCs in serum free + CoCl2 (30 uM for 6 h), C3 = Ove-PrPc in ADMSCs in serum free + CoCl2 (30 uM for 6 h), C4 = ADMSCs in serum free + CoCl2 (30 uM for 12 h), C5 = Ove-PrPc in ADMSCs in serum free + CoCl2 (30 uM for 12 h), C6 = ADMSCs in serum free + CoCl2 (30 uM for 24 h), C7 = Ove-PrPc in ADMSCs in serum free + CoCl2 (30 uM for 24 h). n = 3 for each group.
Cyclin D1/CDK were the primary enzymes regulating the PrPC-mediated cell stress and proliferation signaling (Figure 6)
To elucidate whether cyclin D1/CDK are the crucial regulatory enzymes involved in the upregulation of the cell cycle checkpoints and the checkpoint of PrPC-OE-mediated cell proliferation signaling (i.e., PI3K/Akt), as well as in the transcriptional events in response to extracellular and intracellular stimulation, palbociclib (PD0332991) (30 µM), siRNA silencing of cyclin D1, and stepwise increasing concentrations of palbociclib (PD0332991) (i.e., 0, 5, 10, and 30 µM) were utilized in the culture of ADMSCs with PrPC-OE.
The results demonstrated that the protein expression levels of cyclin-dependent kinase 2 (CDK2) and CDK4 were substantially lower in ADMSCs with PrPC-OE than in those treated with palbociclib (30 µM). Additionally, the protein expression levels of cyclin D1 and p-Akt presented an identical pattern to that of CDK2/CDK4 within the two groups. Additionally, the protein expression of p-Akt in ADMSCs with siRNA cyclin D1 and PrPC-OE was markedly lower than that in ADMSCs with PrPC-OE only.
Furthermore, the protein expression levels of cyclin D1, cyclin E1, CDK2, CDK4 and p-Akt significantly and progressively decreased as the concentration of palbociclib increased. These findings highlighted that cyclin D1/CDK was the important checkpoint of PrPC-OE-mediated cell proliferation (refer to Figure 10).
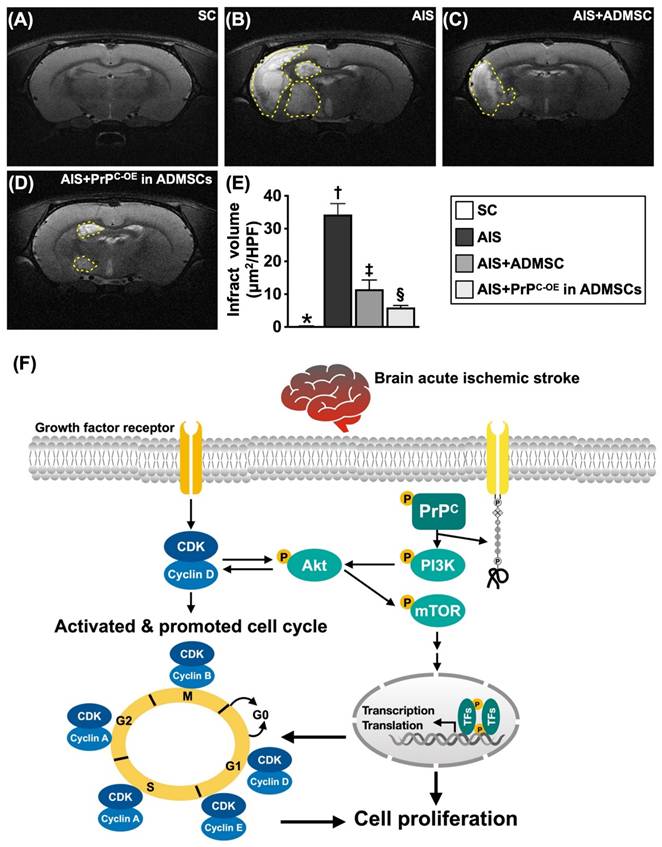
Brain ischemic volume (BIV) by day 28 after acute IS induction and proposed underlying mechanism. A to D) Illustrating the brain magnetic resonance imaging (MRI) finding for identification of BIV (white color) (yellow dotted-line area). E) Analytical result of BIV (i.e., the percentage of the whole brain volume), * vs. other groups with different symbols (†, ‡, §), P<0.0001. F) Based on our extensive works in the present study, we schematically illustrated the proposed mechanism of coordination of cyclin D1/CDK and PrPC on activating mitogenic/cell-proliferation signaling for improving neurological outcomes in AIS rodent. CDK = cyclin-dependent kinase; PrPC = cellular prion protein.
Time courses of neurological function and inflammatory and fibrotic parameters in ischemic brain tissues by Day 28 after acute IS (Figure 7)
To evaluate whether ADMSCs with and without PrPC-OE improve neurological function, a corner test was conducted on Day 0 prior to acute IS induction and at Days 3, 7, 14 and 28 after acute IS induction. The results demonstrated that, on Day 0, neurological function did not differ among the groups. However, on Day 3 after acute IS induction, neurological function was significantly impaired in Group 2 (acute IS only), Group 3 (acute IS + ADMSCs) and Group 4 (acute IS + ADMSCs with PrPC-OE) compared with that in Group 1 (SC), but neurological function did not differ among Groups 2 to 4. On the other hand, by Days 7, 14 and 28 after acute IS induction, this parameter was still impaired in Group 2 compared with that in Group 1 but was significantly reversed in Group 3 and further significantly reversed in Group 4.
Time courses of neurological function, inflammation and fibrosis by day 28 after acute ischemic stroke. Schematically Illustrated the time courses of the neurological function (i.e., corner test). B) Neurological function at baseline, p >0.5. C) Neurological function at day 3, * vs. other groups with different symbols (†, ‡), P<0.0001. D) Neurological function ay day 7, * vs. other groups with different symbols (†, ‡), P<0.0001. E) Neurological function ay day 14, * vs. other groups with different symbols (†, ‡), P<0.0001. F) Neurological function at day 28, * vs. other groups with different symbols (†, ‡, §), P<0.0001. G to J) Illustrating the immunofluorescent (IF) microscopic finding (400x) for identification of CD86+ cells (green color). Scale bar in right lower corner represents 20µm. K) Analytical result of number of CD68+ cells, * vs. other groups with different symbols (†, ‡, §), P<0.0001. L to O) Illustrating the immunohistochemical microscopic finding (200x) for identification of fibrotic area (blue color). Scale bar in right lower corner represents 50µm. P) Analytical result of fibrotic area, * vs. other groups with different symbols (†, ‡, §), P<0.0001. Q) Protein expression of tumor necrosis factor (TNF)-α, * vs. other groups with different symbols (†, ‡, §), P<0.0001. R) Protein expression of matrix metalloproteinases (MMP)-9, * vs. other groups with different symbols (†, ‡, §), P<0.0001. All statistical analyses were performed by one-way ANOVA, followed by Bonferroni multiple comparison post hoc test (n=6-10 for each group). Symbols (*, †, ‡, §) indicate significance (at 0.05 level). SC = sham-operated control; IS = ischemic stroke; IS + ADMSCs; IS + PrPC-OE in ADMSCs.
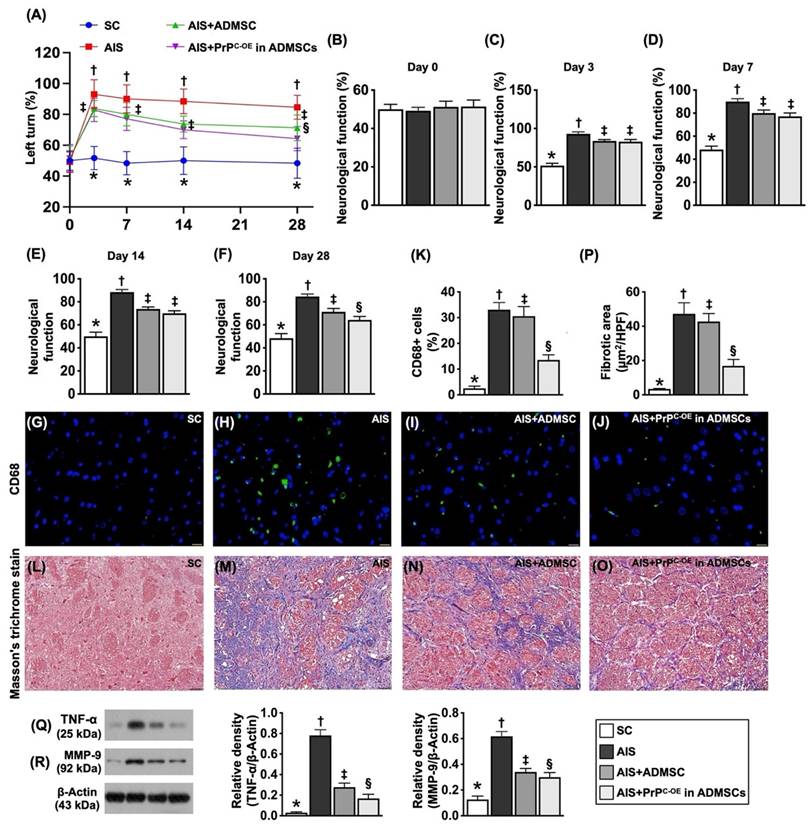
To investigate whether ADMSCs with and without PrPC-OE repress the inflammatory reaction and fibrotic formation, we utilized IF and IHC staining in an in vivo study. The results revealed that the cellular expression level of CD68, an index of inflammation, and the fibrotic area (i.e., by Masson's trichrome stain) were lowest in Group 1, highest in Group 2, and significantly greater in Group 3 than in Group 4. Furthermore, the protein levels of TNF-α and MMP-9, two inflammatory biomarkers, were also expressed at similar levels to that of CD68. The findings in Figure 8, therefore, suggested that ADMSCs with PrPC-OE were superior to ADMSCs without PrPC-OE in suppressing inflammation and fibrosis and improving neurological outcomes.
ADMSCs/PrPC-OE in ADMSCs treatment effectively preserved the microstructural integrity of the neurons and myelin sheath by day 28 after acute IS. A to D) Illustrating the IF microscopic finding (400x) for identification of NeuN+ cells (pink color). E) Analytical result of number of NeuN+ cells, * vs. other groups with different symbols (†, ‡, §), P<0.0001. F to I) Illustrating the IHC microscopic finding (400x) for identification of cellular expression of myelin basic protein (MBP) (gray color). J) Analytical result of cellular expression of positively stained MBP, * vs. other groups with different symbols (†, ‡, §), P<0.0001. Scale bar in right lower corner represents 20µm. All statistical analyses were performed by one-way ANOVA, followed by Bonferroni multiple comparison post hoc test (n=6 for each group). Symbols (*, †, ‡, §) indicate significance (at 0.05 level). SC = sham-operated control; IS = ischemic stroke; PrPC-OE in ADMSCs = cellular prion protein overexpression in adipose-derived mesenchymal stem cells (ADMSCs).
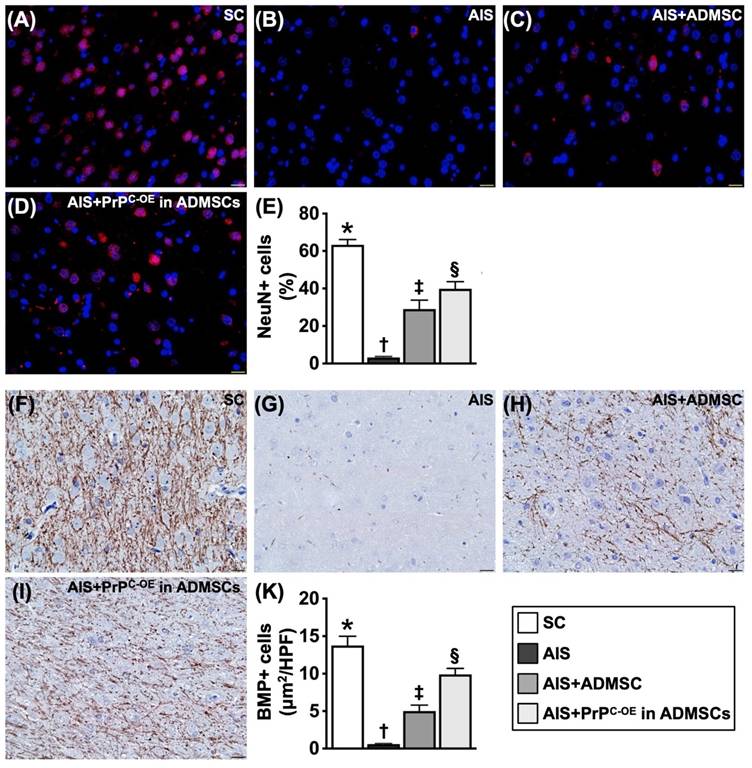
Treatment with ADMSCs with and without PrPC-OE preserved the microstructural integrity of neurons and the myelin sheath by Day 28 after acute IS (Figure 8)
IHC staining findings revealed that the cellular expression of myelin basic protein (MBP), an indicator of myelin sheath integrity, was highest in Group 1, lowest in Group 2 and significantly lower in Group 3 than in Group 4. Additionally, the IF staining findings demonstrated that the cellular expression level of NeuN, an marker of the integrity of neurons in the brain, exhibited a similar pattern to that of MBP among the groups.
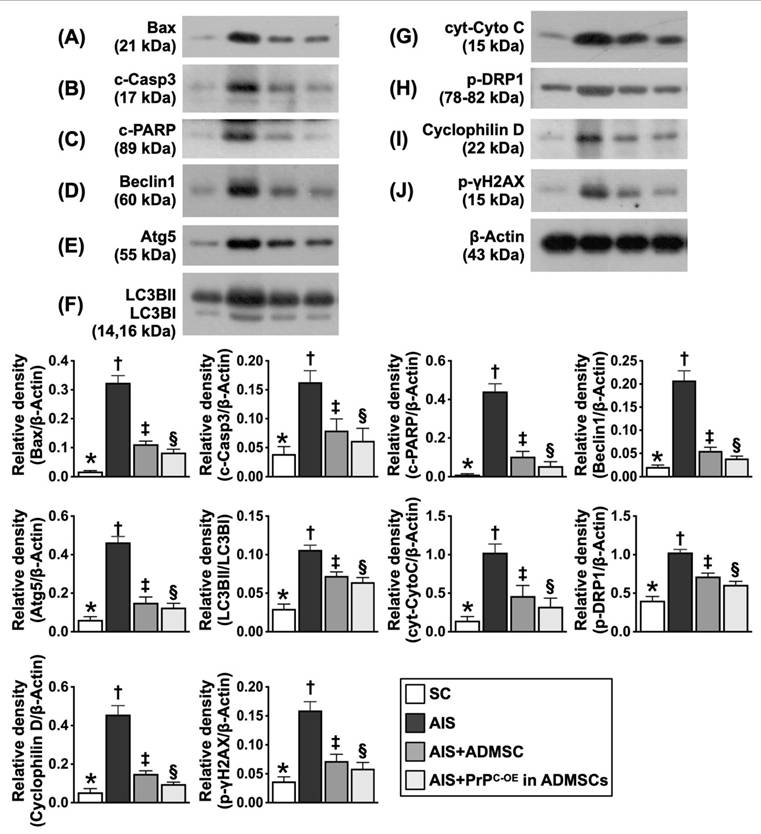
Assessment of the protein expression levels of markers of apoptosis, mitochondrial and DNA damage and autophagy in ischemic brain tissues at Day 28 after acute IS (Figure 9)
The protein expression levels of Bax, cleaved caspase 3 and cleaved PARP, three indicators of apoptosis, were significantly greater in Group 2 than in Group 1; these changes were reversed in Group 3 and further reversed in Group 4. Additionally, the protein expression levels of beclin-1 and Atg5 and the ratio of LC3BII to LC3BI, three indicators of autophagy, displayed an identical pattern to those of the apoptosis markers among the groups. Furthermore, the protein expression levels of cytosolic cytochrome C, p-DRP1 and cyclophilin D, three indices of mitochondrial damage, and the protein expression level of γ-H2AX, an index of DNA damage, exhibited identical patterns to those of the apoptosis markers among the groups.
Protein expressions of apoptosis, mitochondrial/DNA damage and autophagy. A) Protein expression of Bax, * vs. other groups with different symbols (†, ‡, §), P<0.0001. B) Protein expression of cleaved caspase 3 (c-Casp3), * vs. other groups with different symbols (†, ‡, §), P<0.0001. C) Protein expression-PARP, * vs. other groups with different symbols (†, ‡, §), P<0.0001. D) Protein expression of beclin-1, * vs. other groups with different symbols (†, ‡, §), P<0.0001. E) Protein expression of Atg5, * vs. other groups with different symbols (†, ‡, §), P<0.0001. F) Protein expression of the ratio of LC3BII to LC3BI, * vs. other groups with different symbols (†, ‡, §), P<0.0001. G) Protein expressions of cytosolic cytochrome C (cyt-CytoC), * vs. other groups with different symbols (†, ‡, §), P<0.0001. H) Protein expression of phosphorylated (p)-dynamin-1-like protein (DPR1), * vs. other groups with different symbols (†, ‡, §), P<0.0001. I) Protein expression of cyclophilin D, * vs. other groups with different symbols (†, ‡, §), P<0.0001. J) Protein expression of γ-H2AX, * vs. other groups with different symbols (†, ‡, §), P<0.0001. All statistical analyses were performed by one-way ANOVA, followed by Bonferroni multiple comparison post hoc test (n=6 for each group). Symbols (*, †, ‡, §) indicate significance (at 0.05 level). SC = sham-operated control; IS = ischemic stroke; PrPC-OE in ADMSCs = cellular prion protein overexpression in adipose-derived mesenchymal stem cells (ADMSCs).
Brain ischemic volume (BIV) by Day 28 after acute IS and schematic illustration of the underlying mechanism (Figure 10)
To further evaluate the anatomical features of the brain parenchyma, we utilized a brain MRI instrument. As we expected, by Day 28 after acute IS induction, brain MRI revealed that the BIV was lowest in Group 1, highest in Group 2 and significantly lower in Group 4 than in Group 3.
On the basis of our extensive works in the present study, we schematically illustrated the proposed mechanism by which the coordination between cyclin D1/CDK and PrPC activates mitogenic/cell proliferation signaling to improve neurological outcomes in IS rodents.
Discussion
This study investigated the underlying mechanism of the coordination between cyclin D1/CDK and PrPC to activate cell stress/cell proliferation and cell cycle signaling during treatment with ADMSCs with and without PrPC-OE to protect neurological function and neurological microstructural integrity in rats after acute IS, which has several notable implications. First, compared with that in the SC animals, the protein level of PrPC was significantly increased in the remote areas of the IS and in the IS area with and without ADMSC treatment and further increased in the IS area treated with ADMSCs with PrPC-OE. Second, the results of the in vitro study demonstrated that PrPC played a crucial role in increasing cell viability, proliferation and the wound healing rate and further upregulated the mitotic phases and cell cycle activation after treatment with ADMSCs with PrPC-OE. Third, the results of the in vitro study revealed that cyclin D1/CDK was the checkpoint regulating PrPC-mediated cell stress/proliferation signaling and promoting the rate of the cell cycle.
Intriguingly, our previous study demonstrated that PrPC, which was markedly increased in the myocardium after ischemia‒reperfusion injury, was essential for myocardial regeneration [39]. An essential finding in the present study was that, compared with those in the control group, the gene and protein expression levels of PrPC were markedly increased in the IS brain tissue and remote areas of the IS brain tissue, increased in the ADMSCs-treated brain tissues and presented further increases in the PrPC-OE ADMSCs-treated brain tissue. These findings highlighted that PrPC expression in brain tissues is commonly increased even in remote brain areas in response to ischemic stimulation and further increased in IS tissue after receiving combined IS stimulation and treatment with PrPC-OE ADMSCs. Accordingly, these findings strengthened the findings of our previous study [39].
The principal findings of the present study were that PrPC plays a fundamental role in increasing cell viability, cell stress/cell proliferation signaling, the wound healing process, and the generation of mitochondria, as well as promoting the rate of cell cycle and mitogenic signaling. Interestingly, our recent study [40] revealed that the rejuvenation of endothelial progenitor cells by PrPC-OE alleviated critical limb ischemia in rats and restored blood flow in the ischemic area, mainly through augmenting angiogenesis and cell stress signaling (i.e., p-PI3K/p-Akt/p-m-TOR). Additionally, our other recent study [41] revealed that valsartan/melatonin-facilitated ADMSCs safeguard residual kidney function in chronic kidney disease rats, mainly through increasing PrPC levels, resulting in the activation of cell stress signaling. Furthermore, our more recent study [36] revealed that ADMSCs with PrPC-OE effectively protected the rodent kidney against ischemia‒reperfusion injury, principally through increasing ATP/mitochondrial biogenesis. Although the results of our recent reports [36, 39, 41] corroborated the findings of the present study, the exact mechanism by which PrPC/PrPC-OE in ADMSCs contributes to protecting organs against ischemia-induced damage and dysfunction has not been clearly delineated by our recent investigations [36, 40, 41].
The most important finding in the present study was that cyclin D1/CDK coordinated with PrPC to promote cell stress/cell proliferation and cell cycle signaling, especially when PrPC-OE in ADMSCs was considered strategic management. Our findings clearly explained why the markers of inflammation, fibrosis, apoptosis, mitochondrial and DNA damage and autophagy were markedly reduced, whereas neurological function and neurological microstructural integrity were markedly increased in rat IS after receiving treatment with ADMSCs with and without PrPC-OE. We clearly and comprehensively show schematically (Figure 10F) the underlying mechanism by which neurological outcomes are significantly improved in the IS animals treated with ADMSCs with and without PrPC-OE.
Study limitations
This study has several limitations. First, the study period of only 28 days was relatively short, and long-term outcomes after MSCs treatment are currently unknown. Second, without the use of conditional gene knockout to eliminate gene effects in the brain, there is no direct evidence that the coordination of PrPC and cyclin D1/CDK in the brain can improve neurological outcomes after AIS. Third, to detect changes in autophagy accurately, multiple techniques need to be used simultaneously, such as the use of inhibitors of different stages of autophagy, electron microscopy, and a double-label mCherry-GFP-LC3B adenovirus, to produce convincing experimental results. However, the parameters of autophagy shown in Figure 9 were only assessed by Western blot analysis. Additionally, the LC3-II level can be easily affected by the duration of the experiment due to the rapid autophagy process, which can result in the possibility of inaccuracy. Accordingly, we would like to caution the readers to interpret the parameters judiciously.
In conclusion, the results of the present study demonstrated that the coordination of cyclin D1/CDK with PrPC in ADMSCs activated cell stress/proliferation signaling and promoted the rate of the cell cycle, resulting in improved neurological outcomes in rodents after acute IS.
Acknowledgements
This study was supported by a program grant from Chang Gung Memorial Hospital, Chang Gung University (CMRPG8M0231).
Ethics approval and consent to participate
All animal procedures were approved by the Institute of Animal Care and Use Committee at Kaohsiung Chang Gung Memorial Hospital (Affidavit of Approval of Animal Use Protocol No. 2021081802) and performed in accordance with the Guide for the Care and Use of Laboratory Animals.
Availability of data and materials
The data that support the findings of this study are available from the corresponding authors upon reasonable request.
Competing Interests
The authors have declared that no competing interest exists.
References
1. Organization WH. Global health estimates 2016: deaths by cause, age, sex, by country and by region, 2000-2016. Geneva: World Health Organization. 2018:1242-7
2. Nowbar AN, Gitto M, Howard JP, Francis DP, Al-Lamee R. Mortality from ischemic heart disease: Analysis of data from the World Health Organization and coronary artery disease risk factors From NCD Risk Factor Collaboration. Circulation: cardiovascular quality and outcomes. 2019;12:e005375
3. Virani SS, Alonso A, Benjamin EJ, Bittencourt MS, Callaway CW, Carson AP. et al. Heart Disease and Stroke Statistics-2020 Update: A Report From the American Heart Association. Circulation. 2020;141:e139-e596
4. Kapil N, Datta YH, Alakbarova N, Bershad E, Selim M, Liebeskind DS. et al. Antiplatelet and Anticoagulant Therapies for Prevention of Ischemic Stroke. Clin Appl Thromb Hemost. 2017;23:301-18
5. Shrestha S, Coy S, Bekelis K. Oral Antiplatelet and Anticoagulant Agents in the Prevention and Management of Ischemic Stroke. Curr Pharm Des. 2017;23:1377-91
6. Bala MM, Celinska-Lowenhoff M, Szot W, Padjas A, Kaczmarczyk M, Swierz MJ. et al. Antiplatelet and anticoagulant agents for secondary prevention of stroke and other thromboembolic events in people with antiphospholipid syndrome. Cochrane Database Syst Rev. 2020;10:CD012169
7. Rabinstein AA. Update on Treatment of Acute Ischemic Stroke. Continuum (Minneap Minn). 2020;26:268-86
8. Kumar G, Uhrig D, Fowler S, DeLaney MC, Alexandrov AV. Intravenous Recombinant Tissue Plasminogen Activator Does Not Impact Mortality in Acute Ischemic Stroke at Any Time Point up to 6 Months: A Systematic Review and Meta-Analysis of Randomized Controlled Clinical Trials. CNS Drugs. 2015;29:659-67
9. Turner AC, Schwamm LH, Etherton MR. Acute ischemic stroke: improving access to intravenous tissue plasminogen activator. Expert Rev Cardiovasc Ther. 2020;18:277-87
10. Etherton MR, Gadhia RR, Schwamm LH. Thrombolysis beyond 4.5 h in Acute Ischemic Stroke. Curr Neurol Neurosci Rep. 2020;20:35
11. Broderick JP, Palesch YY, Demchuk AM, Yeatts SD, Khatri P, Hill MD. et al. Endovascular therapy after intravenous t-PA versus t-PA alone for stroke. N Engl J Med. 2013;368:893-903
12. Wang A, Abramowicz AE. Endovascular thrombectomy in acute ischemic stroke: new treatment guide. Curr Opin Anaesthesiol. 2018;31:473-80
13. Hasan TF, Todnem N, Gopal N, Miller DA, Sandhu SS, Huang JF. et al. Endovascular Thrombectomy for Acute Ischemic Stroke. Curr Cardiol Rep. 2019;21:112
14. Papanagiotou P, Ntaios G. Endovascular Thrombectomy in Acute Ischemic Stroke. Circ Cardiovasc Interv. 2018;11:e005362
15. Winstein CJ, Stein J, Arena R, Bates B, Cherney LR, Cramer SC. et al. Guidelines for Adult Stroke Rehabilitation and Recovery: A Guideline for Healthcare Professionals From the American Heart Association/American Stroke Association. Stroke. 2016;47:e98-e169
16. Burris JE. Stroke Rehabilitation: Current American Stroke Association Guidelines, Care, and Implications for Practice. Mo Med. 2017;114:40-3
17. Ganesh A, Luengo-Fernandez R, Pendlebury ST, Rothwell PM. Long-Term Consequences of Worsened Poststroke Status in Patients With Premorbid Disability. Stroke. 2018;49:2430-6
18. Garcia-Ptacek S, Contreras Escamez B, Zupanic E, Religa D, von Koch L, Johnell K. et al. Prestroke Mobility and Dementia as Predictors of Stroke Outcomes in Patients Over 65 Years of Age: A Cohort Study From The Swedish Dementia and Stroke Registries. J Am Med Dir Assoc. 2018;19:154-61
19. Sennfalt S, Norrving B, Petersson J, Ullberg T. Long-Term Survival and Function After Stroke: A Longitudinal Observational Study From the Swedish Stroke Register. Stroke. 2019;50:53-61
20. Ganesh A, Luengo-Fernandez R, Rothwell PM. Late functional improvement and 5-year poststroke outcomes: a population-based cohort study. J Neurol Neurosurg Psychiatry. 2020;91:831-9
21. Wang X, Moullaali TJ, Ouyang M, Billot L, Sandset EC, Song L. et al. Influence of Including Patients with Premorbid Disability in Acute Stroke Trials: The HeadPoST Experience. Cerebrovasc Dis. 2021;50:78-87
22. Sennfalt S, Pihlsgard M, Norrving B, Ullberg T, Petersson J. Ischemic stroke patients with prestroke dependency: Characteristics and long-term prognosis. Acta Neurol Scand. 2021;143:78-88
23. Losordo DW, Henry TD, Davidson C, Sup Lee J, Costa MA, Bass T. et al. Intramyocardial, autologous CD34+ cell therapy for refractory angina. Circ Res. 2011;109:428-36
24. Lee FY, Chen YL, Sung PH, Ma MC, Pei SN, Wu CJ. et al. Intracoronary Transfusion of Circulation-Derived CD34+ Cells Improves Left Ventricular Function in Patients With End-Stage Diffuse Coronary Artery Disease Unsuitable for Coronary Intervention. Crit Care Med. 2015;43:2117-32
25. Sung PH, Lin HS, Lin WC, Chang CC, Pei SN, Ma MC. et al. Intra-carotid arterial transfusion of autologous circulatory derived CD34+ cells for old ischemic stroke patients - a phase I clinical trial to evaluate safety and tolerability. Am J Transl Res. 2018;10:2975-89
26. Yang CC, Sung PH, Cheng BC, Li YC, Chen YL, Lee MS. et al. Safety and efficacy of intrarenal arterial autologous CD34+ cell transfusion in patients with chronic kidney disease: A randomized, open-label, controlled phase II clinical trial. Stem Cells Transl Med. 2020;9:827-38
27. Chen YL, Tsai TH, Wallace CG, Chen YL, Huang TH, Sung PH. et al. Intra-carotid arterial administration of autologous peripheral blood-derived endothelial progenitor cells improves acute ischemic stroke neurological outcomes in rats. Int J Cardiol. 2015;201:668-83
28. Chen KH, Chen CH, Wallace CG, Yuen CM, Kao GS, Chen YL. et al. Intravenous administration of xenogenic adipose-derived mesenchymal stem cells (ADMSCs) and ADMSCs-derived exosomes markedly reduced brain infarct volume and preserved neurological function in rat after acute ischemic stroke. Oncotarget. 2016;7:74537-56
29. Chen KH, Shao PL, Li YC, Chiang JY, Sung PH, Chien HW. et al. Human Umbilical Cord-Derived Mesenchymal Stem Cell Therapy Effectively Protected the Brain Architecture and Neurological Function in Rat After Acute Traumatic Brain Injury. Cell Transplant. 2020;29:963689720929313
30. Chen KH, Lin KC, Wallace CG, Li YC, Shao PL, Chiang JY. et al. Human induced pluripotent stem cell-derived mesenchymal stem cell therapy effectively reduced brain infarct volume and preserved neurological function in rat after acute intracranial hemorrhage. Am J Transl Res. 2019;11:6232-48
31. Yip HK, Lin KC, Sung PH, Chiang JY, Yin TC, Wu RW. et al. Umbilical cord-derived MSC and hyperbaric oxygen therapy effectively protected the brain in rat after acute intracerebral haemorrhage. J Cell Mol Med. 2021;25:5640-54
32. Sheu JJ, Lee MS, Wallace CG, Chen KH, Sung PH, Chua S. et al. Therapeutic effects of adipose derived fresh stromal vascular fraction-containing stem cells versus cultured adipose derived mesenchymal stem cells on rescuing heart function in rat after acute myocardial infarction. Am J Transl Res. 2019;11:67-86
33. Weissmann C. The state of the prion. Nat Rev Microbiol. 2004;2:861-71
34. Zomosa-Signoret V, Arnaud JD, Fontes P, Alvarez-Martinez MT, Liautard JP. Physiological role of the cellular prion protein. Vet Res. 2008;39:9
35. Roucou X, Giannopoulos PN, Zhang Y, Jodoin J, Goodyer CG, LeBlanc A. Cellular prion protein inhibits proapoptotic Bax conformational change in human neurons and in breast carcinoma MCF-7 cells. Cell Death Differ. 2005;12:783-95
36. Chen YT, Yang CC, Chiang JY, Sung PH, Shao PL, Huang CR. et al. Prion Protein Overexpression in Adipose-Derived Mesenchymal Stem Cells (ADMSCs) Effectively Protected Rodent Kidney Against Ischemia-Reperfusion Injury Via Enhancing ATP/Mitochondrial Biogenesis-Role of ADMSC Rejuvenation and Proliferation. Cell Transplant. 2023;32:9636897231211067
37. Chen K, Jiao X, Di Rocco A, Shen D, Xu S, Ertel A. et al. Endogenous Cyclin D1 Promotes the Rate of Onset and Magnitude of Mitogenic Signaling via Akt1 Ser473 Phosphorylation. Cell Rep. 2020;32:108151
38. Chen YL, Sheu JJ, Sun CK, Huang TH, Lin YP, Yip HK. MicroRNA-214 modulates the senescence of vascular smooth muscle cells in carotid artery stenosis. Mol Med. 2020;26:46
39. Sheu JJ, Chai HT, Chiang JY, Sung PH, Chen YL, Yip HK. Cellular Prion Protein Is Essential for Myocardial Regeneration but Not the Recovery of Left Ventricular Function from Apical Ballooning. Biomedicines. 2022;10:167
40. Yeh JP, Sung PH, Chiang JY, Huang CR, Chen YL, Lai JP. et al. Rejuvenated endothelial progenitor cells through overexpression of cellular prion protein effectively salvaged the critical limb ischemia in rats with preexisting chronic kidney disease. Stem Cell Res Ther. 2022;13:447
41. Yang CC, Sung PH, Chen KH, Chai HT, Chiang JY, Ko SF. et al. Valsartan- and melatonin-supported adipose-derived mesenchymal stem cells preserve renal function in chronic kidney disease rat through upregulation of prion protein participated in promoting PI3K-Akt-mTOR signaling and cell proliferation. Biomed Pharmacother. 2022;146:112551
Author contact
![]() Corresponding authors: Jun Guo, MD, The First Affiliated Hospital, Jinan University, Guangzhou 510630, China, 613 W, Huangpu Avenue, Guangzhou, China, 510630; Tel.: +86-020-38688963; Fax: +86-030-38688888; Email: dr.guojuncom. Hon-Kan Yip, MD, Kaohsiung Chang Gung Memorial Hospital, Kaohsiung, 833401, Taiwan, 123, Dapi Road, Niaosung Dist., Kaohsiung, 833401, Taiwan; Tel.: +886-7-7317123; Fax: +886-7-7322402; E-mail: han.gunghinet.net.
Corresponding authors: Jun Guo, MD, The First Affiliated Hospital, Jinan University, Guangzhou 510630, China, 613 W, Huangpu Avenue, Guangzhou, China, 510630; Tel.: +86-020-38688963; Fax: +86-030-38688888; Email: dr.guojuncom. Hon-Kan Yip, MD, Kaohsiung Chang Gung Memorial Hospital, Kaohsiung, 833401, Taiwan, 123, Dapi Road, Niaosung Dist., Kaohsiung, 833401, Taiwan; Tel.: +886-7-7317123; Fax: +886-7-7322402; E-mail: han.gunghinet.net.