Impact Factor ISSN: 1449-2288
- Issue 12; 2026
- Issue 11; 2026
- Issue 10; 2026
- Issue 9; 2026
- Issue 8; 2026
- Volume 22; 2026
- Past Issues
- Advance Articles
- Editorial Board
- Cover Images
- Index & Coverage
- Cover Suggestion
- Special Issues
1. Introduction
2. Materials and methods
3. Results
4. Discussion
Abbreviations
Supplementary Material
Acknowledgements
References

 Global reach, higher impact
Int J Biol Sci 2026; 22(5):2343-2360. doi:10.7150/ijbs.118613 This issue Cite
Research Paper
ANXA1-mediated mTOR/FABP4 Inhibition Drives Antifibrotic Macrophage Reprogramming in Lupus Nephritis
Juan Tao1†, Qingyu Cheng2† ![]() , Pinjie Zhang3, Guizhen Yu4, Qi Chen5, Manwen Yang6, Qiqin Wu6, Haopeng Fang6, Haibo Wu7, Xiaoyuan Song8, Zhu Chen1, Min Chen9,10, Xiaoming Meng11, Mingxing Lei12†, Tengchuan Jin2,13,14,15,16
, Pinjie Zhang3, Guizhen Yu4, Qi Chen5, Manwen Yang6, Qiqin Wu6, Haopeng Fang6, Haibo Wu7, Xiaoyuan Song8, Zhu Chen1, Min Chen9,10, Xiaoming Meng11, Mingxing Lei12†, Tengchuan Jin2,13,14,15,16 ![]()
1. Department of Rheumatology and Immunology, The First Affiliated Hospital of the USTC, Division of Life Sciences and Medicine, University of Science and Technology of China, Hefei 230001, China.
2. Institute of Health and Medicine, Hefei Comprehensive National Science Center, Hefei 230071, China.
3. Emergency Department, Peking University Shenzhen Hospital, Shenzhen 518000, China.
4. Kidney Disease Center, the First Affiliated Hospital, College of Medicine, Zhejiang University; Key Laboratory of Kidney Disease Prevention and Control Technology, Zhejiang Province; Institute of Nephrology, Zhejiang University; Zhejiang Clinical Research Center of Kidney and Urinary System Disease, Hangzhou 310003, China.
5. Department of Dermatology, The First Affiliated Hospital of the USTC, Division of Life Sciences and Medicine, University of Science and Technology of China, Hefei 230001, China.
6. Division of Life Sciences and Medicine, University of Science and Technology of China, Hefei 230027, China.
7. Department of Pathology, The First Affiliated Hospital of the USTC, Division of Life Sciences and Medicine, University of Science and Technology of China, Hefei 230001, China.
8. MOE Key Laboratory for Membraneless Organelles and Cellular Dynamics, Hefei National Laboratory for Physical Sciences at the Microscale, CAS Key Laboratory of Brain Function and Disease, School of Life Sciences, Division of Life Sciences and Medicine, University of Science and Technology of China, Hefei 230026, China.
9. Renal Division, Department of Medicine, Peking University First Hospital; Institute of Nephrology, Peking University; Key Laboratory of Renal Disease, Ministry of Health of China; Key Laboratory of Chronic Kidney Disease Prevention and Treatment (Peking University), Ministry of Education, Beijing 100034, China.
10. Research Units of Diagnosis and Treatment of Immune-Mediated Kidney Diseases, Chinese Academy of Medical Sciences, Beijing 100730, China.
11. Inflammation and Immune Mediated Diseases Laboratory of Anhui Province, the Key Laboratory of Anti-inflammatory of Immune Medicines, Ministry of Education, Anhui Institute of Innovative Drugs, School of Pharmacy, Anhui Medical University, Hefei 230032, China.
12. Key Laboratory of Biorheological Science and Technology of Ministry of Education and 111 Project Laboratory of Biomechanics and Tissue Repair, College of Bioengineering, Chongqing University, Chongqing 400044, China.
13. Laboratory of Structural Immunology, Key Laboratory of Immune Response and Immunotherapy, Division of Life Sciences and Medicine, University of Science and Technology of China, Hefei 230027, China.
14. CAS Key Laboratory of Innate Immunity and Chronic Diseases School of Life Sciences and Medical Center, University of Science and Technology of China, Hefei 230027, China.
15. Biomedical Sciences and Health Laboratory of Anhui Province, University of Science and Technology of China, Hefei 230027, China.
16. Clinical Research Hospital of Chinese Academy of Sciences (Hefei), University of Science and Technology of China, Hefei 230001, China.
† These authors contributed equally to this work.
Received 2025-5-31; Accepted 2026-1-12; Published 2026-2-4
Abstract

Inflammation and fibrosis are central pathological processes in lupus nephritis (LN). Annexin A1 (ANXA1), a protein highly expressed in myeloid cells, is a key modulator of inflammation and fibrosis. In this study, we found that renal ANXA1 expression was elevated in LN patients and correlated positively with the severity of fibrosis. Single-cell RNA sequencing identified a distinct monocyte-derived Anxa1+Spp1+ macrophage subset that expands during nephritis and displays a profibrotic transcriptional signature. Mechanistically, ANXA1 signals via the FPR2/ALX receptor to inhibit mTOR/FABP4 activity in macrophages, enhance fatty acid oxidation, and thereby drive a polarization shift toward an antifibrotic phenotype. Consequently, treatment with the ANXA1-mimetic peptide Ac2-26 attenuated macrophage-driven fibrosis, reduced renal lipid accumulation, and ameliorated kidney injury in lupus-prone mice. These findings underscore the critical role of ANXA1 and Anxa1+Spp1+ macrophages in renal fibrosis progression, offering novel therapeutic targets for LN.
Keywords: lupus nephritis, macrophage, annexin A1, renal fibrosis, lipid metabolic reprogramming
1. Introduction
Systemic lupus erythematosus (SLE) is a multisystem autoimmune disease characterized by pathogenic autoantibodies targeting nuclear antigens, immune complex deposition, and sustained inflammatory responses. Notably, 40-60% of SLE patients develop lupus nephritis (LN) [1], a serious renal complication of this systemic disorder. Despite substantial advances in diagnostic and therapeutic approaches for SLE/LN, the disease burden persists [2]. Over a 10-year period, approximately 13% of LN patients develop end-stage renal disease (ESRD) [3], which is characterized by severe renal fibrosis and sclerosis. The standard medical regimens for LN, which typically entail the concomitant use of corticosteroids and immunosuppressants [2, 4], are associated with a substantial burden of adverse effects. Historically, clinical trials for SLE/LN have often yielded disappointing results [5]. The urgency to develop innovative therapeutic strategies, especially those targeting novel immune checkpoints to facilitate precision medicine, is undeniable. Nevertheless, the cellular and molecular mechanisms underlying LN are still not fully understood [1, 6, 7].
Pathological fibrosis, characterized by excessive extracellular matrix (ECM) deposition, represents the terminal convergent mechanism underlying most chronic kidney disease (CKD) progression, with macrophages playing a crucial role in its pathogenesis [8-10]. Our earlier studies established renal fibrosis as the paramount pathological feature correlating with poor renal survival in LN populations [11]. Recent investigations have uncovered that metabolic reprogramming serves as a critical driver of renal fibrogenesis by disrupting cellular energetics and altering metabolite-mediated signaling cascades [8].
Annexin A1 (ANXA1), a 37-kDa calcium-dependent phospholipid-binding protein (previously termed lipocortin-1), is a glucocorticoid-inducible member of the annexin superfamily [12]. This pleiotropic mediator regulates diverse physiological processes including inflammatory resolution, cell homeostasis (proliferation/apoptosis balance), and ECM remodeling [13, 14]. It primarily expressed in myeloid cells, especially macrophages [13-15], exerts its effects through specific receptors such as FPR2/ALX, which are also predominantly found on macrophages [14, 16, 17]. Interestingly, accumulating evidence indicates that ANXA1, originally characterized as an anti-inflammatory factor, has been increasingly recognized as a multifunctional regulator involved in fibrotic progression [14, 18] and metabolic homeostasis [19, 20]. Despite its emerging role in LN, the specific contribution of ANXA1 to renal fibrosis in established disease remains ambiguous, highlighting a key area for translational research and therapeutic development.
In this study, we performed quantitative analyses of ANXA1 expression patterns in renal biopsy specimens from LN patients, and systematically correlated these patterns with clinical indices and histopathological features. Building on prior evidence of ANXA1 overexpression in myeloid compartments and the pivotal role of macrophages in CKD and LN pathogenesis [9, 21, 22], we utilized single-cell RNA sequencing (scRNA-seq) to characterize temporal heterogeneity in monocyte/macrophage populations at two distinct disease stages in MRL/lpr mice. This approach identified a pathogenic monocyte-derived macrophage subset (Anxa1+Spp1+ macrophages) with distinctive profibrotic characteristics that exhibited disease-stage-specific expansion during LN progression, concomitant with upregulated Anxa1 expression. Importantly, our findings demonstrate that ANXA1 may mitigate renal fibrosis in LN potentially by modulating the mTOR/FABP4 signaling pathway and improving fatty acid oxidation (FAO) in macrophages, thus driving the reprogramming of antifibrotic macrophages and curbing lipid accumulation. Furthermore, we evaluated the therapeutic efficacy of Ac2-26, a synthetic N-terminal ANXA1 peptide, in attenuating established nephritis in MRL/lpr lupus-prone mice.
2. Materials and methods
2.1 Experimental animals and materials
All experiments employed female MRL/lpr mice (SLAC Laboratory Animal Co., Shanghai) housed in specific pathogen-free conditions at the University of Science and Technology of China (USTC) Animal Center following institutional animal care protocols. For scRNA-seq, we examined pre-diseased mice aged 8 weeks without serum autoantibodies or proteinuria and nephritic mice ( > 18 weeks) with proteinuria levels ≥ 300 mg/dl persisting for more than two weeks (with four mice per group). For the treatment of MRL/lpr mice, 10-week-old MRL/lpr mice were subjected to Ac2-26 (2 mg/kg, in PBS) or vehicle (PBS) treatment (every 48 hours, intraperitoneally, with six mice per group). The Ac2-26 peptide was synthesized by MedChemExpress LLC (China), and the purity of Ac2-26 was 99.14%. After 10 weeks of administration, 24-hour urine was collected via a metabolic cage. Then, 20-week-old female MRL/lpr mice were fasted overnight and anesthetized. Whole blood (0.6-1.0 ml) was collected through the right atrium of the heart, and the kidneys were also collected. All animal experimental protocols were conducted following approval from the USTC Animal Ethics Committee (Ethical Approval No. USTCACUC26080122046). A comprehensive list of research antibodies and materials appears in Table S1.
2.2 Human subjects
Clinical samples were prospectively collected from the First Affiliated Hospital of USTC following institutional review board approval. Demographic and clinical characteristics of the LN cohort are systematically presented in Table S2, with comprehensive methodological details available in the Supplementary Methods section.
2.3 Single-cell RNA sequencing
scRNA-seq libraries were constructed using the Singleron GEXSCOPE platform following the manufacturer specifications. Briefly, cell suspensions (4×10⁵ cells/ml in PBS) were loaded onto microfluidic chips for single-cell capture using the Singleron Matrix system. Captured mRNA was reverse-transcribed from barcoded beads to generate first-strand cDNA, which was subsequently amplified by polymerase chain reaction (PCR). Following fragmentation and adapter ligation using the GEXSCOPE library preparation kit, final libraries were sequenced on an Illumina NovaSeq 6000 platform (150 bp paired-end).
2.4 Statistical analysis
Continuous variables are expressed as mean ± standard deviation for normally distributed data or median (interquartile range) for non-parametric distributions. Intergroup comparisons were performed using Student's t-test or Mann-Whitney U test, as appropriate based on data distribution characteristics. Statistical significance was defined as a two-tailed P value < 0.05. All analyses were conducted using SPSS Statistics (version 24.0, IBM Corp.) or R [23].
3. Results
3.1 Elevated ANXA1 expression correlates with renal fibrosis and impaired kidney function in patients with LN
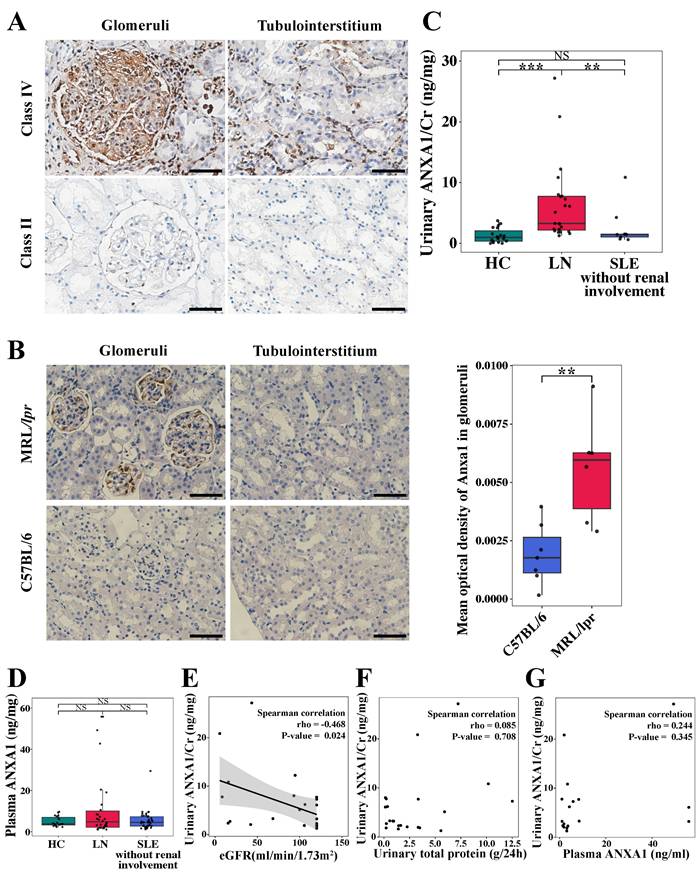
Immunohistochemical staining was performed to quantify ANXA1 protein expression in renal biopsy specimens from LN patients. As shown in Figure 1A, ANXA1 levels were elevated in human LN tissues. Notably, in quantitative analyses across a cohort encompassing all LN classes, ANXA1 expression exhibited a progressive increase corresponding to the severity of renal injury in both glomerular and tubulointerstitial compartments (Figure 1A; Table 1; Table S3). The detailed histopathological classification is presented in Table S2. Furthermore, glomerular ANXA1 expression intensity demonstrated significant correlations with multiple clinicopathological parameters in LN patients (all P < 0.05; Table 1), including histological classification (nonproliferative vs proliferative), crescent formation (cellular/fibrocellular), NIH chronicity scores, glomerulosclerosis, and interstitial fibrosis. Comprehensive correlation analyses between tubulointerstitial ANXA1 expression patterns and clinicopathological parameters were conducted, with detailed results provided in Table S3. In complementary murine studies, renal Anxa1 expression remained undetectable in control C57BL/6 mice but was markedly upregulated in MRL/lpr glomeruli (Figure 1B). This injury-induced ANXA1 upregulation was further confirmed through quantitative image analysis (P < 0.01), establishing a consistent disease-associated expression pattern across human and murine models.
Renal ANXA1 is significantly elevated in LN. (A) Representative images of ANXA1 staining in the glomeruli and tubulointerstitium of human renal cortical tissue from LN patients with International Society of Nephrology/Renal Pathology Society class IV and class II disease. Bars = 50 μm. (B) Representative images of Anxa1 immunohistochemical staining of C57BL/6 (n = 7) and MRL/lpr (n = 6) mouse kidney sections and quantification of the results. Data analyses were performed by Student's t-test for two groups. Bars = 50 μm. (C) The level of urinary ANXA1/Cr in healthy controls (n = 19), LN patients (n = 23), and non-renal SLE patients (n = 9). Data analyses were performed by 1-way ANOVA followed by a Tukey test for 3 groups and expressed as mean ± SD. (D) The level of plasma ANXA1 in healthy controls (n = 19), LN patients (n = 30), and non-renal SLE patients (n = 40). Data analyses were performed by 1-way ANOVA followed by a Tukey test for 3 groups and expressed as mean ± SD. (E) Correlation analysis of the urinary ANXA1/Cr ratio and eGFR in LN patients (n = 23). (F) Correlation analysis of the levels of urinary ANXA1/Cr and total urinary protein in LN patients (n = 22). (G) Correlation analysis of the levels of urinary ANXA1/Cr and plasma ANXA1 in LN patients (n = 17). Correlations were all determined by Spearman analysis. *P < 0.05; **P < 0.01; ***P < 0.001. ANXA1: annexin A1; LN: lupus nephritis; Cr: creatinine; SLE: systemic lupus erythematosus; eGFR: estimated glomerular filtration rate.
Association between glomerular ANXA1 expression and clinicopathological features in patients with lupus nephritis (n = 33).
| Glomerular ANXA1 expression | ||
|---|---|---|
| Clinical features | P value | |
| Hypertension (No/Yes) | 0.003 (0.001, 0.029)/0.011 (0.002, 0.031) | 0.316 |
| NS (No/Yes) | 0.021 (0.002, 0.059)/0.007 (0.001, 0.027) | 0.302 |
| AKI (No/Yes) | 0.003 (0.001, 0.020)/0.021 (0.003, 0.051) | 0.048 |
| Hematuria1(No/Yes) | 0.003 (0, 0.044)/0.011 (0.001, 0.030) | 0.567 |
| Leukocyturia (noninfectious)2(No/Yes) | 0.019 (0.002, 0.035)/0.003 (0.001, 0.009) | 0.047 |
| r value | P value | |
| Age (years) | 0.428 | 0.013 |
| SLEADI | -0.151 | 0.403 |
| Hb (g/L) | -0.007 | 0.971 |
| Urinary protein (g/day) | 0.178 | 0.347 |
| Serum creatinine (μmol/L) | 0.970 | 0.592 |
| C3 level (g/L) | 0.068 | 0.709 |
| C4 level (g/L) | -0.079 | 0.661 |
| Anti-dsDNA antibodies | -0.121 | 0.533 |
| Anti-C1q antibodies | -0.474 | 0.008 |
| Renal histopathologic features (light microscopy) | P value | |
| Histologic classes (nonproliferative/proliferative) | 0 (0, 0.003)/0.011 (0.001, 0.032) | 0.045 |
| Neutrophils exudation/karyorrhexis (No/Yes) | 0.003 (0, 0.028)/0.009 (0.001, 0.030) | 0.448 |
| Fibrinoid necrosis (No/Yes) | 0.009 (0.001, 0.033)/0.007 (0.001, 0.018) | 0.385 |
| Mesangial hypercellularity (No/Yes) | 0.002 (0.001, 0.021)/0.013 (0.001, 0.034) | 0.235 |
| Endocapillary hypercellularity (No/Yes) | 0.004 (0.001, 0.028)/0.013 (0.001, 0.043) | 0.377 |
| Hyaline deposits (No/Yes) | 0.016 (0, 0.043)/0.004 (0.001, 0.020) | 0.602 |
| r value | P value | |
| AI | 0.023 | 0.921 |
| Cellular/fibrocellular crescents | 0.359 | 0.043 |
| Interstitial inflammation | 0.168 | 0.349 |
| CI | 0.548 | 0.010 |
| Glomerulosclerosis | 0.576 | <0.001 |
| Tubular atrophy | 0.202 | 0.260 |
| Interstitial fibrosis | 0.373 | 0.033 |
| Tubulointerstitial ANXA1 expression | 0.942 | <0.001 |
| Renal histopathologic features (direct immunofluorescence) | P value | |
| IgG deposition (≤2+/>2+) | 0.003 (0.001, 0.034)/0.010 (0.001, 0.027) | 0.773 |
| IgA deposition (≤2+/>2+) | 0.008 (0.001, 0.024)/0.009 (0.002, 0.034) | 0.373 |
| C3c deposition (≤2+/>2+) | 0.010 (0.001, 0.022)/0.007 (0.001, 0.031) | 0.821 |
| C1q deposition (≤2+/>2+) | 0.012 (0.001, 0.034)/0.004 (0.001, 0.016) | 0.506 |
Notes: 1Defined as red blood cell count ≥ 5/HPF, 2Defined as WBC ≥ 5/HPF. NS: nephrotic syndrome; AKI: acute kidney injury, is defined as any of the following criteria on the basis of the KDIGO criteria: an increase in serum creatinine of × 0.3 mg/dl (× 26.5 µmol/L) within 48 hours or an increase in serum creatinine to × 1.5 times baseline, which is known or presumed to have occurred within the previous 7 days, or a urine volume < 0.5 ml/kg per hour for 6 hours; SLEDAI: systemic lupus erythematosus disease activity index; Hb: hemoglobin; C3: complement component 3; C4: complement component 4; dsDNA: double-stranded DNA; NIH: National Institutes of Health; AI: NIH activity index; CI: NIH chronicity index. Data analyses were performed by Mann-Whitney U test for two groups. Correlations were carried out via the Spearman test. Data expressed as median (interquartile ranges).
Quantitative analysis revealed distinct ANXA1 expression patterns in urine and plasma across study cohorts (Figure 1C and D). Urinary ANXA1/Cr ratios were significantly elevated in LN patients compared to both non-renal SLE patients (6.38 ± 6.43 vs. 2.60 ± 3.28 ng/mg, P < 0.01) and healthy controls (6.38 ± 6.43 vs. 1.28 ± 1.17 ng/mg, P < 0.001; Figure 1C). Notably, urinary ANXA1/Cr demonstrated a significant inverse correlation with estimated glomerular filtration rate (eGFR) (Spearman's rho = -0.468, P < 0.05), while showing no association with proteinuria (Spearman's rho = 0.085, P > 0.05) (Figure 1E and F). In contrast, plasma ANXA1 concentrations did not differ significantly among the three groups (Figure 1D). Furthermore, urinary ANXA1 excretion was not correlated with plasma ANXA1 levels (Spearman's rho = 0.244, P = 0.345) in LN patients (Figure 1G). These findings suggest that elevated ANXA1 is associated with renal fibrosis and dysfunction in LN.
3.2 Single-cell RNA sequencing revealed diverse monocyte/macrophage subpopulations in MRL/lpr mice
Together with our earlier observations [22], the immunofluorescence staining results presented in Figure S1 further demonstrate a strong correlation between renal macrophage infiltration and disease progression in lupus nephritis. Furthermore, consistent with established literature [13-15, 24], analysis of a publicly available human LN dataset (GSE279823) by scRNA-seq demonstrated that ANXA1 is predominantly expressed in myeloid lineages, particular in macrophages, compared to other immune cell types (Figure S2). Immunofluorescence co-localization analysis revealed spatial association between ANXA1 and CD68⁺ macrophages in renal biopsy specimens from LN patients (Figure 2A). These findings suggest that macrophage-derived ANXA1 may represent a key modulator in the pathogenesis of LN, potentially serving as a therapeutic target for modulating macrophage-mediated inflammatory and fibrotic responses.
Single-cell RNA sequencing revealed diverse monocyte/macrophage subpopulations in MRL/lpr mice. (A) Representative confocal microscopy images showing the expression of ANXA1 in macrophages (CD68) in kidneys from patients with lupus nephritis. Bars = 20 μm. (B) Schematic of the single-cell RNA sequencing study design. Samples were isolated from the kidneys and blood of pre-diseased and nephritic MRL/lpr mice (n = 4 per group). Kidneys were digested into single-cell suspensions. Live cells were subjected to fluorescence-activated cell sorting and loaded for single-cell RNA sequencing. (C) Uniform manifold approximation and projection plot colored according to monocyte/macrophage clusters depicting monocyte/macrophage annotation. (D) Dot plot displaying the representative marker genes in each monocyte/macrophage subpopulation identified through unsupervised clustering. (E) Summary of the proportions of assigned cell types in the pre-diseased and nephritic groups.
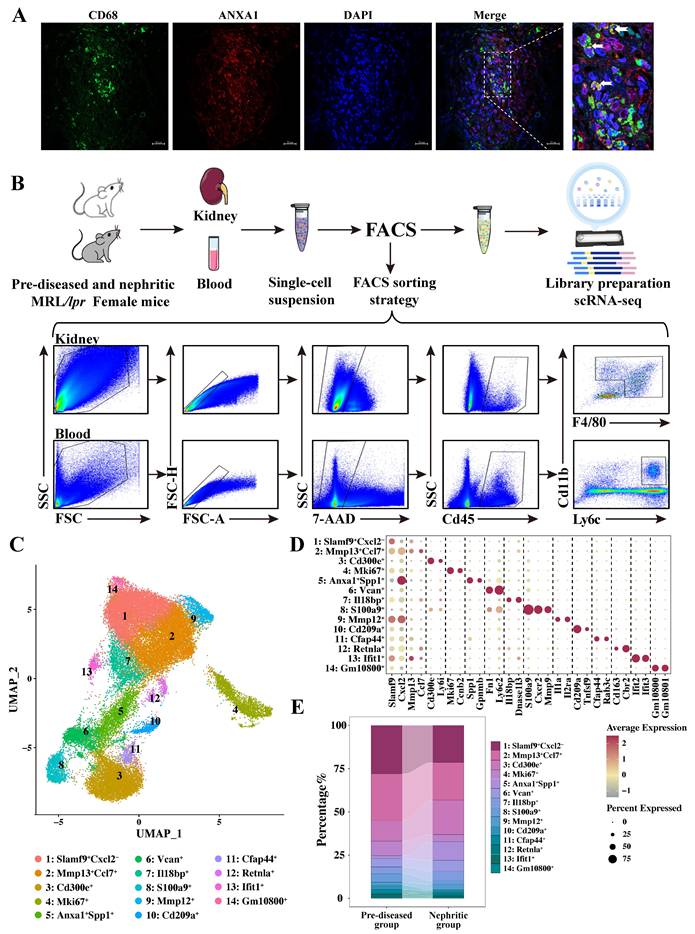
We conducted scRNA-seq analysis on fluorescence-activated cell sorting (FACS)-purified live cells obtained from kidney and blood samples of female MRL/lpr mice at two distinct disease timepoints: pre-diseased and established nephritis (Figure 2B). Using the Singleron microfluidic chip platform, we characterized 116,950 sorted cells after applying quality control filters, which included 55,676 pre-diseased and 61,274 nephritic mouse single cells. Integrated single-cell transcriptomes were visualized using uniform manifold approximation and projection (UMAP) following batch correction, revealing 15 transcriptionally distinct clusters through unsupervised clustering (Figure S3A). Cell cluster identities were annotated based on statistically significant expression of established lineage-specific markers (Figure S3B). Subsequent analysis of monocyte/macrophage markers (Adgre1, Cx3cr1, Csf1r, Cd14, Fcgr3, and C1qa; Figure S3C) identified 37,143 cells as monocytes/macrophages.
To further characterize their heterogeneity and phenotype, these monocytes/macrophages were subdivided into 14 transcriptionally distinct subpopulations based on different markers (Figure 2C, D, and Table S4). Nonlinear dimensionality reduction via UMAP revealed distinct transcriptional landscapes of monocyte/macrophage subpopulations at each stage (Figure S3D). A remarkably heterogeneous distribution of cells at each stage was primarily identified within individual monocyte/macrophage subsets (Figure 2E, Table S5). In response to nephritis, a decrease in the cellular proportion was observed in Clusters 1, 2, 4, 8, 10, 11, 13, and 14, whereas an increase was observed in Clusters 3, 6, 7, 9, and 12, with a particularly sharp six-fold increase in Cluster 5. These shifts provide valuable insights into the dynamic changes in monocyte/macrophage populations during the progression of LN.
3.3 The origin of monocyte/macrophage subpopulations during LN disease progression
Systematic evaluation of established infiltrating versus resident monocyte/macrophage markers, combined with tissue enrichment analysis, revealed distinct spatial partitioning of monocyte/macrophage subpopulations across defined clusters (Figure 3A). Clusters 1, 2, 7, and 9 were enriched predominantly in kidney samples but were nearly absent in blood samples. These clusters were the primary monocyte/macrophage clusters present during homeostasis (pre-diseased) and persisted in the nephritic kidney. Notably, Clusters 3, 5, 6, and 8 demonstrated conserved transcriptional profiles across compartments, maintaining topographical alignment between renal and circulatory UMAP embeddings. Taking these observations into account, along with the expression levels of infiltrating-resident markers (Figure S4A, B) and the Ro/e values (Figure 3B), Clusters 3, 5, 6, and 8 were defined as monocyte-derived infiltrating macrophages, whereas Clusters 1, 2, 7, and 9 were defined as kidney-resident macrophages. The Ro/e values more clearly indicated the recruitment of monocytes from the peripheral blood to the kidney in response to injury. This classification result was further supported by the infiltration and resident scores based on infiltrating-resident markers (Figure 3C, D). The relative cell abundance of each assigned typical infiltrating and resident macrophage cluster in the kidney in the pre-diseased and nephritic groups is shown in Table S6.
The origin and functional heterogeneity of monocyte/macrophage subpopulations during lupus nephritis disease progression. (A) Uniform manifold approximation and projection plots demonstrating the distribution of monocyte/macrophage clusters across two distinct stages and organs. (B) The tissue prevalence of each monocyte-derived infiltrating macrophage cluster was estimated by the Ro/e score. (C) Uniform manifold approximation and projection plots demonstrating the resident and infiltrating monocytes/macrophages. (D) Violin plots demonstrating the resident and infiltrating scores of the monocytes/macrophages. (E) Uniform manifold approximation and projection plots demonstrating the anti-inflammatory scores of the monocytes/macrophages. (F) Heatmap illustrating the normalized enrichment scores in gene set enrichment analysis for each predefined gene set, with the color gradient representing the normalized enrichment scores from negative (blue) to positive (red) values. (G) Illustration of the gene set enrichment analysis results for three specific biological processes, including antigen processing and presentation (green), wound healing (red), and sprouting angiogenesis (purple). (H) Violin plots illustrating the expression of six curated gene signatures in infiltrating and resident macrophages across two distinct stages. ***P < 0.001.
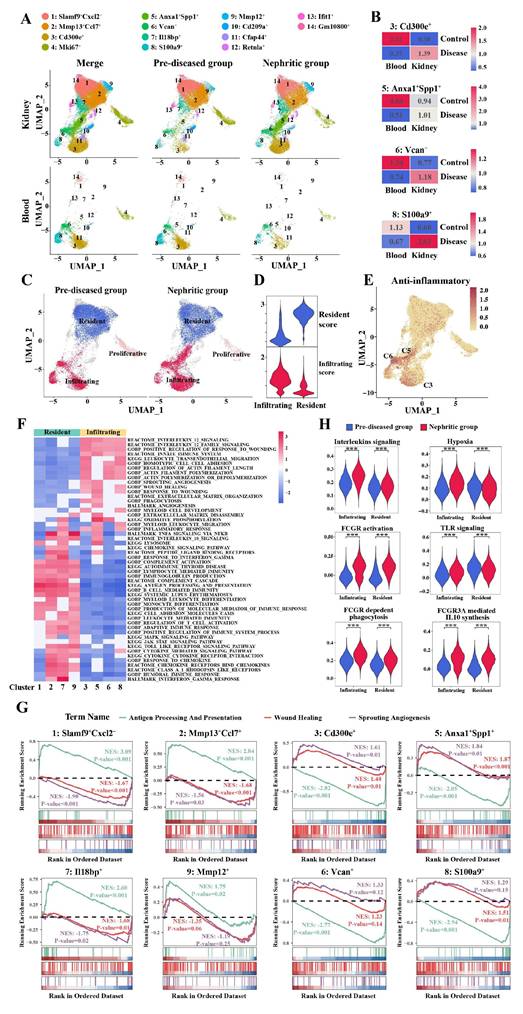
Among the infiltrating macrophages, Cluster 6 was characterized by the typical monocyte markers Ly6c2 and Ccr2 and the phagocytic partner Msr1 (Figure S5A, B). Cluster 3 demonstrated reduced Ly6c2 expression and specific expression of Cd36, a marker of M2 macrophages, as well as high expression of Nr4a1 and Itgal (Figure S5A-D). Cluster 5 was also characterized by decreased expression of Ly6c2 (Figure S5A, B) and high expression of both Anxa1 and Spp1, which was subsequently described. Intriguingly, Clusters 3, 5, and 6 presented distinct anti-inflammatory signatures (Figure 3E).
In addition to the monocyte marker genes Ly6c2 and Ccr2, Cluster 8 uniquely displayed neutrophil-related genes S100a8 and S100a9, but lacked Ly6g expression (Figure S5A, B, E, F). This signature suggests a granulocyte-monocyte progenitor (GMP)-derived neutrophil-like monocyte population [25, 26]. Consistent with this finding, Cluster 8 also highly expressed the inflammation-related genes Mmp9, Mmp8, and Il1r2, which strongly reflected the proinflammatory macrophage phenotype (Figure S5E, F). This detailed characterization of monocyte/macrophage subpopulations provides a deeper understanding of their distinct functional contributions to LN pathogenesis.
3.4 The functional heterogeneity of monocyte/macrophage subpopulations
To further delineate functional heterogeneity among individual macrophage/monocyte clusters, we performed gene set enrichment analysis (GSEA). Among the kidney-resident macrophages, GSEA revealed significant enrichment of biological functions related to antigen processing/presentation, complement, chemokine signaling, proinflammatory signaling pathways, and Toll-like receptor (TLR) signaling (Figure 3F, G).
Among the infiltrating macrophages, Clusters 3, 5, 6, and 8 were primarily involved in IL-12 signaling and wound healing, whereas the activation of actin filament polymerization and filament length regulation was observed in these infiltrating subsets, with the exception of Cluster 5 (Figure 3F, G). In particular, Cluster 3 (Cd300e+) was also involved in phagocytosis and myeloid cell development, whereas Cluster 5 (Anxa1+Spp1+) and Cluster 6 (Vcan+) were involved in oxidative phosphorylation (Figure 3F), supporting their anti-inflammatory properties. In addition to being involved in wound healing and angiogenesis, Cluster 5 (Anxa1+Spp1+) also exhibited significant enrichment in biological functions related to lysosomes, IL-10 signaling, myeloid leukocyte migration, and ECM organization (Figure 3F). Cluster 8 (S100a9+) was enriched essentially in the cytokine-mediated signaling pathway and leukocyte transendothelial migration (Figure 3F).
During the progression of LN, infiltrating macrophages exhibited enhanced activation of key inflammatory pathways, including interleukin signaling, hypoxia response, Fcγ receptor-mediated signaling, and TLR pathways (Clusters 3, 5, 6, and 8) (Figure 3H). These findings demonstrate that both kidney-resident and infiltrating macrophages synergistically promote LN progression. Notably, infiltrating macrophages appear to function as primary pathogenic mediators, orchestrating critical molecular pathways that drive disease initiation and progression.
3.5 Anxa1+Spp1+ macrophages that accumulate in the nephritic kidney have profibrotic properties
Intriguingly, our comprehensive monocyte/macrophage atlas revealed a distinct Cluster 5 (Anxa1+Spp1+) that was markedly expanded in the nephritic kidney but scarcely detectable in the pre-diseased kidney (Figure 3A and Table S6). This cluster was defined by the co-expression of Anxa1 and Spp1 (Figure 4A, B). Notably, Anxa1 was among the most prominently upregulated genes in infiltrating macrophages relative to resident macrophages (Figure 4C). The “Anxa1+Spp1+” nomenclature thus highlights this specific co-expression pattern as a defining feature of the subset. As mentioned above, Cluster 5 (Anxa1+Spp1+) cells co-expressed canonical monocyte markers, including Ly6c2, Ccr2, and Msr1 (Figure S5A-B), suggesting their origin from monocyte-derived infiltrating macrophages that undergo phenotypic adaptation following renal injury. Notably, Cluster 5 (Anxa1+Spp1+) represented the most responsive macrophage subset during nephritis progression, demonstrating a six-fold increase in renal infiltration in the nephritic group compared to the pre-diseased cohort (Table S6).
Anxa1+Spp1+ macrophages that accumulate in nephritis kidneys have profibrotic properties. (A) Uniform manifold approximation and projection plots demonstrating the key markers (Anxa1 and Spp1) in Cluster 5 (Anxa1+Spp1+). (B) Expression of Anxa1 and Spp1 in distinct macrophage subsets. (C) Illustration of genes differentially expressed between resident and infiltrating macrophages. Each data point represents a gene, with the x-axis representing the differential percentage of cells expressing the corresponding gene. The y-axis represents the log2-fold change in gene expression. Genes significantly differentially expressed are highlighted, with upregulated genes in red and downregulated genes in blue. (D) Violin plots illustrating the expression of scar-associated genes across three monocyte-derived infiltrating macrophage subsets. (E) Violin plots illustrating the expression of fibrosis-associated genes across three monocyte-derived infiltrating macrophage subsets. (F) Gene set enrichment analysis results for six specific biological processes, including extracellular matrix (ECM) organization, hypoxia, mammalian target of rapamycin complex 1 signaling, ECM disassembly, fibroblast proliferation, and fibroblast migration, in Cluster 5 (Anxa1+Spp1+).
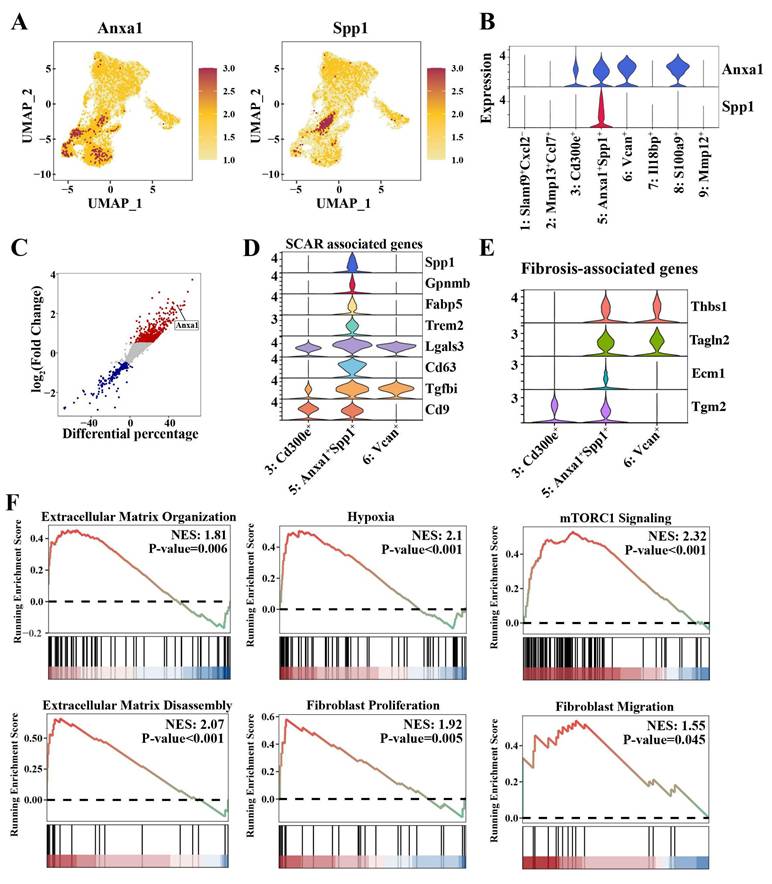
Cluster 5 (Anxa1+Spp1+) exhibited anti-inflammatory signatures similar to those of Cluster 3 (Cd300e+) and Cluster 6 (Vcan+) (Figure 3E). Nonetheless, this cluster was clearly distinguished from these two anti-inflammatory clusters through its elevated expression of a suite of scar-associated genes, including Spp1, Gpnmb, Fabp5, Trem2, Lgals3, Cd63, Tgfbi, and Cd9 (Figure 4D). In addition, Cluster 5 (Anxa1+Spp1+) exhibited a pro-fibrotic transcriptomic signature, encompassing TGF-β-regulated genes (Thbs1), canonical myofibroblast markers (Tagln2), and genes encoding ECM components (Ecm1) and ECM crosslinkers (Tgm2) (Figure 4E).
Furthermore, hypoxia signaling, which plays a major role in triggering and perpetuating profibrotic mechanisms, was highly activated in this cluster (Figure 4F). More importantly, ECM organization and disassembly and fibroblast proliferation and migration were also activated in Cluster 5 (Anxa1+Spp1+) (Figure 3F, 4F). Notably, the mammalian target of rapamycin complex 1 (mTORC1) signaling was also activated in Cluster 5 (Anxa1+Spp1+) (Figure 4F). To investigate the direct role of Spp1, we established a stable Spp1-overexpressing RAW264.7 macrophage line via lentiviral transduction. Spp1 overexpression promoted a profibrotic signature, characterized by increased mRNA expression of Lgals3 and Tgf-β and elevated protein levels of collagen I, fibronectin, and α-SMA (Figure S6). Collectively, these findings indicate that Cluster 5 (Anxa1+Spp1+) may possess profibrotic functions and potentially initiate fibrosis.
3.6 Effects of Anxa1 on the dynamic functional plasticity of monocyte-derived macrophages
Considering the microenvironment-dependent plasticity of macrophages, we performed RNA velocity analysis and pseudotime trajectory inference using scVelo [27] and Monocle 3 [28] (Figure 5A, B). RNA velocities, as vectors in gene expression space, signify the direction and speed of cellular movement, providing an approximation of future transcriptional states. As shown in Figure 5A, the velocities were projected onto the UMAP embedding, distinctly illustrating the velocity vector directions from Cluster 3 (Cd300e+) and Cluster 6 (Vcan+) toward Cluster 5 (Anxa1+Spp1+). Accordingly, these three monocyte-derived infiltrating macrophage clusters were selected for subsequent analysis. We used Monocle 3 to construct a specific trajectory from Cluster 6 (Vcan+) and Cluster 3 (Cd300e+) toward Cluster 5 (Anxa1+Spp1+) (Figure 5B).
Dynamic functional plasticity of monocyte-derived macrophages and the effects of Anxa1 on macrophage polarization. (A) RNA velocity analysis via scVelo, illustrating the pseudotime trajectory of cells on the basis of their gene expression profiles. The arrows indicate the direction and magnitude of the RNA velocity, suggesting the likely future state of each cell along the trajectory. (B) Monocle 3 trajectory analysis of three monocyte-derived infiltrating macrophage subsets, including Cluster 3 (CD300e+), Cluster 5 (Anxa1+Spp1+), and Cluster 6 (Vcan+). The uniform manifold approximation and projection plot on the left displays three distinct subsets, and the cells in the right plot are elegantly color-coded to reflect their corresponding pseudotime. (C) Heatmap illustrating the patterns of gene expression within the two modules over pseudotime. (D) Uniform manifold approximation and projection plots illustrating the expression profiles of Cd63, Spp1, Fn1, and F13a1. (E) Uniform manifold approximation and projection plots illustrating the expression profiles of two gene modules. (F) Box plots illustrating the expression profiles of two gene modules in Cluster 5 (Anxa1+Spp1+) and Cluster 6 (Vcan+). (G) Quantitative real-time polymerase chain reaction (RT-qPCR) analysis of Anxa1, Nos2, Tnf-α, Spp1, and Tgf-β mRNA levels in RAW264.7 macrophages transfected with Anxa1 small interfering RNA under LPS stimulation. n = 9 per group. (H) RT-qPCR analysis of Nos2, Tnf-α, Spp1, and Tgf-β mRNA levels in RAW264.7 macrophages treated with 10 nM human recombinant ANXA1 for 24 h with or without WRW4 under LPS stimulation. n = 9 per group. Data analyses were performed by Student's t-test for two groups and two-way ANOVA followed by a Tukey test for multiple groups. *P < 0.05; **P < 0.01; ***P < 0.001.
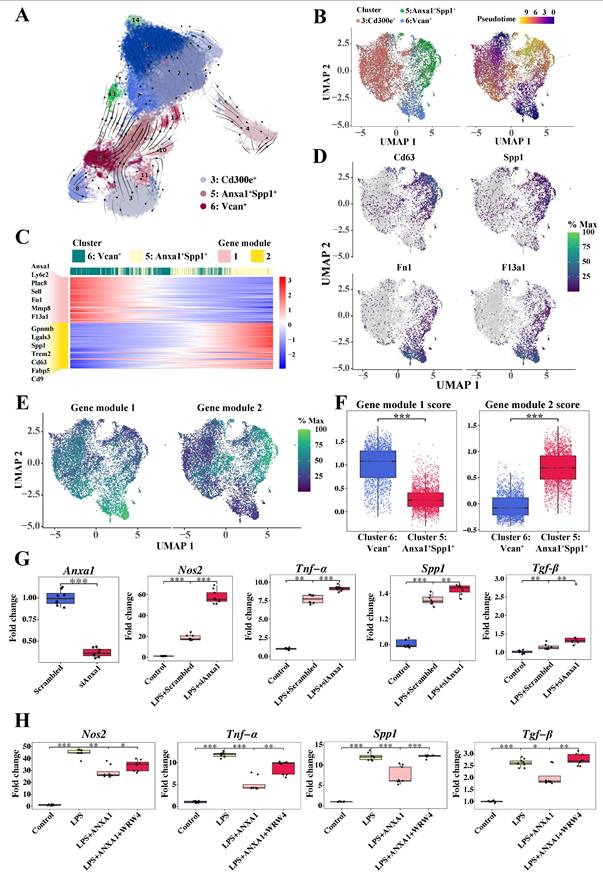
Given that Cluster 6 exhibited characteristic expression of monocyte markers Ly6c2 and Ccr2, we performed a comprehensive trajectory analysis to delineate the differentiation trajectory from Cluster 6 (Vcan+) to Cluster 5 (Anxa1+Spp1+). Gene dynamics changes alongside pseudotime, which were divided into two modules (Figure 5C), are illustrated. The M2 macrophage-related anti-inflammatory markers predominant in module 1, including Fn1 and F13a1, were highly expressed at the beginning of the trajectory, where Cluster 6 (Vcan+) was located, but gradually decreased alongside the pseudotime. Conversely, fibrosis-related markers predominant in module 2, including Cd63, Spp1, and Gpnmb, were initially expressed at low levels but increased to relatively high levels toward the end of the trajectory, where Cluster 5 (Anxa1+Spp1+) was preferentially located. Dynamic gene expression changes associated Cluster 6 (Vcan+) with an anti-inflammatory role and Cluster 5 (Anxa1+Spp1+) with a profibrotic role, pointing to phenotypic and functional transitions of these macrophages following renal infiltration.
To elucidate the above dynamic changes more clearly, we performed pseudotime trajectory analysis tracking representative marker expression dynamics (Figure 5D). This analysis revealed a coordinated cellular transition from the M2 anti-inflammatory phenotype to the profibrotic phenotype. Consistently, as shown in Figure 5E-F, gene module 1 scores progressively decreased, while module 2 scores increased within Cluster 5 (Anxa1+Spp1+), indicating a phenotypic switch from anti-inflammatory to profibrotic gene expression programs.
Collectively, these findings revealed that anti-inflammatory macrophages (Cluster 6 (Vcan+)) are likely to differentiate into newly appearing profibrotic macrophages (Cluster 5 (Anxa1+Spp1+)) under ongoing unresolved insult in the context of lupus, corroborating our prior clinical observations of M2 macrophage predominance in the human LN [22].
Furthermore, to explore the role of Anxa1 in the phenotypic conversion of macrophages, RAW264.7 macrophages were used to assess Anxa1-mediated polarization dynamics. Knocking down Anxa1 resulted in the upregulation of proinflammatory (Nos2 and Tnf-α) and profibrotic factors (Spp1 and Tgf-β) in response to LPS stimulation (Figure 5G). Treatment with human recombinant Annexin A1 protein (hrANXA1) significantly downregulated expression of proinflammatory (Nos2 and Tnf-α) and profibrotic genes (Spp1 and Tgf-β) (Figure 5H). Both previous studies [14, 16, 17] and our data demonstrate an interaction between ANXA1 and FPR2/ALX in macrophages (Figure S7). Pharmacological inhibition of FPR2/ALX using WRW4 (a selective FPR2/ALX antagonist) abrogated hrANXA1-mediated suppression of both inflammatory and fibrotic markers, establishing FPR2/ALX as the essential receptor for ANXA1's bioactivity (Figure 5H). The findings were further validated using bone marrow-derived macrophages (BMDMs), with complementary ELISA quantifying the secretion of Tnf-α and Tgf-β (Figure S8). Collectively, these data demonstrate that ANXA1 orchestrates macrophage polarization through FPR2/ALX-mediated signaling, while concomitantly suppressing the expression of fibrogenic markers, thereby promoting an anti-fibrotic transcriptional program.
3.7 Anxa1 regulates macrophage polarization through lipid metabolic reprogramming
Based on established roles of lipid metabolism in renal fibrogenesis [29, 30] and the known metabolic reprogramming of macrophages within the LN microenvironment [21], we focused on lipid- and fatty acid-related pathways in Cluster 5 (Anxa1+Spp1+) macrophages. Our observations revealed the activation of lipid storage, fatty acid biosynthesis, and reactive oxygen species metabolic processes within this cluster (Figure 6A). By analyzing the metabolic stress in this cluster, we noted a fatty acid metabolic imbalance, indicated by the accumulation of fatty acids in the nephritic group compared to pre-diseased controls (Figure 6B). In addition, increased metabolic flux from acetyl-CoA to fatty acids in the nephritic group was consistent with this accumulation (Figure 6B).
ANXA1 might regulate macrophage polarization through lipid metabolism reprogramming. (A) Illustration of the gene set enrichment analysis results in Cluster 5 (Anxa1+Spp1+) for six specific biological processes, including lipid storage, unsaturated fatty acid biosynthetic processes, fatty acid biosynthetic processes, reactive oxygen species metabolic processes, regulation of reactive oxygen species metabolic processes, and the reactive oxygen species pathway. (B) Predicted metabolic stress (upper) and flux changes (lower) in the pre-diseased group versus the nephritic group. (C) Heatmap illustrating the expression patterns of several lipid metabolisms reprogramming-associated genes between the pre-diseased and nephritic groups. (D) Violin plots illustrating the differential expression of Fabp4 and Fabp5 between the pre-diseased and nephritic groups. (E) Quantitative real-time polymerase chain reaction (RT-qPCR) analysis of Cpt1b, Fabp4, and Fabp5 mRNA levels in RAW264.7 macrophages transfected with Anxa1 small interfering RNA under LPS stimulation. n = 9 per group. (F) RT-qPCR analysis of Cpt1b, Fabp4, and Fabp5 mRNA levels in RAW264.7 macrophages treated with 10 nM human recombinant ANXA1 (hrANXA1) for 24 h under LPS stimulation. n = 9 per group. (G) Representative western blot bands and densitometric quantification of the expression of Fabp4 and the phosphorylation of the mammalian target of rapamycin (mTOR) in RAW 264.7 macrophages treated with 10 nM hrANXA1 for 24 h with or without WRW4. n = 3 per group. Data analyses were performed by Student's t-test for two groups and two-way ANOVA followed by a Tukey test for multiple groups. *P < 0.05; **P < 0.01; ***P < 0.001.
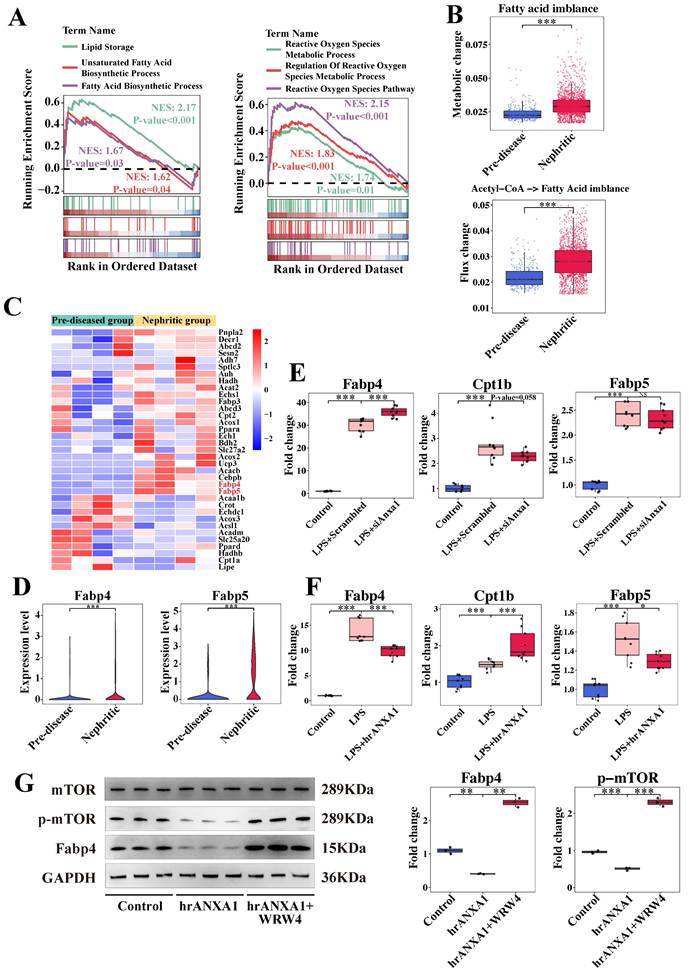
Transcriptomic profiling identified significant upregulation of fatty acid-binding proteins, such as Fabp4 and Fabp5, in nephritic macrophages (Figure 6C, D). In vitro studies showed that Anxa1 knockdown in LPS-stimulated macrophages resulted in the upregulation of Fabp4 and downregulation of Cpt1b (Figure 6E). This intervention did not have an obvious effect on Fapb5. Conversely, treatment with hrANXA1 induced a reduction in Fabp4 and Fabp5 mRNA expression and an increase in Cpt1b mRNA expression (Figure 6F). In addition, treatment with hrANXA1 significantly reduced Fabp4 expression and mTOR phosphorylation, while co-treatment with the FPR2/ALX antagonist WRW4 abrogated theses effects, confirming FPR2/ALX-dependent regulation of the mTOR/FABP4 axis (Figure 6G). This mechanistic link was further validated by functional experiments in Figure S9, S10. Pharmacological inhibition of Fabp4 in Anxa1-deficient macrophages downregulated proinflammatory (Nos2, Tnf-α) and profibrotic (Spp1, Tgf-β) gene expression, with reduced Tnf-α and Tgf-β secretion confirmed by ELISA (Figure S11), collectively demonstrating the critical role of Fabp4 in this pathway.
3.8 Ac2-26 exerts protective effects against renal injury and fibrosis in MRL/lpr mice
Based on the observed correlation between elevated renal ANXA1 expression and the expansion of profibrotic Anxa1+Spp1+ macrophages during fibrosis progression, we postulated that ANXA1 represents a potential therapeutic target in LN. Given its propensity for dimerization or tetramerization, the synthesized ANXA1 protein may trigger excessive immune responses in animals upon administration, which could adversely affect the therapeutic outcome. Thus, we treated MRL/lpr mice during the established phase of nephritis (weeks 10 to 20) with Ac2-26, a synthetic peptide mimicking the bioactive N-terminal domain of ANXA1 (Figure 7A). Ac2-26 administration significantly attenuated lupus-associated autoimmunity and preserved renal function, as shown by reduced serum levels of anti-dsDNA antibodies, lower serum creatinine levels and decreased proteinuria compared with PBS-treated controls (Figure 7B-D). Histopathological evaluation further demonstrated that Ac2-26 mitigated renal injury, with marked reductions in glomerular hypercellularity, mesangial matrix expansion, and glomerular endothelial damage (Figure 7E, based on grading standard in Table S7; more than 10 random glomeruli were counted from each animal). Sirius Red staining confirmed a decrease in renal fibrosis (Figure 7F), and immunohistochemistry revealed significantly reduced macrophage infiltration in Ac-26-treated kidneys (P < 0.01; Figure 7G).
Ac2-26 administration treats established nephritis in MRL/lpr mice. (A) Ac2-26 treatment protocol for MRL/lpr mice. Ac2-26 (2 mg/kg) or PBS treatments were administered i.p. every other day from weeks 10 to 20. n = 6 per group. (B) Levels of anti-dsDNA antibodies in different groups at 10 weeks and 20 weeks (n = 6). (C) Serum creatinine levels in different groups at 10 weeks and 20 weeks (n = 6). (D) Urinary protein/creatinine ratios in different groups at 10 weeks and 20 weeks (n = 6). (E) Representative sections of renal tissue stained with H&E, Masson's trichrome, PAS, and PASM staining and semi-quantitative evaluation of glomerulonephritis at 20 weeks. Bars = 50 μm. (F) Representative photomicrographs and quantitative analysis of Sirius Red staining at 20 weeks. n = 5 per group. Bars = 50 μm. (G) Immunohistochemical staining and quantitative analysis of F4/80 at 20 weeks. n = 5 per group. Bars = 50 μm. (H) Immunohistochemical staining and quantitative analysis of osteopontin (encoded by Spp1) at 20 weeks. n = 5 per group. Bars = 50 μm. (I) Representative photomicrographs and quantitative analysis of Oil Red O staining at 20 weeks. n = 5 per group. Bars = 50 μm. (J) Immunohistochemical staining and quantitative analysis of Fabp4 at 20 weeks. n = 5 per group. Bars = 50 μm. Data analyses were performed by Student's t-test for two groups. *P < 0.05; **P < 0.01; ***P < 0.001. i.p.: intraperitoneally; HE: hematoxylin-eosin; PAS: periodic acid-Schiff; PASM: periodic acid-silver methenamine.
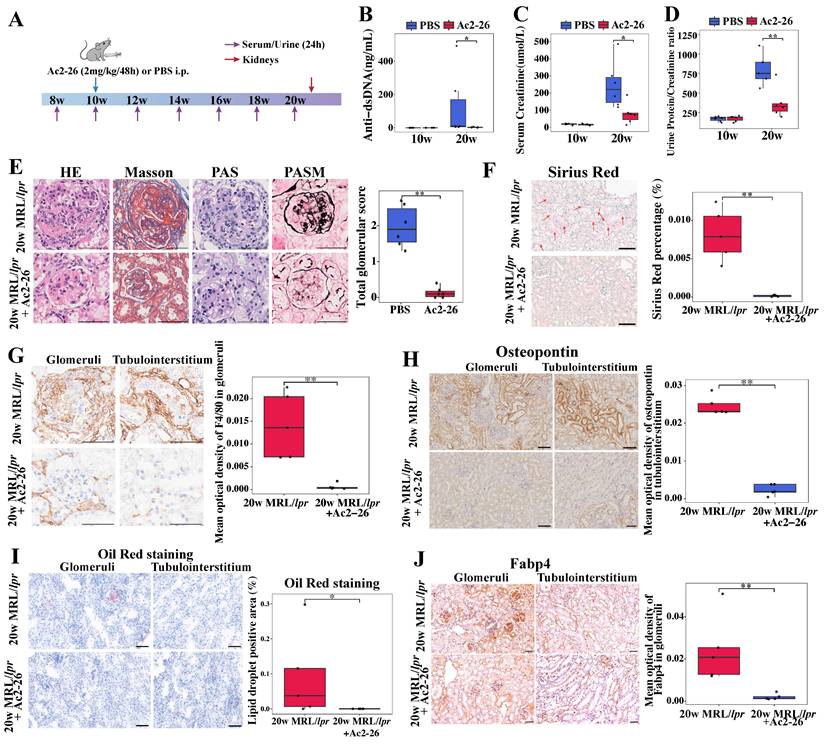
At the molecular level, Ac2-26 downregulated the expression of proinflammatory (Nos2 and Tnf-α) and profibrotic (Spp1 and Tgf-β) genes in renal tissue (Figure S12). Consistent with this, osteopontin (encoded by Spp1) protein expression was also reduced (Figure 7H). Furthermore, Ac2-26 treatment alleviated renal lipid accumulation, as evidenced by decreased Oil Red O staining (Figure 7I) and lowered renal expression of Fabp4 (Figure 7J). Together, these data indicate that Ac2-26 exerts renoprotective effects in murine LN by attenuating both inflammatory and fibrotic processes, modulating macrophage-driven pathology, and improving lipid metabolic dysregulation.
4. Discussion
While the protective effects of ANXA1 have been established in multiple disease contexts, its role in LN remains elusive. Here, our findings demonstrate that elevated renal ANXA1 expression correlates significantly with both fibrotic progression and renal dysfunction in LN patients. Notably, scRNA-seq analysis identified a distinct profibrotic macrophage subset (Anxa1+Spp1+) within nephritic kidneys, paradoxically exhibiting high Anxa1 expression. Functional studies revealed that ANXA1 promotes macrophage polarization toward an antifibrotic phenotype, potentially through regulating lipid metabolism reprogramming via the mTOR/FABP4 signaling pathway. Consequently, therapeutic administration of the ANXA1-mimetic peptide Ac2-26 in MRL/lpr mice effectively attenuated disease severity, as evidenced by reduced renal fibrosis and improved renal function.
While emerging data implicate ANXA1 in renal fibrogenesis, its functional contributions exhibit context-dependent duality-exhibiting both pro-resolutive and pro-fibrotic effects across studies [18]. Moreover, the molecular mechanisms underlying ANXA1-mediated fibrosis regulation remain undefined, and its pathophysiological role in LN has been insufficiently characterized. Interestingly, Ka et al. reported dense intracellular staining of ANXA1 in the fibrotic region of glomeruli, particularly during crescent formation in the LN [31]. In our studies on LN patients, significant associations were observed between kidney ANXA1 expression and the NIH chronicity index, glomerulosclerosis, crescent formation, and interstitial fibrosis—factors known to be associated with renal outcomes and progression to ESRD [11, 32]. Additionally, urinary ANXA1 excretion was markedly increased in LN patients and demonstrated significant association with disease severity. However, plasma ANXA1 levels did not differ significantly and showed no correlation with urinary excretion, indicating that kidney tissue origin of ANXA1 in the urine instead of being filtered solely from the blood.
Renal fibrosis pathogenesis is fundamentally shaped by infiltrating immune cells, particularly through their production of pro-fibrotic mediators [9, 33, 34]. While ANXA1 is predominantly expressed in myeloid lineages [24], macrophages have emerged as central effectors in both inflammatory and fibrotic renal pathology [10]. Moreover, a growing body of research has established a robust correlation between macrophage accumulation within lupus kidneys and disease progression [21, 22]. To precisely delineate the role of macrophage-derived ANXA1 in LN, we employed scRNA-seq analysis. One of the most striking findings from our scRNA-seq analysis was the identification and expansion of a previously undescribed subset of monocyte-derived, profibrotic myeloid cells, Anxa1+Spp1+ macrophages, in the LN. The prevalence of this subset exhibited dynamic fluctuations throughout the progression of LN. These cells exhibited robust expression of scar-associated genes, including Spp1, Gpnmb, Fabp5, Trem2, Lgals3, and CD63. Notably, while Trem2 might exert a protective effect against fibrosis, other genes are implicated in fibrosis progression [35-39]. These scar-associated gene expression patterns aligned with observations across various fibrotic conditions, characterized by the presence of a specific infiltrating macrophage phenotype known as scar-associated macrophages [40-42]. Furthermore, this subset demonstrated significant enrichment of profibrotic processes, including hypoxia response, ECM organization, and fibroblast activation. Pseudotime trajectory and RNA velocity analyses revealed a dynamic transition from anti-inflammatory macrophages to profibrotic Anxa1+Spp1+ macrophages, accompanied by a corresponding shift in gene expression programs, indicating their functional plasticity toward a fibrotic phenotype. The functional relevance of this transcriptional profile was further confirmed by gain-of-function experiments, in which Spp1 overexpression in macrophages directly induced a profibrotic response.
The most important finding of our study was the pronounced expression of Anxa1 in the infiltrating profibrotic Anxa1+Spp1+ macrophages. This was functionally validated by the ANXA1-mimetic peptide Ac2-26 protecting against renal damage by reducing fibrosis, maintaining kidney function, limiting macrophage infiltration and reducing osteopontin (encoded by Spp1) expression in MRL/lpr mice, while in vitro Anxa1 modulation directly regulated key fibrotic markers in macrophages. Together with observed renal ANXA1 upregulation in LN patients, these results establish a causal role for ANXA1 in regulating macrophage fibrogenic potential. We propose that the local upregulation of ANXA1 represents a compensatory mechanism to counteract fibrosis. Thus, the integration of transcriptional profiling, trajectory analysis, functional assays, therapeutic intervention and clinical evidence provides a compelling multi-layered argument for the role of Anxa1+Spp1+ macrophage in renal fibrosis.
Previous studies have shown that ANXA1 can direct macrophage polarization, thereby hastening muscle regeneration and protecting against cerebral ischemia-reperfusion injury through the FPR2/ALX-dependent AMPK/mTOR pathway [16, 17]. Building upon our previous clinical findings linking mTORC1 activation to LN progression [43] and the therapeutic efficacy of rapamycin in SLE [44], the current study localized mTORC1 hyperactivity to Anxa1+Spp1+ macrophages, and established ANXA1-mediated mTOR inhibition. These findings collectively suggest that ANXA1, in addition to mitigating inflammation, specifically inhibits fibrosis by modulating the profibrogenic characteristics of macrophages through mTORC1 signaling.
Notably, an increasing number of studies underscore the close relationship between dysregulated lipid metabolism and renal fibrosis [29, 30]. In our scRNA-seq study of Anxa1+Spp1+ macrophages, we observed increased signaling indicative of lipid accumulation and reactive oxygen species production, which suggested impaired FAO. Metabolic analysis further revealed significant accumulation of fatty acids in Anxa1+Spp1+ macrophages within the nephritic kidneys, which was confirmed by in vivo experiments. Fatty acid binding protein 4 (FABP4), a lipid chaperone protein regulated by mTOR signaling [45, 46], was markedly upregulated in Anxa1+Spp1+ macrophages during nephritis. Urine levels of FABP4 can serve as a biomarker to distinguish active renal involvement in LN [47]. Emerging evidence has established FABP4 as a critical mediator of renal fibrogenesis [48, 49]. Our functional studies established ANXA1 as a key regulator of this pathway, with Ac2-26 treatment reducing renal Fabp4 expression in lupus-prone mice. Mechanistically, our findings suggest that ANXA1 may counteract renal fibrosis by modulating the mTOR/FABP4 signaling pathway, improving FAO, and thus driving the reprogramming of macrophages toward an antifibrotic phenotype and reducing lipid accumulation in macrophages in the context of LN.
In summary, our findings demonstrate a significant correlation between elevated renal ANXA1 expression and fibrotic progression in human LN. scRNA-seq analysis further elucidated monocyte/macrophage heterogeneity, identifying a unique profibrotic Anxa1+Spp1+ macrophage subset with elevated Anxa1 expression in nephritic kidneys. Mechanistically, ANXA1 exerts antifibrotic effects through modulation of lipid metabolism via inhibition of the mTOR/FABP4 signaling pathway. Pharmacological intervention with the ANXA1 mimetic peptide Ac2-26 effectively attenuates renal injury in murine LN models. These discoveries collectively establish a robust rationale for developing ANXA1-based therapeutics targeting the mTOR/FABP4 axis as a novel therapeutic strategy for managing LN progression.
Several limitations warrant careful consideration when interpreting the findings of this study. Firstly, a methodological limitation lies in the absence of direct in vivo evidence confirming the profibrotic capacity of Anxa1+Spp1+ macrophages. To definitively establish their pathogenic role, future investigations employing conditional knockout models in conjunction with temporally-regulated macrophage depletion strategies would be essential. Secondly, while our data suggest that infiltrating monocytes serve as the primary precursors of Anxa1+Spp1+ macrophages, this conclusion remains inferential. Definitive determination will require advanced lineage-tracing methodologies, such as inducible genetic fate-mapping systems or parabiosis experiments, to conclusively substantiate this cellular origin.
Abbreviations
LN: lupus nephritis; ANXA1: Annexin A1; SLE: Systemic lupus erythematosus; ESRD: end-stage renal disease; CKD: chronic kidney disease; scRNA-seq: single-cell RNA sequencing; FAO: fatty acid oxidation; USTC: the University of Science and Technology of China; PCR: polymerase chain reaction; eGFR: estimated glomerular filtration rate; FACS: fluorescence-activated cell sorting; UMAP: uniform manifold approximation and projection; GSEA: gene set enrichment analysis; TLR: Toll-like receptor; ECM: extracellular matrix; mTORC1: the mammalian target of rapamycin complex 1; FABP4: fatty acid binding protein 4.
Supplementary Material
Supplementary methods, figures and tables 2-3, 5-7.
Supplementary table 1.
Supplementary table 4.
Acknowledgements
The authors are grateful to the Department of Nephropathy of the First Affiliated Hospital of USTC for human sample collection. The authors thank Prof. Bofeng Li from the Department of Rheumatology and Immunology of the First Affiliated Hospital of USTC for insightful discussion. The authors also thank Qian Wang at the flow cytometry core at the Experiment Center for Life Science of USTC for assistance with the FACS experiments.
Funding
This work was supported by grants from the National Natural Science Foundation of China (No. 82100761), the Anhui Provincial Natural Science Foundation (No. 2508085MH236), the Anhui Provincial Key Research and Development Project (No. 2022i01020025), and the Fundamental Research Funds for the Central Universities (No. WK9100000001).
Author contributions
Juan Tao: Investigation, Formal analysis, Methodology, Validation, Writing-original draft. Qingyu Cheng: Formal analysis, Methodology, Visualization, Writing-review & editing. Pinjie Zhang and Guizhen Yu: Data curation, Software. Qi Chen: Data curation. Manwen Yang: Formal analysis, Validation. Qiqin Wu: Data curation, Visualization. Haopeng Fang: Validation. Haibo Wu: Resources. Xiaoyuan Song, Zhu Chen, Min Chen, and Xiaoming Meng: Writing-review & editing. Mingxing Lei: Conceptualization, Writing-review & editing. Tengchuan Jin: Conceptualization, Supervision, Writing-review & editing.
Ethics approval and consent to participate
The study was conducted in accordance with the Declaration of Helsinki (as revised in 2013) and was approved by the Ethics Committee (2023KY130).
Availability of data and materials
The data supporting the findings of this study are openly available in the BIG Sub database under accession number CRA037374. Requests for further access to datasets can be directed to the corresponding author.
Competing Interests
The authors have declared that no competing interest exists.
References
1. Mohan C, Zhang T, Putterman C. Pathogenic cellular and molecular mediators in lupus nephritis. Nat Rev Nephrol. 2023;19:491-508
2. Hoi A, Igel T, Mok CC. et al. Systemic lupus erythematosus. Lancet. 2024;403:2326-38
3. Hocaoǧlu M, Valenzuela-Almada MO, Dabit JY. et al. Incidence, Prevalence, and Mortality of Lupus Nephritis: A Population-Based Study Over Four Decades Using the Lupus Midwest Network. Arthritis Rheumatol. 2023;75:567-73
4. Mok CC, Teng YKO, Saxena R. et al. Treatment of lupus nephritis: consensus, evidence and perspectives. Nat Rev Rheumatol. 2023;19:227-38
5. Lorenzo-Vizcaya A, Isenberg DA. Clinical trials in systemic lupus erythematosus: the dilemma-Why have phase III trials failed to confirm the promising results of phase II trials? Ann Rheum Dis. 2023;82:169-74
6. Zhang Y, Du L, Wang C. et al. Neddylation is a novel therapeutic target for lupus by regulating double negative T cell homeostasis. Signal Transduct Target Ther. 2024;9:18
7. Dong C, Guo Y, Chen Z. et al. Single-Cell Profiling of Bone Marrow B Cells and Early B Cell Developmental Disorders Associated With Systemic Lupus Erythematosus. Arthritis Rheumatol. 2024;76:599-613
8. Miguel V, Shaw IW, Kramann R. Metabolism at the crossroads of inflammation and fibrosis in chronic kidney disease. Nat Rev Nephrol. 2025;21:39-56
9. Meng XM, Wang L, Nikolic-Paterson DJ. et al. Innate immune cells in acute and chronic kidney disease. Nat Rev Nephrol. 2025;21:464-82
10. Tang PM, Nikolic-Paterson DJ, Lan HY. Macrophages: versatile players in renal inflammation and fibrosis. Nat Rev Nephrol. 2019;15:144-58
11. Tao J, Wang H, Yu XJ. et al. A Validation of the 2018 Revision of International Society of Nephrology/Renal Pathology Society Classification for Lupus Nephritis: A Cohort Study from China. Am J Nephrol. 2020;51:483-92
12. Perretti M, D'Acquisto F. Annexin A1 and glucocorticoids as effectors of the resolution of inflammation. Nat Rev Immunol. 2009;9:62-70
13. Gavins FN, Hickey MJ. Annexin A1 and the regulation of innate and adaptive immunity. Front Immunol. 2012;3:354
14. Wu L, Liu C, Chang DY. et al. Annexin A1 alleviates kidney injury by promoting the resolution of inflammation in diabetic nephropathy. Kidney Int. 2021;100:107-21
15. Hou Z, Lu F, Lin J. et al. Loss of Annexin A1 in macrophages restrains efferocytosis and remodels immune microenvironment in pancreatic cancer by activating the cGAS/STING pathway. J Immunother Cancer. 2024;12:e009318
16. McArthur S, Juban G, Gobbetti T. et al. Annexin A1 drives macrophage skewing to accelerate muscle regeneration through AMPK activation. J Clin Invest. 2020;130:1156-67
17. Xu X, Gao W, Li L. et al. Annexin A1 protects against cerebral ischemia-reperfusion injury by modulating microglia/macrophage polarization via FPR2/ALX-dependent AMPK-mTOR pathway. J Neuroinflammation. 2021;18:119
18. Yan Z, Cheng X, Wang T. et al. Therapeutic potential for targeting Annexin A1 in fibrotic diseases. Genes Dis. 2022;9:1493-505
19. Wu L, Liu C, Chang DY. et al. The Attenuation of Diabetic Nephropathy by Annexin A1 via Regulation of Lipid Metabolism Through the AMPK/PPARα/CPT1b Pathway. Diabetes. 2021;70:2192-203
20. Fang L, Liu C, Jiang ZZ. et al. Annexin A1 binds PDZ and LIM domain 7 to inhibit adipogenesis and prevent obesity. Signal Transduct Target Ther. 2024;9:218
21. Jing C, Castro-Dopico T, Richoz N. et al. Macrophage metabolic reprogramming presents a therapeutic target in lupus nephritis. Proc Natl Acad Sci U S A. 2020;117:15160-71
22. Tao J, Zhao J, Qi XM. et al. Complement-mediated M2/M1 macrophage polarization may be involved in crescent formation in lupus nephritis. Int Immunopharmacol. 2021;101:108278
23. R Core Team; R. A language and environment for statistical computing. 2013.
24. Perretti M, Croxtall JD, Wheller SK. et al. Mobilizing lipocortin 1 in adherent human leukocytes downregulates their transmigration. Nat Med. 1996;2:1259-62
25. Chen J, Huang XR, Yang F. et al. Single-cell RNA Sequencing Identified Novel Nr4a1 (+) Ear2 (+) Anti-Inflammatory Macrophage Phenotype under Myeloid-TLR4 Dependent Regulation in Anti-Glomerular Basement Membrane (GBM) Crescentic Glomerulonephritis (cGN). Adv Sci (Weinh). 2022;9:e2200668
26. Yao W, Chen Y, Li Z. et al. Single Cell RNA Sequencing Identifies a Unique Inflammatory Macrophage Subset as a Druggable Target for Alleviating Acute Kidney Injury. Adv Sci (Weinh). 2022;9:e2103675
27. Bergen V, Lange M, Peidli S. et al. Generalizing RNA velocity to transient cell states through dynamical modeling. Nat Biotechnol. 2020;38:1408-14
28. Cao J, Spielmann M, Qiu X. et al. The single-cell transcriptional landscape of mammalian organogenesis. Nature. 2019;566:496-502
29. Kang HM, Ahn SH, Choi P. et al. Defective fatty acid oxidation in renal tubular epithelial cells has a key role in kidney fibrosis development. Nat Med. 2015;21:37-46
30. Zhao X, Kwan JYY, Yip K. et al. Targeting metabolic dysregulation for fibrosis therapy. Nat Rev Drug Discov. 2020;19:57-75
31. Ka SM, Tsai PY, Chao TK. et al. Urine annexin A1 as an index for glomerular injury in patients. Dis Markers. 2014;2014:854163
32. Tao J, Wang H, Wang SX. et al. The predictive value of crescents in the disease progression of lupus nephritis based on the 2018 International Society of Nephrology/Renal Pathology Society Revision System: a large cohort study from China. Ren Fail. 2020;42:166-72
33. Liang Z, Tang Z, Zhu C. et al. Intestinal CXCR6 (+) ILC3s migrate to the kidney and exacerbate renal fibrosis via IL-23 receptor signaling enhanced by PD-1 expression. Immunity. 2024;57:1306-23
34. Huang R, Fu P, Ma L. Kidney fibrosis: from mechanisms to therapeutic medicines. Signal Transduct Target Ther. 2023;8:129
35. Li B, Reynolds JM, Stout RD. et al. Regulation of Th17 differentiation by epidermal fatty acid-binding protein. J Immunol. 2009;182:7625-33
36. Shan M, Yuan X, Song LZ. et al. Cigarette smoke induction of osteopontin (SPP1) mediates T(H)17 inflammation in human and experimental emphysema. Sci Transl Med. 2012;4:117ra9
37. Kumagai K, Tabu K, Sasaki F. et al. Glycoprotein Nonmetastatic Melanoma B (Gpnmb)-Positive Macrophages Contribute to the Balance between Fibrosis and Fibrolysis during the Repair of Acute Liver Injury in Mice. PLoS One. 2015;10:e0143413
38. Boutin L, Dépret F, Gayat E. et al. Galectin-3 in Kidney Diseases: From an Old Protein to a New Therapeutic Target. Int J Mol Sci. 2022;23:3124
39. Chia ZJ, Cao YN, Little PJ. et al. Transforming growth factor-β receptors: versatile mechanisms of ligand activation. Acta Pharmacol Sin. 2024;45:1337-48
40. Bhattacharya M, Ramachandran P. Immunology of human fibrosis. Nat Immunol. 2023;24:1423-33
41. Fabre T, Barron AMS, Christensen SM. et al. Identification of a broadly fibrogenic macrophage subset induced by type 3 inflammation. Sci Immunol. 2023;8:eadd8945
42. Hoeft K, Schaefer GJL, Kim H. et al. Platelet-instructed SPP1 (+) macrophages drive myofibroblast activation in fibrosis in a CXCL4-dependent manner. Cell Rep. 2023;42:112131
43. Mao Z, Tan Y, Tao J. et al. Renal mTORC1 activation is associated with disease activity and prognosis in lupus nephritis. Rheumatology. 2022;61:3830-40
44. Lai ZW, Kelly R, Winans T. et al. Sirolimus in patients with clinically active systemic lupus erythematosus resistant to, or intolerant of, conventional medications: a single-arm, open-label, phase 1/2 trial. Lancet. 2018;391:1186-96
45. Wang Y, Chen J, Tang W. et al. Rapamycin inhibits the proliferation of endothelial cells in hemangioma by blocking the mTOR-FABP4 pathway. Biomed Pharmacother. 2017;85:272-9
46. Guo D, Lin C, Lu Y. et al. FABP4 secreted by M1-polarized macrophages promotes synovitis and angiogenesis to exacerbate rheumatoid arthritis. Bone Res. 2022;10:45
47. Li Y, Tang C, Vanarsa K. et al. Proximity extension assay proteomics and renal single cell transcriptomics uncover novel urinary biomarkers for active lupus nephritis. J Autoimmun. 2024;143:103165
48. Feng Y, Guo F, Xia Z. et al. Inhibition of Fatty Acid-Binding Protein 4 Attenuated Kidney Fibrosis by Mediating Macrophage-to-Myofibroblast Transition. Front Immunol. 2020;11:566535
49. Chen Y, Dai Y, Song K. et al. Pre-emptive pharmacological inhibition of fatty acid-binding protein 4 attenuates kidney fibrosis by reprogramming tubular lipid metabolism. Cell Death Dis. 2021;12:572
Author contact
![]() Corresponding authors: Prof. Tengchuan Jin, Laboratory of Structural Immunology, Key Laboratory of Immune Response and Immunotherapy, Division of Life Sciences and Medicine, University of Science and Technology of China, Hefei 230027, China; Email: jintedu.cn; Tel.: +86-551-63600720. Dr. Qingyu Cheng, Institute of Health and Medicine, Hefei Comprehensive National Science Center, Hefei 230071, China; Email: chengqyac.cn.
Corresponding authors: Prof. Tengchuan Jin, Laboratory of Structural Immunology, Key Laboratory of Immune Response and Immunotherapy, Division of Life Sciences and Medicine, University of Science and Technology of China, Hefei 230027, China; Email: jintedu.cn; Tel.: +86-551-63600720. Dr. Qingyu Cheng, Institute of Health and Medicine, Hefei Comprehensive National Science Center, Hefei 230071, China; Email: chengqyac.cn.