Impact Factor ISSN: 1449-2288
- Issue 12; 2026
- Issue 11; 2026
- Issue 10; 2026
- Issue 9; 2026
- Issue 8; 2026
- Volume 22; 2026
- Past Issues
- Advance Articles
- Editorial Board
- Cover Images
- Index & Coverage
- Cover Suggestion
- Special Issues
Introduction
Methods
Results
Discussion
Abbreviations
Supplementary Material
Acknowledgements
References

 Global reach, higher impact
Int J Biol Sci 2026; 22(9):4956-4975. doi:10.7150/ijbs.121348 This issue Cite
Research Paper
HDAC7-Induced Epigenetic Repression Modulates ATF3 Functional Plasticity in Colorectal Cancer Pathogenesis
Qi Wang1,2,3*, Donglei Ji1,2*, Yanjie Jia1, Shuang Li4, Wenjing Gao1,2, Tingting Liang1,2, Yingying Liang1,2, Caroline Zeng5, Chunyu Wang6, Ka Lung Cheung7, Quan Wang4 ![]() , Ming-Ming Zhou7
, Ming-Ming Zhou7 ![]() , Lei Zeng1,2
, Lei Zeng1,2 ![]()
1. Bethune Institute of Epigenetic Medicine, The First Hospital of Jilin University, Changchun, Jilin, 130021, China.
2. International Center of Future Science, Jilin University, Changchun, 130012, China.
3. Department of Pathology, The First Hospital of Jilin University, Changchun, China.
4. Department of Gastrointestinal Surgery, The First Hospital of Jilin University, Changchun, 130021, China.
5. Pennsylvania State University College of Medicine, Hershey, PA 17033, USA.
6. State Key Laboratory of Supramolecular Structure and Materials, College of Chemistry, Jilin University, Changchun, Jilin, 130012, China.
7. Department of Pharmacological Sciences, Icahn School of Medicine at Mount Sinai, New York, NY, 10029, USA.
*These authors contributed equally: Qi Wang, Donglei Ji.
Received 2025-7-10; Accepted 2026-3-22; Published 2026-5-1
Abstract

Class IIa histone deacetylase 7 (HDAC7) regulates transcription primarily through scaffolding functions, but its molecular mechanisms in cancer pathogenesis remain incompletely understood. Here, we establish HDAC7 as a key epigenetic regulator in colorectal cancer (CRC). HDAC7 is overexpressed in CRC tumors and correlates with advanced disease stages, lymph node metastasis, and poor patient survival. Mechanistically, HDAC7 scaffolds a repressive complex with HDAC3 and the stress-responsive transcription factor ATF3. This reduces H3K27ac/H3K18ac occupancy and blocks BRD4/RNA polymerase II (Pol II) recruitment at ATF3 regulatory regions to epigenetically silence its transcription. Consequently, this repression inactivates ATF3's tumor-suppressive functions, activating oncogenic PI3K-Akt signaling while suppressing the Hippo pathway. Genetic depletion or pharmacological inhibition of HDAC7 disrupts this repressive complex, triggering a functional switch in ATF3. This promotes BRD4/Pol II recruitment and H3K27ac enrichment at the ATF3 locus, enabling ATF3 to undergo transcriptional self-activation. Reactivated ATF3 suppresses CRC proliferation and survival by downregulating Bcl-2, upregulating p21 (CDKN1A) to induce cell cycle arrest, promoting caspase-3-mediated apoptosis, and inhibiting PI3K-Akt signaling. Xenograft studies confirm that HDAC7 depletion suppresses tumorigenicity in vivo. Our work identifies HDAC7 as a molecular mediator that governs ATF3's functional plasticity through competitive cofactor recruitment, positioning HDAC7 inhibition as a therapeutic strategy to reactivate ATF3-mediated tumor suppression in CRC.
Keywords: colorectal cancer, HDAC7, ATF3, class IIa HDAC, epigenetic repression, scaffold protein
Introduction
Colorectal cancer (CRC) is the third most commonly diagnosed cancer and the second leading cause of cancer-related deaths worldwide, posing a major clinical challenge [1]. Despite advances in diagnosis and treatment, both the incidence and mortality of CRC continue to rise, underscoring an urgent need for novel therapeutic strategies [2]. While epigenetic dysregulation, notably aberrant histone acetylation, is a well-established driver of CRC pathogenesis [3], the exact mechanisms and key regulators involved remain incompletely understood. Identifying pivotal epigenetic regulators and their molecular interactions is critical for developing targeted therapies to address the escalating burden of CRC.
The balance of histone acetylation, dynamically controlled by histone acetyltransferases (HATs) and histone deacetylases (HDACs), is a fundamental regulator of gene expression [4]. Generally, histone hyperacetylation relaxes chromatin to activate transcription, often of oncogenes, whereas hypoacetylation compacts chromatin to silence tumor suppressors [5]. Among the 18 HDAC members categorized into four major classes [6], the Class IIa subfamily (HDAC4, 5, 7, 9) is notable for low intrinsic deacetylase activity and tissue-specific regulatory functions [7]. HDAC7 is unique because it requires association with the SMRT/N-CoR-HDAC3 complex for full enzymatic activity [8] and exhibits context-dependent roles in cancer. For example, HDAC7 overexpression can suppress c-MYC and induce apoptosis in some hematologic malignancies like pro-B acute lymphoblastic leukemia and Burkitt lymphoma cells [9]. In contrast, its knockdown downregulates c-MYC by upregulating tumor suppressors p21Cip1 and p27Kip1 in cervical (HeLa), breast (MCF7), and colon (HCT-116) solid tumor cell lines [10]. Notably, HDAC7 is overexpressed in CRC tissues and positively correlates with advanced disease [11], yet the specific mechanism of HDAC7 in CRC pathogenesis remains insufficiently understood.
Activating transcription factor-3 (ATF3), a stress-inducible bZIP transcription factor within the ATF/CREB family, further complicates this picture through its functional duality in cancer. ATF3 binds CRE motifs (5'-TGACGTCA-3') to exert context-dependent functions in stress responses and cancer progression [12]. Although basally expressed at low levels, ATF3 is robustly induced under stress [13], forming homo- or hetero-dimers that regulate transcription through promoter and enhancer binding [14]. ATF3 regulates a diverse network of pathways, including PI3K-Akt [15], NF-κB [16], Toll-like receptor 4 signaling [17], actin cytoskeleton dynamics [18], transforming growth factor-β (TGF-β) [19], and p53 signaling [20]. Additionally, ATF3 directly controls key apoptosis and cell-cycle regulators such as Bcl-2, p21 and cyclins [21-23], and modulates cell death mechanisms, notably switching from apoptosis to necroptosis in the hepatic steatosis condition [24]. In CRC, ATF3 is downregulated in tumors compared to adjacent normal tissues and can function as a tumor suppressor [25]. Its loss enhances cell migration and survival [26], while its overexpression induces apoptosis via Bcl-2 suppression and PARP cleavage [27, 28]. Paradoxically, in certain CRC contexts (e.g., HT29 and Caco-2 cells), ATF3 overexpression appears to promote invasion and motility [29]. This context-dependent switching is stage-dependent, influenced by tumor microenvironment [30] and variable expression levels across CRC lines [31], suggesting that ATF3's activity is determined by upstream epigenetic mechanisms.
Supporting this epigenetic mode of regulation, ATF3 expression can be reactivated by HDAC inhibitors, leading to apoptosis [32]. Class I HDACs, such as HDAC3, are known to form repressive complexes at the ATF3-bound promoter, suppressing both ATF3 expression and its downstream target genes [33]. Furthermore, ATF3-binding sites overlap with regions of active chromatin marked by H3K27ac and the co-activator p300 [34], implying that its transcriptional output is determined by a competitive balance between co-activators and co-repressors. However, whether Class IIa HDACs, particularly HDAC7, participate in this competitive regulation to modulate ATF3's functional switch in CRC remains uncharacterized.
In this study, we identify HDAC7 as an epigenetic regulator that controls ATF3's functional plasticity in CRC. We demonstrate that HDAC7 is overexpressed in aggressive CRC and correlates with poor patient survival. Mechanistically, HDAC7 functions as an oncogenic scaffold, which recruits HDAC3 and ATF3 into a repressive complex at the ATF3 locus independent of its catalytic domain. This complex silences ATF3 transcription by reducing H3K27ac and excluding co-activators like BRD4 and Pol II. Genetic depletion or chemical inhibition of HDAC7 disrupts this repressive complex, enabling ATF3 to recruit co-activators and activate its own expression. Reactivated ATF3 then implements a tumor-suppressive program through Bcl-2 downregulation, p21 upregulation, and apoptosis induction. Our work defines an HDAC7-dependent epigenetic modulation that controls ATF3's dual roles, from a repressor state (bound to HDAC3) to an activator state (complexed with BRD4/Pol II), highlighting HDAC7 inhibition as a therapeutic strategy to reactivate ATF3-mediated tumor suppression in CRC.
Methods
Human colon tissues collection and ethics statements
Eighty paired colorectal tissue specimens (tumor and adjacent normal tissues) were collected from treatment-naïve CRC patients undergoing curative resection at the First Hospital of Jilin University between 2019 and 2020. Patients had received no prior neoadjuvant chemotherapy or radiotherapy. Immediately following resection (within 5 minutes), tumor and normal tissues were collected, snap-frozen in liquid nitrogen, and transferred to a -80 °C refrigerator for long-term storage prior to RNA and protein extraction. Comprehensive clinicopathological data, including patient age, gender, tumor location, and TNM staging were recorded for subsequent analysis. For comparative studies, the CRC patients in Table 1 were stratified into high and low HDAC7 expression groups based on the median HDAC7 expression level in adjacent normal tissues. All procedures were conducted in accordance with the principles of the Declaration of Helsinki (2013). Written informed consent was obtained from all patients, and the study protocol was approved by the Institute Research Ethics Committee of the First Hospital of Jilin University.
The relationship between clinicopathological characteristics and HDAC7 expression in CRC patients
| Clinicopathologic characteristics | Number | Percent | HDAC7 | Chi-square test | |
|---|---|---|---|---|---|
| High | Low | p-value | |||
| Age (years) | 47 | 33 | 0.8208 | ||
| < 60 | 33 | 41.25% | 20 | 13 | |
| ≥ 60 | 47 | 58.75% | 27 | 20 | |
| Gender | 0.2491 | ||||
| Male | 48 | 60.00% | 32 | 16 | |
| Female | 32 | 40.00% | 17 | 15 | |
| TNM stage | 5e-8 | ||||
| I | 23 | 28.75% | 2 | 21 | |
| II | 38 | 47.50% | 29 | 9 | |
| III | 19 | 23.75% | 16 | 3 | |
| Lymph node metastasis | 0.0004 | ||||
| N0 | 44 | 55.00% | 17 | 27 | |
| N1 | 29 | 36.25% | 22 | 7 | |
| N2 | 7 | 8.75% | 7 | 0 | |
| Distant metastasis | 0.4756 | ||||
| M0 | 73 | 91.25% | 42 | 31 | |
| M1 | 7 | 8.75% | 5 | 2 | |
| Tumor size (cm3) | 0.5753 | ||||
| 10 | 31 | 38.75% | 16 | 15 | |
| 10-30 | 29 | 36.25% | 18 | 11 | |
| > 30 | 20 | 25.00% | 13 | 7 | |
| Marker | |||||
| Ki67 | 0.7293 | ||||
| ≤ 50% | 9 | 11.25% | 6 | 3 | |
| > 50% | 71 | 88.75% | 41 | 30 | |
| p53 | > 0.9999 | ||||
| ≤ 50% | 34 | 42.50% | 20 | 14 | |
| > 50% | 46 | 57.50% | 27 | 19 | |
Cell culture and reagents
All human CRC cell lines (SW480, SW620, LS174T, HCT-116, RKO, HT29, Caco-2, NCI-H508) and HEK293T cells were cultured in media supplemented with 10% heat-inactivated fetal bovine serum (FBS; Gibco, 16000-044), 50 U/mL penicillin, and 50 µg/mL streptomycin (Gibco, 15140). The specific media conditions were: SW480, SW620, HCT-116, HT29, and HEK293T in Dulbecco's modified Eagle's medium (DMEM) (Sigma, D6429); LS174T and Caco-2 in RPMI-1640 (Gibco, 11875); RKO and NCI-H508 in McCoy's 5A (Gibco, 16600). Cells were incubated at 37 °C in a humidified atmosphere with 5% CO2 (Thermo Scientific Heracell 150i), and the culture medium was refreshed every 48 h. For plasmid transfection, Polyethyleneimine Linear (PEI; Polysciences, 23966) was used, while siRNA transfections were performed using EL Transfection Reagent (TransIntro, FT201-02). Pharmacological inhibitors, including Vorinostat (SAHA; pan-HDAC inhibitor), TMP269 (class IIa HDAC inhibitor), and JQ1 (BET inhibitor), were purchased from Selleck Chemicals (Munich, Germany). Stock solutions (10 mM in DMSO) were prepared and stored at -80 °C. For inhibitor treatments, cells were seeded and allowed to adhere for 24 h before being incubated with the indicated concentrations of SAHA, TMP269, or JQ1 for durations of 2, 8, 12, 24, or 48 h. The final DMSO concentration in the treatment medium did not exceed 0.05% (v/v). Control cells were treated with an equivalent volume of DMSO.
Plasmid construction
Full-length human HDAC7 (NM_001258401.2) and ATF3 (NM_001030287.4) coding sequences (CDS) were amplified by PCR from HEK293T cDNA using Q5 High-Fidelity DNA Polymerase. HDAC7 fragments were cloned into the pcDNA3.1-Flag vector (Invitrogen, V79020) via EcoRI and XhoI restriction sites to generate N-terminal Flag-tagged constructs. ATF3 was cloned into the pEGFP-C3 (Clontech, 6082-1) using KpnI and EcoRI sites to create a C-terminal GFP fusion construct. All final constructs were verified by bidirectional Sanger sequencing (Comate Bioscience). Plasmids were purified using the GeneJET Plasmid Midiprep Kits (Thermo Fisher Scientific, USA, K210015) and stored at -80 °C in TE buffer (10 mM Tris-HCl, 1 mM EDTA, pH 8.0).
Establishment of stable HDAC7-knockdown cell lines
Stable HDAC7-knockdown cell lines were generated through lentiviral transduction. Lentiviral particles were generated by co-transfecting HEK293T cells with the pLKO1-shHDAC7 plasmid (target sequence: 5'-GATCCGGGTGCACAGTAAATA-3'; Sigma USA, TRCN0000255687) and the packaging plasmids (pAX and pMD2.G). Virus-containing supernatant was collected 24 or 48 h after transfection, filtered, and used to infect the CRC cell lines SW480, SW620, HT29, HCT-116, and LS174T. A non-targeting shRNA (pLKO.1-shNC) was used as a control. Infected cells were selected with puromycin (2 µg/mL) for 3 weeks to obtain stable polyclonal populations. Knockdown efficiency was confirmed by Western blotting and qRT-PCR.
Histopathology and immunohistochemistry
For histopathological analysis, the segregated CRC tumor and matched adjacent normal tissue samples were fixed in 10% neutral-buffered formalin (Sigma, HT501128) at room temperature. Following fixation, the tissues were processed, embedded in paraffin, and sectioned into 5-μm-thick slices. Sections were then deparaffinized and rehydrated for staining. For histomorphology assessment, sections were stained with Hematoxylin and Eosin (H&E) and with periodic acid-Schiff (PAS) according to standard protocols. Immunohistochemistry (IHC) was performed on paraffin-embedded tissue according to standard practice, using the primary antibodies against HDAC7 (Abcam, Cambridge, UK, #ab166911, 1:2000) and anti-Ki67 (Proteintech, Rosemont, IL, #27309-1-AP, 1:10000).
Cell proliferation assay
EdU Incorporation Assay: Cell proliferation was assessed using the 5-ethynyl-2'-deoxyuridine (EdU) Cell Proliferation Kit. Colorectal cancer cells with stable shRNA-mediated HDAC7 knockdown and scramble control (Scr) were seeded in 12-well plates at a density of 5×10⁴ cells per well. After being cultured for 24 h, cells were treated with EdU at a final concentration of 10 μM and incubated for 2 h. Cells were fixed with 3.7% paraformaldehyde for 15 min, then washed three times with PBS, and permeabilized with 0.5% Triton X-100 in PBS (1 mL per well) for 10 min at room temperature. The Click-iT reaction mixture was applied for 30 min, followed by nuclear staining with Hoechst 33342 for 25 min in the dark. After three additional PBS washes, cells were observed and imaged using an Olympus microscope (Japan). The percentage of EdU-positive cells was quantified using ImageJ software (NIH, Bethesda, MD) and normalized to the total number of Hoechst-stained nuclei.
MTT viability assay: Cells were seeded in 96-well plates at a density of 2-4×10³ cells per well with three technical replicates per condition. After 16 h, cells were treated with various concentrations of SAHA (pan-HDAC inhibitor) or TMP269 (class IIa HDAC inhibitor) for 24, 48, and 72 h. Subsequently, MTT solution (3-[4,5-dimethylthiazol-2-yl]-2,5-diphenyl tetrazolium bromide) (5 mg/mL; Sigma Aldrich, USA) was added to each well (20 µL per well) and incubated for 4 h. The medium was carefully removed, and the resulting formazan crystals were solubilized with 200 μL DMSO. Absorbance was measured at 570 nm using a Multiskan FC microplate reader (Thermo Fisher Scientific, USA). Data were analyzed using GraphPad Prism 8.0 software (GraphPad Software, San Diego, CA, USA).
Colony formation assay
For clonogenic assay analysis, 200-2000 cells were seeded per well in 6-well plates and cultured for 10-14 days to allow colony formation. Once visible colonies consisting of > 50 cells had formed, cells were fixed with 3.7% paraformaldehyde and stained with 0.1% crystal violet dye (Sigma-Aldrich, USA). Stained colonies were imaged and counted using ImageJ software (NIH, Bethesda, MD).
Cell cycle analysis and apoptosis assays by flow cytometry
Cell cycle distribution and apoptosis were analyzed by flow cytometry in SW480 and SW620 cells under two experimental conditions: (1) stable HDAC7 knockdown versus scramble control (Scr) cells, and (2) cells treated for 48 h with 1.5 μM SAHA, 3 μM TMP269, or an equivalent volume of DMSO (vehicle control).
For cell cycle analysis, cells were harvested by trypsinization, washed three times with ice-cold PBS, and fixed in 70% ethanol overnight at 4 °C. After fixation, cells were washed with PBS and stained with propidium iodide (PI) solution (50 μg/mL) containing RNase A. Cell cycle phase distribution was analyzed using a FACS Calibur flow cytometer (BD Biosciences, USA), and data were quantified with FlowJo VX software (Tree Star Inc., Ashland, OR).
Apoptosis was assessed using an Annexin V-EGFP/PI Apoptosis Detection Kit (Yeasen Biotechnology, Shanghai, China) according to the manufacturer's instructions. Briefly, cells were collected, washed with cold PBS, and resuspended in 1× binding buffer. Annexin V-EGFP and PI were sequentially added, and samples were incubated in the dark for 15 min at room temperature. Apoptotic cells were immediately analyzed by flow cytometry. A minimum of 10,000 events were recorded per sample, and the percentages of early apoptotic (Annexin V+/PI-) and late apoptotic (Annexin V+/PI+) cells were determined using FlowJo VX software (Tree Star Inc., Ashland, OR).
Transwell migration assay
Cell migration was assessed using 8-μm pore Transwell inserts (Corning, Bedford, MA, Cat: 3422). Stable shRNA-mediated HDAC7 knockdown or control cells were seeded at 8×10⁴ cells per insert into the upper chamber in serum-free DMEM. For inhibitor treatments, cells were pre-incubated for 48 h with 1.5 μM SAHA, 3 μM TMP269, or 0.05% DMSO (vehicle control) prior to seeding. The lower chamber contained DMEM supplemented with 20% FBS as a chemoattractant. After 48 h of incubation, non-migrated cells on the upper membrane surface were removed with a cotton swab. Migrated cells on the lower membrane surface were fixed with 3.7% paraformaldehyde for 30 min, stained with 0.1% crystal violet for 15 min, and imaged under a light microscope. The number of migrated cells was quantified in five random fields per insert using ImageJ software (NIH, Bethesda, MD). Each experiment was performed in at least three independent replicates.
siRNA-mediated gene knockdown
Gene knockdown was performed using siRNA transfection in SW480 cells. Cells were seeded in 6-well plates at a density of 2×10⁵ cells per well and allowed to adhere overnight. The following siRNA duplexes (purchased from Genepharma) were used for transfection:
Target Gene siRNA Name Sequence (5'-3')
ATF3 ATF3-1
F: GAGGCGACGAGAAAGAAAUTT
R: AUUUCUUUCUCGUCGCCUCTT
ATF3 ATF3-2
F: GAUGAGAGAAACCUCUUUATT
R: UAAAGAGGUUUCUCUCAUCTT
HDAC7 HDAC7-1
F: CAACCUGAAGCUGCGCUAUAATT
R: UUAUAGCGCAGCUUCAGGUUGTT
HDAC7 HDAC7-2
F: GAUCCGGGUGCACAGUAAAUATT
R: UAUUUACUGUGCACCCGGAUCTT
HDAC3 HDAC3-1
F: CAAGAGUCUUAAUGCCUUCAATT
R: UUGAAGGCAUUAAGACUCUUGTT
HDAC3 HDAC3-2
F: GCACCCAAUGAGUUCUAUGAUTT
R: AUCAUAGAACUCAUUGGGUGCTT
siRNA duplexes were diluted in serum-free transfection medium and mixed with DharmaFECT#1 transfection reagent (Thermo Fisher). The siRNA-lipid complexes were incubated for 20 min at room temperature before being added to the cells. After 24 h of transfection, cells were harvested for RNA extraction. Knockdown efficiency was assessed by quantitative PCR (qPCR) analysis, with target gene mRNA expression levels normalized to appropriate housekeeping controls.
RNA isolation, cDNA synthesis, and qRT-PCR
Total RNA was extracted from tissue samples or cultured cells using Trizol reagent (Invitrogen; Thermo Fisher Scientific) according to the manufacturer's instructions. RNA was reverse-transcribed into cDNA using the Hifair® II 1st Strand cDNA Synthesis Kit (Yeasen Biotechnology, Shanghai, China). Quantitative real-time PCR (qRT-PCR) was performed with Maxima SYBR Green/Rox qPCR Master Mix (Thermo Scientific, USA) and gene-specific primers (sequences provided in Supplementary Table 1). Amplification conditions followed the manufacturer's thermal cycling protocol. Gene expression levels were calculated using the 2-ΔΔCt method and normalized to GAPDH as an internal control. Each experiment was performed in duplicate and carried out in at least three independent biological replicates.
RNA sequencing
RNA sequencing (RNA-seq) was performed on SW480 cells stably expressing shHDAC7 or scramble control (Scr) shRNA. The sequencing service was conducted by Beijing Genomics Institute (BGI, Shenzhen, China) using the BGISEQ or DNBSEQ platform according to their standard protocols. Total RNA was extracted, and library preparation and paired-end sequencing were carried out using BGI's proprietary kit. Three technical replicates were included per group to ensure reproducibility. Raw data processing, including quality control, read alignment, and gene expression quantification, was performed by BGI. Subsequent bioinformatic analysis (differential gene expression and functional enrichment) was conducted using the Dr. Tom online platform (http://report.bgi.com).
Western blot analysis
Total protein was extracted from cells or tissues using RIPA lysis buffer (Thermo Fisher Scientific) supplemented with protease and phosphatase inhibitor cocktails. Protein concentrations were determined using a BCA Protein Quantification Kit (Yeasen, Shanghai, China). Equal amounts of protein were separated by SDS-PAGE on 8%, 10%, or 12% gels and transferred to PVDF membranes. The membranes were blocked with 8% skim milk in TBST for 1 h at room temperature and then incubated with primary antibodies overnight at 4°C with gentle shaking. The following primary antibodies were used: Rabbit monoclonal anti-HDAC7 (Abcam, Cambridge, UK, #ab166911, 1:2000; Biolegend, San Diego, CA, #683502, 1:800; Santa Cruz, Dallas, TX, #sc-47563, 1:600), Rabbit monoclonal anti-ATF3 (Abcam, Cambridge, UK) (#ab207434, 1:1500), Rabbit monoclonal anti-PI 3 Kinase catalytic subunit gamma/PI3K-gamma (Abcam, Cambridge, UK) (#ab133595, 1:2000), Rabbit polyclonal anti-Phospho-PI3K p85 (Tyr458) (Tyr467)/p55 (Tyr199) (Affinity, Cincinnati, OH) (#AF3242, 1:800), Akt (pan) Rabbit mAb (Cell Signal Tech, Danvers, MA) (#4691, 1:2000), Phospho-Akt (Ser473) XP® Rabbit mAb (Cell Signal Tech, Danvers, MA) (#4060, 1:1000), Cleaved Caspase-3 (Asp175) antibody (Cell Signal Tech, Danvers, MA) (#9661T, 1:800), Caspase-8/p43/p18 Polyclonal (Proteintech, Rosemont, IL) (#13423-1-ap, 1:800), Rabbit monoclonal anti-Bcl-2 (Abcam, Cambridge, UK) (#ab182858, 1:2000), Cyclin D1 Polyclonal antibody (Proteintech, Rosemont, IL) (#26939-1-AP, 1:800), Rabbit monoclonal anti-GAPDH (Abcam, Cambridge, UK) (#ab181602, 1:20000), HDAC3 (D2O1K) Rabbit mAb (Cell Signal Tech, Danvers, MA) (#85057, 1:2000), p21 Waf1/Cip1 (12D1) Rabbit mAb (Cell Signal Tech, Danvers, MA) (#2947S, 1:2000), mouse monoclonal anti-p53 (Abcam, Cambridge, UK) (#ab1101, 1:2000), Rabbit Polyclonal anti-acetyl-p53 (Lys373, Lys382) (Merck Millipore, Burlington, MA) (#06-785, 1:2000), rabbit monoclonal anti-YAP1 (Abcam, Cambridge, UK) (#ab52771, 1:10000), Phospho-YAP1 (Ser127) Rabbit pAb (Zen-Bioscience, Chengdu, SC) (#381297, 1:500), Src (36D10) Rabbit mAb (Cell Signal Tech, Danvers, MA) (#2109, 1:2000), Phospho-Src Family (Tyr416) (D49G4) Rabbit mAb (Cell Signal Tech, Danvers, MA) (#6943, 1:2000). After washing with TBST, membranes were incubated with horseradish peroxidase (HRP)-conjugated anti-rabbit or anti-mouse secondary antibodies (Beyotime, Shanghai, China) for 1 h at room temperature. Protein bands were visualized using an ECL detection kit (Merck Millipore) and imaged with a chemiluminescence system.
Chromatin immunoprecipitation (ChIP) assay
ChIP assays were performed in SW480 cells with stable HDAC7 knockdown (shHDAC7) or scramble control (Scr). Cells were crosslinked with 1% formaldehyde for 10 min at room temperature. The reaction was quenched with 125 mM glycine for 5 min. After washing three times with cold PBS, cells were lysed in ChIP lysis buffer and sonicated to generate chromatin fragments of 200-500 bp. Immunoprecipitation was carried out overnight at 4 °C with the following antibodies: anti-H3K27ac (Abcam, #ab4729, 1:200), anti-H3K18ac (Abcam, #ab40888, 1:200), anti-ATF3 (Abcam, #ab207434, 2 μg), anti-BRD4 (Abcam, #ab128874, 1:200), and anti-RNA polymerase II Ser2P/Ser5P (Cell Signaling Technology, #13546S, 1:200). Normal mouse IgG (Santa Cruz, #2025, 1:200) and normal rabbit IgG (Cell Signaling Technology, #2729, 1:200) were used as negative controls. Immunoprecipitated DNA was purified using a QIAquick Spin Kit (Qiagen) and analyzed by qPCR with primers targeting the ATF3 enhancer or promoter regions (see Supplementary Table 2 for sequences).
Co-Immunoprecipitation (Co-IP) assay
Co-immunoprecipitation assays were performed in HEK293T cells co-transfected with plasmids encoding Flag-HDAC7 (or HDAC7-targeting siRNA) and GFP-ATF3. Cells were lysed in IP lysis buffer (25 mM Tris pH 7.4, 150 mM NaCl, 1 mM EDTA, 1% NP-40, and 5% glycerol). Lysates were centrifuged, and the supernatants were incubated overnight at 4 °C with rotation in the presence of the following antibodies: anti-HDAC7 (Abcam, #ab166911, 1:2000), anti-HDAC3 (Cell Signaling Technology, #85057, 1:2000), anti-BRD4 (Abcam, #ab128874, 1:2000), anti-GFP (Engibody, #AT0028, 1:2000; or Bioss, #bs-0639R, 1:500), or anti-FLAG M2 (Sigma-Aldrich, #F1804, 1:2000). Normal rabbit IgG (Cell Signaling Technology, #2729, 1:2000) was used as a negative control. Protein A/G magnetic beads (Invitrogen) were then added, and the mixtures were incubated for 2 h at 4 °C. Beads were washed six times with lysis buffer to remove unbound proteins. Bound proteins were eluted in 2× SDS sample buffer and analyzed by SDS-PAGE and Western blotting.
Luciferase reporter transcription assay
Transcriptional activity of the ATF3 promoter was investigated using a dual-luciferase reporter system. The pGL3-ATF3 plasmid (Promega, E1761), containing a 1.5-kb human ATF3 promoter fragment (-1486 to +114 relative to TSS), was co-transfected with the pRL-TK normalization vector (Promega, E2241) in a 10:1 ratio using Lipofectamine 3000. Firefly and Renilla luciferase activities were measured sequentially using the Dual-Glo Luciferase Assay System (Promega, E2920) on a GloMax Navigator luminometer. Relative promoter activity was calculated as the ratio of Firefly to Renilla luciferase activity, expressed as relative light units (RLU), and normalized to both empty pGL3-basic control and vehicle-treated samples, with background subtraction using lysis buffer-only blank signals. Data are from five biological replicates, each with three technical replicates.
Animal experiments
All animal procedures were approved by the Experimental Animal Ethical Committee of Jilin University (#A2021-028) and conducted in compliance with the institutional guidelines. Twenty female BALB/c nude mice (approximately 4 weeks old, 16-18 g) were purchased from SPF Biotechnology (Beijing, China) and acclimatized for 7 days under specific pathogen-free (SPF) conditions (22 ± 1 °C, 55 ± 5% humidity, 12 h light/dark cycle). Mice were stratified by weight and randomized into two groups (n = 10 per group). SW480 cells stably expressing shHDAC7 or scramble control (Scr) shRNA were harvested, resuspended in PBS, and subcutaneously injected into the left flank of each mouse (1×10⁶ cells in 100 μL, 27G needle) under isoflurane anesthesia. Mice that exhibited injection failure or in which tumors failed to engraft (tumor volume < 50 mm3 on day 7) were excluded from the study. Tumor dimensions were measured three times weekly by using digital calipers, and volumes were calculated as (Length×Width2)/2. Humane endpoints were defined as tumor volume exceeding 1500 mm3 or weight loss > 20%. After 28 days, all mice were euthanized by CO2 asphyxiation (30% chamber volume displacement per minute). Tumors were excised, weighed (Sartorius, CPA225D), and processed for snap-freezing or fixation for subsequent analysis.
Statistical analysis
Statistical analyses were performed using GraphPad Prism 8 (v9.3.1; GraphPad Software Inc., La Jolla, CA) or SPSS (v28.0). For multi-group comparisons, one-way analysis of variance (ANOVA) was employed. Differences between samples and their respective control groups were evaluated using either unpaired or paired two-tailed Student's t-test. Survival outcomes were analyzed using Kaplan-Meier curves, with significance determined by the log-rank test. Data are presented as mean ± standard deviation (SD) or standard error of the mean (SEM), based on at least three independent experiments. A p-value < 0.05 was considered statistically significant.
Results
HDAC7 overexpression correlates with advanced disease and reduced survival in CRC
To investigate the involvement of class IIa HDACs in CRC, we examined their gene expression patterns using TCGA (The Cancer Genome Atlas) and GEPIA (Gene Expression Profiling Interaction Analysis) databases. We found distinct dysregulation patterns among class IIa HDAC members in colon adenocarcinoma (TCGA-COAD). HDAC7 was uniquely overexpressed in tumor tissues compared to adjacent normal mucosa, while HDAC9 showed moderate downregulation and HDAC4 and HDAC5 showed no significant change (Figure 1A, S1A). Furthermore, HDAC7 expression was positively associated with advanced pathological stages (I-IV) in colon adenocarcinoma (COAD) (Figure 1B), with a more pronounced association than observed in rectal adenocarcinoma (READ) (Figure S1A). These patterns implicate HDAC7 as a key class IIa HDAC linked to CRC progression.
HDAC7 is overexpressed in CRC and correlates with advanced disease and poor prognosis. (A) Analysis of TCGA data shows that HDAC7 mRNA expression is significantly higher in CRC tumor tissues (T) compared to adjacent normal tissues (N). In contrast, HDAC4 expression shows no significant difference (One-way ANOVA, p-value < 0.05 for HDAC7). (B) HDAC7 expression increases with advancing pathological stage (I-IV) in the TCGA colon adenocarcinoma (COAD) cohort (One-way ANOVA). (C) Validation of HDAC7 mRNA overexpression in an independent cohort of 80 paired CRC patient samples (tumor vs. adjacent normal tissues). Quantitative data are mean ± S.D. p-values for each indicated comparison were calculated using a two-tailed paired Wilcoxon test. (D) Kaplan-Meier survival analysis (GEPIA database) of CRC patients stratified by HDAC7 expression (cutoff-high% ≥ 70, cutoff-low% < 70). High HDAC7 expression is associated with significantly worse overall survival (OS) and disease-free survival (DFS). p-values were determined by the log-rank test. (E) Stage-specific analysis of HDAC7 mRNA levels in the same 80 paired CRC patient cohort, grouped by early (T1 & T2) and late (T3 & T4) tumor stage. Quantitative data are mean ± S.D. p-values were derived from a two-tailed paired Student's t-test. (F) Representative Western blot (left) and quantification (right) of HDAC7 protein levels in paired CRC (T) and normal (N) tissues. Data are mean ± S.D. (n = 3); p-values were calculated using a two-tailed unpaired Student's t-test. (G) Representative immunohistochemistry (IHC) staining (left) and quantification (right) of HDAC7 protein in paired CRC and normal tissues. Quantitative data are mean ± S.D. (n = 3). p-values for each indicated comparison were calculated using a two-tailed unpaired Student's t-test.
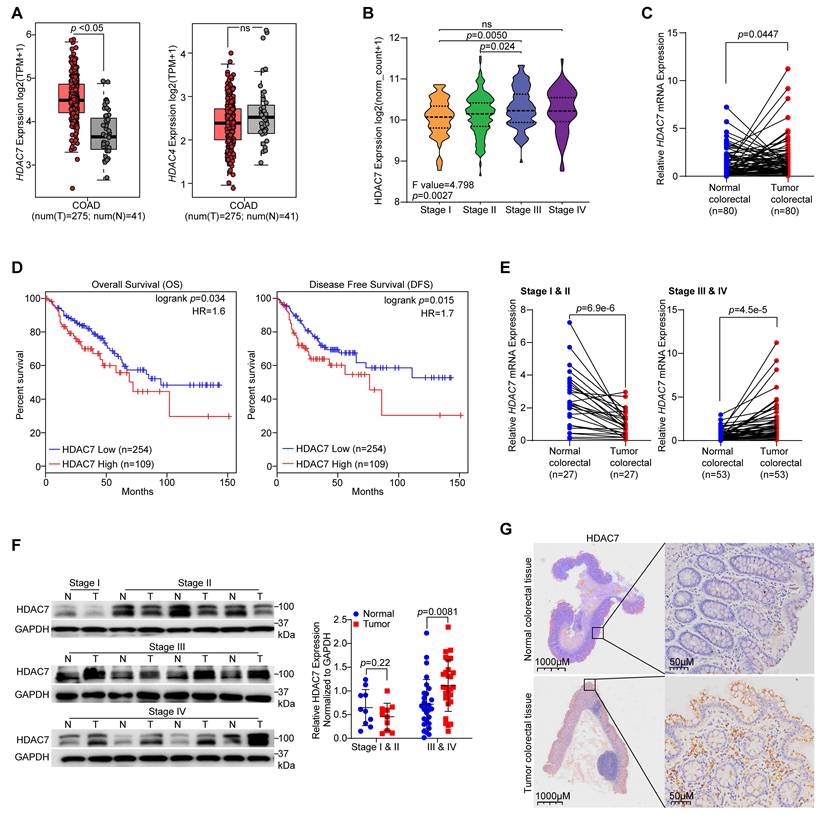
To validate our bioinformatics findings, we next analyzed HDAC7 expression in an independent cohort of 80 paired CRC patient samples (tumor vs. adjacent normal tissues) collected from the First Hospital of Jilin University. Consistent with bioinformatics data, HDAC7 expression was markedly upregulated in CRC tumor tissues compared with matched non-cancerous tissues (Figure 1C). In contrast, HDAC5 and HDAC9 were downregulated and HDAC4 expression remained unchanged (Figure S1B). Importantly, survival analysis using GEPIA revealed that high HDAC7 expression correlated with reduced overall survival (OS) and disease-free survival (DFS) in CRC patients (Figure 1D, S1C), whereas no such association was observed for HDAC4, HDAC5, or HDAC9. These clinical data identify HDAC7 as the most prognostically relevant class IIa HDAC in CRC.
Notably, HDAC7 upregulation was stage-dependent. Both HDAC7 mRNA and protein levels were significantly elevated in patients diagnosed with CRC stages III and IV, whereas levels were moderately decreased in stages I and II relative to adjacent normal tissues (Figure 1E, 1F). Immunohistochemical (IHC) tests in three representative pairs of CRC tissues confirmed consistent HDAC7 protein overexpression in tumor tissues versus the matched adjacent normal tissues (Figure 1G). Additionally, clinicopathological correlation analysis in our 80-patient cohort demonstrated a strong association between HDAC7 overexpression and both TNM stage (tumor, node, metastasis) (p = 5e-8) and lymph node metastasis (p = 0.0004). In contrast, HDAC7 expression showed no significant relationship with patient age, gender, distant metastasis, tumor size, or molecular markers such as Ki67 and p53 status (Table 1). Collectively, these findings indicate a clear correlation between HDAC7 overexpression and poor patient survival and tumor progression. The stage-specific expression pattern suggests that HDAC7 may play distinct roles in early tumor suppression versus late-stage progression, warranting further investigation into its phase-dependent functions in CRC.
HDAC7 promotes CRC proliferation, survival, and migration in vitro and in vivo
To explore the functional role of HDAC7 in CRC progression, we first analyzed class IIa HDAC expression across eight CRC cell lines representing distinct molecular subtypes: SW620 (lymph node metastatic derivative), SW480 (primary colon carcinoma), LS174T, HCT-116, RKO, HT29 (CMS3 metabolic subtype), NCI-H508 and Caco-2 (CMS2 epithelial subtype) (Figure 2A). Consistent with our clinical findings (Figure 1E, F), HDAC7 expression levels were elevated in SW480 and HT29 cells compared to other cell lines (Figure 2A). In contrast, other class IIa HDACs showed variable expression patterns. HDAC5 was upregulated in SW480 cells compared to SW620 cells, whereas HDAC4 and HDAC9 protein levels were downregulated in SW480 compared to those in SW620 (Figure S2A). This establishes HDAC7 as the predominant dysregulated class IIa HDAC in CRC [35].
HDAC7 promotes CRC cell proliferation, survival and migration in vitro and tumorigenicity in vivo. (A) Western blot analysis of HDAC7 protein levels across eight CRC cell lines (normalized to GAPDH). (B) Validation of stable HDAC7 knockdown by shRNA (shHDAC7) in SW480, SW620, LS174T, HCT116 and HT29 cells compared to a scramble control (Scr). Quantified protein levels are mean ± S.D. (n = 3). p-values for each indicated comparison were derived from two-tailed unpaired Student's t-test. (C) EdU incorporation assay in SW480 cells showing that stable HDAC7 knockdown reduces proliferation. Representative images show EdU-positive nuclei (red) and total nuclei (Hoechst, blue). Scale bar, 100 µm. Quantitative data are mean ± S.D. (n = 20 fields). p-values were calculated using a two-tailed unpaired Student's t-test. (D) Cell cycle analysis by Annexin V/PI staining and flow cytometry in SW480 cells. Stable shRNA-mediated HDAC7 knockdown increases the proportion of G0/G1-phase cells and decreases the S-phase population. Quantitative data are mean ± S.D. (n ≥ 3). p-values were determined by a two-tailed unpaired Student's t-test. (E) Apoptosis analysis by flow cytometry (Annexin V-FITC/PI staining). Stable shRNA-mediated HDAC7 knockdown increases the percentage of apoptotic SW480 cells. Quantitative data are mean ± S.D. (n = 7). p-values were calculated using a two-tailed unpaired Student's t-test. (F) Transwell migration assay. Stable HDAC7 knockdown impairs SW480 cell migration capability. Migrated cells were stained with crystal violet. Scale bar, 100 μm. Quantified data are mean ± S.D. (n ≥ 3). p-values were determined by a two-tailed unpaired Student's t-test. (G) Representative images of subcutaneous xenograft tumors formed in Balb/C nude mice by SW480 cells stably expressing Scr or shHDAC7. (H, I) Tumor volume curves (H) and final tumor weights (I) demonstrate that stable HDAC7 knockdown suppresses tumorigenicity in vivo. The tumor volumes were measured every three days (H) and the tumor weights (I) were analyzed after excising the tumors. Quantitative data are mean ± S.D. (n ≥ 3). p-values were determined by a two-tailed unpaired Student's t-test. (J) Representative H&E-stained images for xenograft tumor sections of indicated groups. Scale bar, 50 μm. (K) Representative immunohistochemistry (IHC) staining for the proliferation marker Ki67 in xenograft tumor sections. Scale bar, 50 μm.
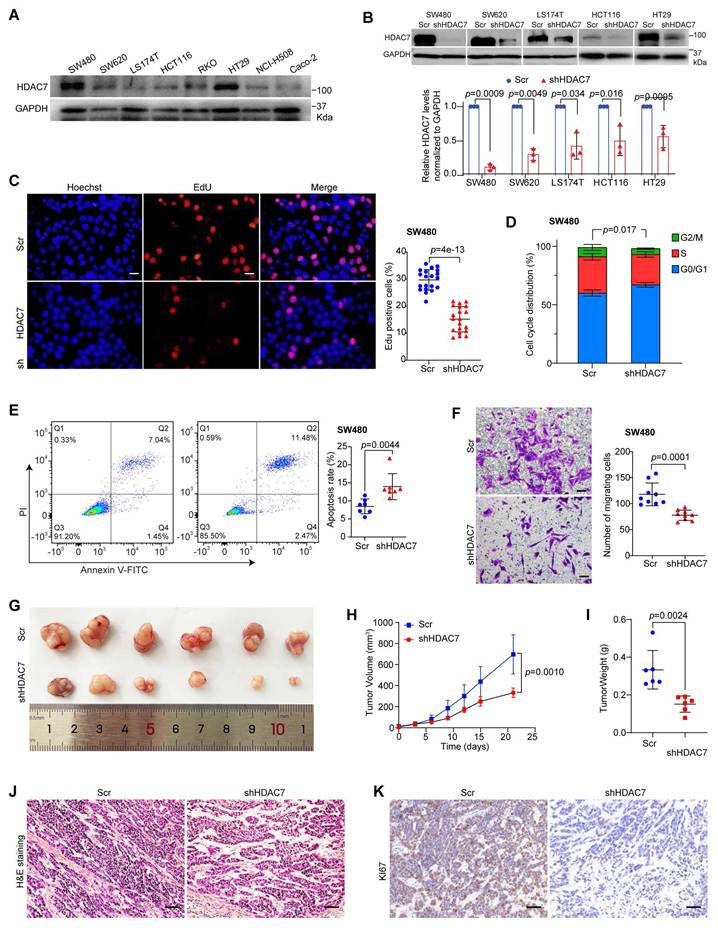
To explore HDAC7's functional role in CRC cells, we next performed genetic knockdown of HDAC7 in five CRC cell lines (SW480, SW620 and LS174T, HCT116, and HT29) using shRNA (shHDAC7) (Figure 2B, S2B). Stable shRNA-mediated HDAC7 depletion significantly impaired proliferation in SW480, SW620, HCT116 and LS174T cells compared to non-targeting controls (Figure 2C, S2C, S2D), and reduced colony-forming ability in SW480, SW620, and LS174T cells (Figure S2E-G). These results indicate that HDAC7 is broadly required for CRC cell growth. Flow cytometry analysis of cell cycle distribution and apoptosis showed that HDAC7 depletion induced G1 cell cycle arrest, reduced S-phase populations, and increased apoptosis rates in SW480, SW620 and LS174T cells (Figure 2D, 2E, S2H, S2I). Transwell migration assay further demonstrated that HDAC7 knockdown substantially impaired the migratory capacity of SW480 cells compared to controls (Figure 2F). To further corroborate these findings and explore HDAC7's oncogenic mechanisms, we performed two independent siRNA transient knockdowns of HDAC7 (siHDAC7#1 and siHDAC7#2) in SW480 cells. Both siRNAs similarly reduced HDAC7 expression, and reproduced the anti-proliferative, pro-apoptotic, and anti-migratory effects (Figure S2J-M). Taken together, these findings demonstrate that HDAC7 promotes growth, survival, and metastatic potential in CRC cells.
To evaluate HDAC7's role in tumorigenesis in vivo, we further established a mouse xenograft model by subcutaneously injecting stable HDAC7-knockdown SW480 cells (shHDAC7) into immunodeficient nude mice. Xenograft tumors derived from HDAC7-knockdown SW480 cells exhibited significantly delayed growth, reduced final volume, and lower weight compared to controls at the end point (Figure 2G-I). Histopathological analysis of H&E-stained tumor tissues revealed that stable HDAC7-depleted tumors contained fewer distinct mitotic structures, more membrane irregularities and apoptotic cells compared to the control group (Figure 2J), which is consistent with our cellular apoptosis findings (Figure 2E). Additionally, IHC analysis confirmed reduced Ki67 staining in HDAC7-knockdown tumors (Figure 2K), indicating that HDAC7 loss impairs proliferative capacity and tumor growth in vivo. Collectively, these results demonstrate that HDAC7 plays a pro-oncogenic role in CRC tumorigenesis by promoting proliferation and suppressing apoptosis.
HDAC7 drives CRC progression via ATF3 repression and oncogenic pathway activation
Emerging evidence indicates that ATF3 is a context-dependent transcription factor that can function as either a tumor suppressor or an oncogene in cancer [30, 36]. To understand its role in CRC progression and its relationship with HDAC7, we analyzed public transcriptomic TCGA-GEPIA data. While ATF3 expression alone did not correlate with OS and DFS in CRC cohorts (Figure 3A), nor differ significantly between tumor and adjacent normal tissues (Figure S3A), we observed a stage-dependent decrease in ATF3 levels within the COAD cohort. Specifically, lower ATF3 expression was associated with more advanced pathological stages (Stages I-IV) (Figure 3B), suggesting that ATF3 deficiency may contribute to CRC progression. Notably, this stage-dependent reduction inversely paralleled the stage-associated increase in HDAC7 expression (Figure 1E, F), suggesting a potential regulatory interplay between these regulators.
HDAC7 represses ATF3 and activates oncogenic signaling pathways in CRC. (A) Kaplan-Meier analysis shows that ATF3 expression alone is not significantly associated with overall survival (OS) or disease-free survival (DFS) in CRC patients (GEPIA database). (cutoff-high% ≥ 50, cutoff-low% < 50). p-values are determined by the log-rank test. (B) ATF3 mRNA expression decreases with advancing pathological stage (I-IV) in the TCGA CRC cohort (One-way ANOVA). (C) Correlation analysis between HDAC7 and ATF3 expression reveals a significant inverse correlation in late-stage (III & IV) CRC, but not in early-stage (I & II) disease. Pearson correlation coefficients (R) and p-values are indicated. (D) Kaplan-Meier survival analysis of CRC patients from GEPIA database stratified by ATF3/HDAC7 expression ratio. (cutoff-high% ≥ 50, cutoff-low% < 50). A low ATF3/HDAC7 ratio is associated with significantly worse OS and DFS (log-rank test). (E) Heatmap of significantly dysregulated genes in SW480 cells following stable HDAC7 knockdown (shHDAC7) compared to scramble control (Scr) (Q value ≤0.0001, |log2FC| ≥ 1.4). (F) KEGG pathway enrichment analysis of differentially expressed genes in SW480 cells upon stable HDAC7-knockdown (shHDAC7) (|log2FC| ≥ 1, Q value ≤0.01). Bubble size represents gene count; color indicates enrichment significance. (G) Histogram displaying Log2 fold-changes of key differentially expressed genes involved in cell cycle and apoptosis regulation upon stable shRNA-mediated HDAC7 knockdown. (H) qRT-PCR validation of gene expression changes in stable HDAC7 knockdown SW480 cells. Expression was normalized to GAPDH. Quantitative data are shown as mean ± S.D. (n ≥ 3). p-values were derived from a two-tailed unpaired Student's t-test. (I) Western blot analysis of key signaling proteins in control (Scr) and stable HDAC7-knockdown (shHDAC7) SW480 cells (normalized to GAPDH). (J) Rescue experiment showing that re-expression of HDAC7 in knockdown SW480 cells reverses the molecular changes induced by HDAC7 depletion. The relative expression was normalized by GAPDH. Data are mean ± S.D. (n ≥ 3). p-values were assessed by a two-tailed unpaired Student's t-test.
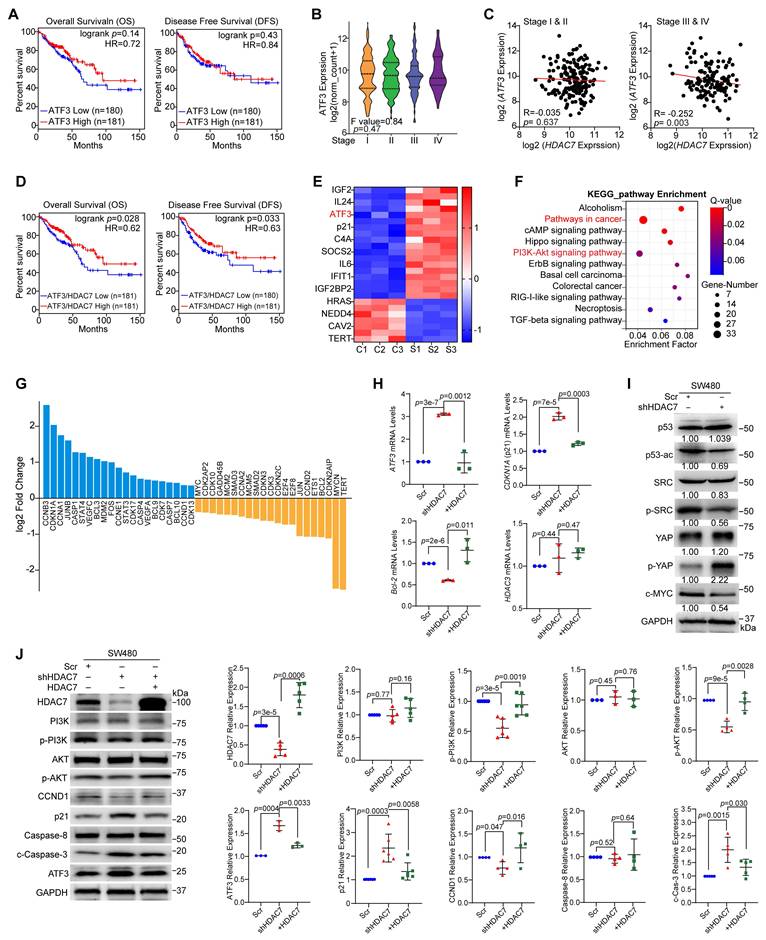
Building on these findings, we next analyzed the transcriptome profiles from the TCGA database and observed a stage-specific inverse correlation between HDAC7 and ATF3 expression (p = 0.003) in advanced-stages (III and IV) CRC tumors but not early-stages (I and II) (Figure 3C). Clinically, patients with a low ATF3/HDAC7 expression ratio exhibited poorer prognosis, with significantly worse OS (p = 0.028) and DFS (p = 0.033) (Figure 3D, S3B vs. Figure 1D). These findings suggest that this ratio is a potent prognostic marker.
To elucidate the mechanistic relationship between HDAC7 and ATF3 in transcriptional regulation, we performed RNA sequencing (RNA-seq) in HDAC7-knockdown SW480 cells (Figure 2B, C). Transcriptome profiling identified 530 upregulated and 161 downregulated genes following stable HDAC7 knockdown (fold change > 1.3, p < 0.05; Figure S3C). Importantly, ATF3 was among the most upregulated genes following HDAC7 depletion (p < 0.0001; Figure 3E), indicating that HDAC7 is a direct transcriptional repressor of ATF3 [22]. To identify pathways regulated by HDAC7, we performed Kyoto Encyclopedia of Genes and Genomes (KEGG) and Gene Set Enrichment Analysis (GSEA) on differentially expressed genes (DEG) following HDAC7 knockdown. These analyses highlighted significant enrichment in oncogenic signaling, particularly the PI3K-Akt and Hippo signaling pathways (Figure 3F, S3D, S3E). Additionally, HDAC7 knockdown led to the coordinated downregulation of the anti-apoptotic factor Bcl-2 and upregulation of the cell cycle inhibitor CDKN1A (encoding p21) (Figure 3G).
We validated these findings through qPCR and Western blot analysis, and confirmed that HDAC7 knockdown increased ATF3 and p21 levels and decreased Bcl-2 mRNA and protein levels in SW480 cells (Figure 3H, S2I). Re-expression of wild-type HDAC7 partially reversed these effects (Figure 3H). At protein levels, HDAC7 depletion decreased phosphorylation of p-PI3K p85 (Tyr458), p-Akt (Ser473), p53ac, p-SRC (Tyr416) and decreased Cyclin D1 protein levels, while increasing ATF3, p21, p-YAP (Ser127) and the cleaved caspase-3 (c-Caspase-3) protein levels in SW480 cells (Figure 3I, 3J, S3F, S3G). These changes in p-PI3K p85 (Tyr458), p-Akt (Ser473), Cyclin D1, ATF3, p21 and c-Caspase-3 were partially rescued by HDAC7 re-expression (Figure 3J), confirming HDAC7 plays a direct regulatory role in these pathways. Notably, HDAC3 mRNA levels were unaffected by modulating HDAC7 (Figure 3H), indicating that HDAC7 regulates these pathways without altering HDAC3 levels.
HDAC7 represses ATF3 to promote oncogenic signaling in CRC cells
To explore the mechanism of HDAC7-mediated regulation of ATF3 in CRC cells, we first analyzed ATF3 protein levels across eight CRC cell lines (Figure 4A). ATF3 expression levels were notably lower in the more invasive SW620 and SW480 cells than in Caco-2, LS174T, HCT-116, RKO, HT29 and NCI-H508 cells (Figure 4A). Importantly, the ATF3/HDAC7 ratio was markedly reduced in these SW480 and SW620 cells compared to other cell lines (Figure 4A). This cell-based quantification is consistent with our clinical observation that a decreased ATF3/HDAC7 ratio correlates with poor patient outcomes (Figure 3D), and suggests that HDAC7-mediated ATF3 repression is linked to aggressive disease.
HDAC7 represses ATF3 to promote oncogenic signaling in CRC cells. (A) Western blot analysis of endogenous ATF3 and HDAC7 protein levels across eight CRC cell lines (left). Quantification (mean values, n ≥ 3) of the ATF3/HDAC7 protein ratio (right), showing a pronounced reduction in invasive SW480 and SW620 cells. The HDAC7 and GAPDH loading controls are the same as those shown in Figure 2A, as both analyses were performed on the same samples. (B, C) ATF3 overexpression in SW480 cells increases CDKN1A (p21) and decreases Bcl-2 mRNA (B) and protein (C) levels, without affecting HDAC7 or HDAC3. Data are mean ± SD (n ≥ 3). p-values were calculated using a two-tailed unpaired Student's t-test. (D) siRNA-mediated transient ATF3 knockdown (siATF3-1, siATF3-2) in SW480 cells decreases CDKN1A and increases Bcl-2 mRNA, confirming its regulatory role, while HDAC7 and HDAC3 levels remain unchanged. Quantitative data are mean ± S.D. (n = 5; two-tailed unpaired Student's t-test). (E) Western blot analysis shows ATF3 overexpression suppresses PI3K-Akt signaling (reduced p-Akt and Cyclin D1) and promotes apoptosis (increased Caspase-8 and cleaved Caspase-3). Data are mean ± S.D. (n ≥ 3; two-tailed unpaired t-test). (F, G) Genetic relationship analysis. siRNA-mediated transient co-depletion of ATF3 in HDAC7-knockdown SW480 cells reverses the tumor-suppressive molecular phenotype, partially restoring Bcl-2 and reducing CDKN1A mRNA (F) (Data are mean ± S.D.; n ≥ 3; two-tailed unpaired t-test), while reactivating PI3K-Akt signaling (increased p-Akt and Cyclin D1) and diminishing apoptosis (decreased cleaved caspase-3) at the protein level (G). This establishes ATF3 as the essential downstream effector.
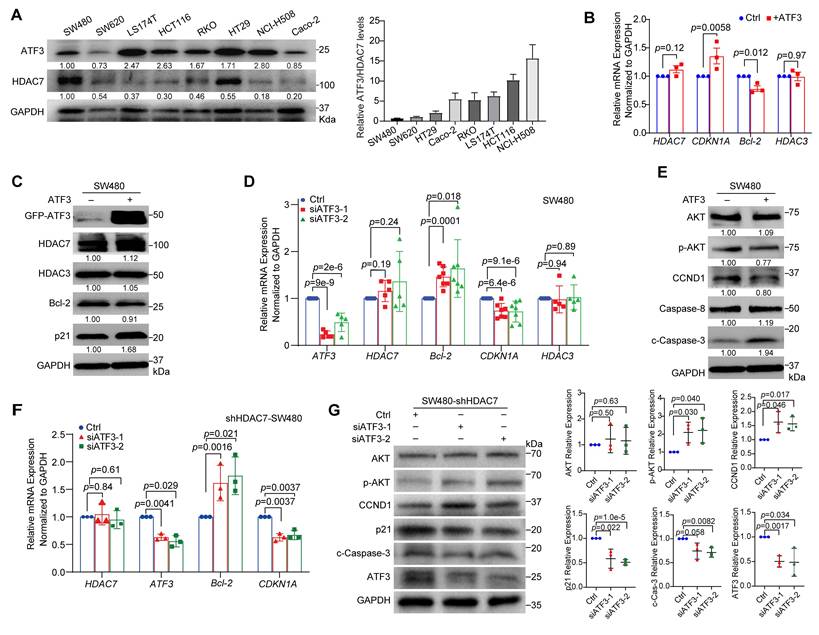
We next investigated ATF3's functional role. Overexpression of GFP-tagged ATF3 (GFP-ATF3) in both SW480 and LS174T cells upregulated CDKN1A (p21) mRNA and protein levels and downregulated Bcl-2 expression (Figure 4B, 4C, S4A, S4B). Conversely, siRNA-mediated ATF3 knockdown (siATF3-1, siATF3-2) produced the opposite effect (Figure 4D, S4C). Additionally, Western blot analysis showed that GFP-ATF3 overexpression also suppressed oncogenic PI3K-Akt signaling (reduced p-Akt and Cyclin D1) and promoted apoptosis (increased cleaved Caspase-3) (Figure 4E, S4A). Importantly, ATF3 overexpression or knockdown did not alter HDAC7 or HDAC3 expression levels (Figure 4B-D, S4A-C), positioning HDAC7 and HDAC3 as upstream regulators. These findings underscore ATF3's critical role in regulating Bcl-2 and CDKN1A transcription, thereby influencing key survival and cell cycle pathways in CRC cells [23, 34].
This upstream relationship was confirmed through a genetic rescue experiment. siRNA-mediated co-depletion of ATF3 in HDAC7-knockdown cells reversed the tumor-suppressive effects induced by HDAC7 depletion. Specifically, it partially restored Bcl-2 expression and reduced CDKN1A levels (Figure 4F). Furthermore, Western blot analysis revealed that ATF3 co-silencing reactivated PI3K-Akt signaling (increased p-Akt and Cyclin D1), and diminished apoptosis (decreased cleaved caspase-3) (Figure 4G). This establishes ATF3 as the essential downstream effector mediating the anti-tumor impact of HDAC7 loss.
HDAC7 scaffolds a catalytic-independent repressive complex at the ATF3 locus
To understand the molecular mechanism underlying HDAC7-mediated repression, we first investigated complex formation. Co-immunoprecipitation (Co-IP) assays showed that GFP-tagged ATF3 was associated with HDAC7 and the class I deacetylase HDAC3, but not the co-repressor SIN3A, in HEK293T cells (Figure 5A, S4D). Endogenous Co-IP confirmed HDAC7 presence in ATF3 immunocomplexes in SW480 cells (Figure S4E). Notably, HDAC7 knockdown attenuated the ATF3-HDAC3 interaction (Figure S4F), indicating that HDAC7 acts as a scaffold to stabilize the ternary HDAC7-HDAC3-ATF3 complex.
HDAC7 scaffolds a repressive complex at the ATF3 locus to control its transcriptional output. (A-C) Co-immunoprecipitation (Co-IP) assays demonstrate the physical interaction between HDAC7, HDAC3, and ATF3. (A) GFP-ATF3 co-precipitates with Flag-HDAC7 and endogenous HDAC3 in HEK293T cells. (B) The Class IIa HDAC inhibitor TMP269 does not disrupt the HDAC7-ATF3-HDAC3 interaction. (C) A catalytic domain-deletion mutant of HDAC7 (Δ-Mut) retains binding to ATF3 and HDAC3, confirming a scaffolding mechanism independent of deacetylase activity. (D, E) Functional rescue of HDAC7 depletion. Re-expression of wild-type (WT) HDAC7, but not the Δ-Mut, in HDAC7-knockdown SW480 cells restores the repressive molecular phenotype, as shown by qRT-PCR (D) (n = 3; two-tailed unpaired Student's t-test) and Western blot (E). This indicates the catalytic domain contributes to optimal repressor function. Data are mean ± S.D. (F) Public ChIP-seq tracks (GEO datasets) show co-occupancy of ATF3 with active chromatin marks (H3K27ac) and transcriptional co-activators (BRD4, Pol II, p300) at enhancer (p1-p3) and promoter (p4-p7) regions of the ATF3 locus. (G, H) ChIP-qPCR analysis in SW480 cells. Stable HDAC7 knockdown does not alter ATF3 occupancy but significantly increases enrichment of active marks (H3K27ac, H3K18ac) and co-activators (BRD4, Pol II) at ATF3 regulatory regions (G, H). It also decreases phosphorylation of Pol II (S2P/S5P) (H), indicating a shift in transcriptional state. Data are mean ± S.E.M. (n = 3; two-tailed unpaired t-test). (I) ChIP-qPCR shows that re-expression of WT HDAC7, but not the Δ-Mut, reverses the HDAC7 knockdown-induced increase in H3K27ac, despite similar chromatin occupancy. This confirms the catalytic domain's role in recruiting co-repressor activity. Data are mean ± S.E.M. (n ≥ 2; two-tailed unpaired t-test). (J) ATF3 promoter-driven luciferase reporter assay. Schematic depiction of the ATF3 promoter-driven luciferase reporter construct (top). HDAC7 knockdown significantly increases reporter activity in SW480 cells (bottom), confirming enhanced ATF3 transcription. The pGL3 plasmid construct carrying the ATF3 core promoter region (-366 - +134 bp) was transfected into Scr or shHDAC7 knockdown SW480 cells. Luciferase activity was normalized to Renilla luciferase activity. Quantitative data (bottom) are shown as mean ± S.D. (n ≥ 9). p-values are calculated using a two-tailed unpaired Student's t-test.
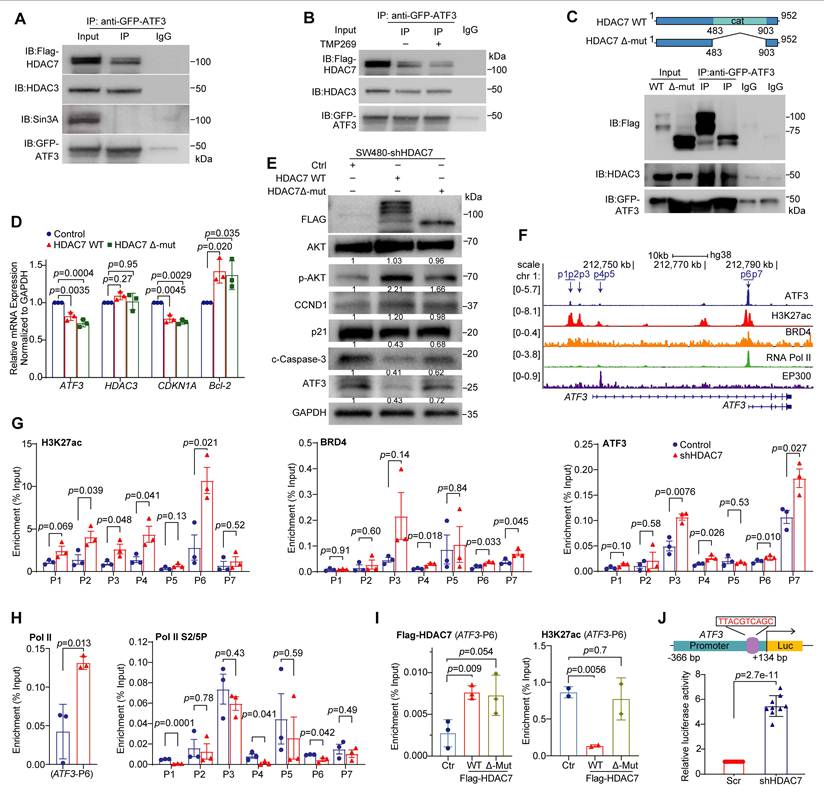
To investigate whether this scaffolding interaction depends on HDAC7's deacetylase activity, we next used the class IIa HDAC inhibitor TMP269 and the HDAC7 catalytic domain deletion mutant (Δ-Mut). Neither pharmacological inhibition (TMP269) nor expression of the catalytically dead mutant (Δ-Mut) disrupted the ATF3-HDAC7/HDAC3 complex formation (Figure 5B, 5C), suggesting that the complex assembly occurs independently of catalysis. However, functional rescue experiments revealed a role for the catalytic domain in repressive activity. Re-expression of wild-type (WT) HDAC7 in knockdown cells restored the repressive phenotype, reversing the ATF3 and CDKN1A (p21) upregulation and Bcl-2 downregulation. In contrast, the Δ-Mut showed markedly weaker rescue capacity (Figure 5D, 5E). These results indicate that while dispensable for complex assembly, the catalytic domain contributes to repressor function, likely by stabilizing the complex.
We then validated the functional importance of HDAC3 within this axis. siRNA-mediated HDAC3 knockdown (siHDAC3-1, siHDAC3-2) phenocopied HDAC7 loss, increasing ATF3 and p21 (CDKN1A) expression while decreasing HDAC7 and Bcl-2, and suppressing oncogenic PI3K-Akt signaling (Figure S5A, S5B). Functional assays validated that HDAC3 depletion also reduced colony formation (Figure S5C) and promoted apoptosis (Figure S5D). Notably, combined knockdown of HDAC7 and HDAC3 produced an additive tumor-suppressive effect (Figure S5E, S5F), underscoring their cooperative role in sustaining the repressive state.
To understand the transcriptional consequences of this complex at chromatin, we integrated public ChIP-seq datasets from the Gene Expression Omnibus (GEO). Bioinformatics analysis revealed that ATF3-binding sites (GSE32465) colocalize with regions enriched for active chromatin marks (H3K27ac; GSE143653) and co-activators such as BRD4 (GSE73319), p300 (GSE51176), and Pol II (GSE179540) (Figure 5F) [37-41]. This suggests an intrinsic potential for ATF3 autoregulation. Consistent with this, ChIP-qPCR in SW480 cells showed that HDAC7 knockdown generally did not displace ATF3 from its own promoter. Instead, it substantially increased the recruitment of BRD4 and Pol II and the enrichment of H3K27ac and H3K18ac at ATF3 regulatory loci (Figure 5G, 5H, S4G). HDAC7 depletion also reduced levels of phosphorylated Pol II at serine-2 and -5 (S2P and S5P), reflecting a shift in transcriptional state [42].
To directly examine HDAC7 occupancy, we performed ChIP using Flag-tagged constructs. Both WT HDAC7 and the Δ-Mut showed comparable enrichment at the ATF3 promoter (Figure 5I), confirming that chromatin binding is mediated by the N-terminal domain independently of catalytic function. Despite equivalent promoter occupancy, only re-expression of WT HDAC7, but not the Δ-Mut, reversed the HDAC7 knockdown-induced accumulation of H3K27ac at the locus (Figure 5I). This demonstrates that the catalytic domain is required for co-repressor activity and histone deacetylation. Furthermore, we constructed an ATF3 promoter-driven luciferase reporter assay in SW480 cells, in which HDAC7 depletion enhanced the reporter activity, consistent with derepressed ATF3 transcription (Figure 5J).
In summary, ATF3's transcriptional output is determined by a competitive balance between co-activator and co-repressor complexes. In CRC, elevated HDAC7 scaffolds a repressive complex with HDAC3 and ATF3 at the ATF3 locus, limiting co-activator recruitment and histone acetylation to maintain transcriptional silencing. Depletion or inhibition of HDAC7 disrupts the scaffold and shifts this equilibrium, enabling ATF3 to recruit co-activators BRD4 and Pol II, elevate H3K27ac, and initiate a self-activating loop that promotes a tumor-suppressive program.
Pharmacological inhibition of HDAC7 promotes ATF3 autoregulation by facilitating BRD4 and Pol II recruitment
To characterize the functional consequence of HDAC7 inhibition on ATF3 regulation, we treated SW480 cells with the pan-class I/II HDAC inhibitor SAHA or the class IIa-selective inhibitor TMP269. Both inhibitors induced a time-dependent upregulation of ATF3 and its target CDKN1A (p21) mRNA (Figure 6A). While SAHA also reduced HDAC7 mRNA and protein levels, TMP269 showed no significant effects (Figure 6A-C, S6A) [43, 44], confirming that class IIa HDAC inhibition directly targets HDAC7 activity rather than its expression.
Pharmacological inhibition of HDAC7 reactivates ATF3-mediated tumor suppression. (A) Time-course qRT-PCR analysis of ATF3, HDAC7 and CDKN1A (p21) mRNA levels in SW480 cells treated with SAHA (1.5 µM, left) and TMP269 (3 µM, right). Data are mean ± S.D. (n = 3; two-tailed unpaired Student's t-test). (B) qRT-PCR analysis of HDAC7, CDKN1A, Bcl-2 and ATF3 mRNA levels after 24-h treatment with SAHA (1.5 µM) or TMP269 (3 µM) in SW480 cells. Data are mean ± S.D. (n ≥ 3; two-tailed unpaired Student's t-test). (C) Western blot analysis of indicated proteins after SAHA (1.5 µM) or TMP269 (3 µM) treatment in SW480 cells (normalized to GAPDH). Data are shown as mean of three independent experiments. (D) ChIP-PCR analysis of H3K27ac, ATF3, BRD4, and Pol II enrichment at ATF3 regulatory regions in SW480 cells following treatment with DMSO vehicle (0.05%), SAHA (1.5 µM) or TMP269 (3 µM). Data are mean ± S.E.M (n ≥ 3; two-tailed unpaired Student's t-test). (E) ATF3 promoter-driven luciferase activity after treatment with SAHA (1.5 µM) or TMP269 (3 µM) in SW480 cells (normalized to Renilla luciferase). Data represent mean ± S.D. (n ≥ 3; two-tailed unpaired Student's t-test). (F) qRT-PCR analysis of ATF3 and HDAC7 expression in SW480 cells following treatment with SAHA (12 h), TMP269 (12 h), JQ1 (6 h) or the combination of JQ1 with SAHA or TMP269 (total 12 h). Data represent mean ± S.D. (n ≥ 3; two-tailed unpaired Student's t-test).
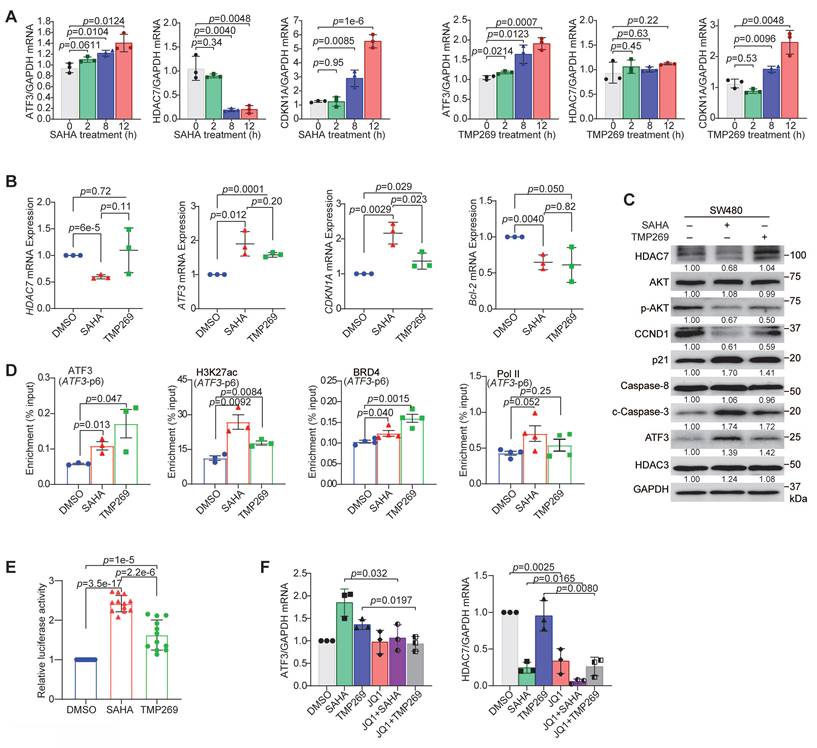
ChIP analysis revealed the underlying molecular mechanism. Both SAHA and TMP269 treatments increased chromatin enrichment of H3K27ac and H3K18ac and recruitment of ATF3, BRD4, and Pol II at the ATF3 loci (p6, p3) (Figure 6D, Figure S6B). Consistent with this open chromatin state, an ATF3 promoter-driven luciferase reporter showed enhanced activity upon inhibitor treatment (Figure 6E). These findings demonstrate that HDAC7 inhibition shifts the epigenetic landscape at the ATF3 gene, promoting co-activator recruitment and transcriptional activation. Notably, SAHA generally induced a stronger upregulation of ATF3 and CDKN1A (p21) (Figure 6B), and a greater increase in H3K27ac and Pol II enrichment, compared to TMP269 (Figure 6D). This differential efficacy suggests class I HDACs (notably HDAC3, a known component of the repressive complex) cooperate with class IIa HDAC7 to fully suppress ATF3 and subsequently regulate downstream targets (e.g., CDKN1A). Additionally, treatment with the BET bromodomain inhibitor JQ1 suppressed both ATF3 and HDAC7 expression and completely abrogated their induction by SAHA or TMP269 (Figure 6F). This confirms that BRD4 is an essential, downstream effector required for the transcriptional reactivation of ATF3 following HDAC7 inhibition.
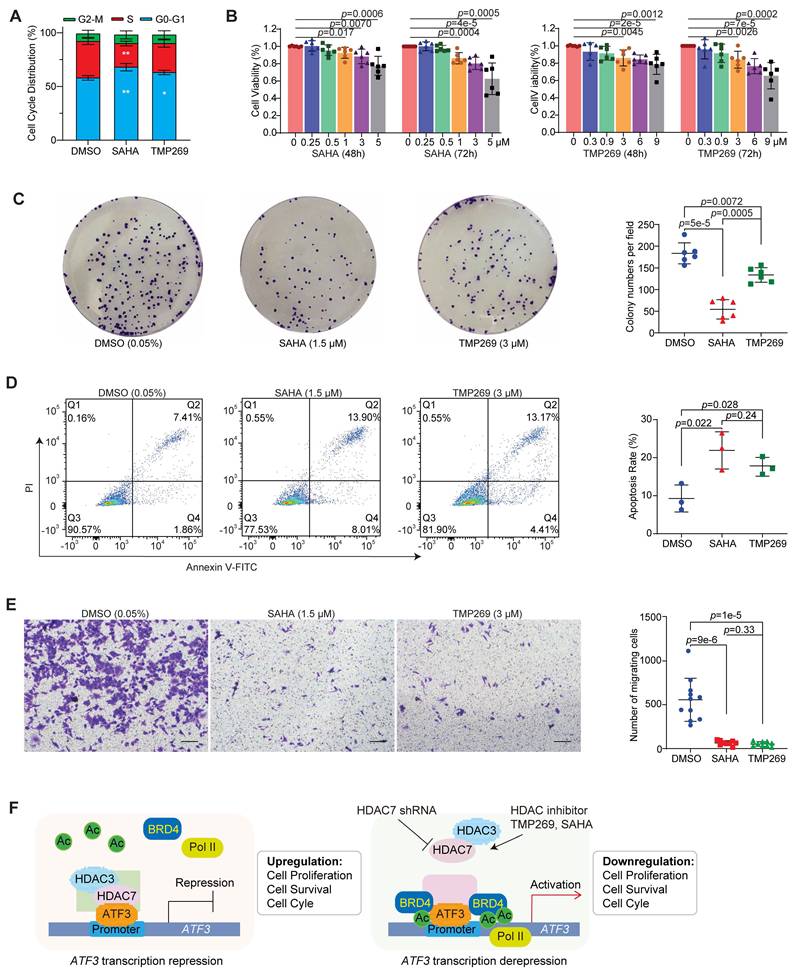
HDAC7 inhibition activates ATF3-mediated tumor suppression in CRC
To assess the tumor-suppressive consequences of HDAC7 inhibition, we examined its effects on key signaling pathways and cellular phenotypes. In SW480 cells, treatment with SAHA or TMP269 markedly suppressed oncogenic PI3K-Akt signaling (decreased p-Akt and Cyclin D1) and activated pro-apoptotic and cell cycle inhibitory programs (increased ATF3, p21 and cleaved Caspase-3) (Figure 6C, S6A). Functionally, this molecular inhibition translated into potent anti-tumor effects. Both compounds induced cell cycle arrest (Figure 7A, S7A), suppressed proliferation across HCT-116, HT29, SW480 and SW620 cell lines (Figure 7B, S7B, S7C, S7F), and inhibited long-term clonogenic survival in SW480 and SW620 cells (Figure 7C, S7D). Furthermore, these treatments promoted apoptosis (Figure 7D, S7E) and impaired metastatic potential in SW480 cells (Transwell migration assay; Figure 7E). These coordinated effects demonstrate class IIa HDAC (e.g., HDAC7) inhibition impedes CRC progression through a multipronged mechanism: reactivating ATF3 to suppress proliferative signaling (PI3K/Akt-Cyclin D1), enforce cell cycle arrest (via p21), and trigger apoptosis (caspase-3). The efficacy of TMP269 highlights its potential as a targeted therapeutic strategy to reactivate ATF3-mediated tumor suppression in CRC.
Pharmacological inhibition of HDAC7 suppresses CRC tumorigenesis. (A) Cell cycle distribution of SW480 cells after treatment with vehicle (0.05% DMSO), SAHA (1.5 µM) or TMP269 (3 µM). Bar charts show the percentages of cells in each phase. Quantitative data are mean ± S.D. (n ≥ 3; two-tailed unpaired Student's t-test; *, p < 0.05, **, p < 0.01). (B) Dose- and time-dependent suppression of SW480 cell viability by SAHA (left) and TMP269 (right) as measured by MTT assay. Cells were treated with indicated concentrations of SAHA (0, 0.25, 0.5, 1, 3 and 5 µM) or TMP269 (0, 0.3, 0.9, 3, 6 and 9 µM) for 48 or 72 h. Data represent mean ± SD (n ≥ 3; two-tailed unpaired Student's t-test). (C) Colony-formation assay of SW480 cells treated with DMSO (0.05%), SAHA (1.5 µM) or TMP269 (3 µM). Quantitative data are mean ± S.D. (n ≥ 3; two-tailed unpaired Student's t-test). (D) Apoptosis assessed by Annexin V/PI staining and flow cytometry in SW480 cells following treatment with 0.05% DMSO, 1.5 µM SAHA, or 3 µM TMP269. Quantitative data are shown as mean ± S.D. (n ≥ 3; two-tailed unpaired Student's t-test). (E) Transwell migration assay. SW480 cells were treated with 1.5 µM SAHA or 3 µM TMP269, and migrated cells were stained with crystal violet. Representative images (left) and quantification (right) are shown. Data are mean ± SD (n ≥ 3; two-tailed unpaired Student's t-test). (F) Mechanistic model of HDAC7-mediated epigenetic regulation of ATF3 in CRC. Left: In the oncogenic state, HDAC7 scaffolds a repressive complex with HDAC3 and ATF3 at the ATF3 promoter, reducing H3K27ac and excluding Pol II and co-activators like BRD4, thereby silencing ATF3 transcription. Right: Genetic depletion or pharmacological inhibition of HDAC7 disrupts the complex. This enables the recruitment of BRD4 and Pol II, increases H3K27ac, and initiates a self-activating loop of ATF3 self-activation, restoring its tumor-suppressive function. ATF3 chromatin occupancy remains unchanged.
Discussion
CRC remains a leading cause of cancer-related mortality worldwide. Despite therapeutic advances, its rising incidence and mortality underscore the urgent need for innovative treatment strategies [45]. In this study, we identify HDAC7 as a pivotal epigenetic regulator of CRC pathogenesis. We demonstrate that HDAC7 is overexpressed in CRC tumors, where its levels correlate with advanced disease stage, metastasis, and poor patient survival. Mechanistically, HDAC7 does not rely on its weak deacetylase activity but instead functions as a scaffold for a repressive complex with HDAC3 and ATF3 at ATF3 regulatory regions. This complex reduces activating histone marks (H3K27ac/H3K18ac), excludes co-activators such as BRD4 and Pol II, and epigenetically silences ATF3 transcription. Consequently, ATF3's tumor-suppressive functions are disabled, while augmenting oncogenic PI3K-Akt signaling (p-Akt: Ser473, Cyclin D1) and suppressing the Hippo pathway (p-YAP: Ser127).
Genetic depletion or pharmacological inhibition of HDAC7 disrupts this repressive complex, triggering a functional shift in ATF3. Once dissociated from repression, ATF3 recruits BRD4 and Pol II, increases H3K27ac at its own promoter, and initiates a self-activating loop that robustly activates its own transcription. Reactivated ATF3 then executes a tumor-suppressive pathway through downregulating Bcl-2, upregulating p21/CDKN1A, inducing caspase-3-mediated apoptosis, and suppressing tumor growth in vivo. These findings illustrate HDAC7 inhibition as a promising therapeutic strategy to reactivate ATF3-mediated tumor suppression in CRC, particularly in patients with a low ATF3/HDAC7 expression ratio, which is a potential biomarker of aggressive disease.
Our work also resolves the longstanding paradox of ATF3's context-dependent roles in cancer. We show that ATF3's function as a transcriptional repressor or activator is not intrinsic but is determined by the competitive recruitment of opposing cofactor complexes. In CRC, high HDAC7 levels scaffold a repressive HDAC3 complex, confining ATF3 in an inactive, oncogenic state (Figure 7F). Inhibition of HDAC7 shifts the equilibrium, allowing ATF3 to engage BRD4/Pol II/p300 co-activator complexes and transition to a tumor-suppressive, self-activating state (Figure 7F).
These findings offer fundamental insight into transcription factor plasticity, demonstrating how a single factor's function is governed by the local chromatin environment and cofactor availability [46, 47]. This model extends beyond CRC and may represent a generalizable mechanism for other bZIP transcription factors, whereby a scaffolding protein regulates transcription factor function by dictating cofactor recruitment.
Therapeutically, our work highlights the promise of selective HDAC7 inhibitors, such as TMP269 derivatives, to stimulate ATF3 to its tumor-suppressive state. Future efforts should focus on identifying the precise cis-regulatory motifs and dimerization partners that govern ATF3's transition between repressor and activator complexes, characterizing the tissue-specific dynamics of the HDAC7-ATF3 axis in other malignancies, and ultimately validating the ATF3/HDAC7 ratio as a clinical biomarker for patient stratification.
Abbreviations
HDACs: histone deacetylases; CRC: colorectal cancer; Co-IP: co-immunoprecipitation; HATs: histone acetyltransferases; HDACi: HDAC inhibitors; PEI: polyethyleneimine linear; ORF: open reading frame; H&E: hematoxylin and eosin; EdU: 5-ethynyl-2'-deoxyuridine; MTT: 3-[4,5-dimethylthiazol-2-yl]-2,5-diphenyl tetrazolium bromide; PI: propidium iodide; RT-qPCR: reverse transcription quantitative polymerase chain reaction; CCND1: Cyclin D1; Co-IP: co-immunoprecipitation assay; COAD: colon adenocarcinoma; READ: rectum adenocarcinoma; OS: overall survival; DFS: disease-free survival.
Supplementary Material
Supplementary figures and tables.
Acknowledgements
We thank the biobank at the First Hospital of Jilin University (Changchun, China) for colonic samples from CRC patients. We are grateful to the immunohistochemistry core at the First Hospital of Jilin University for their assistance. We thank the flow cores at the First Hospital of Jilin University for their skills and assistance with flow cytometry. Further, we acknowledge the BGI Group for generating RNA-seq data. We thank the State Key Laboratory of Supramolecular Structure and Materials at Jilin University for the use of their research facilities.
Funding
This work was supported in part by the research fund from the First Hospital of Jilin University (Changchun, China), the Open Project of State Key Laboratory for Supramolecular Structure and Materials, JLU (SKLSSM201602), JLU Science and Technology Innovative Research Team (JLUSTIRT, 2017TD-25), International Center of Future Science, JLU, and National Natural Science Foundation of China (31770780; L.Z.).
Author contributions
L.Z., M.-M.Z., and Q.W. conceived the project. Qi W. performed experiments. Qi W. and T.L. performed cell transfection and qRT-PCR. Qi W., Y.J., and K.C. conducted cellular experiments. Qi W., W.G., and S.L. performed CRC patient tissue experiments. Qi W., D.J., Y.L., and C.W. performed ChIP and animal experiments. L.Z. and M.-M.Z. wrote the manuscript with input from all co-authors.
Data availability
The data that support this study are available from the corresponding authors upon reasonable request. All protocols used in this study are available in the Methods sections. All RNA-seq data generated in this study are deposited in the NCBI SRA database under BioProject accession code (PRJNA1170925). Source data are provided with this paper. Supplementary Information is available in the online version of the paper.
Ethics approval statement
All procedures involving human participants were conducted in accordance with the ethical standards of the Declaration of Helsinki (2013). Written informed consent was obtained from all patients, and the study protocol was approved by the Research Ethics Committee of the First Hospital of Jilin University.
All animal experiments were performed under a protocol approved by the Institutional Animal Care and Use Committee (IACUC) of the First Hospital of Jilin University (#A2021-028) and in compliance with Directive 2010/63/EU of the European Parliament on the protection of animals used for scientific purposes.
Competing Interests
The authors have declared that no competing interest exists.
References
1. Ferlay J, Colombet M, Soerjomataram I, Parkin DM, Piñeros M, Znaor A. et al. Cancer statistics for the year 2020: An overview. International Journal of Cancer. 2021;149:778-789
2. Dekker E, Tanis PJ, Vleugels JLA, Kasi PM, Wallace MB. Colorectal cancer. Lancet. 2019;394:1467-80
3. Kishore C. Epigenetic Regulation and Promising Therapies in Colorectal Cancer. Current Molecular Pharmacology. 2021;14:838-52
4. Jung G, Hernández-Illán E, Moreira L, Balaguer F, Goel A. Epigenetics of colorectal cancer: biomarker and therapeutic potential. Nature Reviews Gastroenterology & Hepatology. 2020;17:111-30
5. Seto E, Yoshida M. Erasers of histone acetylation: the histone deacetylase enzymes. Cold Spring Harbor Perspectives in Biology. 2014;6:a018713
6. Parra M. Class IIa HDACs - new insights into their functions in physiology and pathology. The FEBS Journal. 2015;282:1736-44
7. Schuetz A, Min J, Allali-Hassani A, Schapira M, Shuen M, Loppnau P. et al. Human HDAC7 harbors a class IIa histone deacetylase-specific zinc binding motif and cryptic deacetylase activity. The Journal of Biological Chemistry. 2008;283:11355-63
8. Fischle W, Dequiedt F, Fillion M, Hendzel MJ, Voelter W, Verdin E. Human HDAC7 histone deacetylase activity is associated with HDAC3 in vivo. The Journal of Biological Chemistry. 2001;276:35826-35
9. Barneda-Zahonero B, Collazo O, Azagra A, Fernández-Duran I, Serra-Musach J, Islam AB. et al. The transcriptional repressor HDAC7 promotes apoptosis and c-Myc downregulation in particular types of leukemia and lymphoma. Cell Death & Disease. 2015;6:e1635
10. Zhu C, Chen Q, Xie Z, Ai J, Tong L, Ding J. et al. The role of histone deacetylase 7 (HDAC7) in cancer cell proliferation: regulation on c-Myc. Journal of Molecular Medicine (Berlin, Germany). 2011;89:279-89
11. Milazzo G, Mercatelli D, Di Muzio G, Triboli L, De Rosa P, Perini G. et al. Histone Deacetylases (HDACs): Evolution, Specificity, Role in Transcriptional Complexes, and Pharmacological Actionability. Genes (Basel). 2020;11:556
12. Rodríguez-Martínez JA, Reinke AW, Bhimsaria D, Keating AE, Ansari AZ. Combinatorial bZIP dimers display complex DNA-binding specificity landscapes. eLife. 2017 6
13. Mashima T, Udagawa S, Tsuruo T. Involvement of transcriptional repressor ATF3 in acceleration of caspase protease activation during DNA damaging agent-induced apoptosis. Journal of Cellular Physiology. 2001;188:352-8
14. Hai T, Curran T. Cross-family dimerization of transcription factors Fos/Jun and ATF/CREB alters DNA binding specificity. Proceedings of the National Academy of Sciences of the United States of America. 1991;88:3720-4
15. Palombo R, Passacantilli I, Terracciano F, Capone A, Matteocci A, Tournier S. et al. Inhibition of the PI3K/AKT/mTOR signaling promotes an M1 macrophage switch by repressing the ATF3-CXCL8 axis in Ewing sarcoma. Cancer Letters. 2023;555:216042
16. Liang Y, Jiang Y, Jin X, Chen P, Heng Y, Cai L. et al. Neddylation inhibition activates the protective autophagy through NF-κB-catalase-ATF3 Axis in human esophageal cancer cells. Cell Commun. Signal. 2020;18:72
17. Gilchrist M, Thorsson V, Li B, Rust AG, Korb M, Roach JC. et al. Systems biology approaches identify ATF3 as a negative regulator of Toll-like receptor 4. Nature. 2006;441:173-8
18. Du Y, Ma Z, Zheng J, Huang S, Yang X, Song Y. et al. ATF3 Positively Regulates Antibacterial Immunity by Modulating Macrophage Killing and Migration Functions. Front Immunol. 2022;13:839502
19. Shi Z, Zhang K, Chen T, Zhang Y, Du X, Zhao Y. et al. Transcriptional factor ATF3 promotes liver fibrosis via activating hepatic stellate cells. Cell Death & Disease. 2020;11:1066
20. Taketani K, Kawauchi J, Tanaka-Okamoto M, Ishizaki H, Tanaka Y, Sakai T. et al. Key role of ATF3 in p53-dependent DR5 induction upon DNA damage of human colon cancer cells. Oncogene. 2012;31:2210-21
21. Hai TW, Liu F, Coukos WJ, Green MR. Transcription factor ATF cDNA clones: an extensive family of leucine zipper proteins able to selectively form DNA-binding heterodimers. Genes & Development. 1989;3:2083-90
22. James CG, Woods A, Underhill TM, Beier F. The transcription factor ATF3 is upregulated during chondrocyte differentiation and represses cyclin D1 and A gene transcription. BMC Mol Biol. 2006;7:30
23. Jiang X, Kim KJ, Ha T, Lee SH. Potential Dual Role of Activating Transcription Factor 3 in Colorectal Cancer. Anticancer Research. 2016;36:509-16
24. Inaba Y, Hashiuchi E, Watanabe H, Kimura K, Oshima Y, Tsuchiya K. et al. The transcription factor ATF3 switches cell death from apoptosis to necroptosis in hepatic steatosis in male mice. Nature Communications. 2023;14:167
25. Hackl C, Lang SA, Moser C, Mori A, Fichtner-Feigl S, Hellerbrand C. et al. Activating transcription factor-3 (ATF3) functions as a tumor suppressor in colon cancer and is up-regulated upon heat-shock protein 90 (Hsp90) inhibition. BMC Cancer. 2010;10:668
26. Xie G, Dong P, Chen H, Xu L, Liu Y, Ma Y. et al. Decreased expression of ATF3, orchestrated by β-catenin/TCF3, miR-17-5p and HOXA11-AS, promoted gastric cancer progression via increased β-catenin and CEMIP. Experimental & Molecular Medicine. 2021;53:1706-22
27. Song HM, Park GH, Koo JS, Jeong HJ, Jeong JB. Vitex rotundifolia Fruit Extract Induces Apoptosis Through the Downregulation of ATF3-Mediated Bcl-2 Expression in Human Colorectal Cancer Cells. Am J Chin Med. 2017;45:901-15
28. Bottone FG Jr, Moon Y, Kim JS, Alston-Mills B, Ishibashi M, Eling TE. The anti-invasive activity of cyclooxygenase inhibitors is regulated by the transcription factor ATF3 (activating transcription factor 3). Molecular Cancer Therapeutics. 2005;4:693-703
29. Wu ZY, Wei ZM, Sun SJ, Yuan J, Jiao SC. Activating transcription factor 3 promotes colon cancer metastasis. Tumour Biology. 2014;35:8329-34
30. Dziunycz PJ, Lefort K, Wu X, Freiberger SN, Neu J, Djerbi N. et al. The oncogene ATF3 is potentiated by cyclosporine A and ultraviolet light A. The Journal of Investigative Dermatology. 2014;134:1998-2004
31. Piyanuch R, Sukhthankar M, Wandee G, Baek SJ. Berberine, a natural isoquinoline alkaloid, induces NAG-1 and ATF3 expression in human colorectal cancer cells. Cancer Letters. 2007;258:230-40
32. Duncan RM, Reyes L, Moats K, Robinson RM, Murphy SA, Kaur B. et al. ATF3 Coordinates Antitumor Synergy between Epigenetic Drugs and Protein Disulfide Isomerase Inhibitors. Cancer Research. 2020;80:3279-91
33. Darlyuk-Saadon I, Weidenfeld-Baranboim K, Yokoyama KK, Hai T, Aronheim A. The bZIP repressor proteins, c-Jun dimerization protein 2 and activating transcription factor 3, recruit multiple HDAC members to the ATF3 promoter. Biochimica et Biophysica Acta. 2012;1819:1142-53
34. Zhao J, Li X, Guo M, Yu J, Yan C. The common stress responsive transcription factor ATF3 binds genomic sites enriched with p300 and H3K27ac for transcriptional regulation. BMC Genomics. 2016;17:335
35. Hu XT, Xing W, Zhao RS, Tan Y, Wu XF, Ao LQ. et al. HDAC2 inhibits EMT-mediated cancer metastasis by downregulating the long noncoding RNA H19 in colorectal cancer. Journal of Experimental & Clinical Cancer Research. 2020;39:270
36. Chen C, Ge C, Liu Z, Li L, Zhao F, Tian H. et al. ATF3 inhibits the tumorigenesis and progression of hepatocellular carcinoma cells via upregulation of CYR61 expression. Journal of Experimental & Clinical Cancer Research. 2018;37:263
37. Lee R, Kang MK, Kim YJ, Yang B, Shim H, Kim S. et al. CTCF-mediated chromatin looping provides a topological framework for the formation of phase-separated transcriptional condensates. Nucleic Acids Research. 2022;50:207-26
38. McCleland ML, Mesh K, Lorenzana E, Chopra VS, Segal E, Watanabe C. et al. CCAT1 is an enhancer-templated RNA that predicts BET sensitivity in colorectal cancer. The Journal of Clinical Investigation. 2016;126:639-52
39. Gertz J, Savic D, Varley KE, Partridge EC, Safi A, Jain P. et al. Distinct properties of cell-type-specific and shared transcription factor binding sites. Molecular Cell. 2013;52:25-36
40. Hu D, Gao X, Morgan MA, Herz HM, Smith ER, Shilatifard A. The MLL3/MLL4 branches of the COMPASS family function as major histone H3K4 monomethylases at enhancers. Molecular and Cellular Biology. 2013;33:4745-54
41. Gopi LK, Kidder BL. Integrative pan cancer analysis reveals epigenomic variation in cancer type and cell specific chromatin domains. Nature Communications. 2021;12:1419
42. Guo YE, Manteiga JC, Henninger JE, Sabari BR, Dall'Agnese A, Hannett NM. et al. Pol II phosphorylation regulates a switch between transcriptional and splicing condensates. Nature. 2019;572:543-8
43. Minisini M, Di Giorgio E, Kerschbamer E, Dalla E, Faggiani M, Franforte E. et al. Transcriptomic and genomic studies classify NKL54 as a histone deacetylase inhibitor with indirect influence on MEF2-dependent transcription. Nucleic Acids Research. 2022;50:2566-86
44. Witt AE, Lee CW, Lee TI, Azzam DJ, Wang B, Caslini C. et al. Identification of a cancer stem cell-specific function for the histone deacetylases, HDAC1 and HDAC7, in breast and ovarian cancer. Oncogene. 2017;36:1707-20
45. Siegel RL, Miller KD, Fuchs HE, Jemal A. Cancer statistics, 2022. CA: A Cancer Journal for Clinicians. 2022;72:7-33
46. Rosenfeld MG, Lunyak VV, Glass CK. Sensors and signals: a coactivator/corepressor/epigenetic code for integrating signal-dependent programs of transcriptional response. Genes & Development. 2006;20:1405-28
47. Schmitges FW, Radovani E, Najafabadi HS, Barazandeh M, Campitelli LF, Yin Y. et al. Multiparameter functional diversity of human C2H2 zinc finger proteins. Genome Res. 2016;26:1742-52
Author contact
![]() Corresponding authors: leizengedu.cn; ming-ming.zhouedu; wquanedu.cn.
Corresponding authors: leizengedu.cn; ming-ming.zhouedu; wquanedu.cn.