Impact Factor ISSN: 1449-2288
- Issue 9; 2026
- Issue 8; 2026
- Issue 7; 2026
- Issue 6; 2026
- Issue 5; 2026
- Volume 22; 2026
- Past Issues
- Advance Articles
- Editorial Board
- Cover Images
- Index & Coverage
- Cover Suggestion
- Special Issues
INTRODUCTION
MATERIAL AND METHODS
RESULTS
DISCUSSION
SUPPLEMENTARY MATERIAL
Acknowledgements
References

 Global reach, higher impact
Int J Biol Sci 2011; 7(5):607-617. doi:10.7150/ijbs.7.607 This issue Cite
Research Paper
Immunophenotyping at the Time of Diagnosis Distinguishes Two Groups of Nasopharyngeal Carcinoma Patients: Implications for Adoptive Immunotherapy
Jiang Li1,2,3*, Qiu-yan Chen4*, Haoyuan Mo4, Yi-lan Zhang1,2,3, Zhou-feng Huang1,2,3, Yi-xin Zeng1,2,3 ![]()
1. State Key Laboratory of Oncology in South China, Sun Yat-sen University Cancer Center, Guangzhou, China;
2. Department of Experimental Research, Sun Yat-sen University Cancer Center, Guangzhou, China;
3. Department of Biotherapy, Sun Yat-sen University Cancer Center, Guangzhou, China;
4. Department of Nasopharyngeal Carcinoma, Sun Yat-sen University Cancer Center, Guangzhou, China.
* Co-first author
Received 2011-3-4; Accepted 2011-5-8; Published 2011-5-18
Abstract
Background: Adoptive immunotherapy with EBV-specific CTLs (EBV-CTL) has been used to treat EBV-associated nasopharyngeal carcinoma (NPC) but only a fraction of the patients shows noticeable clinical response.
Patients and Methods: Sixty-seven newly diagnosed NPC patients from 2005 to 2007 and 21 healthy donors were collected. Immunological parameters and immune function of PBMCs and EBV-CTL were analyzed by flow cytometer analysis (FACS) and 51Cr releasing experiment; Molecular characteristics on NPC tumor cells were investigated by immunochemical staining and statistic analysis.
Results: NPC patients can be classified into two groups based on the percentage of CD3+ T cells in peripheral blood before accepted any treatment, (>52.6%, mean-2SE from healthy controls, NPC Group 1; <52.6%, NPC Group 2). The patients in Group 2 showed a significant decrease of CD3+CD8+ T-cells, CD3+CD4+ T-cells and CD3+CD45RO+ memory T cells, and increase of CD3-CD16+ NK cells compared to Group 1 patients and healthy controls (P<0.001). EBV-specific T cell responses, were weaker in this group of patients and their tumor cells expressed lower levels of the EBV encoded latent membrane protein (LMP)-1 and HLA class II protein compared with the patients of NPC Group 1 (P<0.05) .
Conclusion: These findings demonstrate that NPC patients could be distinguished on the basis of their immune status which will affect the efficacy of EBV-CTL immunotherapy.
Keywords: NPC, EBV-specific CTL, immunotherapy, LMP1, immunophenotype
INTRODUCTION
EBV is a lymphotropic γ-herpes virus that can transform B-lymphocytes in vitro and is associated with malignancies of lymphoid and epithelial cell origin [1-4]. EBV is widespread in humans but the infection is efficiently controlled in the vast majority of immunocompetent individuals due to the activation of EBV-specific T cell responses that inhibit the growth of virus infected cells. Studies of patients suffering from Infection mononucleosis, a symptomatic primary EBV infection that is frequently observed in adolescents, have shown that non-specific NK-like effector cells and virus specific MHC class I and class II restricted lymphocytes synergized in controlling the growth of EBV infected cells but EBV-specific cytotoxic lymphocytes (EBV-CTL) appear to constitute the major component of the cellular immune response in healthy virus carriers [5-10].
EBV-CTL is currently recognized as an efficient means to treat certain types of EBV-associated malignancies. The most striking effects have been obtained in the treatment of post-transplantation lymphoproliferative disease (PTLD) where adoptive transfer of EBV-CTL inhibits tumor progression and may even induce regression and complete cure [11-13]. Some success was also reported in the treatment of Hodgkin lymphoma and NPC [14, 15] . However, it has been difficult to obtain consistent results or stable clinic efficacy in these tumor types [11, 12, 16, 17]. The reason for this different behavior in each patient is not completely clear. Although the capacity to respond to EBV infection appears to be overall preserved in both HD and NPC patients [2, 11], some imbalance of antiviral responses were also observed and active suppression of EBV specific T-cells responses was shown to occur at the tumor site [18, 19] . In this study we have looked for immunological parameters that may help to predict the efficacy of EBV-CTL adoptive immunotherapy. By immunophenotyping of circulating lymphocytes from a series of newly diagnosed patients before the initiation of treatment, we have been able to distinguish two groups of NPCs that behave differently with regard to their response to virus infected cells. We also found that these immunological differences in peripheral blood were correlated with the levels of expression of LMP1 and HLA class II antigens in the tumor cells.
MATERIAL AND METHODS
Study subjects
Heparinized venous blood were collected from 21 healthy donors and 67 untreated primary nasopharyngeal carcinoma (NPC) patients at the Cancer Center of Sun-Yat Sen University during 2005-2007, and 36 paraffin embedded tumor samples were collected from these patients in the same time. The detailed clinical and histopathological information see Table 1.
Clinical characteristics of the two groups of NPC patients
| Characteristic | No. of patients | NPC Group 1 | Constituent ratio (%) | NPC Group 2 | Constituent ratio (%) |
|---|---|---|---|---|---|
| Total | 67 | 40 | 27 | ||
| Age, Years | |||||
| <50 | 44 | 27 | 69.2 | 17 | 62.9 |
| ≥50 | 22 | 12 | 30.7 | 10 | 37.0 |
| Gender | |||||
| Male | 53 | 32 | 80 | 21 | 77.7 |
| female | 13 | 8 | 20 | 6 | 22.2 |
| Diagnosis | |||||
| Histological type | |||||
| Poorly differentiated squamous carcinoma | 4 | 2 | 5 | 2 | 7.4 |
| Undifferentiated non-keratinizing NPC | 62 | 38 | 95 | 25 | 92.6 |
| Grade | |||||
| T1 | 1 | 0 | 0 | 1 | 3.7 |
| T2 | 18 | 9 | 23.1 | 9 | 33.3 |
| T3 | 28 | 19 | 48.7 | 9 | 33.3 |
| T4 | 20 | 12 | 30.7 | 8 | 29.6 |
| Stage | |||||
| I-II | 9 | 4 | 10.3 | 5 | 18.5 |
| Ⅲ-IV | 58 | 36 | 92.3 | 22 | 81.4 |
| N stage | |||||
| N0- N1 | 31 | 19 | 48.7 | 12 | 44.4 |
| N2- N4 | 37 | 21 | 53.8 | 15 | 55.5 |
| Metastasis | |||||
| M0 | 65 | 38 | 95 | 26 | 92.3 |
| M1-4 | 2 | 2 | 5 | 1 | 3.7 |
All patients and healthy donors are South Chinese living in Guangdong province for 2-3 generation. The Ethical Committee of the Sun-Yat Sen University Cancer Center has approved the study and full consent was obtained from all patients and healthy donors.
Cell lines and cell culture
Peripheral blood mononuclear cells (PBMCs) were isolated from 20 ml heparinized blood by Ficoll/Isopaque gradient fractionation, and monocytes were depleted by plastic adherence. For generation of EBV transformed lymphoblastoid cell lines (LCL), 1X10⁶ PBMCs were incubated with concentrated supernatant of B95-8 cultures in the presence of 1 μg/mL cyclosporin A (Sigma, USA). For generation of EBV specific CTLs cryopreserved PBMCs were thawed and aliquots of 3x10⁶ cells were stimulated in 24 well plates with irradiated (4000 Rads) LCL cells at 40:1 (responder: stimulator (R:S) ratio). After 7 days, viable cells were re-stimulated under the same conditions, and 3 days later, the cells were expanded in complete RPMI 1640 medium containing 10 UI/ml IL-2 (R&D Systems Inc). The cultures were re-stimulated weekly. For generation of PHA blasts, PBMCs were stimulated with 1 μg/ml PHA-L (Sigma) for 3 days and expanded in IL-2 containing medium. The HLA type was determined by sequence specific primer (SSP)-PCR in the Guangzhou Organ Transplant and Tissue Typing Center.
Serum EBV antibody titers, DNA load and cytokine levels
Serum samples were collected for determining of EBV specific antibodies, EBV DNA load, and cytokines levels. IgA antibody titers against the EBV virus capsid antigen (VCA) and early antigen (EA) were detected using a commercial enzyme-labeling immunostaining assay detection kit (Zhongshan Biotechnology Company, Tianjin, China) according to the instruction of manufacturer. EBV DNA load was determined by real time quantitative PCR using the probe W-67T derived from the BamHI-W region of the EBV genome. The procedures for real-time quantitative PCR and reaction set-up were carried out as described previously [20]. The serum cytokine were analyzed using the human Th1/Th2 cytokine Cytometric Bead Array Kit (BD-Bioscience/Pharmingen, San Diego, CA) as described before [21].
Phenotype and tetramer analysis
PerCP, FITC or PE-conjugated mouse monoclonal antibodies (MAbs) to CD3 (Clone UCHT1), CD4 (Clone RPA-T4), CD8 (Clone RPA-T8), CD16 (Clone 3G8), CD45RA (Clone HI100), CD45RO (Clone UCHL1) from BD Pharmingen Company (San Jose, CA, USA) and FITC-conjugated anti-human CD4 (Clone RPA-T4) and PE-conjugated anti-human CD25 (BC96) from eBioscience (San Diego, CA, USA) were used for surface markers analysis with a FACS AriaTM machine and FACS Diva software (BD Biosciences). The frequency of T cell specific for HLA-A2 restricted epitopes in LMP1 and LMP2 was analyzed by staining with phycoerythrin (PE)-labeled tetrameric complex assembled with synthetic peptides origin from LMP1 YLQQNWWTL, YLLEMLWRL, ALLVLYSFA and LMP2 CLGGLLTMV, FLYALALLL, GLGTLGAAI, LLW TLVVLL (Guangzhou Taimo Corporation, Guangzhou, China). For each sample, 105 cells were analyzed using the FACS AriaTM and FACS Diva software (BD Biosciences).
CTL activity and cytokine release
CTL cytotoxic activity was evaluated in standard 4h 51Cr release assays, as previously described [22]. The targets panel included autologous LCLs and PHA blasts, allogeneic HLA class I mismatched LCLs. Three patterns of cytotoxicity were characterized as described [19] , Pattern I: EBV specific cytotoxicity, characterized by efficient lysis (>25% at 10:1 R:S ratio) of the autologous and allogenic HLA class I matched LCLs and no lysis of autologous PHA blast and HLA class I mismatched targets, Pattern II: LAK type cytotoxicity, characterized by equal lysis of HLA class I matched and mismatched LCLs, and Pattern III: no cytotoxicity, where the specific lysis against all targets was <10% at 10:1 R:S ratio. All assays were run in triplicate and the results are presented as the mean±SD. IFN-γ intracellular cytokine staining was performed using the Cytofix/Cytoperm Plus kit (BD PharMingen).5 x105 cells were stimulated with PMA/inomycin (0.5-1 μg/ml), auto-LCL or auto-PHA blast at 3:1 R:S ratio in 200 μl of complete RPMI 1640 medium in 96-well round tissue culture plate, containing GolgiPlug (BD Phar-Mingen, San Diego, CA) for 4 h at 37°C.
Immunohistochemistry
Antibodies used for immunohistochemistry (IHC) were: monoclonal antibody Epstein-Barr virus/LMP1 Ab-1 (Clone CS1+CS2+CS3+CS4, Lab Vision, USA), mouse anti-human IP-10 (Lot# 099CY39RB, AMS Biotechnolgy Europe Ltd, Abingdon, UK), CXCR4 (Lot# AVB06, clone 44716, R&D Systems Inc. Minneapolis, USA), CD54 (ICAM-1) (Catalog# MAB2130, CHEMICON international Inc, California, USA), SDF-1 (Lot# 0304M092RB, R&D), β2-microglobulin (Lot# 030, DakoCytomation, Dako Norden A/S, Denmark), HLA-DR (Lot# 068, Clone TAL.1B5, Dako). Immunohistochemistry was done according to standard protocols [23].
The expression of immune regulation regulated proteins in NPC lesions by IHC was scored as[24]: in 10 high-powered fields at X40 magnification: '0' means absent expression or positive staining < 5% cells, '1' means positive staining 5-25%, so '0-1' was defined as 'low' expression group (including absent and weak expression); '2' means positive staining cell 25-50%, '3' means >50% positive staining, '2-3' was defined as 'high' expression group (including moderate/strong expression) in this study.
Statistical analysis
Statistical analysis was performed with the SSPS 13.0 software package (SPSS Inc, Chicago, USA), using Chi-square test, t student test, or Mann-Whitney U test, with level of significance set at P<0.05.
RESULTS
Immunophenotyping of blood lymphocytes distinguishes two groups of NPC patients
Given that only a fraction of NPC patients show an obvious clinical response to adoptive immunotherapy with EBV-specific CTL (EBV-CTL) [16, 25], we attempted to determine if NPC patients can be categorized based on the immunophenotype of their circulating lymphocytes and serum EBV antibody titers. The immunophenotypes of PBMCs from NPC patients and healthy EBV carriers were investigated by immunofluorescence staining and FACS analysis (Fig. 1).
Immunophenotype of PBMCs from healthy donors, the NPC Group 1 and the NPC Group 2 patients. Surface markers were analyzed by FACS using directly immunofluorescence labeling in PBMCs from healthy donors (n=20); the NPC Group 1 patients (n=40); and the NPC Group 2 patients (n=27). * P<0.01
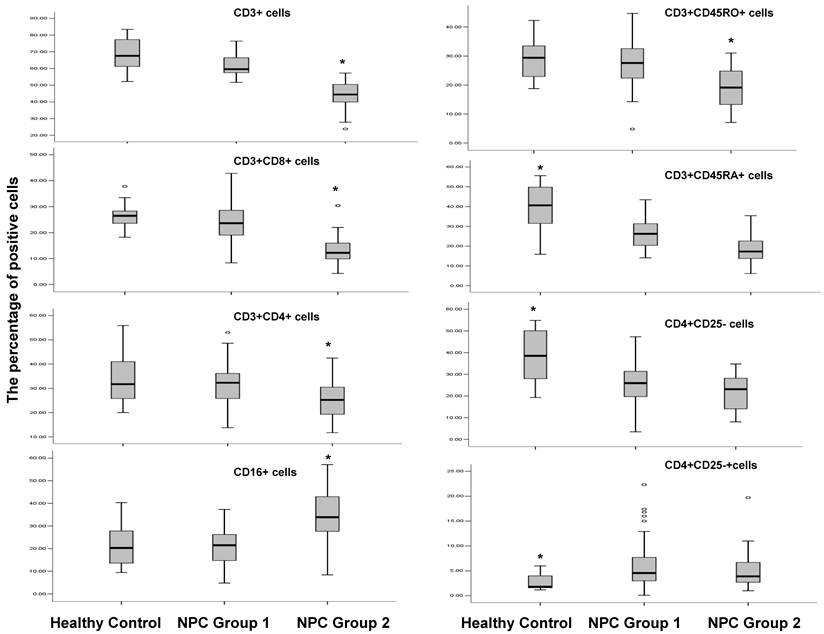
The percentage of CD3+ T-cells that corresponds to the mean -2SE of the percentage of CD3+ T-cells in healthy control (52.6%) was applied to cut off the subgroups of NPC patients in this study, we found that 40 out of 67 NPC patients (59.7%) had a percentage of CD3+ lymphocytes above this lower limit, designated here as NPC Group 1, while the remaining (41.3%) of the patients had lower proportion of CD3+ lymphocyte, designated as NPC Group 2. In brief, NPC Group 2 patients showed a significantly decreased percentage of CD3+ T-cells (44.1% VS 61.8% and 68.1% in NPC group 1 patients and healthy controls, respectively, P<0.001), CD3+CD8+ T-cells (13.8% VS 23.6% and 27.1%, P<0.001) and CD3+CD4+ T-cells (24.9% VS 31.6% and 33.7%, P<0.001) as well as CD3+CD45RO+ memory T lymphocytes (19.3% VS 27.2% and 28.6%, P<0.001); whereas the percentage of CD3-CD16+ NK cells was significantly higher compared with Group 1 and healthy controls (34% VS 21.2% and 22%, P<0.001). The percentage of CD4+CD25+ Treg cells was similar in NPC Group 1 and NPC Group 2 patients and in both cases significantly higher compared to healthy controls (7.5% and 7.0% VS 2.8%, P<0.001); while the percentage of CD3+CD45RA+ and CD4+CD25- was lower in patients of two NPC groups compared to healthy controls (19.5% and 26.9%, 38.6% and 21.8% VS 25.5% and 37.8%, respectively, P<0.001).
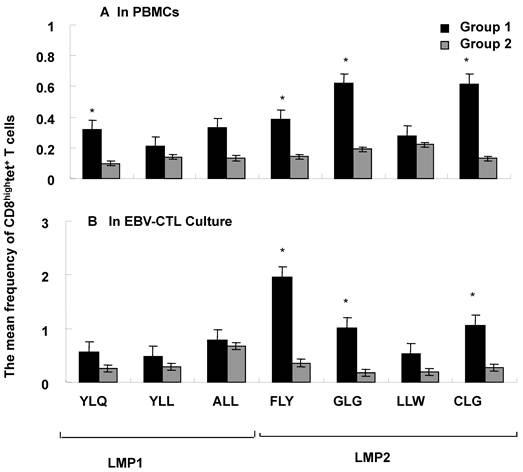
Furthermore, we investigated the frequency of HLA-A2 restricted EBV latent membrane antigens LMP1 (YLQ, YLL and ALL) and LMP2 (FLY, GLG, LLW and CLG) epitopic antigen-specific CTLs in the peripheral blood mononuclear cells (PBMCs) from the patients of two NPC groups by tetramer staining. The percentage of CD8hightetramer+ T cells including YLQ, YLL, ALL (LMP1) and FLY, GLG, LLW and CLG (LMP2) was analyzed in PBMCs or EBV-CTL cultures from HLA-A2 positive samples including 6 samples from NPC Group 1 and 4 samples from NPC Group 2 as shown in Fig 2A and 2B. Generally the frequency of LMP1 and LMP2 epitopic antigen-specific CTLs in PBMCs was much higher in Group 1 compared to Group 2, moreover the frequency of YLQ (LMP1), FLY, GLG and CLG (LMP2) epitopic antigen-specific CTLs in PBMCs was significantly higher in NPC Group 1 compared with NPC Group 2 (Fig. 2A, P<0,05).
Frequency of LMP1 and LMP2 epitope- specific T cells. The mean percentage of T cells specific for HLA A2 restricted on LMP1 and LMP2 was detected by EBV tetramer staining and FACS analysis in PBMCs (A) and EBV-CTL cultures (B) from NPC Group 1 (n=6) and NPC Group 2 (n=4).* means P<0.05
The cytokines levels, EBV-antibodies and DNA loading are different in NPC Group1 and NPC Group 2
The serum levels of Th1 (IFNγ, IL-2 and TNFα) and Th2 cytokines (IL-4, IL-6 and IL-10) were analyzed by CBA kit in 19 healthy controls, 17 NPC Group 1 and 10 NPC Group 2 patients (Table 2). The level of IFNγ was significantly higher in NPC Group 1 patients compared to NPC Group 2 patients (P<0.05) while the differences in other cytokines were not statistically significant between two NPC groups, although more samples positive for TNF-α and IL-2 were found in NPC Group 1 patients. However, compared to health donors the levels of IL-6, IL-10 and IFNγ were significantly increased in both NPC Group 1 and NPC Group 2 patients (P<0.05); while the level of TNFα was significantly increased in NPC Group 1 patients (P<0.05).
Cytokine levels in the serum from healthy control, and NPC Group 1 and NPC Group 2 patients.
| Cytokine | Healthy Control | NPC Group 1 | NPC Group 2 | |||
|---|---|---|---|---|---|---|
| Positive/Total (%) | Mean pg/ml | Positive/Total (%) | Mean pg/ml | Positive/Total (%) | Mean pg/ml | |
| IFN-γ | 0/19 (0) | 0 | 15/17 (88) | 4.2* | 4/10 (40) | 1.2*/** |
| TNF-α | 0/19 (0) | 0 | 7/17 (41) | 0.8* | 2/10 (20) | 0.3 |
| IL-2 | 1/19 (5) | 0.2 | 4/17 (24) | 0.6 | 0/10 (0) | 0 |
| IL-4 | 0/19 (0) | 0 | 3/17 (18) | 0.5 | 0/10 (0) | 0 |
| IL-6 | 0/19 (0) | 0 | 15/17 (88) | 2.9* | 6/10 (60) | 2.9* |
| IL-10 | 0/19 (0) | 0 | 15/17 (88) | 1.7* | 5/10 (50) | 1.3* |
*Significant difference from healthy donors (P<0.05).
** Significant difference from NPC group 1 patients (P<0.05).
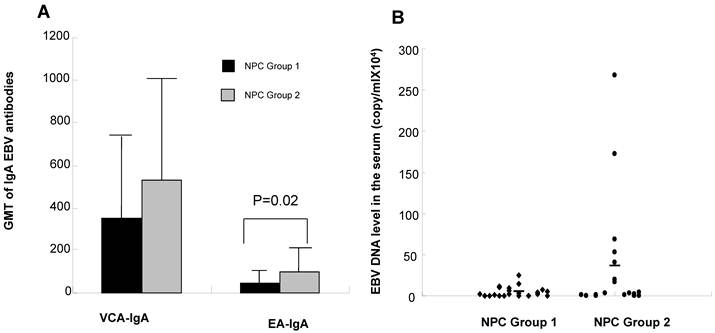
Furthermore, NPC Group 2 patients showed a significantly higher serum IgA anti EA (P<0.05), and a slightly higher serum IgA anti VCA and serum virus load compared to NPC Group 1 patients (P>0.05, Fig. 3A and 3B). Taken together, these findings suggest that the patients in NPC Group 2 were dysfunction in EBV specific immunity and more difficult to control the EBV infection.
EBV VCA and EA antibody titers and EBV DNA load in the serum from NPC Group 1 and NPC Group 2 patients. Antibody titers (A) to EBV VCA and EA IgA; EBV DNA load (B) in NPC Group 1 and NPC Group 2 patients.
The difference in activation of EBV-specific CTLs in vitro was identified in two NPC Groups
To further investigate the status of EBV specific immune responses the two groups of patients were compared for their capacity to respond to stimulation with autologous EBV immortalized LCL according to previously established PBMCs restimulation protocols [26]. The procedure was successful in 10 out 12 patients in NPC Group 1, while only 6 out of 12 patients in NPC Group 2 yielded sufficient numbers of cells for phenotypic and functional analysis. For phenotype analyses the EBV-specific CTLs set up from NPC Group 1 patients showed a higher percentage of CD3+CD8+ T cells (23.6-77.4%) compared to NPC Group 2 patients (26.7-75.8%), while there are more percentage of CD3-CD16+ NK cells in EBV-specific CTLs set up from NPC Group 2 patients (8.4-60.6%) compared to NPC Group 1 patients (0.6-40.3%) as shown in Table 3. In addition, we also examined the frequency of LMP1 and LMP2 HLA-A2 binding epitopic antigen specific CTLs in auto-LCL stimulated EBV-specific CTLs from two NPC group patients. The frequency of LMP1 and LMP2 epitopic antigen-specific T cells is usually higher in NPC Group 1 EBV-CTL cultures than in NPC Group 2 EBV-CTL cultures similar as that of in PBMCs, furthermore the frequency of FLY, GLG and CLG (LMP2) epitopic antigen-specific CTLs in EBV-CTL cultures was significantly higher in NPC Group 1 compared with NPC Group 2 (P <0.05, Fig. 2B).
Phenotype and cytotoxic activity of auto-LCL stimulated CTL cultures from PBMC of NPC Group 1 and NPC Group 2 patients.
| Group | Sample | CD8+CD3+/ CD3-CD16+ in PBMCs (%) | CD8+CD3+/CD3-CD16+ in CTLs (%) | Cytotoxic lysis Patterna |
|---|---|---|---|---|
| NPC Group 1 | P13 | 29.3/18.8 | 84.3/4.2 | I |
| P19 | 18.5/-b | 57.6/10.1 | I | |
| P32 | 17.4/30.7 | 51.8/22.3 | I | |
| P34 | 26.7/21.6 | 61.8/14.6 | I | |
| P35 | 21.2/34.7 | 58.3/6.7 | I | |
| P47 | 17.3/25 | 63.1/14.3 | I | |
| P50 | 22.8/21.4 | 88/5.1 | I | |
| P51 | 28/22.9 | 49.5/48.3 | II | |
| P52 | 33.5/36.8 | 58.4/10.1 | II | |
| P54 | 17.6/18 | 55.1/1.6 | I | |
| NPC Group 2 | P28 | 10.2/43.5 | 54.7/22.5 | II |
| P49 | 18.9/36.6 | 30.2/60.6 | III | |
| P56 | 16.8/29.7 | 26.7/29.7 | II | |
| P57 | 15.5/13.2 | 66/5.6 | I |
a. Score system: Pattern I=Specific lysis; Pattern II=non-specific lysis; Pattern III= no lysis. b. not done
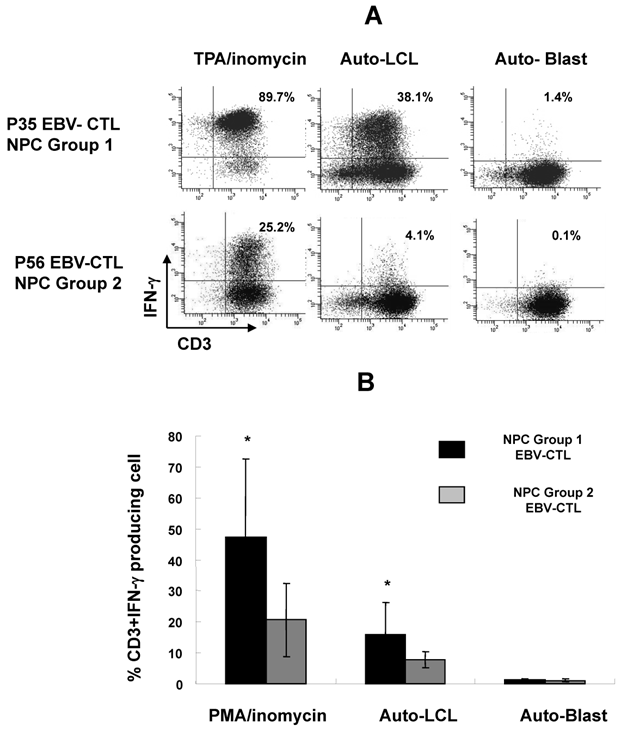
Three patterns of cytotoxic responses could be discerned in the polyclonal EBV-specific CTL cultures. The majority of auto-LCL stimulated cultures from NPC Group 1 patients, 8 out of 10, showed a Pattern I corresponding to EBV-specific MHC class I restricted cytotoxicity and 2 patients showed a Pattern II lysis corresponding to a mixture of EBV-specific and non-specific, NK-like cytotoxicity (Table 3). In contrast, only 1 of 4 patients in NPC Group 2 showed at Pattern I response, 2 showed Pattern II and in 1 case of NPC Group 2 the proliferating cells were not cytotoxic (Pattern III). This failure to reactivate strong EBV specific effectors was confirmed when the response was evaluated by the capacity to release IFNγ following stimulation with PMA/inomycin or autologous LCLs, the percentage of CD3+ IFNγ-producing cells was significantly higher in EBV-CTL cultures from NPC Group 1 compared to NPC Group 2 after stimulation by PMA/inomycin or autologous LCL (P<0.05, Fig. 4A and B).
Intracellular staining for INF-γ releasing of EBV-CTL lines from NPC Group 1 and NPC Group 2 after stimulated with Phorbol ester (PMA)/Inomycin, auto-LCL and auto-PHA blast. P35 and P56 CTL lines were the representative of the patients from NPC Group 1 and NPC Group 2 (A); compared the percentage of IFN-γ positive cells of EBV-CTL lines from NPC Group 1 (n=8) and NPC Group 2 patients (n=5) with or without stimulation. (B) * means P<0.05
Phenotypic characterization of tumor biopsies in two NPC groups
We finally asked whether the different immunophenotype detected in the peripheral blood of the patients of two NPC groups might correlate with the characteristics of the tumors. To this end the expression of HLA class I and class II, CD54, chemokines and chemokine receptors including IP-10, SDF-1 and CXCR-4, and the EBV LMP1 antigen were investigated by immunohistochemical staining in tumor specimen derived from two groups of patients (Table 4). Nineteen of the 36 NPC specimen included in this study (52.7%) were LMP1 positive. Interestingly, 15 out of 19 (78.9%) were derived from NPC Group 1 patients, while only 4 of 19 (21.1%) were from NPC Group 2 patients (P<0.05). Biopsies from NPC Group 2 patients also showed a significantly decreased expression of HLA-DR protein (3/14, 22% compared to 15/22, 68%, P<0.05) while there was no statistical difference in the expression of HLA class I (β2-microglobulin), CD54, IP-10, SDF-1 and CXCR4 on tumor cells between two NPC groups samples.
The characteristics of NPC tumor tissues in NPC Group 1 and NPC Group 2 patients
| Tumor Marker | NPC Group 1 (%) | NPC Group 2 (%) | P valueb | ||
|---|---|---|---|---|---|
| Low | High | Low | High | ||
| HLA-antigensa | |||||
| β2-Microglobulin | 11 (50) | 11 (50) | 10 (72) | 4 (28) | 0.2 |
| HLA-DR | 7 (32) | 15(68) | 11 (78) | 3 (22) | 0.0062* |
| CD54 | 7 (32) | 15 (68) | 4 (28) | 10 (72) | 0.83 |
| Chemokines and receptors | |||||
| IP-10 | 7 (32) | 15 (68) | 2(14) | 12(86) | 0.23 |
| SDF-1 | 14 (63) | 8 (37) | 7 (50) | 7 (50) | 0.41 |
| CXCR4 | 15 (68) | 7 (32) | 10 (72) | 4 (28) | 0.83 |
| EBV antigensc | |||||
| LMP1 | 7(31) | 15(69) | 10(75) | 4(25) | 0.02* |
a. Low= - to +; high= ++ to +++
b. * means significant difference
c. LMP1 Low= -; high= +
DISCUSSION
Most non-keratinizing NPC and undifferentiated NPC are associated with EBV infection and several EBV latent type II antigens, such as EBNA1, LMP1 (40-60%) and LMP2 are expressed on the tumor cells [11, 27]. Therefore, NPC is a good candidate for immunotherapy based on adoptive transfer of EBV specific CTLs [28]. However, the clinical application of this therapeutic strategy in NPC still need to improve therapy efficacy [16, 17, 29]. Since the long term results of this type of therapeutic intervention may be critically influenced by the immune status of the patients, we sought to identify immune parameters that could allow the stratification of NPC patients into subgroups with different competence to mount efficient EBV-specific responses. Using as distinguishing parameter the presence of significantly reduces circulating CD3+ T-lymphocytes at the time of diagnosis we could identify two subgroups of NPC patients. Two-third of the patients, belonging to NPC Group 1, have normal levels of CD3+ T cells (>52.6%), and show a decrease of both CD3+CD45RA+ and CD4+CD25- naïve T cells population and increase of CD4+CD25+ Treg cells population. The remaining one third of the patients, belonging to NPC Group 2, exhibited a phenotype of more severe immune suppression, as the percentage of CD3+CD45RO+ memory cells and CD3+ T-cells including CD3+CD8+ T-cells and CD3+CD4+ T cells were significantly decreased. In addition, the NPC Group 2 also showed a decrease of naïve T cells and increase of Treg cells, and the lower frequency of LMP1 and LMP2 epitopic antigen-specific T cells in PBMCs. Furthermore the serum level of IFNγ is lower in NPC Group 2 patients compared to NPC Group 1 patients. This correlated with a stronger imbalance in the control of EBV infection since the patients falling in this group had also higher virus load in the blood and higher serum titers of antibodies specific for viral antigens expressed during the productive virus cycle [Fig 3]. In accordance, a significantly higher proportion of these patients failed to mount efficient EBV-specific T cell responses upon stimulation of PBMC with autologous EBV transformed LCLs. The phenotype of EBV-CTL cultures set up from NPC Group 2 showed a higher percentage of CD3-CD16+ NK cells and less percentage of CD3+CD8+ T cells, and a less frequency of LMP1 and LMP2 epitopic antigen-specific CTLs (Table 3 and Fig. 2B), besides that this conclusion is also supported by the capacity of CTL cultures reactivated in vitro to kill autologous virus infected cells in 51Cr release assays and also by the production of TH1 cytokines such as IFN-γ [Table 3 and Fig 4].
We did not observe any consistent correlation between the immune status revealed by the phenotype of circulating lymphocytes and the age and sex distribution or clinical parameters of the patients. However, it has been reported that the expression of neo-antigens, the antigen transferred proteins including HLA-class I and class II proteins or the chemokines and chemokine receptors on tumor cells would affect the immune response of tumor microenvironment and peripheral immune system of host [30-34]. To illustrate the correlation of tumor markers and immunophenotype of NPC patients, here we investigated the expression of EBV LMP1 antigen and immune related proteins including HLA class I protein β2-Microglobulin, HLA-DR, CD54, IP-10, SDF-1 and CXCR4 in NPC tumor tissues by immunohisochemical staining. Our results suggested that the majority of the patients in NPC Group 1 carried LMP1 positive tumors (69%) while only 25% of patients in NPC Group 2 carried LMP1 positive tumors (P<0.05). In accordance with their LMP1 expression on the tumor cells, the NPC Group 1 patients also expressed higher levels of HLA-DR protein on tumor cells compared with NPC Group 2 patients (68% versus 22%, P<0.01) (Table 4). Interestingly, we thought that the lower LMP1 and HLA-DR expression level on tumor cells should be associated with immune dysfunction in NPC Group 2 patients including the decrease of CD3+, CD3+CD8+ and CD3+CD4+ subsets and the decrease of the frequency of LMP1 epitopic antigen-specific T cells, and the weak capacity to set up EBV-CTL cultures and EBV-specific immune response in vitro. It has been identified that generation the EBV-antigen specific CTLs such as LMP2 which expressed on NPC tumor cells, or producing a selectively lymphodepletion for patients by using CD45mAb before EBV-CTL infusion could improve the clinical benefit of T cell immunotherapy for NPC [15, 35], so that the antigens presented on tumor cells and the immune status of patients maybe decide the response to EBV-CTL immunotherapy.
In this study, most patients (58/67) are in late disease stage (Stage III and IV) due to the difficult diagnosis for NPC at early stage. All these patients accepted the conventional therapy including radiotherapy and chemotherapy. Until the last follow-up time in the beginning of 2011, we could not observe any correlation between immunological difference and the clinic outcome in our groups' patients during 5 year follow-up; this might be due to the limitation of the patient number. However, in our recently research we found that the density of some tumor infiltrating lymphocyte subsets such as Foxp3+ TILs, CD8+ TILs and CD8+GrB+ TILs were correlated with the clinicopathology or prognosis of NPC patients [36]. These findings maybe demonstrate that tumor immune microenvironment more directly contribute to the progress and prognosis of cancer than the peripheral immune system.
In summary, we showed for the first time that NPC patients can be stratified in two subgroups based on the immunophenotype of their PBMCs at the time of diagnosis. Poor immunophenotypic NPC group shows a significant correlation with a diminished capacity to control EBV infection and with the carriage of LMP1 negative tumors and decrease of HLA-DR antigen expression on tumor cells. These findings maybe provide some information in guiding the choice of patients that may benefit from immunotherapy based on adoptive transfer of EBV-CTL.
SUPPLEMENTARY MATERIAL
Table S1. The number and phenotype of PBMCs from the patients of NPC Group 1 and Group 2. Figure S1. Representative dot plots for CD8 and tetramer staining in PBMCs (A) and EBV-CTL cultures (B) from one NPC patient of NPC Group 1.
Acknowledgements
All authors thank Professor Maria Masucci (Karolinska Institutet, Sweden) for discussing and modifying this manuscript.
Funding
This work was supported by grants from the National Natural Science Foundation of China (Grant No. 224 (30872981), author Jiang Li).
CONFLICT OF INTERESTS
No potential conflicts of interest were disclosed. The funders had no role in study design, data collection and analysis, decision to publish, or preparation of the manuscript.
References
1. Pattle SB, Farrell PJ. The role of Epstein-Barr virus in cancer. Expert Opin Biol Ther. 2006;6:1193-1205
2. Kanegane H, Nomura K, Miyawaki T, Tosato G. Biological aspects of Epstein-Barr virus (EBV)-infected lymphocytes in chronic active EBV infection and associated malignancies. Crit Rev Oncol Hematol. 2002;44:239-249
3. Knecht H, Berger C, Rothenberger S. et al. The role of Epstein-Barr virus in neoplastic transformation. Oncology. 2001;60:289-302
4. Kelleher CA, Dreyfus DH, Jones JF, Gelfand EW. EBV infection of T cells: potential role in malignant transformation. Semin Cancer Biol. 1996;7:197-207
5. Fuse S, Molloy MJ, Usherwood EJ. Immune responses against persistent viral infections: possible avenues for immunotherapeutic interventions. Crit Rev Immunol. 2008;28:159-183
6. Halwani R, Doroudchi M, Yassine-Diab B. et al. Generation and maintenance of human memory cells during viral infection. Springer Semin Immunopathol. 2006;28:197-208
7. Williams H, McAulay K, Macsween KF. et al. The immune response to primary EBV infection: a role for natural killer cells. Br J Haematol. 2005;129:266-274
8. Khanna R, Burrows SR. Role of cytotoxic T lymphocytes in Epstein-Barr virus-associated diseases. Annu Rev Microbiol. 2000;54:19-48
9. Rooney CM, Heslop HE, Brenner MK. EBV specific CTL: a model for immune therapy. Vox Sang. 1998;74(Suppl 2):497-498
10. Moss DJ, Burrows SR, Khanna R. et al. Immune surveillance against Epstein-Barr virus. Semin Immunol. 1992;4:97-104
11. Comito MA, Sun Q, Lucas KG. Immunotherapy for Epstein-Barr virus-associated tumors. Leuk Lymphoma. 2004;45:1981-1987
12. Amrolia PJ, Muccioli-Casadei G, Yvon E. et al. Selective depletion of donor alloreactive T cells without loss of antiviral or antileukemic responses. Blood. 2003;102:2292-2299
13. Heslop HE, Slobod KS, Pule MA. et al. Long-term outcome of EBV-specific T-cell infusions to prevent or treat EBV-related lymphoproliferative disease in transplant recipients. Blood. 2010;115:925-935
14. Heslop HE. Biology and treatment of epstein-barr virus-associated non-hodgkin lymphomas. Hematology Am Soc Hematol Educ Program. 2005:260-266
15. Louis CU, Straathof K, Bollard CM. et al. Enhancing the in vivo expansion of adoptively transferred EBV-specific CTL with lymphodepleting CD45 monoclonal antibodies in NPC patients. Blood. 2009;113:2442-2450
16. Straathof KC, Bollard CM, Popat U. et al. Treatment of nasopharyngeal carcinoma with Epstein-Barr virus--specific T lymphocytes. Blood. 2005;105:1898-1904
17. Comoli P, Pedrazzoli P, Maccario R. et al. Cell therapy of stage IV nasopharyngeal carcinoma with autologous Epstein-Barr virus-targeted cytotoxic T lymphocytes. J Clin Oncol. 2005;23:8942-8949
18. Chapman AL, Rickinson AB, Thomas WA. et al. Epstein-Barr virus-specific cytotoxic T lymphocyte responses in the blood and tumor site of Hodgkin's disease patients: implications for a T-cell-based therapy. Cancer Res. 2001;61:6219-6226
19. Li J, Zeng XH, Mo HY. et al. Functional inactivation of EBV-specific T-lymphocytes in nasopharyngeal carcinoma: implications for tumor immunotherapy. PLoS ONE. 2007;2:e1122
20. Shao JY, Li YH, Gao HY. et al. Comparison of plasma Epstein-Barr virus (EBV) DNA levels and serum EBV immunoglobulin A/virus capsid antigen antibody titers in patients with nasopharyngeal carcinoma. Cancer. 2004;100:1162-1170
21. Jimenez R, Ramirez R, Carracedo J. et al. Cytometric bead array (CBA) for the measurement of cytokines in urine and plasma of patients undergoing renal rejection. Cytokine. 2005;32:45-50
22. Thorn RM, Palmer JC, Manson LA. A simplified 51Cr-release assay for killer cells. J Immunol Methods. 1974;4:301-315
23. Li J, Zhang XS, Xie D. et al. Expression of immune-related molecules in primary EBV positive Chinese nasopharyngeal carcinoma: associated with latent membrane protein 1 (LMP1) expression. Cancer Biol Ther. 2007;6:1997-2004
24. Remmele W, Schicketanz KH. Immunohistochemical determination of estrogen and progesterone receptor content in human breast cancer. Computer-assisted image analysis (QIC score) vs. subjective grading (IRS). Pathol Res Pract. 1993;189:862-866
25. Merlo A, Turrini R, Dolcetti R. et al. Adoptive cell therapy against EBV-related malignancies: a survey of clinical results. Expert Opin Biol Ther. 2008;8:1265-1294
26. Brander C, Suscovich T, Lee Y. et al. Impaired CTL recognition of cells latently infected with Kaposi's sarcoma-associated herpes virus. J Immunol. 2000;165:2077-2083
27. Raab-Traub N. Epstein-Barr virus in the pathogenesis of NPC. Semin Cancer Biol. 2002;12:431-441
28. Tao Q, Young LS, Woodman CB, Murray PG. Epstein-Barr virus (EBV) and its associated human cancers--genetics, epigenetics, pathobiology and novel therapeutics. Front Biosci. 2006;11:2672-2713
29. Lin CL, Lo WF, Lee TH. et al. Immunization with Epstein-Barr Virus (EBV) peptide-pulsed dendritic cells induces functional CD8+ T-cell immunity and may lead to tumor regression in patients with EBV-positive nasopharyngeal carcinoma. Cancer Res. 2002;62:6952-6958
30. Creighton CJ, Bromberg-White JL, Misek DE. et al. Analysis of tumor-host interactions by gene expression profiling of lung adenocarcinoma xenografts identifies genes involved in tumor formation. Mol Cancer Res. 2005;3:119-129
31. Khong HT, Wang QJ, Rosenberg SA. Identification of multiple antigens recognized by tumor-infiltrating lymphocytes from a single patient: tumor escape by antigen loss and loss of MHC expression. J Immunother. 2004;27:184-190
32. Klaamas K, Kurtenkov O, Rittenhouse-Olson K. et al. Expression of tumor-associated Thomsen-Friedenreich antigen (T Ag) in Helicobacter pylori and modulation of T Ag specific immune response in infected individuals. Immunol Invest. 2002;31:191-204
33. Michel S, Linnebacher M, Alcaniz J. et al. Lack of HLA class II antigen expression in microsatellite unstable colorectal carcinomas is caused by mutations in HLA class II regulatory genes. Int J Cancer. 2010;127:889-898
34. Poggi A, Zocchi MR. Mechanisms of tumor escape: role of tumor microenvironment in inducing apoptosis of cytolytic effector cells. Arch Immunol Ther Exp (Warsz). 2006;54:323-333
35. Bollard CM, Gottschalk S, Leen AM. et al. Complete responses of relapsed lymphoma following genetic modification of tumor-antigen presenting cells and T-lymphocyte transfer. Blood. 2007;110:2838-2845
36. Zhang YL, Li J, Mo HY. et al. Different subsets of tumor infiltrating lymphocytes correlate with NPC progression in different ways. Mol Cancer. 2010;9:4
Author contact
![]() Corresponding author: Yi-xin Zeng, Department of Experimental Research, Sun Yat-sen University, Cancer Center, Guangzhou 510060, China. E-mail: zengyixsysu.edu.cn Phone: + 86-20-8734-3333, Fax: + 86-20-8734-3295.
Corresponding author: Yi-xin Zeng, Department of Experimental Research, Sun Yat-sen University, Cancer Center, Guangzhou 510060, China. E-mail: zengyixsysu.edu.cn Phone: + 86-20-8734-3333, Fax: + 86-20-8734-3295.