Impact Factor ISSN: 1449-2288

 Global reach, higher impact
Int J Biol Sci 2012; 8(3):406-417. doi:10.7150/ijbs.4221 This issue Cite
Research Paper
Phenotypic Characterization of Osteoarthritic Osteocytes from the Sclerotic Zones: A Possible Pathological Role in Subchondral Bone Sclerosis
Anjali Jaiprakash1*, Indira Prasadam1*, Jian Q. Feng3, Ying Liu3, Ross Crawford1, 2, Yin Xiao1 ![]()
1. Institute of Health and Biomedical Innovation, Queensland University of Technology, Brisbane, Australia
2. Prince Charles Hospital, Brisbane, Queensland, Brisbane, Australia
3. Texas A&M Health Science Center, Baylor College of Dentistry, Texas, USA
*These authors contribute equally to the manuscript.
Received 2012-2-10; Accepted 2012-2-27; Published 2012-2-27
Abstract
Subchondral bone sclerosis is a well-recognised manifestation of osteoarthritis (OA). The osteocyte cell network is now considered to be central to the regulation of bone homeostasis; however, it is not known whether the integrity of the osteocyte cell network is altered in OA patients. The aim of this study was to investigate OA osteocyte phenotypic changes and its potential role in OA subchondral bone pathogenesis. The morphological and phenotypic changes of osteocytes in OA samples were investigated by micro-CT, SEM, histology, immunohistochemistry, TRAP staining, apoptosis assay and real-time PCR studies. We demonstrated that in OA subchondral bone, the osteocyte morphology was altered showing rough and rounded cell body with fewer and disorganized dendrites compared with the osteocytes in control samples. OA osteocyte also showed dysregulated expression of osteocyte markers, apoptosis, and degradative enzymes, indicating that the phenotypical changes in OA osteocytes were accompanied with OA subchondral bone remodelling (increased osteoblast and osteoclast activity) and increased bone volume with altered mineral content. Significant alteration of osteocytes identified in OA samples indicates a potential regulatory role of osteocytes in subchondral bone remodelling and mineral metabolism during OA pathogenesis.
Keywords: osteocyte, osteoarthritis, subchondral bone, sclerosis, DMP1 and SOST
INTRODUCTION
Osteoarthritis (OA) is the most common musculo-skeletal disorder, yet the aetiology is still unknown. Regardless of the aetiology the disease is progressive and is characterised by a series of predictable clinical and radiological changes. More than 30 years ago, Radin et al suggested that an increase in stiffness of subchondral bone, rendering it less capable of attenuating and distributing load throughout the joint, increased stress in the overlying articular cartilage, leading to the deterioration in OA (1, 2). One of the earliest changes seen radiographically, often before any joint space narrowing is observed, is subchondral bone sclerosis. This sclerosis is recognised as a radiographic sign of osteoarthritis but its significance has been little explored.
Subchondral bone is made up of a specialized connective tissue formed by a mineralized matrix containing specific type I collagen, proteoglycans, and several growth factors, as well as bone specific cell types: osteoblasts, osteocytes, and osteoclasts. It has been reported that OA subchondral bone shows dysregulated osteoblast (3) and osteoclast phenotype (4) however, it is currently not known whether osteocyte cells undergo phenotypic changes during OA progression.
Osteocytes are terminally differentiated osteoblasts residing within the mineralized bone matrix and make up more than 90-95% of all bone cells in the adult skeleton. The osteocyte-canalicular cell network is now considered to play a central and multi-functional role in regulating skeletal homeostasis (5). The most accepted theory for osteocytic function places these cells as transducers of mechanical strains that are translated into biochemical signals affecting the communication among osteocytes and between osteocytes and osteoblasts or osteoclasts (6). This cascade of events may ultimately regulate bone remodelling and mineral metabolism (7). Since mechanical knee misalignment and altered joint geometry were known causes of OA (8), it is likely that osteocytes might undergo enormous changes given that their function is to act as transducers of mechanical strains.
This study was designed to understand the pathophysiology of osteocyte network in OA patients by determining changes in osteocyte morphology, distribution, apoptosis, and evaluating the expression of osteocyte markers and matrix degradation enzymes. The phenotypic changes of osteocytes in OA patients were evident and these changes might be responsible for the active site-specific remodelling of subchondral bone, resulting in subchondral bone thickening and dysregulated mineral metabolism.
MATERIALS AND METHODS
Patients
OA patients undergoing total knee replacement were recruited for this study after informed consent was given. This study was approved by The Queensland University of Technology and Prince Charles Hospital ethics committees. Patient variables i.e., height, weight and age were recorded and preoperative radiographs of the knee, anteroposterially and laterally, were taken. The Subchondral bone was classified using scoring system set by The American College of Rheumatology (9). OA cartilage was classified according to the modified Mankin score (10). According to the previous studies (11), the patients were classified as OA (n=5) with a Mankin score greater than 5 and normal control (n=5) with a score less than 3.
Micro-CT
Morphological changes of subchondral bone in control vs. OA specimens were determined using Micro-CT. Tibial plate samples were scanned with micro CT (Scanco 40, Switzerland) with isotropic voxel size of 18 μm after tissues were fixed in 4% paraformaldehyde (PFA) in PBS as scanning medium. The x-ray tube voltage was 55 kV and the current was 145 μA, with a 0.5 mm aluminium filter. The exposure time was 1180 ms. The data set was segmented with an inbuilt software. In the medial and the lateral part of each tibia, a volume of interest (VOI) was selected with automatic contouring method. The circles were located in the middle of the load-bearing and non-load bearing sites of subchondral bone areas. Selected areas contained subchondral plate, but did not contain subchondral trabecular bone or growth-plate tissue. A total of 30 consecutive tomographic slices were analysed. The meaningful subchondral bone plate measurements such as bone volume (mg HA/ccm) and BV/TV (%) were analysed using inbuilt software. Subchondral bone thickness was measured quantitatively using Axio Vision software by converting number of pixels to micro meters.
Scanning electron microscopy (SEM) analysis for osteocytes
SEM and backscatter SEM was performed as described earlier (12). For resin-casted SEM, samples were dissected and fixed in 2.5% glutaraldehyde in 0.1 M sodium cacodylate buffer containing 0.05% tannic acid. The tissue specimens were dehydrated in ascending concentrations of ethanol (from 70% to 100%), embedded in methyl methacrylate, and then surface polished using 1 μm and 0.3 μm Alpha Micropolish Alumina II (Buehler) in a soft-cloth rotating wheel. The bone surface was acid etched with 37% phosphoric acid for 2-10 seconds, followed by 5% sodium hypochlorite for 5 min. The samples were then coated with gold and palladium as described previously (13) and examined using an FEI/Philips XL30 Field-Emission Environmental Scanning Electron Microscope.
For back-scattered SEM (BSEM), the samples were fixed overnight in 2% paraformaldehyde and 2% glutaraldehyde buffered at pH 7.4 with 0.1 M sodium cacodylate. Samples were then rinsed three times (20 min each time) in 0.1 M cacodylate buffer solution followed by secondary fixation (1 h) in a solution of 1% osmium tetroxide in 0.1 M cacodylate buffer. The BSEM samples were then coated with carbon and examined using an FEI/ Philips XL30 Field-Emission Environmental Scanning Electron Microscope
Histology tissue preparation
All samples containing any overlying cartilage and subchondral bone were dissected to an approximate depth of 1cm. All of the samples for histology and immunohistochemical analysis were washed in saline and immediately fixed in 4 % paraformaldehyde for 24 hours. The samples were washed in phosphate buffer solution (PBS) for one hour and then placed in 10% ethylene diamine tetraacetic acid (EDTA) for decalcification. The EDTA solution (PH 7.0) was changed weekly for four weeks and decalcification was confirmed by radiographic analysis. Tissue specimens were embedded in paraffin wax once the decalcification was complete. Tissue slices of 5 µm thick were sectioned using microtome, placed on 3-aminopropyltriethoxy-silane coated glass slides, air-dried and stored at 4 0C prior to analysis. Each specimen was H&E stained to visualize the general morphology.
H&E staining
Tissue slices were dewaxed in xylene and rehydrated in descending concentrations of ethanol (100% to 70%), sections were then stained with Mayers's haemotoxylin for 1-2 minutes before washing with tap water for 5 minutes. The slides were dehydrated in ascending concentration of ethanol (70% to 100%) and stained with eosin for 15 seconds and cleared with xylene and mounted on DePeX mounting medium (BDH Laboratory Supplies, England).
Immunohistochemistry
Immunohistochemistry was carried out using an indirect immunoperoxidase method. Tissue slices were dewaxed in xylene and rehydrated. Endogenous peroxidases were blocked by incubation in 0.3% peroxide for 30 min followed by repeated washing in PBS. The sections were then incubated with proteinases K (DAKO Multilink, CA, USA) for 20 min for antigen retrival. Next, all sections were treated with 0.1% bovine serum albumin (BSA) with 10% swine serum in PBS. Sections were then incubated with optimal dilution of primary antibody overnight at 4 0C. Optimum concentration of antibodies was determined by using a series of dilutions. After 24 hours, sections were incubated with a biotinylated swine-anti-mouse, rabbit, goat antibody (DAKO Multilink, CA, USA) for 15 min, and then incubated with horseradish perioxidase-conjugated avidin-biotin complex for 15 min. Antibody complexes were visualized by the addition of a buffered diaminobenzidine (DAB) substrate for 3 min and the reaction was stopped by rinsing sections in PBS. Sections were counterstained with Mayer's haematoxylin for 10 sec each, and rinsed with running tap water. Following this, dehydrated with ascending concentrations of ethanol solutions, cleared with xylene and mounted with coverslip using DePeX mounting medium. Controls for the immunostaining procedures included conditions where the primary antibody and the secondary (anti-mouse IgG) antibodies were omitted. In addition, an irrelevant antibody (anti CD-15), which was not present in the test sections, was used as a control. A list of antibodies sources and dilutions used for this study are summarized in Table 1.
Details of antibodies and the working dilutions used in this study.
| Protein | Dilution | Source |
|---|---|---|
| SOST | 1:100 | R & D systems |
| DMP-1 | 1:1000 | Gift from Prof Jian Feng |
| MMP-9 | 1:150 | Labvison, Fremont, CA |
| ADAMTS4 | 1:100 | Labvison, Fremont, CA |
| MMP1 | 1:200 | Labvison, Fremont, CA |
Resin embedding
Undecalcified tissue samples were embedded in Poly-Methyl methacrylate (PMMA). Samples were dehydrated through a graded ethanol series and processed through three changes of xylene then infiltrated with Methyl methacrylate (MMA) and subsequently incubated with a mixture of MMA and polyethylene glycol. To initiate the polymerisation process, the catalyst Perkadox (0.3%) was added to MMA/PEG (3%) solution. Samples were fully covered with the MMA/PEG/Perkadox solution and incubated at 50ºC for 10 min. Specimens were put to rest until fully polymerised. Embedded samples were cut into 5 μm sections using an automated sledge microtome (Reichert-Jung, Polycut S), stretched with 70% ethanol and collected onto gelatine coated microscope slides. Sections were overlaid with a plastic film and slides were clamped together prior to drying for 12 h at 60ºC. Sections were deplastified in xylene, rehydrated and stained using von Kossa staining procedures and Goldner staining using standard protocols.
Distribution of osteocyte cell number and lacunae
Subchondral bone plate was defined as starting from the calcified cartilage (CC) bone junction and ending at the marrow space. Meaningful parameters to describe our area of interest were determined by measuring the thickness of the subchondral plate in all samples under 10 x magnification and calculating the average length (0.98mm) and calculating the average area (mm2). Average osteocyte nucleus (Avg OS.N) and average osteocyte empty lacunae (Avg OS.L) were counted per unit area, within the defined area of interest using AxioVision Rel 4.8 Software. The Avg OS.N and Avg OS. Lac between control and OA are represented in a bar graph.
In situ cell death detection (apoptosis) using TUNEL
Osteocyte apoptosis was assessed principally at single cell level, based on labelling of DNA strand breaks (Terminal deoxynucleotidyl transferase dUTP nick end labelling or TUNEL technology) using In Situ Cell Death Detection Kit, Fluorescein (Roche, Germany) according to manufacturer's protocol. Tissue sections were permeabilised for 30min at 370C with Proteinase K solution (Roche, Germany). As a positive control, sections were treated with DNase1 for 10 min at room temperature prior to labelling procedure was used to induce DNA strand breaks. The tunel reaction mixture / terminal transferace was omitted for the negative control. Subchondral bone plate was defined as starting from the calcified cartilage (CC) bone junction and ending at the marrow space. Meaningful parameters to describe our area of interest were determined by measuring the thickness of the subchondral plate in all samples under 10 x magnifications and calculating the average length (0.98mm) and calculating the average area. TUNEL positive osteocyte was counted in 3 fields per section within the defined area of interest using AxioVision Rel 4.8 Software. The average TUNEL positive osteocyte between control and OA are represented in a bar graph.
Quantitative real time polymerase reaction (qPCR)
qPCR was performed to detect the gene expression differences in control and OA bone lysates. Briefly, for total RNA extraction, the fresh bone tissues were obtained from OA patients (collected in RNAse later solution) and graded according to the disease severity. Small fragments of bone pieces were cut by using bone cutter and tissues were homogenised using the bead beater for one minute. Total RNA was extracted using Trizol method and qPCR was performed as described previously (14, 15). The quality and integrity of the RNA extracted were confirmed on 1% wt/vol ethidium bromide-stained agarose gels.
Western blot
Total tissue protein was harvested by lysing the subchondral bone in a lysis buffer containing 1 M Tris HCl (pH 8), 5 M NaCl, 20% Triton X-100, 0.5 M EDTA and a protease inhibitor cocktail (Roche, Dee Why, NSW, Australia). The cell lysate was clarified by centrifugation and the protein concentration determined by a bicinchoninic acid protein assay (Sigma-Aldrich). 10 μg of protein was separated by sodium dodecyl sulfate-polyacrylamide gel electrophoresis on a 12% gel. The protein was transferred to a nitrocellulose membrane, and blocked in a Tris-Tween buffer containing 5% non-fat milk. The membranes were incubated with primary antibodies against ALP (1:1,000) and OCN (1:2,000) overnight at 4ºC. The membranes were washed three times in TBS-Tween buffer, and then incubated with an anti-rabbit secondary antibody at 1:2,000 dilutions for 1 hr. The protein bands were visualized using the ECL Plus™ Western Blotting Detection Reagents (GE Healthcare, Rydalmere, NSW, and Australia) and exposed on X-ray film (Fujifilm, Stafford, QLD, Australia). Immunoblot negatives were analyzed by densitometry using Image J software.
Tartrate resistant acid phosphatase (TRAP) staining of paraffin embedded samples
To detect osteoclast activity, TRAP staining was performed as described previously by Erlebacher et al (16). Paraffin sections of 5 μm thickness were deparaffinised in two changes of xylene (8 min each) and rehydrated (2 changes 95% ethanol, 2 min each; 1 change 70% and 50% ethanol each 5 min, deionised water 5 min). After rehydration, samples were placed in 0.2 M Acetate Buffer (0.2 M sodium acetate and 50 mM L(+) tartaric acid in ddH2O, pH 5.0) for 20 min at room temperature. Subsequently sections were incubated with 0.5 mg/ml naphtol AS-MX phosphate (Sigma) and 1.1 mg/ml fast red TR salt (Sigma) in 0.2 M acetate buffer for 1-4 h at 37ºC until osteoclasts appeared bright red. Samples were counterstained with Haematoxylin, air dried and mounted with ProLong® Gold (Invitrogen) mounting solution.
Statistical analysis
Paired Student's t-test was used to determine any significance between control vs. OA subchondral bone, by counting the % positive staining cells in the field of view for immunohistochemistry, by counting the Avg OS.N and Avg OS.L (per unit area), and for distribution studies. P≤0.05 was considered significant.
RESULTS
Patient demographics and specimen characterization
The mean age of all patients was 72 years (range 63 - 79), mean weight was 93.4 kg (range 64-105) and mean height was 173 cm (range 162-185). H&E staining was performed to confirm the site specific changes in the samples. All control specimens showed normal appearing articular cartilage with underlying subchondral bone. The outer (radial) layer of noncalcified cartilage (NC) was separated from the underlying calcified cartilage (CC) layer by the tidemark (TM). Immediately adjacent to the CC was the subchondral bone plate (SB). In contrast, OA specimens showed cartilage loss with a small region on the edge of the slide where there was some preservation of the deep and middle zone cartilage layers. The NC was much thinner and the CC was relatively thicker in OA samples when compared to the control specimens. Therefore, the distance between the TM and the SB was thicker than in the normal specimens. SB advancement in the OA specimens was seen in all the patients indicating extensive bone remodeling. Collectively, these results show significant site-specific changes in OA patients.
Altered gene expression, micro-architectural and mineral properties in OA subchondral bone
A representative of the 3-D reconstruction of subchondral bone from micro-CT images (fig 1a, i-ii) showed significant changes in the microstructure of subchondral bone in OA patients. Compared with control, OA subchondral bone was significantly thicker and denser with a plate like structure. Quantitative micro-CT data revealed that OA specimens had a 20% increase in bone volume fraction compared to the control group (p = 0.049) (fig 1a, iii). Similarly, an increase in the subchondral bone thickness and mean density was observed in OA patients (fig 1a, iv-v). To further investigate these at the molecular level, it was noted that the mRNA (fig 1b, i-iii) and protein (fig 1b, iv) synthesis of alkaline phosphotase (ALP), osteopontin (OPN) and osteocalcin (OCN) were significantly higher in OA samples compared to patient matched controls. These results indicate abnormal site-specific OA bone phenotypic properties.
Micro-architectural and mineral properties in OA subchondral bone: A representative 3-D reconstructions of tibial bone specimens of control and OA from micro-CT scans (a, i-ii) and quantitative results show OA subchondral bone plate has a higher bone volume fraction, mineral content and thickness compared to control specimens (a, iii-v) . Molecular marker changes: qRT-PCR was used to measure the gene expression levels of ALP, OPN and OCN. ALP and OPN showed a significant increase in OA bone (b,i-iii). At the protein level, a similar trend was observed using western bolt (b,iv). Tubulin was used as an internal loading control. Bars equals mean±SD, n=5, *p≤0.05. Goldner staining of control and OA samples (c, i-ii). Von kossa stained sections (c,iii-iv). Back scatter SEM (BS-SEM) images (c, v-vi).
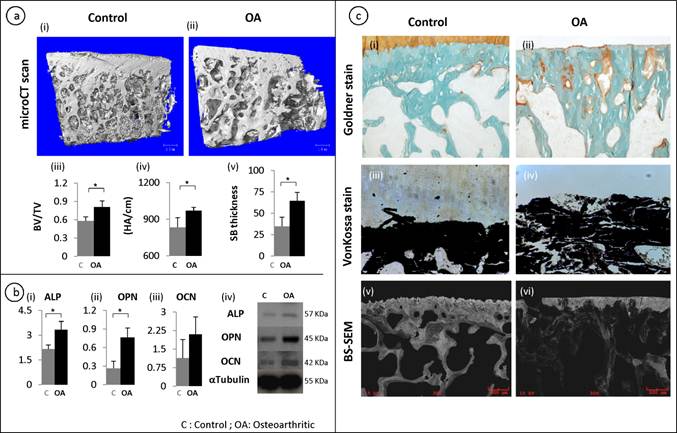
Goldner staining showed that there were significantly increased un-mineralized areas (stained orange) in OA subchondral bone compared with controls (fig 1c, i-ii). This was further confirmed by Von kossa staining on the un-decalcified tissue samples, which showed that the mineral content distribution was significantly altered in OA subchondral bone, showing increased less mineralized areas compared with controls (Black staining shows the distribution of mineral content and white shows the distribution of un-mineralized areas) (fig 1c, iii-iv). Similarly, backscatter SEM images showed significantly disorganized mineral distribution compared with the controls where the white/grey areas show the distribution of mineral content and the black areas show the lack of mineral content (fig 1c, v-vi).
Distorted osteocyte distribution and morphology in OA samples
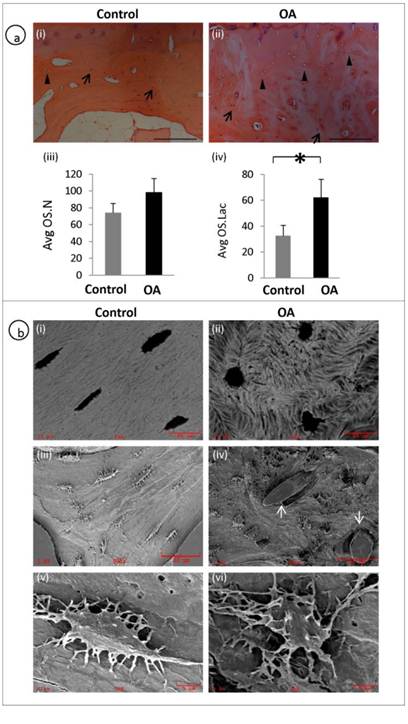
A representative H&E staining of the subchondral bone of OA and patient matched control shows the histological appearance of osteocyte morphology, number and distribution. Arrows represent osteocyte nucleus and arrow heads represent empty osteocyte lacunae (fig 2a, i-ii). Average osteocyte lacunae (Avg.OS.Lac) density was significantly increased in the OA patients compared to controls (P = 0.0041). However, no significant differences were observed with respect to Average osteocyte nucleus (Avg.OS.N) (P=0.0691) or viable osteocyte count (fig 2a, iii-iv). We examined the morphology of OA osteocytes using back scatter SEM (fig 2b, i-ii) and SEM (fig 2b, iii-vi) and it revealed that the osteocytes in OA samples were markedly deformed with a rough, lysed (fig 2b iv&vi) and rounded appearance (Fig 2b, ii) with very few dendrites compared to spindle shaped (fig 2b, i), well organised and well connected osteocytes (fig 2b, iii&v) in the control specimens. Furthermore, mineral distribution was disorganised, showing woven appearance in OA (fig 2b, ii) compared with well organised and consistent mineral distribution in normal samples (fig 2b, i). It was also noticed blood vessel invasion in OA subchondral bone (fig 2b, iv).
Disrupted osteocyte morphology and distribution in OA patients: H&E staining of the subchondral bone of OA and patient matched control showing the histological appearance of osteocyte morphology, number and distribution. Arrows represent osteocyte nucleus and arrow heads represent osteocyte lacunae (a, i-ii). OA subchondral plate showed no significant increase in the Avg OS.N (P= 0.0691) compared to control (a, iii). OA subchondral plate showed a significant increase in the Avg OS.Lac (P= 0.0041) compared to control (a, iv). Bars equal mean±SD, n=5, *p≤0.05.(b, i-ii) Back scatter image and (b, iii-vi) SEM images show clear morphological differences which include rough lysed and rounded appearance with fewer dendrites in OA osteocytes and blood vessel (arrows) invasion in OA samples (b, iv).
Dysregulated osteocyte markers in OA osteocytes
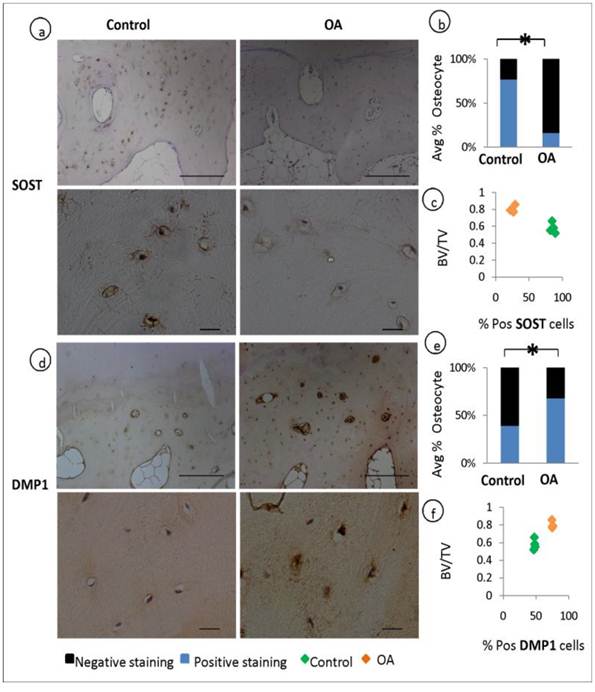
Osteocytes selectively express sclerostin (SOST), which is well characterised as negative regulator of bone formation. We performed a comparative immunohistochemical analysis of SOST expression in OA and patient matched control samples. When quantified by assessing the percentage fraction of SOST-positive osteocytes among total osteocytes, major differences became evident. SOST expression was observed in more than half of the osteocytes in the control specimens but was significantly reduced in OA samples (P=0.001), indicating a suppressed expression of this bone regulatory protein in OA (fig 3, a-b). In contrast to these findings the expression of Dentin Matrix Protein 1 (DMP1, regulator of bone mineralisation) staining was stronger in OA osteocytes and the percentage of DMP1 positive osteocytes were higher in OA compared to control specimens (P=0.0002) (fig 3, d-e). The expression of DMP1 and SOST has been correlated to the ratio of bone volume to total volume (BV/TV) showing that increase in bone volume was correlated with the expression of increased DMP1 and decreased SOST (fig 3, c&f).
Expression of osteocyte markers and the correlation to BV/TV: Immunohistochemical analysis shows a decrease in the average % positive stained osteocytes for SOST in OA patients compared to controls (P=0.001) (a-b). and an increase in the average % positive stained osteocytes for DMP1 in OA patients compared to controls (P=0.003) (d-e) Correlation studies reveals that the expression of SOST decreases with the increase in bone volume to total volume (BV/TV) (c) and the expression of DMP1 increases with increase in BV/TV f).
Increased apoptosis and TRAP positive staining in OA osteocyte
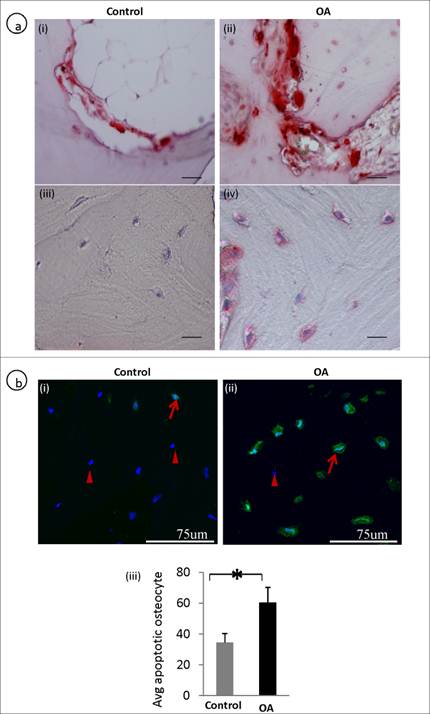
The number of average TUNEL and TRAP positive osteocytes was significantly higher in OA osteocytes compared to controls. In OA subchondral bone there were increased osteoclast activity showing TRAP positive (fig 4a, ii) compared to the control (fig 4a, i). Interestingly, osteocytes in OA samples also showed positive staining of TRAP (fig 4a, iv) compared with the controls (fig 4a, iii) , where osteocytes showed negative TRAP staining. A representative TUNEL stained section showed more number of osteocytes undergoing apoptosis in OA samples (fig 4b, ii)compared to controls (fig 4b, i). The average TUNEL positive osteocyte between control and OA are represented in a bar graph (fig 4b, iii).
Defective osteoclast / osteocyte TRAP expression and increased apoptosis (TUNEL positive) in OA osteocytes: A representative TRAP stained section shows an increased in the number of osteoclasts (a, i-ii). Increased TRAP positive osteocytes were observed in OA subchondral bone (a, iii-iv). A representative TUNEL stained section shows that more number of OA osteocytes are undergoing apoptosis compared to controls. Arrows represent TUNEL positive osteocytes and arrow heads represents live/nuclear stain (b, i-ii). b, iii is the bar graph showing increased TUNEL positive OA osteocytes. Bars equal mean±SD, n=5, *p≤0.05.
Dysregulated expression of degradative enzyme expression in OA osteocytes
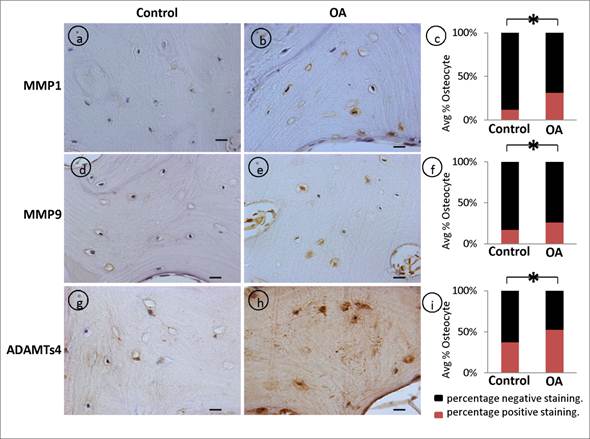
Matrix metalloproteinases (MMPs) are well recognized as mediators of matrix degradation, and their activity by virtue of the cleavage of matrix substrates are well known. We showed that the intensity of MMP-1. (fig 5, a-c), MMP-9 (fig 5, d-f), and ADAMTS4 (fig 5, g-i) signals were stronger and the percentage of positive osteocytes were significantly higher in OA samples compared to control patient specimens.
Dysregulated expression of degradative enzymes: Significant increase in the average percentage positive stained osteocytes in OA samples was observed with (a-c) MMP1 (p=0.001), (d-f) MMP9 (p=0.0026), (g-i) ADAMTs4 (p=0.0042) compared controls. Bars equal mean±SD, (n=5), *p≤0.05.
DISCUSSION
Subchondral bone sclerosis is a major patho-physiological manifestation of OA, and it is still unknown if it precedes cartilage breakdown in this disease. Regardless of whether bone sclerosis is the initiating event, it perturbs the overlying cartilage in OA patients; therefore, preventing subchondral bone sclerosis may contribute to improving the comfort and mobility of OA patients (17). It is now evident that subchondral bone cells such as osteoblasts and osteoclasts undergo significant changes in OA (18). However, recent studies emphasise the importance of osteocyte in maintaining the bone homeostasis. Studies have demonstrated that osteocytes regulate the behaviour of osteoblasts and osteoclasts by communicating through gap junctions (19). With this evidence, we hypothesised that osteocyte function may be hampered in OA leading to OA osteocyte phenotype and this could play an important pathological role in subchondral bone sclerosis. Our findings suggest that the various functional properties of osteocytes appear to be changed in patients with OA.
In OA, the increase in bone volume, density, and stiffening of subchondral bone has been reported and the possible reason for this change might be due to bone remodelling in response to repetitive micro-damage/fracture as a result of an imbalance in mechanical loading of the joint (20). In this study we identified that OA subchondral bone showed an increased bone volume and the bone mineral content was significantly altered. We further demonstrated that these subchondral bone changes in OA were correlated with the expression of osteocyte markers, which showed decreased SOST and increased DMP1 expression in OA samples. Osteocyte expression of SOST is a delayed event and it is produced only by mature osteocytes after they become embedded in matrix that has been mineralized. From then on, mature osteocytes appear to express SOST whether they are located in osteons or bone. SOST knockout mice have a progressive high bone mass phenotype (21, 22). The precise physiological role of SOST in osteocytes is not yet fully understood, but numerous studies indicate that loss of SOST expression enhances osteogenesis (23). Currently, it is thought that SOST passes through the osteocytic canalicular network to the bone surface where it inhibits osteoblastic canonical Wnt/beta-catenin signaling, which is implicated in bone mass regulation (24-26). Therefore, decreased SOST expression in OA osteocytes may be responsible for the increased bone volume in OA subchondral bone.
In contrast to the expression of SOST, increased expression of DMP1 can induce impairment in mineralization (27, 28) with poorly organized mineral and an apparent delay in the transition from osteoblasts to osteocytes. In this study it was found that OA subchondral bone showed significant dysregulation in mineral metabolism. This may be due to the increased expression of DMP1 in OA osteocytes. DMP-1 is a secretory protein and an osteocyte marker essential for normal postnatal chondrogenesis and subsequent osteogenesis (29). In vivo studies have shown that DMP1 actively participates in bone homeostasis and mineralization and mechanical loading stimulates DMP1 expression in osteocytes (30-32). It can be assumed that increased expression of DMP1 in OA osteocytes may disrupt the normal mineralization process in OA subchondral bone, resulting in increased osteoid volume and irregular mineralization of OA subchondral bone. The surprising finding of decreased SOST and increased DMP1 expression in OA osteocytes may be indicative of elevated bone turnover resulting in increased subchondral bone volume in OA samples - a characteristic feature of OA. Indeed, we demonstrated that bone turnover markers (ALP, OPN, OCN, MMPs, TRAP) were significantly upregulated in OA samples compared with controls, indicating an underlying potential mechanism leading to OA subchondral bone changes.
Osteocytes and their connections are highly dynamic, as observed by their constant contraction and expansion of osteocyte bodies within the lacunae and by the extension and retraction of dendrites thus adapting mechanical load (33). This may imply that the shape of osteocytes is determined by external loading and imbalanced mechanical stimulation can lead to morphological changes. Our SEM results showed that OA subchondral bone osteocytes (OA osteocyte phenotype) were more rounded, rough and were not aligned in any particular direction, however, the patient matched control samples showed spindle shaped and uniformly aligned osteocytes (Normal osteocyte phenotype). These results indicate that an irregular morphology of osteocytes increases OA predilection and this might alter the ability of bone to sense mechanical stimuli leading to significant changes in the structure and mineral density. It could be interpreted as a phenomenon where the signals passing through osteoblasts and osteoclasts could be hampered. Indeed, increased osteogenic activities (ALP, OPN and OCN expression) and increased osteoclastic activity (TRAP statining) were noted in OA subchondral bone.
An adequate number of osteocytes are essential to remove bone microdamage, and the osteocyte density correlates with the quality of bone (34). In this study we found that average osteocyte lacunae (Avg.OS.Lac) number was significantly higher in OA bone compared to normal's, however no significant differences were observed with respect to total number of osteocyte nucleus count. This could be explained by the increased osteocyte apoptosis, showing TUNEL positive osteocytes in OA samples.
Our results clearly showed the rough, lysed and rounded appearance of the lacunae and canaliculi of osteocytes in OA samples. To adapt to mechanical stimuli, osteocytes modulate their mechanical environment by regulating their attachment to the matrix (35). MMPs are well recognized as mediators of matrix degradation, and their activity by virtue of the cleavage of matrix substrates are well known. As expected, we found that MMP-1, MMP-9 and ADAMTS4 were all significantly increased in OA compared to control giving a possible indication to assume that the osteocyte morphology will corrode its coupling to the matrix by producing digestive enzymes such as MMPs. The function of osteocyte through death and the expression of MMPs in bone remodelling and joint disease has been emphasised by various independent researchers (36-38). Role of osteocytes in the regulation of bone resorption has been largely unknown. TRAP staining has been regarded as one of the reliable markers of osteoclasts. Few studies have shown the expression of TRAP in osteocytes close to the bone resorbing surface and its relation to MMPs (39-41). With this in view, TRAP positive and MMPs positive osteocytes may control the direction of osteoclastic resorption in OA subchondral bone. However, these results need further investigation to understand the cellular interactions between TRAP positive osteocytes and osteoclasts during bone resorption. Another limitation of the study is the relatively small sample size of human samples. Even though the osteocyte changes are obvious as evidenced in the five OA samples, validation studies with larger sample sizes need to be performed.
CONCLUSION
Our study provides evidence that OA osteocyte phenotype has distinctive changes both phenotypically and morphologically. We conclude that the OA osteocyte phonotypic changes participate in OA subchondral bone pathogenesis. These characteristic OA changes could be caused by the activation/deactivation of osteocyte signalling molecules in the OA microenvironment.
Acknowledgements
This study is supported by the Prince Charles Hospital Foundation (MS2010-02), NHMRC project fund (APP1032738), and the Australian Orthopaedics Association Research Foundation.
Conflict of Interests
The authors have declared that no conflict of interest exists.
References
1. Brandt KD, Radin EL, Dieppe PA, van de Putte L. Yet more evidence that osteoarthritis is not a cartilage disease. Ann Rheum Dis. 2006;65:1261-4
2. Radin EL, Rose RM. Role of subchondral bone in the initiation and progression of cartilage damage. Clin Orthop Relat Res. 1986;213:34-40
3. Sanchez C, Deberg MA, Bellahcene A, Castronovo V, Msika P, Delcour JP. et al. Phenotypic characterization of osteoblasts from the sclerotic zones of osteoarthritic subchondral bone. Arthritis Rheum. 2008;58:442-55
4. Logar DB, Komadina R, Prezelj J, Ostanek B, Trost Z, Marc J. Expression of bone resorption genes in osteoarthritis and in osteoporosis. J Bone Miner Metab. 2007;25:219-25
5. Bonewald LF. The amazing osteocyte. J Bone Miner Res. 2010;26:229-38
6. Stains JP, Civitelli R. Cell-to-cell interactions in bone. Biochem Biophys Res Commun. 2005;328:721-7
7. Jacobs CR, Temiyasathit S, Castillo AB. Osteocyte mechanobiology and pericellular mechanics. Annu Rev Biomed Eng. 2010;12:369-400
8. Herzog W, Clark A, Longino D. Joint mechanics in osteoarthritis. Novartis Found Symp. 2004;260:79-95
9. Altman R, Asch E, Bloch D, Bole G, Borenstein D, Brandt K. et al. Development of criteria for the classification and reporting of osteoarthritis. Classification of osteoarthritis of the knee. Diagnostic and Therapeutic Criteria Committee of the American Rheumatism Association. Arthritis Rheum. 1986;29:1039-49
10. Mankin HJ, Dorfman H, Lippiello L, Zarins A. Biochemical and metabolic abnormalities in articular cartilage from osteo-arthritic human hips. II. Correlation of morphology with biochemical and metabolic data. J Bone Joint Surg Am. 1971;53:523-37
11. Xu L, Peng H, Glasson S, Lee PL, Hu K, Ijiri K. et al. Increased expression of the collagen receptor discoidin domain receptor 2 in articular cartilage as a key event in the pathogenesis of osteoarthritis. Arthritis Rheum. 2007;56:2663-73
12. Lu Y, Xie Y, Zhang S, Dusevich V, Bonewald LF, Feng JQ. DMP1-targeted Cre expression in odontoblasts and osteocytes. J Dent Res. 2007;86:320-5
13. Bonewald LF, Johnson ML. Osteocytes, mechanosensing and Wnt signaling. Bone. 2008;42:606-15
14. Prasadam I, van Gennip S, Friis T, Shi W, Crawford R, Xiao Y. ERK-1/2 and p38 in the regulation of hypertrophic changes of normal articular cartilage chondrocytes induced by osteoarthritic subchondral osteoblasts. Arthritis Rheum. 2010;62:1349-60
15. Prasadam I, Friis T, Shi W, van Gennip S, Crawford R, Xiao Y. Osteoarthritic cartilage chondrocytes alter subchondral bone osteoblast differentiation via MAPK signalling pathway involving ERK1/2. Bone. 2010;46:226-35
16. Erlebacher A, Derynck R. Increased expression of TGF-beta 2 in osteoblasts results in an osteoporosis-like phenotype. J Cell Biol. 1996;132:195-210
17. Hilal G, Martel-Pelletier J, Pelletier JP, Ranger P, Lajeunesse D. Osteoblast-like cells from human subchondral osteoarthritic bone demonstrate an altered phenotype in vitro: possible role in subchondral bone sclerosis. Arthritis Rheum. 1998;41:891-9
18. Lories RJ, Luyten FP. The bone-cartilage unit in osteoarthritis. Nat Rev Rheumatol. 2011;7:43-49
19. Taylor AF, Saunders MM, Shingle DL, Cimbala JM, Zhou Z, Donahue HJ. Mechanically stimulated osteocytes regulate osteoblastic activity via gap junctions. Am J Physiol Cell Physiol. 2007;292:C545-52
20. Burr DB, Radin EL. Microfractures and microcracks in subchondral bone: are they relevant to osteoarthrosis? Rheum Dis Clin North Am. 2003;29:675-85
21. Brunkow ME, Gardner JC, Van Ness J, Paeper BW, Kovacevich BR, Proll S. et al. Bone dysplasia sclerosteosis results from loss of the SOST gene product, a novel cystine knot-containing protein. Am J Hum Genet. 2001;68:577-89
22. Li X, Ominsky MS, Niu QT, Sun N, Daugherty B, D'Agostin D. et al. Targeted deletion of the sclerostin gene in mice results in increased bone formation and bone strength. J Bone Miner Res. 2008;23:860-9
23. Poole KE, van Bezooijen RL, Loveridge N, Hamersma H, Papapoulos SE, Lowik CW. et al. Sclerostin is a delayed secreted product of osteocytes that inhibits bone formation. FASEB J. 2005;19:1842-4
24. Li X, Zhang Y, Kang H, Liu W, Liu P, Zhang J. et al. Sclerostin Binds to LRP5/6 and Antagonizes Canonical Wnt Signaling. J. Biol. Chem. 2005;280:19883-19887
25. van Bezooijen RL, Roelen BAJ, Visser A, van der Wee-Pals L, de Wilt E, Karperien M. et al. Sclerostin Is an Osteocyte-expressed Negative Regulator of Bone Formation, But Not a Classical BMP Antagonist. J. Exp. Med. 2004;199:805-814
26. Sutherland MK, Geoghegan JC, Yu C, Turcott E, Skonier JE, Winkler DG. et al. Sclerostin promotes the apoptosis of human osteoblastic cells: a novel regulation of bone formation. Bone. 2004;35:828-35
27. George A, Ramachandran A, Albazzaz M, Ravindran S. DMP1--a key regulator in mineralized matrix formation. J Musculoskelet Neuronal Interact. 2007;7:308
28. Turner CH. Dentin matrix protein 1 (DMP1). J Musculoskelet Neuronal Interact. 2007;7:306-7
29. Lu Y, Yuan B, Qin C, Cao Z, Xie Y, Dallas SL. et al. The biological function of DMP-1 in osteocyte maturation is mediated by its 57-kDa c-terminal fragment. J Bone Miner Res. 2011;26:331-40
30. Gluhak-Heinrich J, Ye L, Bonewald LF, Feng JQ, MacDougall M, Harris SE. et al. Mechanical loading stimulates dentin matrix protein 1 (DMP1) expression in osteocytes in vivo. J Bone Miner Res. 2003;18:807-817
31. Feng JQ, Ward LM, Liu S, Lu Y, Xie Y, Yuan B. et al. Loss of DMP1 causes rickets and osteomalacia and identifies a role for osteocytes in mineral metabolism. Nat Genet. 2006;38:1310-5
32. Feng JQ, Huang H, Lu Y, Ye L, Xie Y, Tsutsui TW. et al. The Dentin matrix protein 1 (Dmp1) is specifically expressed in mineralized, but not soft, tissues during development. J Dent Res. 2003;82:776-80
33. Burra S, Nicolella DP, Francis WL, Freitas CJ, Mueschke NJ, Poole K. et al. Dendritic processes of osteocytes are mechanotransducers that induce the opening of hemichannels. Proc Natl Acad Sci U S A. 2010;107:13648-53
34. Qiu S, Rao DS, Fyhrie DP, Palnitkar S, Parfitt AM. The morphological association between microcracks and osteocyte lacunae in human cortical bone. Bone. 2005;37:10-5
35. Rubin C, Judex S, Hadjiargyrou M. Skeletal adaptation to mechanical stimuli in the absence of formation or resorption of bone. J Musculoskelet Neuronal Interact. 2002;2:264-7
36. Karsdal MA, Andersen TA, Bonewald L, Christiansen C. Matrix metalloproteinases (MMPs) safeguard osteoblasts from apoptosis during transdifferentiation into osteocytes: MT1-MMP maintains osteocyte viability. DNA Cell Biol. 2004;23:155-65
37. Kogianni G, Noble BS. The biology of osteocytes. Curr Osteoporos Rep. 2007;5:81-6
38. Zhao W, Byrne MH, Wang Y, Krane SM. Osteocyte and osteoblast apoptosis and excessive bone deposition accompany failure of collagenase cleavage of collagen. J Clin Invest. 2000;106:941-9
39. Boabaid F, Cerri PS, Katchburian E. Apoptotic bone cells may be engulfed by osteoclasts during alveolar bone resorption in young rats. Tissue Cell. 2001;33:318-325
40. Bronckers ALJJ, Sasaguri K, Engelse MA. Transcription and immunolocalization of Runx2/Cbfa1/Pebp2αA in developing rodent and human craniofacial tissues: Further evidence suggesting osteoclasts phagocytose osteocytes. Microsc Res Tech. 2003;61:540-548
41. Zhao S, Zhang YK, Harris S, Ahuja SS, Bonewald LF. MLO-Y4 osteocyte-like cells support osteoclast formation and activation. J Bone Miner Res. 2002;17:2068-79
Author contact
![]() Corresponding author: Associate Professor Yin Xiao, Institute of Health and Biomedical Innovation, Queensland University of Technology, Kelvin Grove Campus, Brisbane, QLD - 4059 Australia. Tel: +61731386240; Fax: +61 7 31386030; Email: yin.xiaoedu.au
Corresponding author: Associate Professor Yin Xiao, Institute of Health and Biomedical Innovation, Queensland University of Technology, Kelvin Grove Campus, Brisbane, QLD - 4059 Australia. Tel: +61731386240; Fax: +61 7 31386030; Email: yin.xiaoedu.au