Impact Factor ISSN: 1449-2288
- Issue 12; 2026
- Issue 11; 2026
- Issue 10; 2026
- Issue 9; 2026
- Issue 8; 2026
- Volume 22; 2026
- Past Issues
- Advance Articles
- Editorial Board
- Cover Images
- Index & Coverage
- Cover Suggestion
- Special Issues
Introduction
Materials and methods
Results
Discussion
Supplementary Material
Acknowledgements
References

 Global reach, higher impact
Int J Biol Sci 2012; 8(6):802-810. doi:10.7150/ijbs.4438 This issue Cite
Research Paper
Structural Dynamics and Epigenetic Modifications of Hoxc Loci along the Anteroposterior Body Axis in Developing Mouse Embryos
Hyehyun Min*, Ji-Yeon Lee*, Myoung Hee Kim ![]()
Department of Anatomy, Embryology Laboratory, Brain Korea 21 project for Medical Science, Yonsei University College of Medicine, Seoul 120-752, Korea.
* These authors contributed equally to this work.
Received 2012-4-4; Accepted 2012-6-3; Published 2012-6-6
Abstract
Hox genes are organized as clusters and specify regional identity along the anteroposterior body axis by sequential expression at a specific time and region during embryogenesis. However, the precise mechanisms underlying the sequential spatio-temporal, collinear expression pattern of Hox genes are not fully understood. Since epigenetic modifications such as chromatin architecture and histone modifications have become crucial mechanisms for highly coordinated gene expressions, we examined such modifications. E14.5 mouse embryos were dissected into three parts along the anteroposterior axis: brain, trunk-anterior, and trunk-posterior. Then, structural changes and epigenetic modifications were analyzed along the Hoxc cluster using chromosome conformation capture and chromatin immunoprecipitation-PCR methods. Hox non-expressing brain tissues had more compact, heterochromatin-like structures together with the strong repressive mark H3K27me3 than trunk tissues. In the trunk, however, a more loose euchromatin-like topology with a reduced amount of H3K27me3 modifications were observed along the whole cluster, regardless of their potency in gene activation. The active mark H3K4me3 was rather closely associated with the collinear expression of Hoxc genes; at trunk-anterior tissues, only 3' anterior Hoxc genes were marked by H3K4me3 upon gene activation, whereas whole Hoxc genes were marked by H3K4me3 and showed expression in trunk-posterior tissues. Altogether, these results indicated that loosening of the chromatin architecture and removing H3K27me3 were not sufficient for, but rather the concomitant acquisition of H3K4me3 drove the collinear expression of Hoxc genes.
Keywords: anteroposterior body axis, chromatin architecture, histone modification, collinear expression, Hoxc cluster
Introduction
Hox genes encode a highly conserved family of homeodomain-containing transcription factors that play a pivotal role in specifying positional identity along the anteroposterior (AP) body axis during embryogenesis [1, 2]. In mammals, 39 Hox genes are organized in four clusters (HoxA, -B, -C, and -D) and are transcribed sequentially depending on their relative positions within the genomic clusters. Genes located more in the 3' region are expressed earlier and more anteriorly than those located more in the 5' region of the cluster. This collinear expression of the Hox gene is essential for providing correct positional identity to the developing embryo at the right time [3].
Epigenetic modifications in histones have been suggested in the mechanism underlying collinear Hox gene expression [4]. Since then, Polycomb-group (PcG) and Trithorax-group (TrxG) proteins, initially identified in Drosophila as epigenetic regulators of the homeotic genes, have also been revealed to control the collinear expression of Hox genes in mammals [5, 6]. PcG proteins are generally considered to maintain their target genes in a transcriptionally-inactive state by catalyzing histone H3K27 trimethylation (H3K27me3), while TrxG proteins antagonize the action of PcG proteins and activate target genes by inducing histone H3K4 trimethylation (H3K4me3). Several in vitro studies have shown such correlations between the histone modifications and transcriptional activities of target promoters in embryonic stem (ES) cells, as well as in other types of tissue culture cells [7-10]. In the case of Hox genes, sequential activation of Hoxd genes has been associated with the distribution of H3K4me3 and H3K27me3 histone marks in developing mouse tail buds, suggesting that successive Hox gene activation along the cluster was associated with the directional and progressive transition of histone modifications as well as that the clustered organization was necessary for the successive collinear expression of Hox genes [11].
Meanwhile, spatial chromatin organization has been shown to be critical in controlling gene expression and dynamically changed upon gene activation [12, 13]. Chambeyron et al. have shown the chromatin decondensation and nuclear reorganization of the Hoxb locus during mouse embryonic development using fluorescence in situ hybridization (FISH) technique [14, 15]. The development of chromosome conformation capture (3C) technology has made it possible to measure physical contacts between specific genomic DNA segments [16]. So far, several groups have applied the 3C-based technique to prove chromosome conformational changes upon Hox gene expression in vitro [17, 18] and in vivo [19].
The purpose of this study was to investigate the epigenetic status which appears to be required for the maintenance of collinear Hox gene expression patterns along the AP axis throughout embryogenesis. To address this issue, we examined whether histone modifications and chromosomal conformation changes are indeed associated with the collinear expression of Hox genes in vivo using developing mouse embryos. We divided E14.5 mouse embryos into three parts along its AP body axis and analyzed the dynamics of the spatial configuration and histone modifications using 3C and Chromatin immunoprecipitation (ChIP)-PCR techniques.
Materials and methods
Animal preparation
E14.5 embryos were collected by crossing ICR:CD1×ICR:CD1 mice. The day when the vaginal plug was detected was defined as 0.5 days postcoitum (dpc) and E0.5 embryo. After 14 days, the pregnant female mice were euthanized, and then the E14.5 embryos were dissected free of the maternal and extraembryonic tissues in cold-PBS on ice. Each embryonic body was divided into the brain, trunk-anterior, and trunk-posterior after removing the internal organs and tail bud. The samples were properly preserved for RNA or chromatin preparation. E11.5 embryos were also prepared as described previously [20, 21] and used for gene expression analysis. Experimental procedures were approved by the Animal Care and Use Committee of Yonsei University College of Medicine.
RNA isolation and RT-PCR
Total RNA was isolated from the freshly dissected E14.5 embryos using the Trizol reagent (Invitrogen, Carlsbad, CA, USA). Reverse transcription (RT) was performed with 1 μg of RNA using the ImProm-llTM Reverse Transcriptase (Promega, Madison, WI, USA). PCR was performed in triplicate using the G Taq polymerase (Cosmogenetech, Seoul, Korea). PCR amplification was performed under the following conditions: the initial denaturation for 5 min at 94°C, and then 30 cycles of 94°C for 30 sec, 58°C for 30 sec and 72°C for 1 min. At least three independent biological replicates were analyzed. All PCR primers used for detecting Hox gene expression levels were the same as described previously [22]. A noncoding RNA AK035706 was amplified using a forward primer (5'-GAC ACA CAA ATT GGC TTC TGA C-3') and a reverse primer (5'-AAG GGG TGG ACA GTG ATC TG-3'). The β-actin primer sequence was previously described by Lee et al. [23]. For the quantification, the Multi Gauge V3.0 software (Fuji, Tokyo, Japan) was used.
Chromatin immunoprecipitation (ChIP)-PCR
For ChIP analysis with mouse embryonic tissues, the X-ChIP protocol from Abcam was applied with minor modifications. Embryonic samples were cross-linked with 1% formaldehyde diluted in the serum-free Dulbecco's modified Eagle's medium (WelGENE Inc., Daegu, Korea) for 10 min at room temperature. The crosslinking reaction was stopped with 0.125 M Glycine for 5 min and then washed three times with PBS at room temperature. The cells (4×10⁷) were lysed for 10 min on ice in 600 μl of sodium dodecyl sulfate (SDS) lysis buffer and then were sonicated with 30 sets of 10-sec pulses by a VibracellTM sonicator (VCX130, Sonics & Materials Inc., Newton, CT, USA) to obtain the average DNA size of 500 - 1000 bp. The chromatin with salmon sperm DNA/protein A/G agarose beads (Santa Cruz, CA, USA) and 1 to 2 µg of antibodies was incubated overnight at 4°C. The following day, bound complexes were washed and eluted from the beads and were purified using a PCR purification kit (Cosmogenetech, Seoul, Korea). PCR amplification of the immunoprecipitated DNA fragments was performed by incubation for 5 min at 95°C, followed by 32 cycles of 30 sec at 95°C, 30 sec at 58°C, and 30 sec at 72°C. The PCR primer sequences are shown in Supplementary Material: Table S1.
Chromosome conformation capture (3C)
The 3C assay was performed as described previously [16] with minor modifications. For each set of experiments, cells from the fetal brains, fetal trunk-anterior and trunk-posterior tissues (approximately 4x10⁷ cells) were passed through a cell-strainer (40 μM, SPL Lifesciences, Korea) to obtain a homogeneous single cell suspension. Formaldehyde (37%, Biosesang, Korea) was added (1% final) and the samples were crosslinked for 10 min at room temperature. The reaction was quenched by the addition of glycine (0.125 M final). The cells were harvested, washed with PBS, and lysed in 5 ml of ice-cold lysis buffer (10 mM Tris-Cl [pH 8.0], 10 mM NaCl, 0.2% NP-40 [pH 8.0]) containing complete protease inhibitors (Roche, Basel, Switzerland). Isolated nuclei were washed with an appropriate restriction buffer and were resuspended in the same buffer (0.5 ml per 1 x 10⁷ cells) containing 0.3% SDS and incubated for 1 hr at 37°C with shaking. Triton X-100 was added (1.8% final), and then the nuclei were further incubated for 1 hr at 37°C to get rid of SDS. The crosslinked DNA was digested overnight with the restriction enzyme Hindlll (400 U per 1 x 10⁷ cells, TAKARA, Shiga, Japan). An aliquot of DNA was collected before and after the digestion to determine the digestion efficiency. The restriction enzyme was inactivated by adding SDS (1.6% final) and incubating at 65°C for 20 min. The reaction was diluted with a ligase buffer (50 mM Tris-Cl [pH 7.5], 10 mM MgCl2, 10 mM DTT, and 1mM ATP). Triton X-100 was added (1% final) and then the samples were incubated for 1 hr at 37°C. The DNA was ligated with T4 ligase (TAKARA 8,000 cohesive-end unit) for 4 hr at 16°C and then for 30 min at room temperature. Proteinase K was added, and the samples were incubated overnight at 65°C to reverse the crosslinks. The following day, the samples were incubated for 30 min at 37°C with 30 μl of RNaseA (10 mg/ml), and then the DNA was purified by phenol/chloroform extraction and ethanol precipitation. The DNA concentration was carefully determined using a Nanodrop spectrophotometer. Mouse BAC clones carrying Hoxc cluster genes (RP24-459N19 from CHORI BACPAC) were used as the 3C control templates. BAC DNA (2 μg) was digested with HindIII and religated so that a collection of all possible ligation products were present in equimolar amounts.
PCR analysis of the 3C templates
To determine the digestion efficiency of each 3C template, aliquots of undigested and digested samples were decrosslinked, and DNA was isolated using phenol/chloroform extraction followed by ethanol precipitation. For assessing the digestion efficiency, 100 ng of the isolated DNA was used as a template. PCR was performed using the h-taq polymerase (Solgent, Seoul, Korea) under the following conditions: the initial denaturation for 5 min at 95°C, and then 26 cycles of 95°C for 30 sec, 58°C for 30 sec, and 72°C for 1 min. We introduced a touchdown PCR method to detect a genomic band from a combination of cP series primers. The PCR cycle consisted of initial denaturation for 3 min at 95°C, 10 cycles of touchdown PCR, wherein the beginning annealing temperature of 67°C was decreased by 0.5°C per cycle for 10 cycles with extension at 72°C for 30 sec; denaturation at 95°C for 1 min; and the following 40 cycles were at 95°C for 1 min, 62°C for 20 sec, and 72°C for 30 sec. The resulting PCR products were analyzed by conventional agarose gel electrophoresis. For quantification, Multi Gauge V3.0 software was used. The sequences of all the PCR primers in Hoxc loci have been reported previously [24]. 3C PCR quality was verified by measuring the compaction of the gene desert control region (Chr15: 102,650,000-102,870,000). 3C interaction frequencies in the Hoxc cluster was normalized by calculating the average value of contacts with the corresponding gene desert in each 3C templates. The primer sequences in the gene desert region were shown in Supplementary Material: Table S2.
3C efficiency control
The 3C efficiency control test was performed as described previously [17] with minor modification. In brief, the beta-actin locus was chosen to perform the 3C efficiency control. The frequency of crosslinking of the HindIII genomic fragment containing the beta-actin gene to its adjacent upstream HindIII fragment was quantified (Supplementary Material: Fig. S1). First, a 25 cycle PCR was performed on the 3C templates using the primers ActNestA: 5'-ACTTAGGTGTACCTGTGTGTGCCT-3' and ActAdj: 5'-AGCAGTGGTTTCTATTGGCTGTCG-3'. This first PCR was performed using the h-taq polymerase. The PCR conditions were as follows: 2 min at 94°C; 20 sec at 94°C, 30 sec at 60°C, 1 min at 72°C for 25 cycles. 3C PCR was performed on 1/100 of this first amplification using the nested primer ActA: 5'-CTTCTGACCTAGAACTCTTGATCCC-3' and the ActAdj primer using the same PCR conditions, except for the number of cycles: 2 min at 94°C; 20 sec at 94°C, 30 sec at 60°C, 1 min at 72°C for 35 cycles. To compare the 3C signal of the genomic HindIII fragment containing the beta-actin gene in the different samples, PCR was performed using 3C templates of mouse tissues with the primers ActA and ActB: 5'-CCCTCTACACACACTCAGAATTCATC-3'. This PCR amplified fragments located within the HindIII genomic fragment containing the beta-actin gene. The resulting PCR products were analyzed by conventional agarose gel electrophoresis. For quantification, the Multi Gauge V3.0 software was used. This crosslinking efficiency was used to normalize the signal representing the crosslinking of the HindIII genomic fragment containing the beta-actin gene to its adjacent fragment located immediately upstream in the different 3C template.
Results
Spatial collinear expression of Hox genes along the AP body axis in developing mouse embryos
Before examining the histone modification status and the architectural organization of the chromosomes of Hox loci in vivo, the collinear expression patterns of Hox genes were examined in mouse embryos. The E14.5 embryos were divided into three parts (brain, trunk-anterior, and trunk-posterior) and then were subjected to semi-quantitative RT-PCR for the genes in the Hoxc cluster (Fig. 1A). Internal organs, limbs, and tail buds were removed to focus on the Hox machinery in the main body axis of the embryos. As shown in Fig. 1B, distinct expression patterns of Hoxc genes were observed in the brain, trunk-anterior, and trunk-posterior tissues. In the brain tissues, none of the Hoxc gene was expressed (Fig. 1B).
Expression analysis of Hoxc cluster genes in E14.5 mouse embryo along the anteroposterior axis. (A) The picture shows a mouse embryo (E14.5). The dashed lines with a pair of scissors mark the position of the dissection. In the schematic diagram of the Hoxc gene cluster, the expression status in each segment was depicted based on the RT-PCR data shown in (B). White and black boxes represent the active and inactive genes, respectively. (B) Expression pattern of Hoxc genes in three distinct regions. RT-PCR was performed using Hox gene-specific primers. β-actin was used as a positive control for RNA integrity and cDNA synthesis. The data are representative of the three replicate experiments. B, brain; T-A, trunk-anterior; T-P, trunk-posterior.
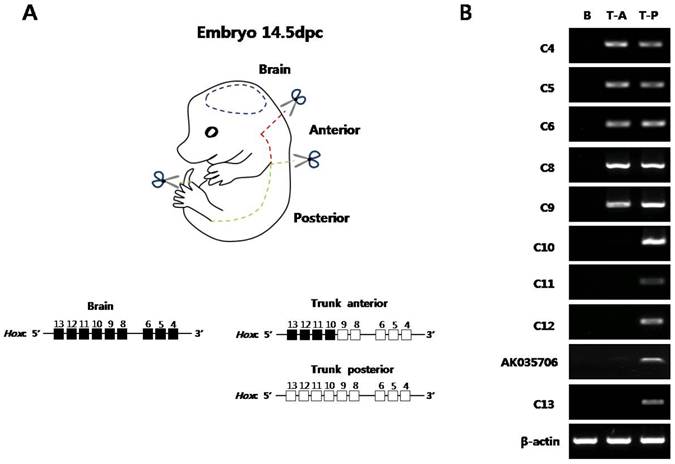
The trunk-anterior tissues expressed only the anterior genes (Hoxc4 to Hoxc9) located in the 3' region of the cluster. The trunk-posterior tissues expressed posterior genes (Hoxc10 to Hoxc13) located in the 5' region of the cluster together with the anterior genes. A noncoding RNA, AK035706, located in between Hoxc12 and -c13 was also expressed in a collinear expression manner with respect to its position in the cluster (Fig. 1B). In addition to the Hoxc genes, other Hox genes located in the Hoxa, Hoxb, and Hoxd clusters showed similar expression patterns (Supplementary Material: Fig. S2A). These results confirmed the spatial collinear expression of Hox genes along the AP body axis, so that the genes located near the 3' end of the cluster were expressed more anteriorly than the genes located near the 5' end.
Histone modifications of Hoxc loci in developing mouse embryos
Since it was confirmed that Hox genes were differentially expressed along the AP body axis in E14.5 mouse embryos, next we asked whether the chromatin isolated from the three embryonic tissues (brain, trunk-anterior, trunk-posterior) have different epigenetic modifications in histones. We first validated the ChIP protocol by performing a control assay using primers specific for the promoter region of the GAPDH gene constitutively expressed in most cell types. As expected, the GAPDH promoter region was enriched with the active chromatin mark H3K4me3 in all three body tissues, while the inactive chromatin mark H3K27me3 was not detected (Supplementary Material: Fig. S3).
Next, we examined histone modifications in the Hoxc loci using PCR primers designed to amplify genomic regions across the Hoxc cluster (Fig. 2A). As shown in Fig. 2B, the inactive chromatin mark H3K27me3 was strongly enriched across the Hoxc loci tested in the brain tissues where Hox genes were not expressed.
Histone 3 (H3) modifications at Hoxc genomic loci in E14.5 embryos. (A) A schematic representation of the Hoxc cluster shows the genomic position of each gene and the primers used for ChIP analysis. (B) ChIP assays were performed with the indicated antibodies on crosslinked chromatin samples from the E14.5 brain, anterior and posterior trunk tissues. Immunoprecipitated and input DNAs were amplified by PCR using region-specific primers. The 3' and 5' Hoxc genes are indicated by a blue box (B) and a pink box (C) based on the expression pattern of Hoxc genes shown in Fig.1A. The data show the results of one experiment of at least three independent experiments giving comparable results. B, brain; T-A, trunk-anterior; T-P, trunk-posterior.
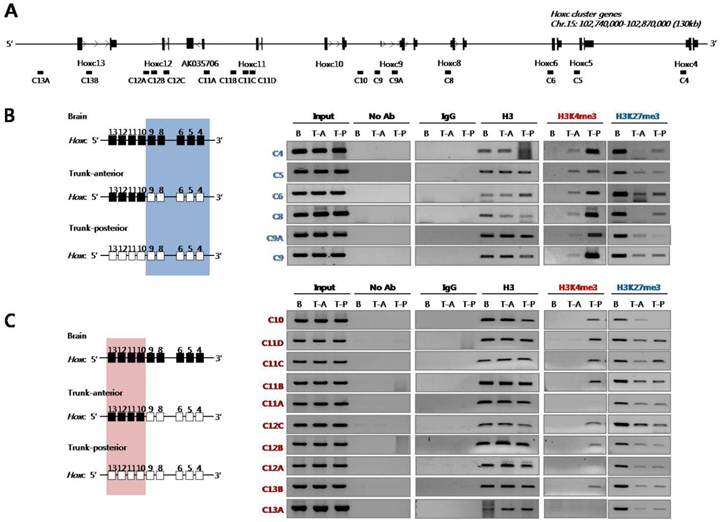
However, the level of H3K27me3 was significantly reduced in the trunk tissues (both trunk-anterior and -posterior tissues), regardless of whether the genes were activated or not. In the case of the active chromatin mark H3K4me3, the chromatin isolated from the anterior trunk region where the 3'-located anterior Hoxc genes (Hoxc4 to Hoxc9) were expressed had such modification only in the anterior genes tested, but not in the posterior Hoxc genes (Hoxc10 to Hoxc13) (Fig. 2B). On the contrary, the trunk-posterior tissues where all Hoxc genes were expressed were highly modified with the active mark H3K4me3 across most of the Hoxc loci tested. The deposition of the active chromatin mark H3K4me3 was not found in the brain which did not express any Hox genes (Fig. 2B). All ChIP-PCR values were normalized for histone H3 occupancy (Supplementary Material: Table S3). These results suggest not only that the loss of the H3K27me3 mark both in trunk-anterior and -posterior tissues might contribute to the ready state for activation, but also that the H3K4me3 mark could be a crucial signal for returning it to a fully euchromatic chromatin state.
Chromatin organization of the Hoxc cluster in mouse embryonic brain and trunk tissues
To see whether the histone modifications observed in developing embryos were associated with the chromosomal structures, in respect to Hox gene expression, the 3C technique was applied using the same embryonic tissues (brain, trunk-anterior and trunk-posterior tissues). After fixing the tissues with formaldehyde, the crosslinked chromosomal DNAs in their original architecture were digested with HindIII restriction endonuclease to separate non-crosslinked DNA from crosslinked chromatin. After intra-molecular ligation, interaction frequencies between anchor/bait and other HindIII fragments were determined by 3C-PCR throughout the Hoxc locus, and then normalized with those analyzed with BAC DNA containing the entire Hoxc cluster and a gene desert region (see Materials and Methods). The position of each primer used for 3C-PCR is shown in Fig. 3A along with the schematic map of the Hoxc cluster.
Identification of intra-chromosomal interactions in Hoxc loci in brain and trunk tissues. (A) A schematic presentation of the Hoxc cluster on chromosome 15. A linear diagram of the Hoxc gene cluster shows the position of 3C primers (cP with a dotted arrow with its head pointing to the 5' direction) as well as HindIII restriction sites (dotted vertical lines). (B-D) Chromatin structural changes at Hoxc genomic loci were measured in the brain (blue), as well as anterior (red) and posterior (green) trunk tissues. The y-axis indicates the normalized interaction frequency. The x-axis shows the primer number as shown in (A). The position of anchor primers cP6-1 (B), cP10 (C) and cP19 (D) were indicated in gray color. Interaction frequencies represent the average of the three independent PCRs.
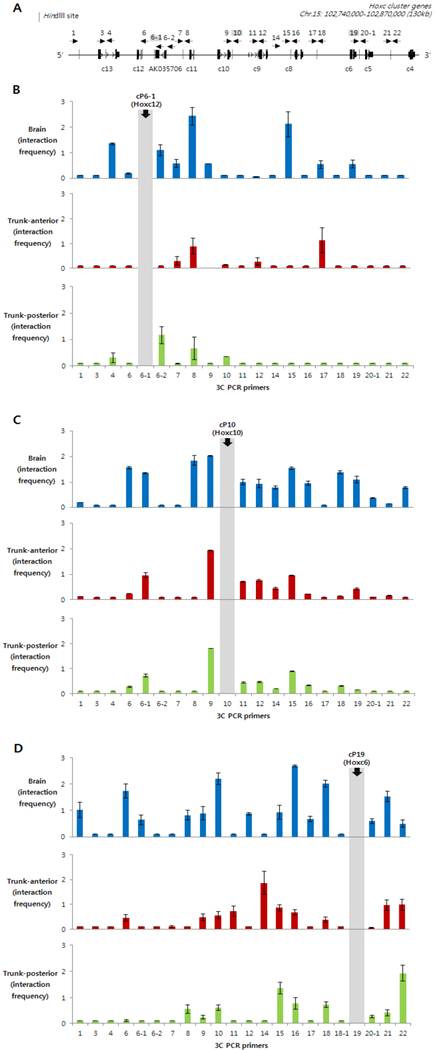
3C PCR was performed with three different anchor primers: cP6-1, which is located between Hoxc11 and Hoxc12; cP10, which is between Hoxc9 and Hoxc10; and cP19, which is between Hoxc5 and Hoxc6. Especially, the cP10 anchor primer was designed in the boundary region dividing the actively expressed (Hoxc4 to Hoxc9) and non-expressed genes (Hoxc10 to Hoxc13) in the trunk-anterior tissues (Fig. 1B and 3B). The Hoxc loci in the chromatin isolated from the Hox non-expressing brain tissues (enriched with H3K27me3, Fig. 2B) showed high interaction frequencies with different genomic regions across the Hoxc cluster (Fig. 3A-C). In contrast, regardless of whether the anchor primer was located in the region of active genes or not, the trunk-anterior tissues showed much lower interaction frequencies, and so did the trunk-posterior tissues. These results may imply that brain has a more compact structure than the trunk region. The 3C-PCR results, however, did not show any significant differences between the trunk-anterior and trunk-posterior tissues within the Hoxc cluster. We therefore concluded that loosening of the chromatin structure might be important to maintaining a transcriptionally ready state in trunk tissues, but the concomitant acquisition of histone marks, such as H3K4me3, at specific loci might permit collinearity of Hox gene expression.
Discussion
We have shown that spatial collinear Hox gene expression in developing embryos is accompanied by changes in spatial organization and histone modification. Our results have shown that the brain tissues that never express Hox genes during development have a heterochromatin-like condensed chromatin. In the trunk tissues, however, structural changes make the chromatin loose and transcriptionally poised, and then accompanying histone modifications at the appropriate loci along the AP axis allow them to be activated sequentially.
Recently, Noordermeer et al. examined the spatial configuration of Hox clusters as well as histone modifications in three tissue samples from E10.5 mouse embryos, where different Hox genes are active [19]. Similarly, we observed collinear Hox gene expression patterns in five different distinct tissue samples from E11.5 mouse embryos (Supplementary Material: Fig. S2B). Together, the expression patterns we examined in E14.5 embryos in this study (Fig. 1 and Supplementary Material: Fig. S1A) reinforce the notion that this Hox gene expression boundary along the AP axis seems to be established in the beginning of organogenesis and strictly maintained during embryogenesis. Therefore, by analyzing the chromosome structure and histone marks of Hoxc loci in E14.5 embryonic bodies, we have focused our studies on a particular epigenetic program, the effects of which can contribute to maintenance of collinear Hox gene expression during mid to late stage of embryogenesis.
Several studies performed with 3C and 3C-related techniques have shown that the topological organization of Hox loci was dynamically changed upon Hox gene expression. Through open-ended 3C (4C) and subsequent sequencing analysis, the inter-chromosomal interactions between Hoxb1 and the rest of the genome were increased, while interactions with intra-chromosomal loci became less frequent during gene expression in mouse ES cells, which was consistent with FISH data that showed the decondensation and repositioning of Hoxb1 outside of its chromosomal territory [17]. Our observations that intra-chromosomal interactions between genomic regions within a Hoxc cluster are less frequent in trunk tissues, where Hox genes are active, compared to those in brain tissues, support the previous findings; however, we are not sure yet whether the decreased intra-chromosomal interactions in trunk tissues are accompanied by increased inter-chromosomal interactions. Recently, the chromatin organization of human HOX genes was also determined by 3C related technology [18, 25]. Although these results were from an in vitro cell line model system (active versus silent Hox chromatin), it still provides the framework for elucidating the regulatory mechanism controlling spatiotemporal collinear expression of Hox genes in vivo. More recently, a work from Noordermeer et al. has shown that one 3D domain on a Hox gene cluster switches into a bimodal 3D organization, depending on Hox gene activation in embryonic mouse tissues [19]. Interestingly enough, our embryonic tissue data (Fig. 3) support the concept that each cluster folds onto itself by forming multiple chromatin loops when transcriptionally inert in the brain tissues, probably because of a need to avoid temporally or spatially irrelevant expression of Hox genes during development. In contrast, our results showed that the looping structure was relatively rare in the trunk tissues, regardless of whether they originated from the posterior or anterior region. It is not clear from our model whether the chromosomal compartment for the active genes are separated from the domain of inactive genes, as shown in the data from Noordermeer et al. [19]; however, we partly agree with this view, as a result of our experiments with the 'cP19' anchor primer. This primer, which is located near Hoxc6 and transcriptionally active in trunk tissues, more frequently interacted with other genomic regions within the anterior genes (Hoxc4 to Hoxc9), which are active in trunk-anterior tissues, compared to the inactive posterior genes (Hoxc10 to Hoxc13). Obviously, it is evident that this association was stronger in brain tissues. Taken together, our results suggest that a local loosening of the chromatin structure might be functionally important to establishing the transcriptionally competent chromatin status.
Although topological changes of chromatin are a common feature in gene regulation [17, 25-31], the role of other epigenetic changes such as histone modifications must be taken into account in order to understand the delicate nature of gene regulation. Our in vivo data revealed that combinatorial modification pattern of H3K27me3 and H3K4me3 along the Hoxc cluster in trunk seemed to provide an important functional link between chromatin remodeling and the establishment of transcriptional competency. According to the previous reports [11,19], H3K27me3 seemed to disappear upon gene activation, although there were small regions slightly overlapping with transcriptionally active regions. In contrast, our data proved that H3K27me3 broadly defines transcriptionally competent portions of the genome, regardless of whether the regions are transcriptionally active or not. We might also consider the possibility that the expression boundary of Hoxc genes in trunk tissues, which is normally determined epigenetically, is less strict compared to other Hox clusters, i.e., Hoxa, Hoxb, and Hoxd. Supportingly, the correlation of H3K27me3 marks with Hoxc gene expression levels in a previous study using E10.5 mouse tissues [19] was not strong enough to achieve consistent results across four different Hox clusters. Another possibility is that somewhat different levels of epigenetic programs might drive the maintenance of Hox gene expression at a given stage. Altogether, our data suggest that removing the inactive chromatin mark H3K27me3 alone is not sufficient to induce gene expression, but acquiring H3K4me3 provides epigenetic marks for driving spatial collinear expression of Hox genes.
These results were in agreement with a recent study that examined epigenomic reorganization of Hox genes in mouse ES cells [32]. Their results showed that the placing of H3K4me3 activating marks and inducing transcription precede complete erasure of H3K27me3 [32]. Together with our data, these results indicate that the complete removal of H3K27me3 was not necessary to initiate Hox transcription. Our results show that both H3K4me3 and H3K27me3 marks are examined at the same locus in trunk tissues, however, it is not easy to say exactly whether bivalent modification is correlated with gene activation, since the embryonic cells used in this study were heterogeneous and therefore the ChIP results are probably the summation of the state that was from many different types of cells located in a certain region. Hence, we cannot distinguish whether the chromatin was bivalently modified or monovalently marked with either H3K4me3 or H3K27me3 at this moment.
Previously, chromatin decondensation and nuclear reorganization upon induction of mouse Hoxb and -d genes have been reported in ES cells as well as in embryos [14, 15, 33]. The progressive looping of the genes from the chromosome territory along the AP axis in developing neural tube was coherent with the collinear sequential expression of Hox genes. Although the cells we used in this study were not only from the neural tube but also from most of the ectoderm- and mesoderm-derived tissues in the later stages of the embryos (E14.5), decondensation of Hox cluster seems to occur in trunk tissues, compared to those in the Hox non-expressing brain tissues.
In conclusion, we propose here that collinear Hox gene expression patterns along the AP axis established during early embryogenesis are strictly maintained while the process of organogenesis is completed. This is accomplished by cooperation between histone modifications and chromosome conformational changes. Our findings provide a good clue as to how Hox genes display spatially restricted patterns of expression in embryos at a fixed time point.
Supplementary Material
Table S1 - S3 and Figure S1 - S3.
Acknowledgements
Ms. H. Min is a graduate student receiving a Brain Korea 21 Scholarship and Hi Seoul science fellowship from Seoul Scholarship Foundation (SSF). This work was supported by grants from 2010-0000155, 2010-0026759, and 2010-0025149 from the National Research Foundation (NRF) and in part by 20070401-034-030 from the BioGreen21 Program, Rural Development Administration (RDA), Korea.
Competing Interests
The authors have declared that no competing interest exists.
References
1. McGinnis W, Krumlauf R. Homeobox genes and axial patterning. Cell. 1992;68:283-302
2. Krumlauf R. Hox genes in vertebrate development. Cell. 1994;78:191-201
3. Kmita M, van Der HF, Zakany J. et al. Mechanisms of Hox gene colinearity: transposition of the anterior Hoxb1 gene into the posterior HoxD complex. Genes & Development. 2000;14:198-211
4. Soshnikova N, Duboule D. Epigenetic regulation of Hox gene activation: the waltz of methyls. BioEssays. 2008;30:199-202
5. Soshnikova N, Duboule D. Epigenetic regulation of vertebrate Hox genes: a dynamic equilibrium. Epigenetics. 2009;4:537-40
6. Margueron R, Reinberg D. The Polycomb complex PRC2 and its mark in life. Nature. 2011;469:343-349
7. Bernstein BE, Kamal M, Lindblad-Toh K. et al. Genomic Maps and Comparative Analysis of Histone Modifications in Human and Mouse. Cell. 2005;120:169-181
8. Bracken AP, Dietrich N, Pasini D. et al. Genome-wide mapping of Polycomb target genes unravels their roles in cell fate transitions. Genes & Development. 2006;20:1123-1136
9. Barski A, Cuddapah S, Cui K. et al. High-resolution profiling of histone methylation in the human genome. Cell. 2007;129:823-837
10. Lee TI, Jenner RG, Boyer LA. et al. Control of Developmental Regulators by Polycomb in Human Embryonic Stem Cells. Cell. 2006;125:301-313
11. Soshnikova N, Duboule D. Epigenetic temporal control of mouse Hox genes in vivo. Science. 2009;324:1320-3
12. Fraser P, Bickmore W. Nuclear organization of the genome and the potential for gene regulation. Nature. 2007;447:413-417
13. Gondor A, Ohlsson R. Chromosome crosstalk in three dimensions. Nature. 2009;461:212-217
14. Chambeyron S, Bickmore WA. Chromatin decondensation and nuclear reorganization of the HoxB locus upon induction of transcription. Genes & Development. 2004;18:1119-1130
15. Chambeyron S, Da Silva NR, Lawson KA. et al. Nuclear re-organisation of the Hoxb complex during mouse embryonic development. Development. 2005;132:2215-2223
16. Dekker J, Rippe K, Dekker M. et al. Capturing Chromosome Conformation. Science. 2002;295:1306-1311
17. Würtele H, Chartrand P. Genome-wide scanning of HoxB1-associated loci in mouse ES cells using an open-ended Chromosome Conformation Capture methodology. Chromosome Research. 2006;14:477-495
18. Fraser J, Rousseau M, Shenker S. et al. Chromatin conformation signatures of cellular differentiation. Genome Biology. 2009;10:R37
19. Noordermeer D, Leleu M, Splinter E. et al. The Dynamic Architecture of Hox Gene Clusters. Science. 2011;334:222-225
20. Ruthala K, Gadi J, Lee J-Y. et al. Hoxc8 downregulates Mgl1 tumor suppressor gene expression and reduces its concomitant function on cell adhesion. Molecules and Cells. 2011;32:273-279
21. Min H, Lee J-Y, Bok J. et al. Proliferating cell nuclear antigen (Pcna) as a direct downstream target gene of Hoxc8. Biochemical and Biophysical Research Communications. 2010;392:543-547
22. Yu SJ, Lee J-Y, Kim SH. et al. Synthetic maternal stress hormone can modulate the expression of Hox genes. J. Exp. Biomed. Sci. 2009;15:249-255
23. Lee J-Y, Khan A, Min H. et al. Identification and characterization of a noncoding RNA at the mouse Pcna locus. Molecules and Cells. 2012;33:111-116
24. Lee J-Y, Min H, Wang X. et al. Chromatin organization and transcriptional activation of Hox genes. Anat Cell Biol. 2010;43:78-85
25. Ferraiuolo MA, Rousseau M, Miyamoto C. et al. The three-dimensional architecture of Hox cluster silencing. Nucl. Acids Res. 2010;38:7472-7484
26. Tolhuis B, Palstra R-J, Splinter E. et al. Looping and Interaction between Hypersensitive Sites in the Active [beta]-globin Locus. Molecular Cell. 2002;10:1453-1465
27. Spilianakis CG, Flavell RA. Long-range intrachromosomal interactions in the T helper type 2 cytokine locus. Nat Immunol. 2004;5:1017-1027
28. Tiwari VK, McGarvey KM, Licchesi JDF. et al. PcG Proteins, DNA Methylation, and Gene Repression by Chromatin Looping. PLoS Biol. 2008;6:e306
29. Hakim O, John S, Ling JQ. et al. Glucocorticoid Receptor Activation of the Ciz1-Lcn2 Locus by Long Range Interactions. J. Biol. Chem. 2009;284:6048-6052
30. Sexton T, Bantignies F, Cavalli G. Genomic interactions: Chromatin loops and gene meeting points in transcriptional regulation. Seminars in Cell & Developmental Biology. 2009;20:849-855
31. Ktistaki E, Garefalaki A, Williams A. et al. CD8 Locus Nuclear Dynamics during Thymocyte Development. J Immunol. 2010;184:5686-5695
32. Kashyap V, Gudas LJ, Brenet F. et al. Epigenomic reorganization of the clustered Hox genes in embryonic stem cells induced by retinoic acid. J Biol Chem. 2011;286:3250-60
33. Morey C, Da Silva NR, Perry P. et al. Nuclear reorganisation and chromatin decondensation are conserved, but distinct, mechanisms linked to Hox gene activation. Development. 2007;134:909-919
Author contact
![]() Corresponding author: E-mail: mhkim1ac. Tel: +82-2-2228-1647, Fax: +82-2-365-0700
Corresponding author: E-mail: mhkim1ac. Tel: +82-2-2228-1647, Fax: +82-2-365-0700