Impact Factor ISSN: 1449-2288

 Global reach, higher impact
Int J Biol Sci 2012; 8(6):811-818. doi:10.7150/ijbs.4439 This issue Cite
Research Paper
Human Circulating MicroRNA-1 and MicroRNA-126 as Potential Novel Indicators for Acute Myocardial Infarction
Guangwen Long*, Feng Wang*, Quanlu Duan, Fuqiong Chen, Shenglan Yang, Wei Gong, Yan Wang, Chen Chen ![]() , Dao Wen Wang
, Dao Wen Wang ![]()
Department of Internal Medicine and the Institute of Hypertension, Tongji Hospital, Tongji Medical College of Huazhong University of Science and Technology, Wuhan, People's Republic of China.
* contributed equally to this study.
Received 2012-4-4; Accepted 2012-6-3; Published 2012-6-7
Abstract
Circulating miRNAs have been shown as promising biomarkers for various pathologic conditions. The aim of this study was to clarify that circulating miR-1 and miR-126 in human plasma might be useful as biomarkers in acute myocardial infarction (AMI). In our study, after pre-test, two candidate miRNAs were detected by using real-time RT-PCR. Cardiac troponin I (cTnI) concentrations were measured by ELISA assay in plasma from patients with AMI (n=17) and healthy subjects (n=25), simultaneously. Increased miR-1 and decreased miR-126 in plasma from patients with AMI after the onset of symptoms compared with healthy subjects were found. A remarkable finding in this study is that miR-1, miR-126 and cTnI expression levels exhibited the same trend. Our results suggest that the plasma concentrations of miR-1 and miR-126 may be useful indicators for AMI.
Keywords: circulating miRNA, biomarker, AMI.
Introduction
MicroRNAs (miRNAs) are a relatively novel class of endogenous, non-protein coding small RNA molecules that can regulate hundreds of genes through binding to the 3' UTR of target mRNAs [1-3]. MiRNAs have been proven to play important roles in self-renewal, cellular development, differentiation, proliferation and apoptosis [4, 5]. Mature miRNAs bind to specific regions of mRNA targets by a mechanism that is not completely understood, resulting in translational repression or mRNA degradation [6-9].
The human genome encodes more than 1,000 miRNAs with tissue or cell type specific expressions [10-13]. Studies have shown that miRNAs have been observed in a wide range of human diseases, including autoimmune, inflammatory, neurodegenerative and cardiovascular diseases [14, 15]. There are mounting evidences showing that cardiac-specific miRNAs, miR-1, miR-133a/b and miR-208, are involved in heart development and cardiovascular diseases, including acute myocardial infarction (AMI) in experimental animals [16]. Recent studies have shown that some miRNAs are present in the systemic circulation, both in humans and animals, and are associated with exosomes and microparticles [17-20]. The levels of some circulating miRNAs have been reported to be differentially expressed during pregnancy and in the presence of a variety of cancers or cardiovascular diseases.
High mortality and morbidity is common in AMI. Some biomarkers have been applied in diagnosis of AMI; for example, cardiac troponin I (cTnI), MB and so on. New approaches that can improve current diagnosis for AMI are still lacking.
However, the expression and possible roles of miRNAs in AMI are less well studied. Cardiac injury, which occurs after AMI increases the circulating levels of several myocardial-derived miRs (eg, miR-1, miR-133, miR-499, miR-208), whereas patients with coronary artery disease or diabetes showed reduced levels of endothelial-enriched miRs, such as miR-126 [21]. In the present study, we assessed the hypothesis that miR-1 and miR-126 might be useful for identifying and evaluating AMI. Our aim was to look for miRNA-based modulation of gene expression in AMI.
Materials and Methods
Blood Samples
This study was supported by the Ethics Committee of Tongji Hospital, and was performed in accordance with the principles of the Declaration of Helsinki. After gaining their written informed consents, we gathered blood samples from 17 patients and 25 healthy adults at Tongji Hospital between October 2009 and May 2010. AMI was diagnosed based on combination of several criteria: 1) ischemic symptoms; 2) creatine kinase-MB (CK-MB); 3) pathological Q wave; 4) increased cTnI; and 5) ST-segment elevation or depression [22]. In addition, 25 healthy adult volunteers (normal electrocardiogram and no history of cardiovascular diseases) were enrolled in this study. The blood samples of patients with AMI were acquired at 4h (± 30min), 8h (± 30min), 12h (± 30min), 24h (± 30min), 48h (± 30min), 72h (± 30min) and 1w (± 60min) after the onset of symptoms. Plasma was isolated by centrifugation and conserved at -80°C until purification.
RNA Purification
Total RNA was extracted from plasma with TRIzol LS Reagent as described previously [23].
Plasma cardiac troponin I determine
Plasma cTnI concentrations were measured by ELISA assay according to the manufacturer's protocol (Abnova, Taiwan).
MiRNA qRT-PCR
Two μg of total RNA were reverse-transcribed using Transcript First-strand cDNA Synthesis SuperMix (TransGen Biotech, Beijing, China) in accordance to the manufacturer's protocol. In short, the 50 uL reactions were incubated for 60 min at 42°C, 10 min at 70°C, and then stored at 4°C.
qRT-PCR were analyzed using the Bulge-Loop™ miRNA qRT-PCR Detection Kit (Ribobio Co., Guangzhou, China) and TransStartTM Green qPCR SuperMix (TransGen Biotech, Beijing, China) in accordance with the manufacturer's protocol with the Rotor-Gene 6000 system (Corbett Life Science, QIAGEN, Hilden, Germany). Briefly, the reactions were incubated at 95°C for 30s, followed by 40 cycles of 95°C for 30s, 60°C for 20s, 70°C for 1s. The relative expression level for each miRNA was computed using the comparative CT method. It is important to note that to control for possible diversity in the amount of starting RNA, miRNA expression was normalized to small nucleolar RNA U6.
Statistical analysis
A widely used method to present relative expression of miRNA is the 2-ΔΔct method. Relative expression of miRNA presents the data of the miRNA of interest (CtmiRNA of interest) relative to internal control gene (Ctinternal control miRNA), termed Δct. Results are calculated as Δct± standard deviation (SD). Different groups of AMI patients and healthy adults were compared with Δct±SD of the control group (healthy adults) and tested for statistical significance. When the differences in Δct±SD of the tested groups reached or were below p = 0.05, the difference in miRNA expression was considered statistically significant. The data were presented as fold change graphically. Fold change of the tested group is calculated relative to the control group (healthy adults) using the 2-ΔΔct equation.
All values of miRNAs are expressed as mean±SD. Comparisons of parameters among ≥ 3 groups were analyzed by repeated-measures ANOVA. Independent-sample T test was used for 2-group comparisons. For categorical variables, Chi-Square test was used. Time-course trends of miRNAs and cTnI were analyzed by repeated-measures ANOVA. Differences were considered statistically significant at a value of P<0.05.
A score (miRNA-score) was defined as the level of miR-1 and miR-126 in the AMI group as compared with the control group. The miR-1 and miR-126-score of each sample was calculated as the sum of the inverted-normalized signals of the miR-1 and miR-126-scores and adjusted by subtracting a constant (the minimal score), so that the range of scores starts at 0 [24].
For all statistical analyses, the statistical software SPSS 13.0 for Windows was used.
Results
Statistical analysis of patients' characteristics
Among 17 patients with AMI, 13 were males and 4 females; their age ranged between 40 and 70 years (mean 53±12.5). All patients had a transmural MI. There were no statistical differences between the control group and the AMI patients for any of the considered variables such as LDL cholesterol, total cholesterol, total triglycerides, HDL cholesterol, white blood cell count, systolic blood pressure, diastolic blood pressure, creatinine and history of diabetes and smoking status were recorded respectively. Details were shown in Table 1.
Clinical characteristics of patients.
| Characteristics | Total patients (n=42) | AMI (n=17 ) | Healthy adults (n=25) | p |
|---|---|---|---|---|
| Age (years) | 52.5±11 | 53±12.5 | 51±12.3 | 0.42 |
| Male/female (n/n) | 31/11 | 13/4 | 18/7 | 0.75 |
| WBC ( *109 /L) | 7.3±1.8.0 | 8.2.0±2.4 | 6.1±1.35 | 0.083 |
| HDL C (mmol/L) | 1.14±0.25 | 1.08±0.23 | 1.23±0.28 | 0.56 |
| TG (mmol/L) | 1.52 ±1.2 | 1.36±0.73 | 1.48±1.37 | 0.76 |
| Hyperlipidaemia, n (%) | 4 (10%) | 2 (12%) | 2 (8%) | 0.35 |
| Cr (umol/L) | 66±30.5 | 85±51 | 54±15 | 0.46 |
| SBP (mmHg) | 126. ±14 | 138±22 | 120 ±16 | 0.82 |
| DBP (mmHg) | 82 ±14 | 84±16 | 76±12 | 0.46 |
| Current smoking, n (%) | 23 (63 %) | 12 (75%) | 11 (55%) | 0.089 |
| Fasting glucose (mmol/L) | 5.46±1.53 | 6.07±1.23 | 5.23±1.63 | 0.5 |
| TC (mmol/L) | 4.32±0.65 | 4.02±0. | 4.15±0.650.82 | 0.8 |
| LDL C (mmol/L) | 2.27±0.57 | 2.58±0.6 | 2.23±0.54 | 0.6 |
| DM, n (%) | 3 (7.%) | 2 (12%) | 1 (4%) | 0.36 |
| Hypertension, n (%) | 16 (38 %) | 8 (50%) | 8 (30%) | 0.324 |
DM, diabetes mellitus; TC, total cholesterol; HDL C, high-density lipoprotein cholesterol; SBP, systolic blood pressure; DBP, diastolic blood pressure; LDL C, low-density lipoprotein cholesterol; WBC, white blood cell; Cr, creatinine. P, comparison between patients with healthy adults. TG, total triglyceride.
MicroRNAs plasma levels in AMI and healthy adult
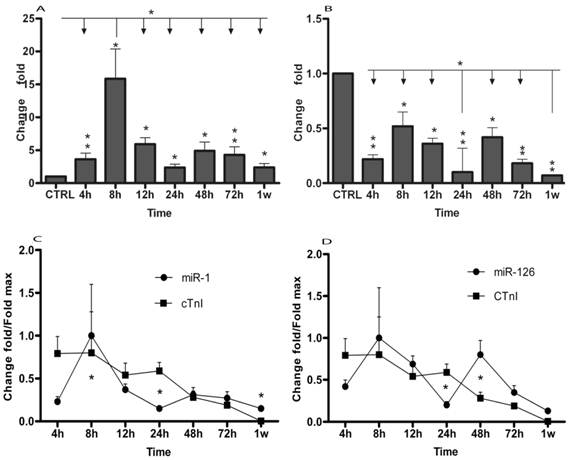
Using qRT-PCR, we analyzed the expression of two miRNAs in AMI patients and in healthy adults. The results were summarized in Table 2 and Figure 1. The data showed that plasma levels of miR-1 exhibited 3.63 (± 0.94) fold, 15.87 (± 4.5) fold, 5.9 (± 1.03) fold, 2.37 (± 0.50) fold, 4.9 (± 1.34) fold, 4.3 (± 1.2) fold and 2.38 (± 0.58) fold increase at 4h (± 30min), 8h (± 30min), 12h (± 30min), 24h (± 30min), 48h (± 30min), 72h (± 30min) and 1w (± 60min), respectively (Table 2 and Fig. 1A). miR-126 levels in AMI patients were 78%, 48%, 64%, 90%, 58%, 82% and 93% lower than in healthy controls at 4h (± 30min), 8h (± 30min), 12h (± 30min), 24h (± 30min), 48h (± 30min), 72h (± 30min) and 1w (± 60min) (Table 2 and Fig. 1B), respectively. Then, circulating miR-1 and miR-126 expression time courses were analyzed by repeated-measures ANOVA. As shown in Fig. 1, miR-1 and miR-126 plasma levels in AMI at each time point were compared. MiR-1 expression was obviously up-regulated at 8h (± 30min) compared with other time points (Fig. 1A), while miR-126 concentration was clearly downregulated at 24h (± 30min) and 1w (± 60min) compared with other time points (Fig. 1B).
MiR-126 and miR-1 in human AMI groups and healthy adults.
| MI (4h) | MI (8h) | MI (12h) | MI (24h) | MI (48h) | MI (72h) | MI (1w) | healthy adult | ||
|---|---|---|---|---|---|---|---|---|---|
| miR-126 | (Δct±SD) | 2.61±0.5 | 1.35±0.33 | 1.85±0.27 | 3.66±0.82 | 1.64±0.34 | 2.89±0.59 | 4.23±0.38 | 0.40±0.12 |
| p value | 0.01 | 0.02 | 0.04 | 0.01 | 0.02 | 0.01 | 0.01 | ||
| AUC | 0.86 | 0.87 | 0.88 | 0.87 | 0.84 | 0.83 | 0.78 | ||
| miR-1 | (Δct±SD) | 8.14±2.11 | 6.0±1.72 | 7.4±1.3 | 8.76±1.83 | 7.7 ±2.1 | 7.9 ±2.2 | 8.76±2.15 | 10.0±2.12 |
| p value | 0.001 | 0.02 | 0.04 | 0.03 | 0.003 | 0.01 | 0.02 | ||
| AUC | 0.92 | 0.90 | 0.94 | 0.92 | 0.96 | 0.90 | 0.76 |
Δct value of miR-126 and miR-1 in human AMI groups and healthy adults is presented as an average group Δct±SD. Corresponding p values were calculated using independent-samples T test, and missing p values represent non significant Δct changes. AUC indicates the area under the receiver operating characteristic (ROC) curve for the differentiation between AMI and control groups.
MicroRNAs expression of plasma in patients with AMI. MicroRNAs plasma levels in patients with AMI using real-time PCR assays. Plasma samples were collected at 4h (± 30min), 8h (± 30min), 12h (± 30min), 24h (± 30min), 48h (± 30min), 72h (± 30min) and 1w (± 60min) after the onset of symptoms. (A) Expression level of miR-1 at different time points; (B) Expression level of miR-126 at different time points; Time courses of circulating miRNA and cTnI from the same plasma samples in patients with AMI and healthy control subjects; (C) Circulating miR-1 expression at different time points; (D) Circulating miR-126 expression in different time points; Values show fold changes of each microRNA vs. its level in the control group, arbitrarily set at 1 as indicated by CTRL, and fold changes of cTnI vs. its level in control group, arbitrarily set at 0.8 as indicated by the CTRL. The data were normalized to the peak level for each microRNA and cTnI achieved in each patient and the time of the peak-fold increase vs. results are reported as mean±SD (*, p< 0.05; **, p≤0.01).
Simultaneous microRNAs and cTnI plasma levels determination in AMI patients
Plasma cTnI concentrations were measured by ELISA assay according to the manufacturer's protocol. In 17 patients, miRNAs and cTnI were measured from the same plasma samples. Compared with healthy adults, cTnI peak increase of 2584 (± 646) fold was achieved at 8h. cTnI increased 2555 (± 655) fold, 1748 (± 437) fold, 1919 (± 329) fold, 892 (± 244) fold, 611 (± 44) fold and 11.3 (± 1.3) fold at 4h, 12h, 24h, 48h, 72h and 1w, respectively (Fig. 1C and 1D). Meanwhile, miR-1, miR-126 and cTnI time courses exhibited the same trends in these patients, by repeated-measures ANOVA analysis. Importantly, no significant interaction effects were found in the time course between miRNAs and cTnI (Fig. 1C and 1D).
Specificity and sensitivity of miR-1 and miR-126
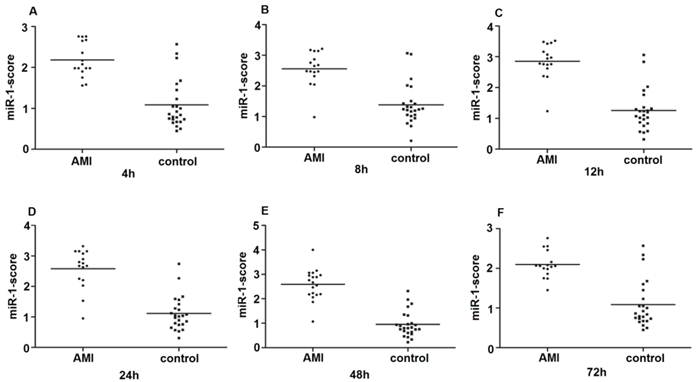
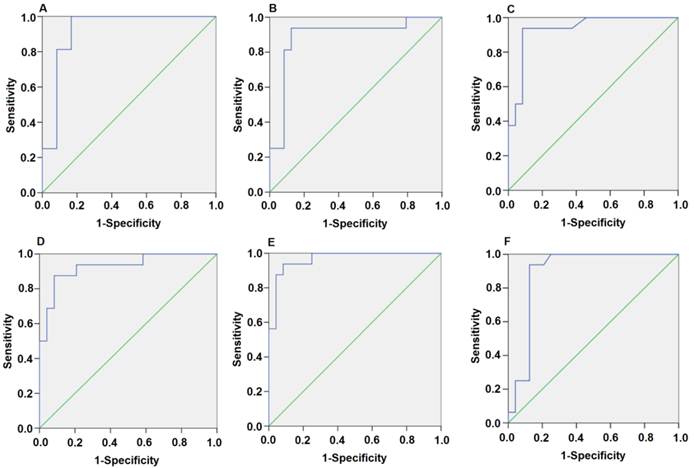
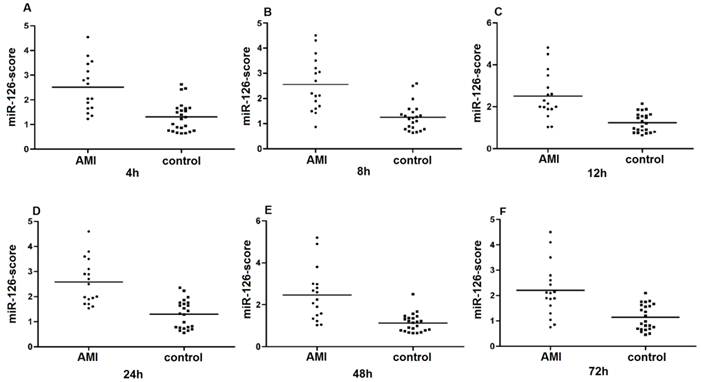
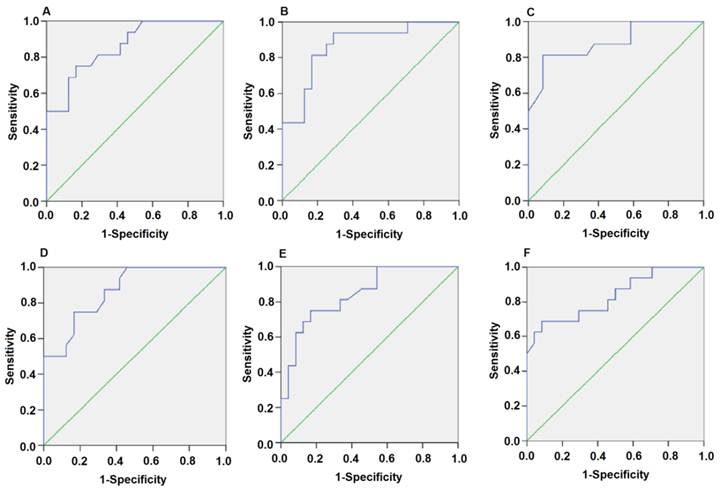
Since the detected levels of miR-1 and miR-126 in plasma may be affected by both technical and biological variation, we combined the levels of miR-1 and miR-126 into a single score to provide an improved signal to noise ratio. The miR-1-score and miR-126-score stand for the plasma levels of the miR-1 and miR-126 with P<0.0001 for the comparison between AMI and control group, was calculated as described in the methods section. The miR-1 and miR-126-scores allowed a significant separation between the AMI and control groups (P = 1e-7). The median score of miR-1 is 2.16, 2.55, 2.85, 2.58, 2.52 and 2.10 in the AMI group. It is 1.04, 1.39, 1.25, 1.1, 0.96 and 1.08, respectively, in the control group at 4h, 8h, 12h, 24h, 48h and 72h (Figure 2). The ability of the miR-1-score to differentiate the AMI group from the control group is demonstrated by the ROC curve with an AUC of 0.92, 0.90, 0.94, 0.92, 0.96 and 0.90 (Figure 3 and Table 2). By using a threshold score of 1.57, 2.03, 2.26, 1.47, 1.83 and 1.74 above which patients are predicted to belong to the AMI group, we achieved a sensitivity of 93%, 93%, 94%, 93%, 93% and 90% and a specificity of 90%, 90%, 93%, 90%, 90% and 90%, respectively, for the identification of AMI patients. The median score of miR-126 is 2.51, 2.55, 2.5 2.6, 2.4 and 2.2 in the AMI group. It is 1.31, 1.31, 1.30, 1.35, 1.21 and 1.20 in the control group at 4h, 8h, 12h, 24h, 48h and 72h (Figure 4). The ROC curve of miR-126 showed moderate ability to distinguish between the AMI group and the healthy control group at 4h, 8h, 12h, 24h, 48h and 72h with an AUC of 0.86, 0.87, 0.88, 0.87, 0.84 and 0.83 (Figure 5 and Table 2), respectively. Using a threshold score of 1.6, 1.59, 1.88, 1.7, 1.2 and 1.25 in the AMI group, we gained a specificity of 78%, 84%, 88%, 77%, 80% and 70% and a sensitivity of 81%, 81%, 81%, 81%, 81% and 81%, respectively, for the diagnosis of AMI in patients.
Plasma miR-1-score in AMI groups and control group. Differences between various time points after the onset of AMI and control groups using the miR-1-score are presented. (A) 4h; (B) 8h; (C) 12h; (D) 24h; (E) 48h; (F) 72h.
Plasma miR-1 is significantly associated with AMI. Receiver operating characteristic (ROC) curve for miR-1-score discriminates between various time points after the onset of AMI and control groups using the miR-1-score. (A) 4h; (B) 8h; (C) 12h; (D) 24h; (E) 48h; (F) 72h.
Plasma miR-126-score in AMI groups and control group. Plasma miR-126-score is shown between AMI groups and control group at 4h, 8h, 12h, 24h, 48h and 72h. Lines show median values, which were 2.51, 2.55, 2.5, 2.6, 2.4 and 2.2 in the AMI group and 1.31, 1.31, 1.3, 1.35, 1.21 and 1.2 in the control group (P = 1e-7) (A, B, C, D, E and F).
Plasma miR-126 is strongly associated with AMI. Receiver operating characteristic (ROC) curve analysis of the diagnostic value of circulating miR-126 for AMI at 4h, 8h, 12h, 24h, 48h and 72h. The areas under the curve (AUC) are 0.86, 0.87, 0.88, 0.87, 0.84 and 0.83 (A, B, C, D, E and F).
Discussion
MiRNA regulates gene expression by binding and modulating the translation of specific miRNAs [25-28]. In recent years, tremendous efforts have been made to use a miRNA microarray screening approach to address the miRNA expression profiling in infarted hearts from animal models [28-30]. Recent evidences suggested that miRNAs are excellent promising disease biomarkers [31-33]. MiRNAs have been consistently detected in serum, plasma and other bodily fluids and specific miRNA patterns have been associated with pregnancy and with certain diseases [34-36]. MiRNAs have been shown to play important roles in development, stress responses, angiogenesis and oncogenesis. Accumulating evidence also points to important roles of miRNAs in the cardiovascular system [8, 37]. However, the role of miRNA in AMI is just emerging.
In this study, we reported the circulating expressions of miR-1 and miR-126 in AMI patients, in comparison to healthy adults. The most significant finding was that plasma levels of miR-126 were down-regulated in acute myocardial infarction at 4h (± 30min), 8h (± 30min), 12h (± 30min), 24h (± 30min), 48h (± 30min), 72h (± 30min) and 1w (± 60min) after the onset of AMI symptoms. Importantly, miR-1 was up-regulated at 4h (± 30min), 8h (± 30min), 12h (± 30min), 24h (± 30min), 48h (± 30min), 72h (± 30min) and 1w (± 60min) after the onset of AMI symptoms. A remarkable finding in this study is that miR-1, miR-126 and cTnI exhibited the same trends, however, with no significant interaction effects. The plasma concentration of miR-1 and miR-126 showed a good correlation with the plasma concentration of cTnI, a classic biomarker of myocardial injury. The validity of circulating cTnI as a marker of myocardial injury has been reported [36]. In our study, the plasma concentrations of cTnI and miR-1, miR-126 were highly correlated and exhibited similar time courses. Using the levels of the miR-1 and miR-126, we were able to define a score with a high sensitivity and specificity for the detection of AMI patients at 4h, 8h, 12h, 24h and 72h relative to control group. Furthermore, to look into the possible mechanisms of miR-1/miR-126 in AMI, computational predictions as described at MICROCOSM, miRanda, TargetScan and Pic Tar were employed. These analyses yielded 901/937, 7204/815, 790/25 and 535/21 potential candidates. Some of them were reported to be associated with coronary diseases, such as GJA1, KCNJ2 [38], tanshinone IIA [39], LRP6 [40]. Taken together, our results clearly support that miR-1 and miR-126 may be useful potential biomarker of AMI.
To avoid possible confounders derived from patient selection, age, gender, total triglyceride, creatinine, HDL cholesterol, LDL cholesterol, white blood cell count, total cholesterol, systolic blood pressure, diastolic blood pressure, history of diabetes and smoking status, all these were recorded in our study. Statistical analyses showed that they have no influence on plasma miRNA levels. This suggested that miR-1 and miR-126 were potential biomarkers for certain diseases.
The present study confirmed that miR-1 and miR-126 can be used as biomarkers of AMI in humans. The next question is whether assessment of plasma miR-1 and miR-126 concentration has any clinical significance. MiRNAs might be an especially rich source of diagnostic, prognostic and predictive information as biomarkers in AMI patients [41].
It should be noted that the present study of circulating miR-1 and miR-126 as potential biomarkers for AMI was conducted in a relatively small sample size and future evaluation in larger clinical studies will be needed to confirm the utility as a biomarker. Nonetheless, our study provides a solid basis to identify and develop miR-1 and miR-126 as a novel class of blood-based biomarkers for AMI in the future.
In summary, we found that circulating miR-1 and miR-126 of patients with AMI were significantly changed in a time dependent manner. This suggests that miR-1 and miR-126 have potential utility as novel potential biomarkers for clinic diagnosis of AMI.
Acknowledgements
This work was supported by grant from the National Natural Science Foundation of China (No. 30770882 and 81070236). We would like to thank Guangxue Li, Yan Lou and Dafeng Lin for their technical assistance. And we thank Dr. Katherine Cianflone at Laval University (Canada) for helping us editing the manuscript.
Conflict of Interests
None.
Abbreviations
miRNAs: microRNAs; AMI: acute myocardial infarction; cTnI: cardiac troponin I.
References
1. Montgomery RL, van Rooij E. Therapeutic advances in MicroRNA targeting. J Cardiovasc Pharmacol. 2011;57:1-7
2. Calin GA, Croce CM. MicroRNA signatures in human cancers. Nat Rev Cancer. 2006;6:857-66
3. Latronico MV, Catalucci D, Condorelli G. Emerging role of microRNAs in cardiovascular biology. Circ Res. 2007;101:1225-36
4. Wu W. MicroRNA: potential targets for the development of novel drugs? Drugs R D. 2010;10:1-8
5. Lu M, Zhang Q, Deng M, Miao J, Guo Y, Gao W. et al. An analysis of human microRNA and disease associations. PLoS One. 2008;3:e3420
6. Ai J, Zhang R, Li Y, Pu J, Lu Y, Jiao J. et al. Circulating microRNA-1 as a potential novel biomarker for acute myocardial infarction. Biochem Biophys Res Commun. 2010;391:73-7
7. Lu Y, Zhang Y, Shan H, Pan Z, Li X, Li B. et al. MicroRNA-1 downregulation by propranolol in a rat model of myocardial infarction: a new mechanism for ischaemic cardioprotection. Cardiovasc Res. 2009;84:434-41
8. Pan ZW, Lu YJ, Yang BF. MicroRNAs: a novel class of potential therapeutic targets for cardiovascular diseases. Acta Pharmacol Sin. 2010;31:1-9
9. Belevych AE, Sansom SE, Terentyeva R, Ho HT, Nishijima Y, Martin MM. et al. MicroRNA-1 and -133 increase arrhythmogenesis in heart failure by dissociating phosphatase activity from RyR2 complex. PLoS One. 2011;6:e28324
10. Cioffi JA, Yue WY, Mendolia-Loffredo S, Hansen KR, Wackym PA, Hansen MR. MicroRNA-21 overexpression contributes to vestibular schwannoma cell proliferation and survival. Otol Neurotol. 2010;31:1455-62
11. Rigoutsos I, Furnari F. Gene-expression forum: Decoy for microRNAs. Nature. 2010;465:1016-7
12. Nicoli S, Standley C, Walker P, Hurlstone A, Fogarty KE, Lawson ND. MicroRNA-mediated integration of haemodynamics and Vegf signalling during angiogenesis. Nature. 2010;464:1196-200
13. Huang MB, Xu H, Xie SJ, Zhou H, Qu LH. Insulin-like growth factor-1 receptor is regulated by microRNA-133 during skeletal myogenesis. PLoS One. 2011;6:e29173
14. Liu Z, Sall A, Yang D. MicroRNA: An emerging therapeutic target and intervention tool. Int J Mol Sci. 2008;9:978-99
15. Rossbach M. Small non-coding RNAs as novel therapeutics. Curr Mol Med. 2010;10:361-8
16. Bostjancic E, Zidar N, Stajer D, Glavac D. MicroRNAs miR-1, miR-133a, miR-133b and miR-208 are dysregulated in human myocardial infarction. Cardiology. 2010;115:163-9
17. D'Alessandra Y, Devanna P, Limana F, Straino S, Di Carlo A, Brambilla PG. et al. Circulating microRNAs are new and sensitive biomarkers of myocardial infarction. Eur Heart J. 2010;31:2765-73
18. Su X, Chakravarti D, Cho MS, Liu L, Gi YJ, Lin YL. et al. TAp63 suppresses metastasis through coordinate regulation of Dicer and miRNAs. Nature. 2010;467:986-90
19. Rouget C, Papin C, Boureux A, Meunier AC, Franco B, Robine N. et al. Maternal mRNA deadenylation and decay by the piRNA pathway in the early Drosophila embryo. Nature. 2010;467:1128-32
20. Qi P, Cheng SQ, Wang H, Li N, Chen YF, Gao CF. Serum microRNAs as biomarkers for hepatocellular carcinoma in Chinese patients with chronic hepatitis B virus infection. PLoS One. 2011;6:e28486
21. Fichtlscherer S, Zeiher AM, Dimmeler S. Circulating microRNAs: biomarkers or mediators of cardiovascular diseases? Arterioscler Thromb Vasc Biol. 2011;31:2383-90
22. Morrow DA, Cannon CP, Jesse RL, Newby LK, Ravkilde J, Storrow AB. et al. National Academy of Clinical Biochemistry Laboratory Medicine Practice Guidelines: Clinical characteristics and utilization of biochemical markers in acute coronary syndromes. Circulation. 2007;115:e356-75
23. Yasui N, Kajimoto K, Sumiya T, Okuda T, Iwai N. The monocyte chemotactic protein-1 gene may contribute to hypertension in Dahl salt-sensitive rats. Hypertens Res. 2007;30:185-93
24. Goren Y, Kushnir M, Zafrir B, Tabak S, Lewis BS, Amir O. Serum levels of microRNAs in patients with heart failure. Eur J Heart Fail. 2012;14:147-54
25. Ramachandran V, Chen X. Degradation of microRNAs by a family of exoribonucleases in Arabidopsis. Science. 2008;321:1490-2
26. Shi B, Guo Y, Wang J, Gao W. Altered expression of microRNAs in the myocardium of rats with acute myocardial infarction. BMC Cardiovasc Disord. 2010;10:11
27. Small EM, Sutherland LB, Rajagopalan KN, Wang S, Olson EN. MicroRNA-218 regulates vascular patterning by modulation of Slit-Robo signaling. Circ Res. 2010;107:1336-44
28. Wang X, Zhang X, Ren XP, Chen J, Liu H, Yang J. et al. MicroRNA-494 targeting both proapoptotic and antiapoptotic proteins protects against ischemia/reperfusion-induced cardiac injury. Circulation. 2010;122:1308-18
29. Thum T, Gross C, Fiedler J, Fischer T, Kissler S, Bussen M. et al. MicroRNA-21 contributes to myocardial disease by stimulating MAP kinase signalling in fibroblasts. Nature. 2008;456:980-4
30. Moazed D. Small RNAs in transcriptional gene silencing and genome defence. Nature. 2009;457:413-20
31. Fasanaro P, Greco S, Ivan M, Capogrossi MC, Martelli F. microRNA: emerging therapeutic targets in acute ischemic diseases. Pharmacol Ther. 2010;125:92-104
32. Gielen S, Schuler G, Adams V. Cardiovascular effects of exercise training: molecular mechanisms. Circulation. 2010;122:1221-38
33. Lu Y, Zhang Y, Wang N, Pan Z, Gao X, Zhang F. et al. MicroRNA-328 contributes to adverse electrical remodeling in atrial fibrillation. Circulation. 2010;122:2378-87
34. Abdellatif M. MicroRNA: redefining mechanisms in cardiovascular diseases. J Cardiovasc Pharmacol. 2010;56:441-3
35. Bauersachs J. Regulation of myocardial fibrosis by MicroRNAs. J Cardiovasc Pharmacol. 2010;56:454-9
36. Ji X, Takahashi R, Hiura Y, Hirokawa G, Fukushima Y, Iwai N. Plasma miR-208 as a biomarker of myocardial injury. Clin Chem. 2009;55:1944-9
37. Bostjancic E, Zidar N, Glavac D. MicroRNA microarray expression profiling in human myocardial infarction. Dis Markers. 2009;27:255-68
38. Yang B, Lin H, Xiao J, Lu Y, Luo X, Li B. et al. The muscle-specific microRNA miR-1 regulates cardiac arrhythmogenic potential by targeting GJA1 and KCNJ2. Nat Med. 2007;13:486-91
39. Shan H, Li X, Pan Z, Zhang L, Cai B, Zhang Y. et al. Tanshinone IIA protects against sudden cardiac death induced by lethal arrhythmias via repression of microRNA-1. Br J Pharmacol. 2009;158:1227-35
40. Mani A, Radhakrishnan J, Wang H, Mani MA, Nelson-Williams C, Carew KS. et al. LRP6 mutation in a family with early coronary disease and metabolic risk factors. Science. 2007;315:1278-82
41. Wittmann J, Jack HM. Serum microRNAs as powerful cancer biomarkers. Biochim Biophys Acta. 2010;1806:200-7
Author contact
![]() Corresponding author: Dao Wen Wang, MD, PhD or Chen Chen, MD, PhD. Department of Internal Medicine, Tongji Hospital, Tongji Medical College, Huazhong University of Science and Technology, 1095# Jiefang Ave., Wuhan, 430030, P. R. China. Tel and Fax: (86-27)8366-3280. E-mail: dwwangtjmu.edu.cn or chenchentjmu.edu.cn
Corresponding author: Dao Wen Wang, MD, PhD or Chen Chen, MD, PhD. Department of Internal Medicine, Tongji Hospital, Tongji Medical College, Huazhong University of Science and Technology, 1095# Jiefang Ave., Wuhan, 430030, P. R. China. Tel and Fax: (86-27)8366-3280. E-mail: dwwangtjmu.edu.cn or chenchentjmu.edu.cn