Impact Factor ISSN: 1449-2288
- Issue 12; 2026
- Issue 11; 2026
- Issue 10; 2026
- Issue 9; 2026
- Issue 8; 2026
- Volume 22; 2026
- Past Issues
- Advance Articles
- Editorial Board
- Cover Images
- Index & Coverage
- Cover Suggestion
- Special Issues
Introduction
MATERIAL AND METHODS
RESULTS
DISCUSSION
Supplementary Material
Acknowledgements
References

 Global reach, higher impact
Int J Biol Sci 2012; 8(6):838-858. doi:10.7150/ijbs.4403 This issue Cite
Research Paper
Quantitative Genomics of 30 Complex Phenotypes in Wagyu x Angus F1 Progeny
Lifan Zhang1,2, Jennifer J. Michal1, James V. O'Fallon1, Zengxiang Pan1,3, Charles T. Gaskins1, Jerry J. Reeves1, Jan R. Busboom1, Xiang Zhou1, Bo Ding1, Michael V. Dodson1, Zhihua Jiang1, ![]()
1. Department of Animal Sciences, Washington State University, Pullman, WA 99164-6351, USA
2. College of Animal Sciences, Zhejiang University, Hangzhou 310029, China
3. College of Animal Sciences and Technology, Nanjing Agricultural University, Nanjing 210095, China
Received 2012-3-26; Accepted 2012-6-4; Published 2012-6-12
Abstract
In the present study, a total of 91 genes involved in various pathways were investigated for their associations with six carcass traits and twenty-four fatty acid composition phenotypes in a Wagyu×Angus reference population, including 43 Wagyu bulls and their potential 791 F1 progeny. Of the 182 SNPs evaluated, 102 SNPs that were in Hardy-Weinberg equilibrium with minor allele frequencies (MAF>0.15) were selected for parentage assignment and association studies with these quantitative traits. The parentage assignment revealed that 40 of 43 Wagyu sires produced over 96.71% of the calves in the population. Linkage disequilibrium analysis identified 75 of 102 SNPs derived from 54 genes as tagged SNPs. After Bonferroni correction, single-marker analysis revealed a total of 113 significant associations between 44 genes and 29 phenotypes (adjusted P<0.05). Multiple-marker analysis confirmed single-gene associations for 10 traits, but revealed two-gene networks for 9 traits and three-gene networks for 8 traits. Particularly, we observed that TNF (tumor necrosis factor) gene is significantly associated with both beef marbling score (P=0.0016) and palmitic acid (C16:0) (P=0.0043), RCAN1 (regulator of calcineurin 1) with rib-eye area (P=0.0103), ASB3 (ankyrin repeat and SOCS box-containing 3) with backfat (P=0.0392), ABCA1 (ATP-binding cassette A1) with both palmitic acid (C16:0) (P=0.0025) and oleic acid (C18:1n9) (P=0.0114), SLC27A1(solute carrier family 27 A1) with oleic acid (C18:1n9) (P=0.0155), CRH (corticotropin releasing hormone) with both linolenic acid (OMEGA-3) (P=0.0200) and OMEGA 6:3 RATIO (P=0.0054), SLC27A2 (solute carrier family 27 A2) with both linoleic acid (OMEGA-6) (P=0.0121) and FAT (P=0.0333), GNG3 (guanine nucleotide binding protein gamma 3 with desaturase 9 (P=0.0115), and EFEMP1 (EGF containing fibulin-like extracellular matrix protein 1), PLTP (phospholipid transfer protein) and DSEL (dermatan sulfate epimerase-like) with conjugated linoleic acid (P=0.0042-0.0044), respectively, in the Wagyu x Angus F1 population. In addition, we observed an interesting phenomenon that crossbreeding of different breeds might change gene actions to dominant and overdominant modes, thus explaining the origin of heterosis. The present study confirmed that these important families or pathway-based genes are useful targets for improving meat quality traits and healthful beef products in cattle.
Keywords: SNPs, muscle growth, fat deposition, fatty acid composition, genetic networks, beef cattle
Introduction
The beef industry is a major component of the U.S. agricultural economy and is worth an estimated $175 billion. Approximately 800,000 ranchers and cattlemen conduct business in all 50 states and contribute economically to nearly every county in the nation (http://www.beefusa.org). For many years, beef was the number one source of protein in American diets. However, the eating habits of American consumers have changed considerably over the last three to four decades [1]. Per capita consumption of beef has fallen from an all-time high of 42.77 Kg in 1976 (American Meat Institute, 2009) to 27.08 Kg in 2010 [2]. As a result, in order to increase consumption and profitability, commercial cow-calf producers must address and find ways to optimize a number of economically important beef quality traits, such as insufficient marbling, low quality grades, inadequate meat tenderness, low curability, inadequate muscling, and excess fat cover [3]. Implementation of technologies and systems that tackle these challenges is essential to reduce costs and enhance productivity of beef production. One of the oldest and most fundamental principles to enable these outcomes is crossbreeding.
Indeed, crossbreeding beef cattle has routinely been a powerful method to improve and/or optimize a number of economically important traits, such as reproduction, growth, maternal ability, and end product quality; which has resulted in reduced costs of production in order to remain competitive in the industry. For example, based on the least square mean estimates from crossbreeding studies published in the literature from 1976 to 1996, Williams and colleagues [4] reported that direct breed effects range from -0.5 ± 0.14 kg (British Dairy) to 10.1 ± 0.46 kg (Continental Beef) for birth weight, from -7.0 ± 0.67 kg (British Dairy) to 29.3 ± 0.74 kg (Simmental) for weaning weight, from -17.9 ± 1.64 kg (Brahman) to 21.6 ± 1.95 kg (Charolais) for postweaning body weight gain, from -6.5 ± 1.29 kg (Brahman) to 55.8 ± 1.47 kg (Continental Beef) for carcass weight, from -8.1 ± 0.48 cm2 (Shorthorn) to 21.0 ± 0.48 cm2 (Continental Beef) for ribeye area and from -1.1 ± 0.02 cm (Continental Beef) to 0 ± 0.00 cm (Angus) for fat thickness, respectively. These results indicate that crossbreeding takes advantage of heterosis and breed complementarities to maximize the productivity and profitability of beef enterprises as compared to purebreeding.
Wagyu beef cattle include the Japanese Black, Japanese Brown, Japanese Poll, and Japanese Shorthorn [5]. In general, Wagyu cattle produce highly marbled beef with high amounts of monounsaturated fatty acids (MUFA) plus a large ribeye area compared with other beef breeds. For example, carcasses of Wagyu sired calves had greater marbling scores (Slightly abundant 771 vs. Modest 594, P = 0.0001), greater intramuscular fat content (12.0% vs. 10.5%, P < 0.02) and greater ribeye area (80.5 cm2 vs. 76.6 cm2, P = 0.08) at the 12th rib than those of Angus [6]. Investigation of fatty acid compositions among 34 sire groups of Wagyu revealed that the mean percentages of MUFA in intramuscular fat ranged from 47.71 to 54.77% [7], while MUFA was only 38.53% in Aberdeen Angus [8].
In our previous study, we reported genetic networks associated with 19 complex phenotypes in a Wagyu x Limousin F2 reference population using a total of 138 genetic polymorphisms derived from 71 known functional genes [9]. These genes are involved in various pathways, such as nuclear encoded mitochondrial genes, the long chain fatty acids uptake gene complex, the sauvagine/corticotropin-releasing factor/urotensin Ι family and related families, the lipogenesis/lipolysis enzymes, calpain/calpasatin or related genes and others. Subsequently, we discovered that the genes from the reverse cholesterol transport pathway as well as the heparin and heparin metabolism pathway are also useful targets for improving meat quality and fatty acid composition in beef cattle [10-11]. In the present study, we tested these previously reported SNPs plus many newly developed SNPs in a Wagyu x Angus F1 reference population measured for six carcass traits and twenty-four fatty acid composition phenotypes and revealed single-gene associations for 10 traits, but revealed two-gene networks for 9 traits and three-gene networks for 8 traits. These results clearly showed that these important families or pathway-based genes are useful targets for improving meat quality traits and healthful beef products in cattle.
MATERIAL AND METHODS
Cattle and phenotypic information
A Wagyu×Angus F1 population was used in the present study, including 43 Wagyu bulls as sires and their 791 potential progeny. Among them, 396 F1 animals were sampled in 2006 and 395 in 2007. This population was jointly developed by Washington State University and Merial Ltd. We focused on a total of 30 phenotypic measurements, which can be classified into two categories: 1) six carcass measurements: hot carcass weight (HCW), ribeye area (REA), backfat (BFT), beef marbling score (BMS), quality grade (QG), and adjusted yield grade (YG), and 2) twenty-four fatty acid composition phenotypes including A) six saturated fatty acids: myristic acid (C14:0), pentadecanoic acid (C15:0), palmitic acid (C16:0), heptadecanoic acid (C17:0), stearic acid (C18:0), and their sum as saturated fatty acids (SFA); B) seven monounsaturated fatty acids: myristoleic (C14:1n5), pentadecanoic (C15:1n5), palmitoleic acid (C16:1n7), heptadecanoic acid (C17:1n7), vaccenic acid (C18:1n7), oleic acid (C18:1n9), and their sum as monounsaturated acids (MUFA); C) four polyunsaturated fatty acids: conjugated linoleic acid (CLA, C18:2c9,t11)), linoleic acid (OMEGA-6), linolenic acid (OMEGA-3) and their sum as polyunsaturated fatty acids (PUFA); D) two trans-fatty acids: trans-vaccenic acid (C18:1n7t) and linolelaidic (C18:2n6t); and E) five traits related to enzyme activities or others: DELTA 9 desaturase (introduces a double bond at the C9 position of a saturated fatty acid), ELONGASE (lengthens a fatty chain by two carbons due to an acetate addition), OMEGA 6:3 RATIO (the ratio of omega 6 fatty acid content to that of omega 3 fatty acid content; the lower this ratio, the better for human nutrition), TRANS (the trans fatty acid content; generally trans fatty acids are detrimental to human health, but notable exceptions are trans vaccenic acid and CLA), and FAT (the Total amount of fat in a beef sample). Methods and procedures to measure these phenotypes were described previously [9, 12].
DNA isolation, SNP panel information and genotyping
DNA from the 43 sires was isolated from blood with the GenElute Blood Genomic DNA kit (Sigma-Aldrich, St. Louis, MO) according to manufacturer's instructions. Muscle and fat tissues were collected from the 791 yearling progeny and DNA was isolated with the GenElute Mammalian Genomic DNA Miniprep kit (Sigma-Aldrich, St. Louis, MO) as directed. A total of 182 mutations, mainly single nucleotide polymorphisms (SNPs) derived from 91 functional genes were included in the present study (Supplementary Material: Table S1). Genotyping was performed using a Sequenom iPLEX assay service provided by the Genomics Center at the University of Minnesota.
Parentage assignment
Based on the genotyping data, we calculated both genotype and allele frequencies in sires and the F1 progeny, but only estimated the allele frequencies in dams as FD(A)=2FP(A) - FS(A) (where FD(A), FP(A), and FS(A) represent the frequencies for the same allele in dams, progeny, and sires, respectively) (Supplementary Material: Table S2). SNPs/mutations that were in Hardy-Weinberg equilibrium and had a minor allele frequency of >0.15 were then selected to form a marker panel for parentage assignments. Paternity was assigned after genotyping data from the offspring were analyzed with the Cervus computer program [13-15]. The Cervus software package uses a likelihood-based approach to compute a probability for a true sire even if genotypes of the dams were unknown. The accurate parentage assignment made it possible to pursue the marker-trait association study using a sire model as described below.
Statistical analyses and genetic evaluation
The HAPLOVIEW program [16] was used to determine the linkage disequilibrium (LD) relationships among 102 markers located on 23 bovine chromosomes (Supplementary Material: Table S2), which lead to selection of tag mutations for further analysis. Comparisons of gene allele and genotype frequencies in each tag SNP were carried out using the chi-squared test of SAS Software for Windows v9.2 (SAS Institute Inc., Gary, NC). The phenotypes REA, BFT, BMS and all fatty acid traits were first tested to ensure that the data were normal random distributions. Association analyses were performed using the PROC MIXED procedure of SAS using the following models:
(1)
(2)
where yijklm or yijklmn is the phenotypic measurement of a quantitative trait for each animal, groupi is the effect of the i-th cattle population (i=1,2), sexj is the effect of the j-th sex category (j=1,2), killdatek is a random effect of the k-th harvest date (j=1,2,…12), siresl is a random effect of the l-th sire producing each animal (l=1,2,…,40), HCW is a covariate, β is the coefficient vector corresponding to the covariate HCW, genotypem represents the effects of each genotype at the related SNP locus, and εijklmn is the residual term pertaining to each animal. P value <0.05 was considered statistically significant after Bonferroni correction. Model (1) using HCW as a covariate was initially tested on each trait, but it was removed in Model (2) when it did not reach statistical significance (P>0.05). In fact, HCW was included as a covariate in the model for association analysis for only REA, BFT and YG. The effect of SNPs genotype on the phenotypic traits QG and adjusted YG was evaluated using the GLIMMIX procedure of SAS. The GLIMMIX procedure can evaluate the unknown distributions using the Quasi-likelihood analysis [17-18]. Because it was hard to identify the exact distribution of the response to variables QG and YG, the GLIMMIX procedure was performed to clarify the analysis using the same statistical model as above.
Finally, we also employed the quantitative trait modes (QTMs) with additive, dominant, and overdominant effects to identify novel genetic networks or gene-gene combined effects related to these 30 traits. Only significant markers that had ≥15 animals in each genotype group were examined for the QTMs followed by linear regression model analysis for selection of genetic networks. This procedure was described previously [9] with minor modifications. Briefly, we classified the single-trait significant associations into three QTMs (additive, dominant, and overdominant mode) based on the pairwise significance tests, and then we integrated these markers along with their QTMs into a linear regression analysis for a given phenotype using the SAS stepwise regression procedure. Akaike's information criterion (AIC) [19] was used to compare different models, each representing a specific genetic network.
RESULTS
Gene and SNP basics
Originally, this set of 182 polymorphic markers was developed on 6 Wagyu x Limousin F1 bulls, genotyped on a Wagyu x Limousin F2 population, and used to determine their associations with 19 quantitative traits [9]. Supplementary Material: Table S1 lists all of these polymorphic markers with their gene symbol, description, chromosome number, genome location, mutation types and pathway/functional category. In brief, these markers were derived from 91 functional known genes, which can be classified into seven gene clusters, plus others. Among them, one gene was selected from BTAs (Bos taurus chromosomes) 5, 8, 13, 20 and 21; two genes from BTAs 4, 9, 17, 24, 26 and 28; three genes from BTAs 3 and 15; four genes from BTAs 6, 7, 10 and 19; five genes from BTAs 2, 11, 14 and 16; seven genes from BTAs 23; eight genes from BTA 1 and 18; and nine genes from BTA 29. Fourteen of these markers were monomorphic in the current population. Among the remaining 168 polymorphic markers, 136 passed the Hardy-Weinberg equilibrium (HWE) test (P>0.05) while 32 failed the test (P<0.05).
Genotype and allele frequencies for these 168 polymorphic markers are listed in Supplementary Material: Table S2. Among 136 markers that passed the HWE test, 38 (27.94%) markers had a fixed allele in one of the parent populations (allele frequency ≥ 0.9). In contrast, among the 32 markers that failed the HWE test, 25 (78.13%) had a fixed allele in either parent (allele frequency ≥ 0.9), including 7 alleles that were fixed in sires and 18 in dams. Ninety of the 136 (66.18%) markers in HWE shared the same minor allele, while the opposite allele was the minor allele in the sire and dam populations in 46 of 136 (33.82%) markers (Supplementary Material: Table S2). Among 32 markers in the parent populations that were not in HWE, the minor allele in 19 (59.38%) markers was the same allele, while the minor allele was the opposite allele in 13 (40.63%) markers (Supplementary Material: Table S2). In addition, 34 of 136 markers were excluded from additional analysis as their minor allele frequencies were 0.15 or less. Therefore, only 102 markers representing 54 known genes were involved in parentage assignment and linkage disequilibrium analysis (Supplementary Material: Table S2).
Parentage assignment in the population
In the present study, the dam's genotypes were not available so the population genetic parameters were computed only from the sires and calves. All the SNP loci had a mean polymorphic information content of 0.3432, and a mean expected heterozygosity of 0.4427. Based on the genotype frequencies for this SNP panel, the mean probability of identity (PI) is the probability that the genotypes at a single locus do not differ between two randomly-chosen individuals [20]. The non-exclusion PI for a combination of 102 SNP markers was 4.06×10-40 for our cattle population, suggesting that the chances of a coincidental genotype match between two randomly-chosen animals were extremely low in the Wagyu x Angus F1 population.
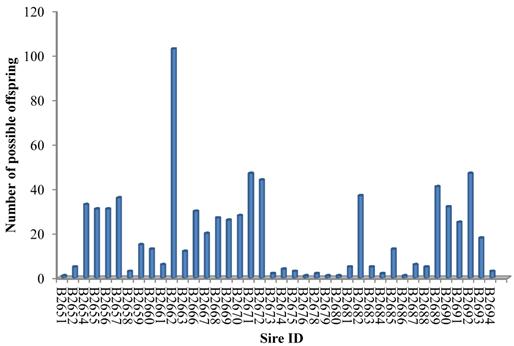
The SNP marker panel was further employed to estimate the power in parentage assignment. For this purpose, both NE-2P and NE-1P were defined as the probability that a random candidate sire would not be excluded from paternity when the dam's genotype was available or not, respectively. Across all loci, we obtained the combined exclusion probability based on NE-1P and NE-2P at every single locus [21]. The combined exclusion probability for the set of loci used in the parentage analysis was high: 0.9999 for the first parent and almost 1 for the second parent, which showed an acceptable high exclusion power for the SNPs marker set to identify genetic paternity in the present study. As a result, 40 of 43 herd sires produced over 765 (96.71%) of the calves in our cattle population (Figure 1), which demonstrated this marker set was highly efficient in paternity assignment.
Paternity assignment of offspring to 40 herd sires.
Single marker - single trait associations and their QTMs
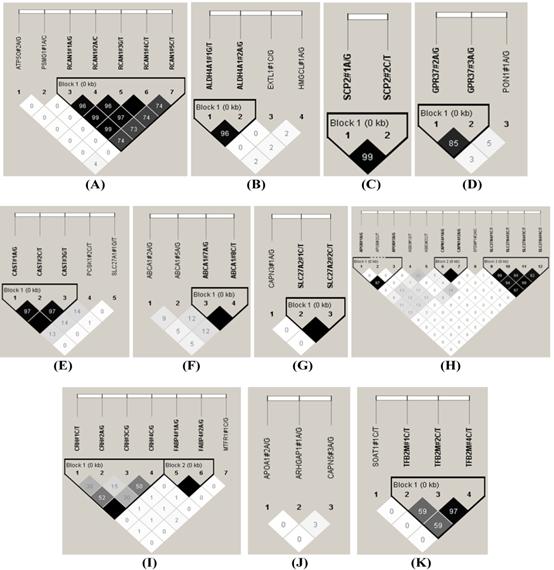
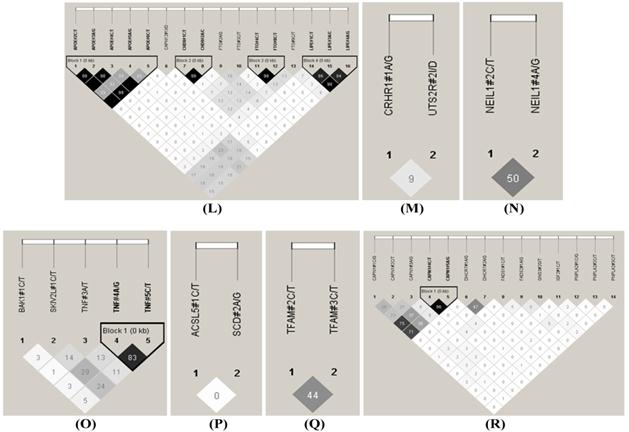
The HAPLOVIEW analysis revealed strong linkage disequilibrium relationships between/among markers in RCAN1 (r2=96-100%), ALDH4A1 (r2=96%), SCP2 (r2=99%), GPR37 (r2=85%), CAST (r2=97%-100%), ABCA1 (r2=100%), SLC27A2 (r2=100%), APOB (r2=97%), CAPN14 (r2=100%), SLC27A4 (r2=92-99%), CRH (r2=100%), FABP4 (r2=100%), TFB2M (r2=97%), APOE (r2=90-100%), CHD9 (r2=99%), FTO (r2=99%), LIPE (r2=84-98%), TNF (r2=83%) and CAPN1 (r2=96%) (Figure 2). Therefore, 75 SNPs of 102 markers (73.53%) in 54 genes were selected as tagged SNPs for the association study with Bonferroni correction (Supplementary Material: Table S2). Carcass traits were recorded on samples collected in both years, while fatty acid profiling was performed only on samples collected in 2007. So after removing samples lacking information on sex and sires as assigned above, 651 animals were used for marker - carcass (6 traits) association analysis and 333 for marker - fatty acid composition (24 phenotypes) association analysis. A total of 142 significant associations were initially discovered (Table 1). Five of them were removed due to ≤ 15 animals in each genotype group and 24 were excluded after the Bonferroni correction. As such, only 113 single marker associations remained with 29 phenotypes, including 2 with BMS, 4 with REA, 1 with BFT, 7 with QG, 7 with YG, 5 with HCW, 7 with C14:0, 5 with C14:1n5, 1 with C15:0, 2 with C15:1n5, 3 with C16:0, 5 with C16:1n7, 3 with C17:0, 3 with C17:1n7, 4 with C18:1n7t, 5 with C18:1n7, 7 with C18:1n9, 1 with C18:2n6t, 5 with MUFA, 4 with PUFA, 4 with SFA, 5 with CLA, 3 with TRANS, 2 with OMEGA-3, 4 with OMEGA-6, 3 with OMEGA 6:3 RATIO, 3 with DELTA9 desaturase, 4 with ELONGASE, and 4 with Total FAT. No markers were discovered to significantly affect C18:0. These 113 single markers - single trait associations can be further classified into three groups according to three quantitative trait modes (QTMs): 9 with additive, 73 with dominant and 31 with overdominant effects (Table 1). One marker can be associated with different phenotypes, but with different QTMs. For example, TNF#3 A/T had an additive effect on BMS but an overdominant effect on YG.
Association of significant SNP markers with 29 economically important traits in beef and marker QTMs*.
| Trait | Marker | N1 | Q | N2 | G | LSM±SE | P | Trait | Marker | N1 | Q | N2 | G | LSM±SE | P | |
|---|---|---|---|---|---|---|---|---|---|---|---|---|---|---|---|---|
| BMS | TNF#3 A/T | 645 | A | 91 | AA | 6.8787±0.2982a | 0.0016 | C18:1n9 | PSMG1#1 A/C | 319 | O | 59 | AA | 42.0533±0.4051ab | 0.0408 | |
| 275 | AT | 7.3723±0.2269a | 179 | AC | 41.6613±0.2997a | |||||||||||
| 279 | TT | 7.8107±0.2254b | 81 | CC | 42.5384±0.3639b | |||||||||||
| BMS | IGF2#1 C/T | 627 | O | 179 | CC | 7.1579±0.2619a | 0.0161 | C18:1n9 | SLC27A1#1 G/T | 318 | D | 112 | GG | 41.3939±0.3434a | 0.0155 | |
| 319 | CT | 7.7362±0.2351b | 151 | GT | 42.3725±0.3033b | |||||||||||
| 129 | TT | 7.5411±0.2744ab | 55 | TT | 42.0665±0.4189ab | |||||||||||
| BMS | ASB3#2 C/T | 640 | 279 | CC | 7.1787±0.2339a | 0.0026 | C18:1n9 | ABCA1#7 A/G | 312 | D | 21 | AA | 40.3968±0.5986a | 0.0114 | ||
| 359 | CT | 7.7674±0.2252b | 113 | AG | 42.2364±0.3162b | |||||||||||
| 2 | TT | 7.7976±1.4338ab | 178 | GG | 42.0831±0.2829b | |||||||||||
| C18:1n9 | SLC27A2#1 C/T | 319 | D | 27 | CC | 43.1295±0.5434a | 0.0370 | |||||||||
| REA | RCAN1#5 C/T | 638 | D | 35 | CC | 12.1809±0.2148a | 0.0103 | 153 | CT | 41.9958±0.3059ab | ||||||
| 480 | CT | 12.7929±0.1056b | 139 | TT | 41.7072±0.3223b | |||||||||||
| 123 | TT | 12.7325±0.1335b | C18:1n9 | EFEMP1#2 A/C | 319 | D | 114 | AA | 42.5363±0.3410a | 0.0178 | ||||||
| REA | CAPN12#1 I/D | 631 | O | 67 | II | 12.4514±0.1690a | 0.0099 | 189 | AC | 41.6884±0.3029b | ||||||
| 318 | IT | 12.8552±0.1136b | 16 | CC | 41.6262±0.7182ab | |||||||||||
| 246 | DD | 12.6783±0.1192ab | C18:1n9 | TFB2M#2 C/T | 310 | O | 93 | CC | 41.4395±0.3801a | 0.0365 | ||||||
| REA | LIPE#1 C/T | 638 | D | 26 | CC | 12.1830±0.2351a | 0.0177 | 164 | CT | 42.3131±0.3278b | ||||||
| 390 | CT | 12.7352±0.1085b | 53 | TT | 41.8789±0.4467ab | |||||||||||
| 222 | TT | 12.8310±0.1180b | C18:1n9 | DSEL#1 C/T | 320 | D | 112 | CC | 42.5322±0.3452a | 0.0343 | ||||||
| REA | CRHR1#1 A/G | 633 | D | 177 | AA | 12.7084±0.1286ab | 0.0391 | 148 | CT | 41.7321±0.3142b | ||||||
| 375 | AG | 12.8158±0.1145a | 60 | TT | 41.6584±0.4147ab | |||||||||||
| 81 | GG | 12.4796±0.1630b | ||||||||||||||
| REA | MTFR1#1 C/G | 646 | 146 | CC | 12.5158±0.1446a | 0.0474 | C18:1n7 | APOB#2 C/T | 323 | O | 40 | CC | 3.7696±0.2295ab | 0.0019 | ||
| 344 | CG | 12.8117±0.1172a | 225 | CT | 4.0884±0.1738a | |||||||||||
| 156 | GG | 12.8551±0.1429a | 58 | TT | 3.5692±0.2110b | |||||||||||
| C18:1n7 | UTS2R#2 I/D | 325 | O | 142 | II | 3.7433±0.1841a | 0.0031 | |||||||||
| BFT | ASB3#1 G/T | 640 | O | 243 | GG | 0.7173±0.0198a | 0.0392 | 156 | ID | 4.1578±0.1828b | ||||||
| 314 | GT | 0.7582±0.0189b | 27 | DD | 3.8438±0.2665ab | |||||||||||
| 83 | TT | 0.7334±0.0260ab | C18:1n7 | TFAM#3 C/T | 325 | O | 107 | CC | 3.7562±0.1917a | 0.0134 | ||||||
| BFT | ALDH4A1#1 G/T | 632 | 80 | GG | 0.7750±0.0263a | 0.0328 | 173 | CT | 4.1117±0.1819b | |||||||
| 301 | GT | 0.7500±0.0192a | 45 | TT | 3.7999±0.2295ab | |||||||||||
| 251 | TT | 0.7162±0.0199a | C18:1n7 | CAPN1#1 C/G | 323 | D | 128 | CC | 3.8201±0.1940a | 0.0106 | ||||||
| 161 | CG | 3.9166±0.1847a | ||||||||||||||
| QG | RCAN1#5 C/T | 511 | D | 30 | CC | 13.0899±0.1661a | 0.0000 | 34 | GG | 4.4702±0.2481b | ||||||
| 385 | CT | 13.8295±0.0728b | C18:1n7 | CAPN1#5 A/G | 325 | D | 50 | AA | 4.3967±0.2243a | 0.0021 | ||||||
| 96 | TT | 13.7488±0.1073b | 169 | AG | 3.9420±0.1840b | |||||||||||
| QG | ALDH4A1#1 G/T | 508 | D | 58 | GG | 13.4378±0.1277a | 0.0115 | 106 | GG | 3.7302±0.1974b | ||||||
| 238 | GT | 13.8031±0.0801b | C18:1n7 | CRH#3 C/G | 323 | 34 | CC | 3.6775±0.2460a | 0.0177 | |||||||
| 212 | TT | 13.8215±0.0837b | 188 | CG | 4.1050±0.1834a | |||||||||||
| QG | LRPAP1#1 C/T | 514 | D | 81 | CC | 13.4919±0.1144a | 0.0113 | 101 | GG | 3.7931±0.1969a | ||||||
| 222 | CT | 13.7745±0.0822b | C18:1n7 | SKIV2L#1 C/T | 324 | 84 | CC | 3.8167±0.2103a | 0.0381 | |||||||
| 211 | TT | 13.8506±0.0838b | 157 | CT | 3.8763±0.1857a | |||||||||||
| QG | CAST#2 C/T | 518 | D | 39 | CC | 13.4334±0.1500a | 0.0394 | 83 | TT | 4.2204±0.2047a | ||||||
| 235 | CT | 13.8189±0.0828b | ||||||||||||||
| 244 | TT | 13.7859±0.0826ab | C18:2n6t | LIPE#1 C/T | 318 | A | 15 | CC | 0.3460±0.0221ab | 0.0131 | ||||||
| QG | FTO#3 C/T | 509 | O | 186 | CC | 13.6188±0.0869a | 0.0021 | 191 | CT | 0.3714±0.0097a | ||||||
| 259 | CT | 13.9097±0.0812b | 112 | TT | 0.3946±0.0106b | |||||||||||
| 64 | TT | 13.6592±0.1277ab | C18:2n6t | SCP2#1 A/G | 318 | 14 | AA | 0.3443±0.0226a | 0.0466 | |||||||
| QG | TNF#3 A/T | 517 | D | 66 | AA | 13.4994±0.1190a | 0.0290 | 139 | AG | 0.3899±0.0111a | ||||||
| 217 | AT | 13.7684±0.0797ab | 165 | GG | 0.3739±0.0106a | |||||||||||
| 234 | TT | 13.8300±0.0779b | ||||||||||||||
| QG | DHCR7#2 A/G | 523 | D | 216 | AA | 13.8381±0.0808a | 0.0001 | MUFA | PSMG1#1 A/C | 318 | O | 60 | AA | 51.3753±0.4676ab | 0.0157 | |
| 289 | AG | 13.7733±0.0743a | 177 | AC | 50.8816±0.3788a | |||||||||||
| 18 | GG | 12.9737±0.1990b | 81 | CC | 51.9133±0.4335b | |||||||||||
| MUFA | SLC27A1#1 G/T | 317 | D | 109 | GG | 50.5009±0.3992a | 0.0027 | |||||||||
| YG | HMGCL#1 A/G | 641 | D | 16 | AA | 4.0484±0.2350ab | 0.0196 | 153 | GT | 51.7196±0.3588b | ||||||
| 301 | AG | 3.8261±0.0876a | 55 | TT | 51.5203±0.4676ab | |||||||||||
| 324 | GG | 3.6885±0.0852b | MUFA | ABCA1#7 A/G | 312 | D | 22 | AA | 49.6734±0.6498a | 0.0077 | ||||||
| YG | APOB#2 C/T | 634 | D | 84 | CC | 3.5764±0.1027a | 0.0105 | 112 | AG | 51.6650±0.4002b | ||||||
| 449 | CT | 3.7860±0.0859b | 178 | GG | 51.3120±0.3709b | |||||||||||
| 101 | TT | 3.8064±0.1161ab | MUFA | SLC27A2#1 C/T | 318 | D | 27 | CC | 53.0719±0.5922a | 0.0006 | ||||||
| YG | ASB3#1 G/T | 634 | D | 240 | GG | 3.6712±0.0903a | 0.0325 | 151 | CT | 51.2234±0.3751b | ||||||
| 313 | GT | 3.8266±0.0888b | 140 | TT | 50.8665±0.3894b | |||||||||||
| 81 | TT | 3.7972±0.1118ab | MUFA | DSEL#1 C/T | 319 | D | 109 | CC | 51.9722±0.4281a | 0.0073 | ||||||
| YG | CAPN5#3 A/G | 622 | D | 328 | AA | 3.8131±0.0878a | 0.0088 | 150 | CT | 50.9171±0.3970b | ||||||
| 248 | AG | 3.7282±0.0893ab | 60 | TT | 51.0153±0.4871ab | |||||||||||
| 46 | GG | 3.5111±0.1161b | ||||||||||||||
| YG | FTO#8 C/T | 633 | O | 301 | CC | 3.8695±0.0911a | 0.0045 | PUFA | ABCA1#7 A/G | 313 | O | 21 | AA | 2.2766±0.1008ab | 0.0437 | |
| 289 | CT | 3.6587±0.0882b | 113 | AG | 2.2167±0.0640a | |||||||||||
| 43 | TT | 3.7323±0.1290ab | 179 | GG | 2.3371±0.0597b | |||||||||||
| YG | TNF#3 A/T | 638 | O | 91 | AA | 3.7494±0.1172ab | 0.0010 | PUFA | SLC27A2#1 C/T | 320 | A | 27 | CC | 2.1306±0.0912a | 0.0074 | |
| 270 | AT | 3.8957±0.0961a | 151 | CT | 2.2743±0.0598ab | |||||||||||
| 277 | TT | 3.6626±0.0939b | 142 | TT | 2.3712±0.0617b | |||||||||||
| YG | TFAM#3 C/T | 620 | D | 223 | CC | 3.7472±0.0912a | 0.0211 | PUFA | CRHR1#1 A/G | 320 | O | 92 | AA | 2.2585±0.0673ab | 0.0138 | |
| 314 | CT | 3.7378±0.0886a | 185 | AG | 2.3356±0.0606a | |||||||||||
| 84 | TT | 4.0105±0.1219b | 43 | GG | 2.1458±0.0817b | |||||||||||
| YG | LIPE#1 C/T | 636 | 26 | CC | 4.1643±0.2051a | 0.0373 | PUFA | SKIV2L#1 C/T | 320 | O | 82 | CC | 2.1987±0.0658a | 0.0326 | ||
| 387 | CT | 3.7795±0.0856a | 155 | CT | 2.3415±0.0582b | |||||||||||
| 223 | TT | 3.6978±0.0897a | 83 | TT | 2.2875±0.0661ab | |||||||||||
| HCW | SLC27A4#2 C/T | 647 | D | 252 | CC | 878.59±13.6600a | 0.0305 | SFA | SLC27A1#1 G/T | 319 | D | 113 | GG | 39.5921±0.2330a | 0.0031 | |
| 315 | CT | 862.85±13.4855b | 152 | GT | 38.7575±0.2001b | |||||||||||
| 80 | TT | 864.63±15.2369ab | 54 | TT | 38.6805±0.2996b | |||||||||||
| HCW | TFB2M#1 C/T | 641 | D | 238 | CC | 880.55±13.5547a | 0.0219 | SFA | ABCA1#2 A/G | 311 | D | 32 | AA | 39.8422±0.3693a | 0.0409 | |
| 301 | CT | 863.69±13.2943b | 159 | AG | 39.0961±0.2092ab | |||||||||||
| 101 | TT | 864.28±14.6212ab | 120 | GG | 38.8307±0.2247b | |||||||||||
| HCW | TFB2M#2 C/T | 621 | A | 174 | CC | 858.94±13.6556a | 0.0238 | SFA | ABCA1#7 A/G | 313 | D | 22 | AA | 40.0681±0.4352a | 0.0225 | |
| 303 | CT | 870.08±13.1404ab | 114 | AG | 39.1215±0.2295ab | |||||||||||
| 144 | TT | 881.75±13.8614b | 177 | GG | 38.8523±0.2070b | |||||||||||
| HCW | CAPN12#1 I/D | 632 | A | 67 | II | 851.09±14.4969a | 0.0319 | SFA | DSEL#1 C/T | 321 | D | 113 | CC | 38.5723±0.2402a | 0.0106 | |
| 318 | ID | 867.39±11.8914ab | 147 | CT | 39.2817±0.2116b | |||||||||||
| 247 | DD | 877.37±12.1458b | 61 | TT | 39.3180±0.2928ab | |||||||||||
| HCW | TNF#3 A/T | 645 | D | 91 | AA | 877.20±14.7955ab | 0.0087 | SFA | TFAM#2 C/T | 321 | 48 | CC | 39.3908±0.3172a | 0.0471 | ||
| 275 | AT | 877.88±13.1753a | 167 | CT | 38.7811±0.2107a | |||||||||||
| 279 | TT | 858.85±13.1555b | 106 | TT | 39.2679±0.2393a | |||||||||||
| HCW | APOE#4 C/T | 641 | 35 | CC | 884.74±18.1782a | 0.0438 | ||||||||||
| 394 | CT | 872.78±13.2659a | CLA | CAST#2 C/T | 318 | D | 24 | CC | 0.9573±0.0205a | 0.0446 | ||||||
| 212 | TT | 859.50±13.7205a | 132 | CT | 0.9047±0.0104b | |||||||||||
| 162 | TT | 0.9060±0.0100ab | ||||||||||||||
| C14:0 | CAST#2 C/T | 315 | D | 23 | CC | 3.3057±0.0975a | 0.0328 | CLA | TFB1M#1 G/T | 323 | O | 29 | GG | 0.9139±0.0193ab | 0.0218 | |
| 132 | CT | 3.0755±0.0656b | 132 | GT | 0.8907±0.0101a | |||||||||||
| 160 | TT | 3.1194±0.0650ab | 162 | TT | 0.9229±0.0097b | |||||||||||
| C14:0 | ABCA1#7 A/G | 313 | D | 21 | AA | 3.3618±0.1024a | 0.0048 | CLA | EFEMP1#2 A/C | 324 | D | 114 | AA | 0.8851±0.0113a | 0.0042 | |
| 114 | AG | 3.1401±0.0666ab | 194 | AC | 0.9221±0.0096b | |||||||||||
| 178 | GG | 3.0657±0.0631b | 16 | CC | 0.9246±0.0260ab | |||||||||||
| C14:0 | CAPN14#2 A/G | 317 | D | 116 | AA | 3.2001±0.0648a | 0.0166 | CLA | PLTP#2 C/T | 315 | O | 82 | CC | 0.8858±0.0135a | 0.0042 | |
| 171 | AG | 3.0594±0.0620b | 164 | CT | 0.9282±0.0108b | |||||||||||
| 30 | GG | 3.0849±0.0894ab | 69 | TT | 0.9009±0.0145ab | |||||||||||
| C14:0 | EFEMP1#2 A/C | 320 | A | 112 | AA | 3.0373±0.0672a | 0.0283 | CLA | DSEL#1 C/T | 325 | D | 114 | CC | 0.8836±0.0109a | 0.0044 | |
| 192 | AC | 3.1516±0.0622b | 150 | CT | 0.9226±0.0096b | |||||||||||
| 16 | CC | 3.2244±0.1173ab | 61 | TT | 0.9216±0.0139b | |||||||||||
| C14:0 | CRHR1#1 A/G | 321 | D | 92 | AA | 3.1463±0.0693a | 0.0177 | CLA | ABCA1#7 A/G | 317 | 22 | AA | 0.9436±0.0218a | 0.0222 | ||
| 185 | AG | 3.1372±0.0623a | 115 | AG | 0.9226±0.0111a | |||||||||||
| 44 | GG | 2.9411±0.0864b | 180 | GG | 0.8959±0.0098a | |||||||||||
| C14:0 | TNF#3 A/T | 320 | D | 45 | AA | 3.2604±0.0859a | 0.0100 | CLA | ASB3#1 G/T | 324 | 128 | GG | 0.8916±0.0105a | 0.0459 | ||
| 131 | AT | 3.0575±0.0670b | 154 | GT | 0.9196±0.0097a | |||||||||||
| 144 | TT | 3.1329±0.0671ab | 42 | TT | 0.9213±0.0163a | |||||||||||
| C14:0 | CAPN1#3 A/G | 321 | O | 29 | AA | 3.1482±0.0943ab | 0.0070 | |||||||||
| 159 | AG | 3.0336±0.0665a | TRANS | ABCA1#7 A/G | 313 | O | 21 | AA | 6.0375±0.3813ab | 0.0251 | ||||||
| 133 | GG | 3.2002±0.0677b | 114 | AG | 5.3747±0.2552a | |||||||||||
| C14:0 | APOB#2 C/T | 319 | 40 | CC | 3.0372±0.0834a | 0.0362 | 178 | GG | 5.8040±0.2434b | |||||||
| 221 | CT | 3.0915±0.0614a | TRANS | SLC27A2#1 C/T | 319 | D | 27 | CC | 4.9060±0.3362a | 0.0040 | ||||||
| 58 | TT | 3.2444±0.0791a | 151 | CT | 5.6774±0.2302b | |||||||||||
| 141 | TT | 5.9110±0.2376b | ||||||||||||||
| C14:1n5 | ALDH4A1#1 G/T | 313 | D | 47 | GG | 1.0792±0.1100a | 0.0387 | TRANS | FADS2#1 A/G | 320 | D | 115 | AA | 5.4532±0.2449a | 0.0008 | |
| 149 | GT | 1.2297±0.1012b | 167 | AG | 5.6051±0.2289a | |||||||||||
| 117 | TT | 1.2131±0.1023ab | 38 | GG | 6.4917±0.3106b | |||||||||||
| C14:1n5 | PCSK1#2 C/T | 322 | O | 75 | CC | 1.1089±0.1014a | 0.0450 | TRANS | SLC27A1#1 G/T | 318 | 112 | GG | 5.8670±0.2590a | 0.0492 | ||
| 194 | CT | 1.2299±0.0963b | 151 | GT | 5.4910±0.2416a | |||||||||||
| 53 | TT | 1.1715±0.1050ab | 55 | TT | 5.9031±0.2904a | |||||||||||
| C14:1n5 | ABCA1#7 A/G | 316 | D | 22 | AA | 1.2685±0.1214ab | 0.0066 | TRANS | APOA1#2 A/G | 311 | 3 | AA | 7.2593±0.8453a | 0.0308 | ||
| 115 | AG | 1.2682±0.1001a | 94 | AG | 5.4303±0.2611a | |||||||||||
| 179 | GG | 1.1374±0.0980b | 214 | GG | 5.7376±0.2382a | |||||||||||
| C14:1n5 | SLC27A2#1 C/T | 323 | D | 27 | CC | 1.3524±0.1145a | 0.0153 | |||||||||
| 153 | CT | 1.1987±0.0960ab | OMEGA-3 | CRH#3 C/G | 315 | O | 30 | CC | 0.1316±0.0090a | 0.0200 | ||||||
| 143 | TT | 1.1385±0.0971b | 185 | CG | 0.1115±0.0061b | |||||||||||
| C14:1n5 | ACSL5#1 C/T | 323 | O | 123 | CC | 1.1735±0.0990ab | 0.0413 | 100 | GG | 0.1207±0.0067ab | ||||||
| 149 | CT | 1.2390±0.0982a | OMEGA-3 | IGF2#1 C/T | 310 | O | 82 | CC | 0.1268±0.0072a | 0.0347 | ||||||
| 51 | TT | 1.1005±0.1065b | 173 | CT | 0.1121±0.0062b | |||||||||||
| C14:1n5 | SCD1#2 A/G | 314 | 14 | AA | 1.0891±0.1357a | 0.0463 | 55 | TT | 0.1191±0.0077ab | |||||||
| 134 | AG | 1.1478±0.1001a | OMEGA-3 | TFB2M#1 C/T | 317 | 157 | CC | 0.1115±0.0066a | 0.0179 | |||||||
| 166 | GG | 1.2442±0.0994a | 108 | CT | 0.1227±0.0061a | |||||||||||
| 52 | TT | 0.1072±0.0079a | ||||||||||||||
| C15:0 | SLC27A1#1 G/T | 321 | D | 112 | GG | 0.7055±0.0198a | 0.0195 | |||||||||
| 154 | GT | 0.6708±0.0188b | OMEGA-6 | ABCA1#7 A/G | 315 | O | 21 | AA | 2.1607±0.1009ab | 0.0466 | ||||||
| 55 | TT | 0.6718±0.0216ab | 114 | AG | 2.1045±0.0648a | |||||||||||
| 180 | GG | 2.2222±0.0607b | ||||||||||||||
| C15:1n5 | TFB2M#1 C/T | 321 | D | 110 | CC | 0.0939±0.0026a | 0.0109 | OMEGA-6 | SLC27A2#1 C/T | 322 | A | 27 | CC | 2.0325±0.0916a | 0.0121 | |
| 158 | CT | 0.1014±0.0023b | 152 | CT | 2.1577±0.0610ab | |||||||||||
| 53 | TT | 0.1032±0.0035b | 143 | TT | 2.2533±0.0627b | |||||||||||
| C15:1n5 | TNF#3 A/T | 320 | D | 45 | AA | 0.0964±0.0036ab | 0.0156 | OMEGA-6 | CRHR1#1 A/G | 322 | O | 93 | AA | 2.1480±0.0679ab | 0.0253 | |
| 130 | AT | 0.0953±0.0023a | 185 | AG | 2.2158±0.0616a | |||||||||||
| 145 | TT | 0.1029±0.0023b | 44 | GG | 2.0416±0.0816b | |||||||||||
| OMEGA-6 | SKIV2L#1 C/T | 322 | D | 83 | CC | 2.0891±0.0667a | 0.0436 | |||||||||
| C16:0 | ABCA1#7 A/G | 317 | D | 22 | AA | 25.0129±0.4259a | 0.0025 | 156 | CT | 2.2233±0.0596b | ||||||
| 115 | AG | 24.1660±0.2849ab | 83 | TT | 2.1710±0.0672ab | |||||||||||
| 180 | GG | 23.7658±0.2708b | OMEGA-6 | RCAN1#6 C/T | 321 | 14 | CC | 1.9818±0.1195a | 0.0257 | |||||||
| C16:0 | PLTP#2 C/T | 315 | O | 82 | CC | 23.8683±0.3162ab | 0.0055 | 249 | CT | 2.2078±0.0567a | ||||||
| 164 | CT | 24.2921±0.2838a | 58 | TT | 2.0942±0.0729a | |||||||||||
| 69 | TT | 23.5817±0.3302b | ||||||||||||||
| C16:0 | TNF#3 A/T | 324 | D | 45 | AA | 24.7247±0.3603a | 0.0043 | OMEGA-6:3 | CRH#3 C/G | 315 | D | 33 | CC | 16.6578±1.5585a | 0.0054 | |
| 132 | AT | 23.7729±0.2772b | 182 | CG | 21.0695±1.0786b | |||||||||||
| 147 | TT | 24.0488±0.2768ab | 100 | GG | 20.2472±1.1780b | |||||||||||
| C16:0 | LRPAP1#1 C/T | 321 | 45 | CC | 23.9383±0.3487a | 0.0450 | OMEGA-6:3 | TFB2M#1 C/T | 317 | O | 109 | CC | 21.0956±1.1514ab | 0.0015 | ||
| 152 | CT | 24.2678±0.2752a | 156 | CT | 19.0225±1.0867a | |||||||||||
| 124 | TT | 23.7613±0.2793a | 52 | TT | 22.8876±1.3706b | |||||||||||
| OMEGA-6:3 | PNPLA2#1 C/G | 315 | D | 83 | CC | 20.0462±1.1625ab | 0.0272 | |||||||||
| C16:1n7 | ABCA1#7 A/G | 317 | A | 22 | AA | 3.0133±0.0670a | 0.0162 | 163 | CG | 19.6211±1.0328a | ||||||
| 115 | AG | 2.9232±0.0338ab | 67 | GG | 22.3840±1.2291b | |||||||||||
| 180 | GG | 2.8456±0.0299b | OMEGA-6:3 | CRH#2 A/G | 316 | 13 | AA | 20.6608±2.1540ab | 0.0336 | |||||||
| C16:1n7 | ASB3#1 G/T | 324 | D | 128 | GG | 2.8265±0.0322a | 0.0266 | 100 | AG | 21.8716±1.1010a | ||||||
| 154 | GT | 2.9231±0.0293b | 203 | GG | 19.6002±0.9859b | |||||||||||
| 42 | TT | 2.9165±0.0498ab | OMEGA-6:3 | IGF2#1 C/T | 309 | 85 | CC | 19.1924±1.1687a | 0.0411 | |||||||
| C16:1n7 | EFEMP1#2 A/C | 324 | D | 114 | AA | 2.8193±0.0340a | 0.0121 | 169 | CT | 21.2254±1.0191a | ||||||
| 194 | AC | 2.9221±0.0287b | 55 | TT | 19.0672±1.2844a | |||||||||||
| 16 | CC | 2.9301±0.0804ab | ||||||||||||||
| C16:1n7 | PLTP#2 C/T | 315 | O | 82 | CC | 2.8119±0.0406a | 0.0012 | DELTA9 | SLC27A2#1 C/T | 320 | D | 26 | CC | 83.2946±0.7098a | 0.0189 | |
| 164 | CT | 2.9526±0.0322b | 152 | CT | 81.9178±0.4681ab | |||||||||||
| 69 | TT | 2.8539±0.0440ab | 142 | TT | 81.4771±0.4825b | |||||||||||
| C16:1n7 | DSEL#1 C/T | 325 | D | 114 | CC | 2.8138±0.0336a | 0.0112 | DELTA9 | TFB2M#1 C/T | 321 | D | 110 | CC | 82.5440±0.5159a | 0.0255 | |
| 150 | CT | 2.9224±0.0294b | 159 | CT | 81.5615±0.4769b | |||||||||||
| 61 | TT | 2.9243±0.0428ab | 52 | TT | 81.4223±0.6053ab | |||||||||||
| C16:1n7 | TFB1M#1 G/T | 323 | 29 | GG | 2.9296±0.0596a | 0.0337 | DELTA9 | GNG3#2 G/T | 313 | A | 24 | GG | 80.7177±0.7156a | 0.0115 | ||
| 132 | GT | 2.8319±0.0307a | 140 | GT | 81.4788±0.4522ab | |||||||||||
| 162 | TT | 2.9197±0.0298a | 149 | TT | 82.3947±0.4532b | |||||||||||
| DELTA9 | SLC27A1#1 G/T | 319 | 113 | GG | 81.2776±0.4968a | 0.0482 | ||||||||||
| C17:0 | ABCA1#7 A/G | 312 | D | 22 | AA | 1.7990±0.0850a | 0.0326 | 152 | GT | 82.0319±0.4607a | ||||||
| 114 | AG | 1.9288±0.0637ab | 54 | TT | 82.5316±0.5732a | |||||||||||
| 176 | GG | 1.9730±0.0616b | DELTA9 | APOE#5 A/G | 313 | 29 | AA | 82.4964±0.6825a | 0.0316 | |||||||
| C17:0 | CAPN12#1 I/D | 316 | D | 35 | II | 2.1017±0.0766a | 0.0049 | 181 | AG | 81.4557±0.4722a | ||||||
| 166 | ID | 1.9263±0.0599b | 103 | GG | 82.3526±0.5136a | |||||||||||
| 115 | DD | 1.9058±0.0626b | ||||||||||||||
| C17:0 | FADS2#1 A/G | 320 | D | 114 | AA | 1.9479±0.0631ab | 0.0253 | ELONGASE | ABCA1#7 A/G | 317 | D | 22 | AA | 63.7281±0.6657a | 0.0020 | |
| 169 | AG | 1.9128±0.0602a | 115 | AG | 65.3718±0.4377b | |||||||||||
| 37 | GG | 2.0617±0.0749b | 180 | GG | 65.8435±0.4146b | |||||||||||
| C17:0 | SCD#2 A/G | 310 | 14 | AA | 2.1306±0.0976a | 0.0389 | ELONGASE | EFEMP1#2 A/C | 324 | D | 114 | AA | 66.0452±0.4422a | 0.0210 | ||
| 132 | AG | 1.9519±0.0623ab | 194 | AC | 65.2039±0.4098b | |||||||||||
| 164 | GG | 1.9152±0.0614b | 16 | CC | 65.2053±0.7816ab | |||||||||||
| ELONGASE | PLTP#2 C/T | 315 | O | 82 | CC | 65.7275±0.4940ab | 0.0044 | |||||||||
| C17:1n7 | FABP4#1 A/G | 317 | O | 60 | AA | 1.3475±0.0470a | 0.0415 | 164 | CT | 65.0435±0.4422a | ||||||
| 174 | AG | 1.2727±0.0416b | 69 | TT | 66.1899±0.5160b | |||||||||||
| 83 | GG | 1.3054±0.0445ab | ELONGASE | TNF#3 A/T | 324 | D | 45 | AA | 64.5268±0.5653a | 0.0192 | ||||||
| C17:1n7 | CAPN12#1 I/D | 320 | D | 35 | II | 1.3838±0.0527a | 0.0209 | 132 | AT | 65.8124±0.4316b | ||||||
| 168 | ID | 1.2905±0.0416b | 147 | TT | 65.4346±0.4309ab | |||||||||||
| 117 | DD | 1.2681±0.0433b | ELONGASE | TFB1M#1 G/T | 323 | 29 | GG | 65.2667±0.6134a | 0.0440 | |||||||
| C17:1n7 | FADS2#1 A/G | 324 | D | 115 | AA | 1.2992±0.0433ab | 0.0206 | 132 | GT | 65.9508±0.4165a | ||||||
| 171 | AG | 1.2735±0.0414a | 162 | TT | 65.1806±0.4165a | |||||||||||
| 38 | GG | 1.3759±0.0511b | ELONGASE | DSEL#1 C/T | 325 | 114 | CC | 66.0345±0.4416a | 0.0420 | |||||||
| C17:1n7 | SCD#2 A/G | 314 | 14 | AA | 1.4237±0.0666a | 0.0168 | 150 | CT | 65.2389±0.4138a | |||||||
| 135 | AG | 1.3095±0.0432ab | 61 | TT | 65.1955±0.4981a | |||||||||||
| 165 | GG | 1.2677±0.0427b | ||||||||||||||
| FAT | PCSK1#2 C/T | 319 | D | 75 | CC | 81.0719±2.4719ab | 0.0325 | |||||||||
| C18:1n7t | ABCA1#2 A/G | 310 | D | 30 | AA | 4.6378±0.3285a | 0.0250 | 191 | CT | 80.3735±2.4141a | ||||||
| 162 | AG | 5.1515±0.2346ab | 53 | TT | 82.8640±2.5188b | |||||||||||
| 118 | GG | 5.4210±0.2413b | FAT | SLC27A2#1 C/T | 320 | D | 26 | CC | 78.1833±2.6485a | 0.0333 | ||||||
| C18:1n7t | ABCA1#7 A/G | 312 | O | 20 | AA | 5.4669±0.3725ab | 0.0398 | 153 | CT | 80.8826±2.4034ab | ||||||
| 114 | AG | 4.9779±0.2441a | 141 | TT | 81.6011±2.4143b | |||||||||||
| 178 | GG | 5.3914±0.2327b | FAT | CAPN1#2 C/T | 312 | D | 141 | CC | 80.2166±2.4515a | 0.0117 | ||||||
| C18:1n7t | SLC27A2#1 C/T | 318 | D | 27 | CC | 4.5148±0.3209a | 0.0054 | 145 | CT | 81.4189±2.4505ab | ||||||
| 151 | CT | 5.2744±0.2178b | 26 | TT | 83.9212±2.6843b | |||||||||||
| 140 | TT | 5.4578±0.2256b | FAT | PNPLA2#3 C/T | 317 | D | 64 | CC | 82.8295±2.5200a | 0.0128 | ||||||
| C18:1n7t | FADS2#1 A/G | 319 | D | 114 | AA | 5.0141±0.2305a | 0.0003 | 160 | CT | 80.6430±2.4508b | ||||||
| 167 | AG | 5.1991±0.2142a | 93 | TT | 79.9845±2.4870b | |||||||||||
| 38 | GG | 6.0840±0.2936b | FAT | TNF#5 C/T | 319 | 197 | CC | 81.0481±2.4115a | 0.0265 | |||||||
| C18:1n7t | APOA1#2 A/G | 310 | 3 | AA | 6.8097±0.8099a | 0.0246 | 120 | CT | 80.9194±2.4464a | |||||||
| 94 | AG | 5.0101±0.2476a | 2 | TT | 69.2402±4.9516b | |||||||||||
| 213 | GG | 5.3177±0.2255a | FAT | CAPN1#1 C/G | 319 | 127 | CC | 81.9978±2.4602a | 0.0459 | |||||||
| 158 | CG | 80.4552±2.4445a | ||||||||||||||
| 34 | GG | 79.6255±2.6184a |
*The different lowercase letters between different genotypes within the same marker indicate that the difference reached the significance level of P<0.05, while the same letters between genotypes show no significant difference (P>0.05). A, D and O represent additive, dominant and overdominant effects in the QTMs analysis respectively. The markers that do not show any significance among different genotypes after Bonferroni correction are underlined. The significant markers that have ≤ 15 animals in each genotype group are italicized.
Q = QTMs; G=Genotypes
Linkage disequilibrium analysis for markers in 49 genes. Pairwise linkage disequilibrium relationships for these SNPs are based on r2 measurements. A-R represent BTA 1, 2, 3, 4, 7, 8, 10, 11, 14, 15, 16, 18, 19, 21, 23, 26, 28 and 29, respectively.
Multiple markers-single trait regressions for different genetic networks
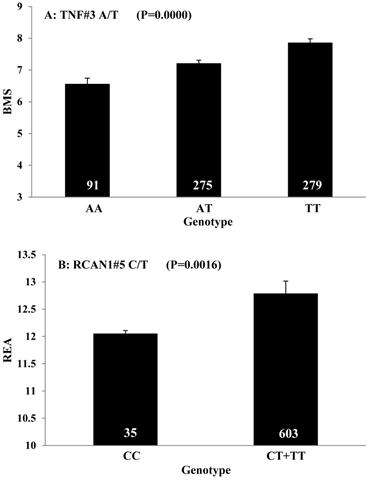
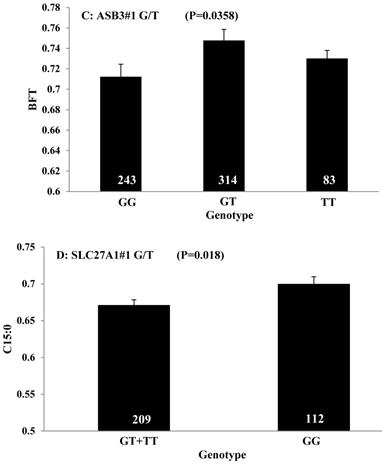
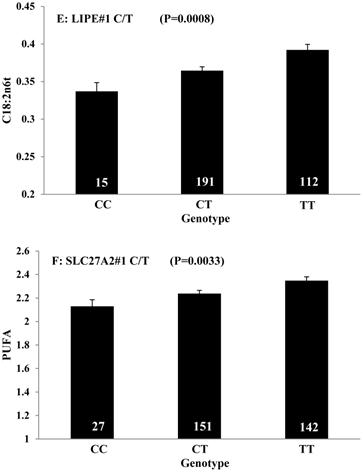
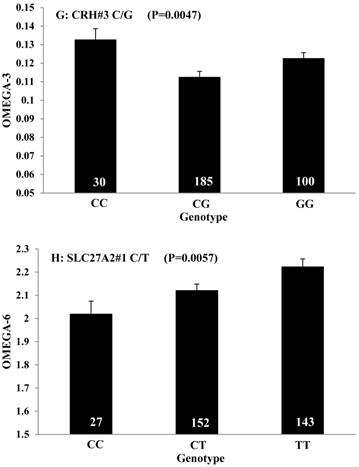
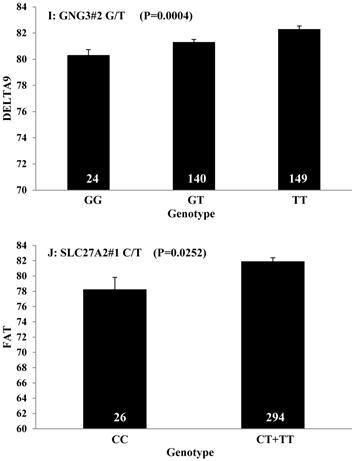
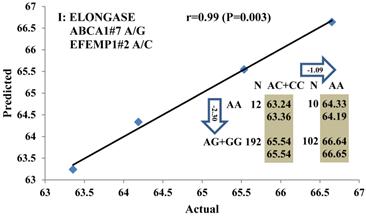
All significant single-marker associations related to each trait along with their QTMs were then involved in a linear regression model analysis to determine genetic networks. Single-trait associations with QG and adjusted YG were excluded because of the non-normal distributions in these two measurements. Based on the lowest AIC values and correlation coefficients (r) >0.8 between predicted and real genotype values, the regression analysis revealed the best single-gene associations for BMS, REA, BFT, C15:0, C18:2n6t, PUFA, OMEGA-3, OMEGA-6, DELTA9 desaturase, and Total Fat (Figure 3); the best two-gene networks for C14:1n5, C15:1n5, C16:0, C17:0, C17:1n7, C18:1n7t, TRANS, OMEGA 6:3 RATIO, and ELONGASE (Figure 4); and the best three-gene networks for HCW, C14:0, C16:1n7, C18:1n9, C18:1n7, SFA, MUFA, and CLA (Figure 5), respectively. In fact, all of these 52 associations/networks were orchestrated by a total of 19 genes, including RCAN1, ASB3, TNF, TFB2M, CAPN12, FADS2, CAST, UTS2R, APOB, CAPN1, ABCA1, EFEMP1, PLTP, DSEL, SLC27A1, SLC27A2, LIPE, CRH, and GNG3 (Figure 6). Among them, 12 genes had pleiotropic effects because each influenced multiple phenotypic traits.
Single marker-trait associations confirmed by linear regression analysis. A: TNF on BMS; B: RCAN1 on REA; C: ASB3 on BFT; D: SLC27A1 on C15:0; E: LIPE on C18:2N6T; F: SLC27A2 on PUFA; G: CRH on OMEGA-3; H: SLC27A2 on OMEGA-6; I: GNG3 on DELTA9; J: SLC27A2 on Fat. The chart titles indicate the marker and the significant P-value of the linear regression analysis.
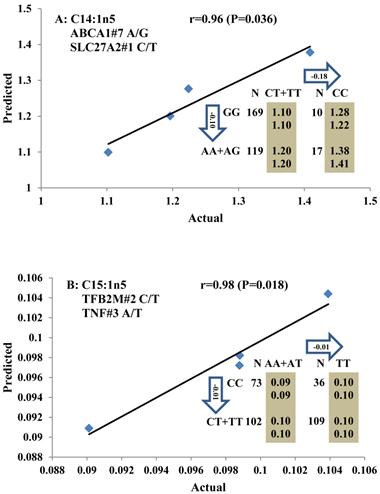
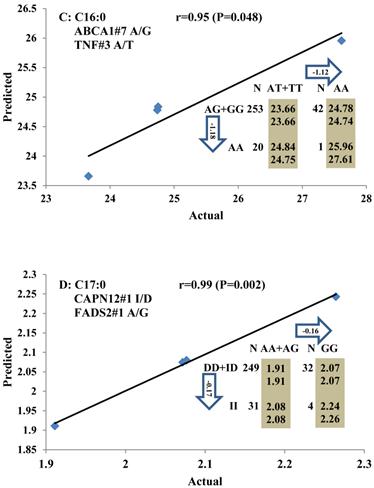
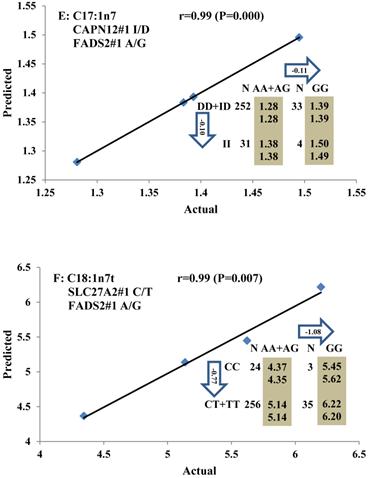
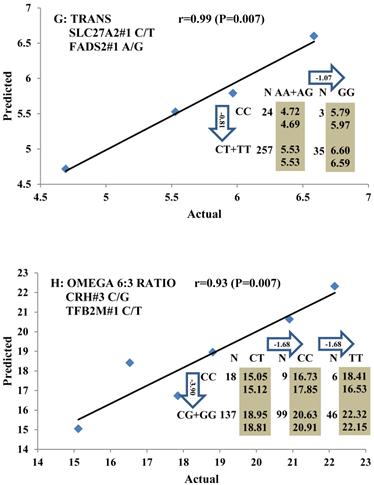
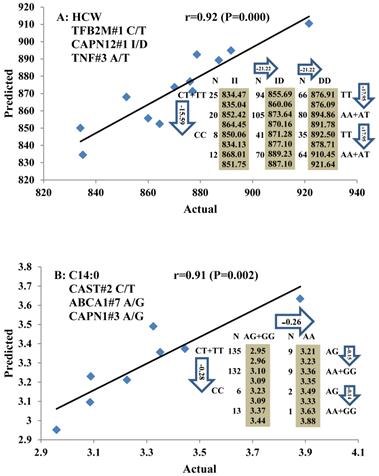
Genetic networks with two genes established by linear regression analysis for economically important traits in beef cattle. The numbers in arrows represent substitution effects of one type of genotype or allele for another. Each combined genotype(s) between different genes has two means of performance: predicted (top) and actual (bottom). The chart titles indicate the marker and the Pearson correlation coefficients with its significant P-value between predicted and actual.
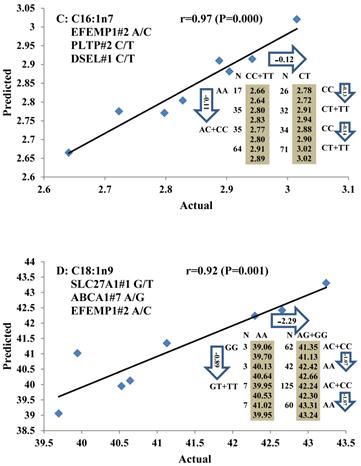
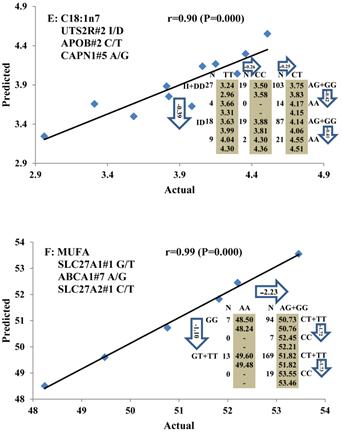
Genetic networks with three genes established by linear regression analysis for economically important traits in beef cattle. The numbers in arrows represent substitution effects of one type of genotype or allele for another. Each combined genotype(s) among different genes has two means of performance: predicted (top or left side) and actual (bottom or right side). “-” means no animals were identified with the combined genotype (s) in the population. The chart titles indicate the marker and the Pearson correlation coefficients with its significant P-value between predicted and actual.
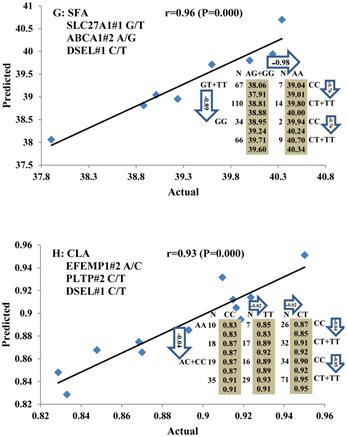
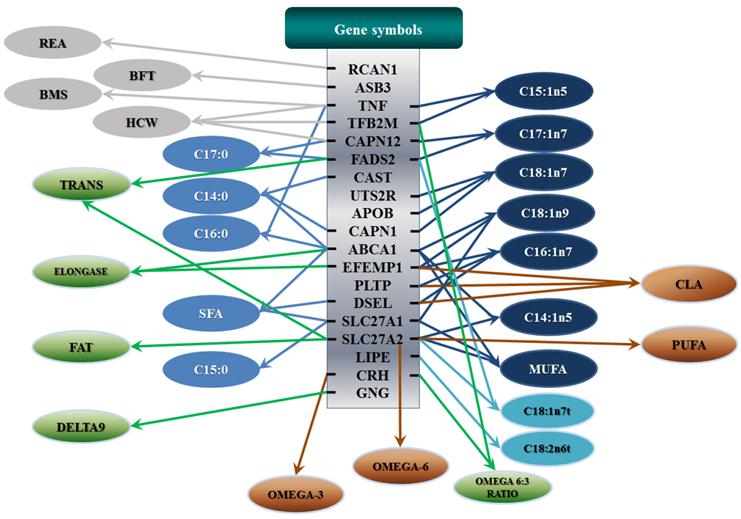
Phenotypic classifications and their associated gene networks. A total of 52 associations were orchestrated for gene networks with 19 genes. Four carcass traits, five saturated fatty acids, seven monounsaturated fatty acids, four polyunsaturated fatty acids, two trans-fatty acids and five traits related to enzyme activities or others are shown as Dark gray, Blue, Dark blue, Orange, Aqua and Green colors, respectively.
DISCUSSION
Candidate gene approaches have been widely used to discover and localize causative genes for quantitative traits or complex phenotypes. There are three ways to choose candidate genes to map quantitative trait loci (QTL) [9]. The physiological approach is based on the genes with known biological functions and actions involved in the development or physiology of the trait of interest. The positional cloning approach considers genes that are located in the neighborhood of previously identified QTL regions. The third method is the comparative approach, which takes loci where polymorphisms are known to have a phenotypic effect in one species and explores them as candidates for similar variation in other species. In fact, we used all of these approaches to select candidate genes (Supplementary Material: Table S1) for identification of genetic markers responsible for variation in quantitative traits using a Wagyu×Angus F1 reference population (the present study) and a Wagyu x Limousin F2 reference population [9 -11]. The Wagyu×Angus F1 reference population included 43 Wagyu bulls, an unknown number of Angus dams and their potential 791 F1 progeny, while the Wagyu x Limousin F2 reference population consisted of 6 F1 bulls, 113 F1 dams and 246 F2 progeny. With the regression analysis, our present study determined the best single-gene associations for 10 traits (Figure 3); the best two-gene networks for 9 traits (Figure 4); and the best three-gene networks for 8 traits (Figure 5), respectively. These associations/networks were orchestrated by a total of 19 genes, including ABCA1, APOB, ASB3, CAPN1, CAPN12, CAST, CRH, DSEL, EFEMP1, FADS2, GNG3, LIPE, PLTP, RCAN1, SLC27A1, SLC27A2, TFB2M, TNF and UTS2R. In the Wagyu x Limousin F2 reference population, regression analysis revealed 24 genes that control significant associations/networks for 19 economically important traits, including APOA1, APOE, BAK1, CAPN1, CAPN12, CAPN14, CRHR1, CRHR2, CRP, FABP3, HS6ST1, MTFR1, PON1, PNPLA2, RAB2A, RCAN1, SCD1, SLC2A2, SLC27A2, TFAM, TFB1M, UCN3, UTS2R and UQCRC1 [9 - 11].
There are only five genes in common between both reference populations and they are CAPN1, CAPN12, RCAN1, SLC27A2 and UTS2R. This result was not unexpected. First, although Wagyu cattle were used as a sire breed to develop both reference populations, dam breeds were quite different between them: Angus for the F1 population and Limousin for the F2 population. Angus cattle were developed from cattle native to the counties of Aberdeenshire and Angus in Scotland, while Limousin cattle are a breed of highly muscled beef cattle originating from the Limousin and Marche regions of France (http://www.ansi.okstate.edu/breeds/cattle/). Second, F1 progeny are usually less variable from one another compared to the F2 offspring. Third, the number of traits was quite different between both reference populations. In the Wagyu×Angus F1 reference population, we measured six carcass phenotypes and twenty-four fatty acid composition traits including six saturated fatty acids, seven monounsaturated fatty acids, four polyunsaturated fatty acids, two trans-fatty acids and five traits related to enzyme activities/others. In the Wagyu x Limousin F2 reference population, we focused on a total of 19 phenotypic measurements, which can be classified into three categories: five carcass measurements, six eating quality traits and eight fatty acid composition measurements [9]. Lastly, trait ontology is also different. For example, beef marbling score was measured based on the Japanese standard in the F1 population (present study), while based on the US standard in the F2 population [9].
Crossbreeding of two divergent breeds is assumed to produce a relatively large amount of heterozygous animals due to the fixation of opposite alleles in both breeds. However, F1 progeny produced in the present study using Wagyu sires and Angus dams did not show such a trend. Among 168 polymorphic markers that were successfully scored, none of them produced all heterozygotes in the F1 population. Only 63 SNPs (37.5%, 63/168) had a likely fixed allele in one of the parent populations (allele frequency ≥ 0.9), including 38 that passed and 25 that failed the Hardy-Weinberg equilibrium test (Supplementary Material: Table S2). In fact, 109 of the 168 (64.88%) markers shared the same minor allele, while the opposite alleles were the minor alleles between the sire and dam populations only in 59 of 168 (35.12%) markers (Supplementary Material: Table S2). Although 44 of 75 (58.67%) tagged markers showed significant differences in both genotype frequencies and allele frequencies between the sire and F1 offspring populations, the HET estimates showed no differences in most of markers (52 of 75, 69.33%) between them (Supplementary Material: Table S2). In a Wagyu x Limousin F2 reference population, Jiang and colleagues (2009) [9] observed 1/3 each of additive, dominant and overdominant QTMs for single marker - single trait associations. However, among 113 single markers - single trait associations identified in the present study, only 9 (7.96%, 9/113) were observed with additive, while 73 (64.60%, 73/113) and 31 (27.43%, 31/113) showed the dominant and overdominant effects, respectively (Table 1) in the Wagyu x Angus F1 population. In a specific locus, these results provide initial evidence that heterosis produced by crossbreeding of different breeds might result from the changes of gene action modes rather than from the increased number of heterozygous animals.
Carcass traits are important to determine production efficiency and beef yield. In the present study, we found that TNF, a nuclear-encoded mitochondrial gene, significantly affected BMS. TNF is a cytokine that plays critical roles in the regulation of a wide spectrum of biological processes including cell proliferation, differentiation, apoptosis, lipid metabolism, and coagulation [22]. Polymorphisms in TNF are associated with obesity, immune-inflammatory, and cardiovascular diseases [23-24]. In mice, TNF increased triacylglycerol and diacylglycerol accumulation in skeletal muscle by suppressing AMPK activity via transcriptional up-regulation of protein phosphatase 2C and fatty-acid oxidation [25]. Our results further confirmed the roles of TNF in intramuscular fat metabolism.
Obtaining higher values in REA and lower values in BFT represent two major breeding objectives in the beef industry. Our study indicated that RCAN1 and ASB3 can significantly impact REA and BFT, respectively. RCAN1 is a key regulator of calcineurin-nuclear factor of activated T-cells signaling pathway, which has essential roles in growth and differentiation in skeletal muscle [26-27]. In the present study, RCAN1 showed a dominant effect on REA, which is the most important trait of muscle growth in beef cattle. The finding consists well with its role in muscle growth. ASB3 is a member of the ankyrin repeat and SOCS box-containing (ASB) family, and it can mediate ubiquitination and degradation of tumor necrosis factor receptor II [28]. Until now, little is known about ASB3. In the present study, we found this gene has an overdominant effect on BFT.
Three genes, including TFB2M, CAPN12, and TNF, have significant effects on HCW. TFB2M is a methyltransferase, which specifically dimethylates the conserved stem loop of mitochondrial 12S rRNA. As such, it plays a primary role in melting the promoter and stabilizing the open promoter complex by simultaneous binding of the priming substrate and the templating DNA base [29]. CAPN12 is a member of the calpain (CAPN) large subunit gene family [30]. In the present study, TFB2M, CAPN12, and TNF genes showed dominant effects on HCW. Two genes, TNF and FTO, also affected both YG and QG in the single-marker association analysis, implying that these genes play important roles in fat deposition, although we could not establish the genetic networks for these two traits.
To date, many research groups have linked genetic markers in CAPN1, CAPN3, and calpastatin (CAST) to beef tenderness [31-33]. Interestingly, we discovered here that both of CAPN1 and CAST genes are involved in gene networks for myristic acid (C14:0), which is positively correlated with tenderness, suggesting that CAPN1 and CAST genes may affect the tenderness by regulating myristic acid. In general, both CAPN1 and CAST belong to the calpain-calpastatin enzyme complexes, which affected the eating quality of meat by regulating the rate of protein degradation [34]. As two well-known genes that are associated with beef tenderness, markers from these two genes have been available as genetic markers for commercial application [35]. But there is a little known about the relationship of these two genes and fatty acid composition phenotypes. This is not surprising because tenderness is usually measured by Warner-Bratzler shear force and temperature, not by fatty acid composition traits. Our results might provide a novel method for genetic improvement of tenderness in beef cattle.
It is well-known that a diet high in saturated fats tends to increase blood cholesterol levels while diets high in unsaturated fats tend to lower blood cholesterol levels, which in turn have favorable effects on cardiovascular diseases. Unfortunately, since biohydrogenation occurs in the rumen, beef contains more saturated fatty acids than meat of monogastric animals [36]. About 80% of the fatty acids in beef are composed of only three fatty acids: two are saturated (palmitic (C16:0) and stearic (C18:0)) and one is unsaturated (oleic acid (C18:1)), while the remaining 20% of fatty acids are distributed among 30 different fatty acids [37]. Palmitic acid (C16:0) and stearic (C18:0) account for about 27% and 18% of the fatty acids in beef, respectively. Two genes, TNF and ABCA1, were involved in the network for palmitic acid (C16:0), while no gene was associated with stearic (C18:0). ABCA1 plays a key role in reverse cholesterol transport and stimulates cholesterol and phospholipid efflux to apo A-І, which is one of the first stages in reverse cholesterol transport [38]. Several SNPs in ABCA1 are associated with high-density lipoprotein cholesterol (HDL-C) levels in human [39-40], which is a major risk factor for coronary artery disease or obesity. TNF also has important roles in obesity or obesity-linked insulin resistance [41]. Bradley et al (2008) [42] discovered murine adipocytes treated for both 24h and 48h with palmitic acid exhibited a 50-70% increase TNF production, suggested palmitic acid acts directly on adipocytes to modulate cytokine production. Subsequently, it was further confirmed that palmitate induces TNF expression in skeletal muscle cells and mouse monocyte lineage [43-44]. Our results also verified these genes are highly associated with major saturated fatty acids.
Oleic acid (C18:1n9), primarily responsible for soft fat, is a major monounsaturated fatty acid, which accounts for about 33% of the fatty acid in beef, and is considered to have the least negative effect on serum cholesterol concentration [45]. Our results showed ABCA1, EFEMP1, and SLC27A1 genes are involved in the genetic network for oleic acid composition. In fact, unsaturated fatty acids, including oleic acid, can regulate the expression of key genes involved in HDL metabolism [46]. Specifically, oleic acid can phosphorylate and destabilize ABCA1, a major gene in HDL metabolism, through a pholipase D2 pathway and a protein kinase C delta pathway [47-48]. Recently, oleic acid was also found to repress expression of ABCA1 in RAW macrophages by modulating histone acetylation state and LXR-independent posttranslational inhibition [49]. Our results confirm the significant relationship of both ABCA1 and oleic acid. Interestingly, since ABCA1 was involved in both saturated (palmitic acid) and unsaturated fatty acid traits (oleic acid), we note the same genotype/QTM in the same marker might have different effects on these two types of fatty acid traits, i.e., for ABCA1#7 marker, AA genotype animals had higher palmitic acid and lower oleic acid levels than that of AG+GG animals. EFEMP1 is a member of the fibulin family of extracellular glycoproteins which are characterized by a fibulin-type C-terminal domain preceded by tandem calcium-binding epidermal growth factor (EGF)-like modules [50-51]. SNPs of EFEMP1 affect birth length and growth rate in children [52-53]. Little is presently known about the relation of EFEMP1 and fatty acid composition; however, our results show EFEMP1 significantly affected oleic acid concentration in beef. SLC27A1 is a plasma membrane protein expressed in adipose tissue, heart, and skeletal muscle [54]. Previous studies have demonstrated that depletion of SLC27A1 led to a redistribution of postprandial fatty acid uptake and triglyceride deposition in adipose tissue and muscle of mice [55-56]. In a Wagyu×Limousin reference population, we reported ABCA1 gene had an additive effect on subcutaneous fat depth (SFD) and an overdominant effect on SFA [10]. The present study indicated a dominant effect of ABCA1 and an overdominant effect of SLC27A1 in oleic acid (C18:1n9). The above results strongly suggest ABCA1 and SLC27A1 are involved in fatty acid and adipose tissue metabolism.
The major polyunsaturated fatty acids found in beef are linoleic acid (C18:2n6/OMEGA-6) (about 3.5%) and alpha-linolenic acid (C18:3n3/OMEGA-3) (about 1.5%). They are both essential fatty acids which cannot be produced in the human body and must be obtained from the diet. Ideally, intake of OMEGA-6 fatty acids should be no more than 10 times that of OMEGA-3 fatty acids [57]. But in fact, the ratio of OMEGA-6 to OMEGA-3 in Western diets is 15/1-16.7/1 or more [58]. In human, the levels of OMEGA-3 or OMEGA-6 polyunsaturated fatty acid in serum were significantly associated with genetic variants of NOS3 and FADS1 respectively [59-60], but our current study did not discover any significant association between FADS and OMEGA-6 in beef. Instead, we found SLC27A2 with an additive effect on OMEGA-6 and TFB2M with an overdominant effect on the OMEGA 6:3 RATIO, while CRH with an overdominant effect on OMEGA-3 and a dominant effect on the OMEGA 6:3 RATIO in beef. SLC27A2 plays a key role in lipid biosynthesis and fatty acid degradation. In the previous study, SLC27A2 was associated with SFD and KPH in beef cattle [9], and Wang et al (2007) [61] reported that a polymorphism in porcine SLC27A2 gene was associated with fat meat percentage and backfat traits. Our results suggested that SLC27A2 may play a new role in regulating polyunsaturated fatty acid synthesis. CRH plays an important role as the major hypothalamic releasing factor for pituitary adrenocorticotropin (ACTH) secretion [62], which regulates cortisol level. Cortisol has profound metabolic effects, such as inhibiting glucose uptake and stimulating fat breakdown. SNPs of CRH in a Charolais-cross steer population were highly associated with end-of-test rib-eye area [63]. Our previously study demonstrated that CRH was significantly associated with marbling and subcutaneous fat depth (SFD) in a Wagyu×Limousin F2 population [64]. In the present study, we discovered a new role for CRH in lipid metabolism, i.e., it is significantly associated with both OMEGA-3 and the OMEGA 6:3 RATIO. In brief, we provided novel evidence of SLC27A2, TFB2M, and CRH genes in polyunsaturated fatty acid metabolism.
CLA positively affects human health by inhibiting carcinogenesis, reducing fat deposition, and reducing serum lipids [65]. Ruminant fats in meat are the primary dietary CLA sources for humans because plants do not synthesize CLA [66]. Three genes, EFEMP1, PLTP, and DSEL, were involved in the CLA network. PLTP is a lipid transfer protein that belongs to the lipopolysaccharide family. Previous reports revealed that plasma PLTP activity is elevated in type 2 diabetes mellitus, and obesity, with a decrease in PLTP being observed after weight loss [67-68]. Higher PLTP activity could contribute to elevated cardiovascular risk in the presence of obesity and insulin resistance [69]. Recently, a genome-wide association study showed a SNP locus of PLTP is significantly associated with HDL-cholesterol level in human, which is a risk factor of coronary heart disease [70-71]. In the present study, our association result also implied that PLTP may affect lipid level by regulating CLA. This is a good clue for improving the level of CLA in beef production by using genomic markers if we consider PLTP as a good candidate for decreasing the risk of coronary heart disease. DSEL acts as a chondroitin-glucuronate C5 epimerase, converting D-glucuronic acid to L-iduronic acid, and catalyzing the formation of dermatan sulfate from chondroitin sulfate [72]. Our previous study found DSEL has an overdominant effect on R2 (calculated as (16:1/16:0) × 100%) [11]. Now a different role has been discovered for the relationship between DSEL and CLA. Interestingly, the same genetic network is also responsible for both CLA and palmitoleic acid (C16:1n7). Overall, we discovered three different effects, an overdominant effect for PLTP and dominant effects for both EFEMP1 and DSEL, which are involved in the same CLA network, suggesting the regulation of CLA may be more complex.
Beef fat is not only an excellent source of CLA, but it also contains large amounts of trans-vaccenic acid (trans-18:1n7t, TVA), which can be converted to CLA in the human body [73]. DELTA9 desaturase, the rate-limiting enzyme of MUFA, catalyzes the introduction of a double bond between carbons 9 and 10 of saturated fatty acids, such as palmitic (16:0) and stearic (18:0) acids, to yield palmitoleic (16:1n7) and oleic (18:1n9) acids, respectively, and also converts TVA to CLA [74-75]. We found that GNG3 is associated with DELTA9 desaturase. GNG3 is one of the gamma subunits in the G protein subunit gene family, which is involved as modulators or transducers of various transmembrane signaling systems. Mice with a deficiency of GNG3 are lean and show resistance to opioids and diet-induced obesity [76]. But until now, the role of GNG3 was unclear. Our current results indicate that the GNG3 gene plays an important role in the conversion process from saturated fatty acid to unsaturated fatty acid.
In summary, our present study revealed different gene networks were associated with important traits, i.e., BMS, REA, BFT, HCW, myristic acid (C14:0), palmitic acid (C16:0), oleic acid (C18:1n9), oleic acid (C18:1n9), OMEGA-3, OMEGA-6, OMEGA 6:3 RATIO, DELTA9, and CLA, in our Wagyu x Angus F1 population. Our present work also provides a novel view on origin of heterosis as a result of gene (allele) action changes during crossbreeding of different breeds. Furthermore, the SNPs evaluated in the present study are strong candidates for marker-assisted selection in the genomic improvement of carcass, meat quality, and healthful products of beef cattle.
Supplementary Material
Table S1: Gene symbols, name, GenBank references, GO/pathway and SNPs information in the present study. Table S2: Gene and genotype frequency of sires and their F1 offspring.
Acknowledgements
This work was supported by Merial Ltd. Animal Genomics Research Fund to Z.J. This activity was also funded, in part, with an Emerging Research Issues Internal Competitive Grant from the Washington State University, College of Agricultural, Human, and Natural Resource Sciences, Agricultural Research Center to Z.J.
Competing Interests
The authors have declared that no competing interest exists.
References
1. Knutson J. Despite progress, US beef industry still faces market challenges. Agweek. http://www.grandforksherald.com/event/article/id/194223/
2. 2010 US pork and beef consumption decline. Drovers CattleNetwork. http://www.cattlenetwork.com/cattle-news/markets/beef/prices/2010-US-pork--beef-consumption-decline.html
3. Smith GC, Savell JW, Morgan JB. et al. Report of the June-September, 2005 national beef quality audit: a new benchmark for the U.S. beef industry. Proceedings Beef Improvement Federation 38th Annual Research Symposium and Annual Meeting. 2006:6-11
4. Williams JL, Aguilar I, Rekaya R. et al. Estimation of breed and heterosis effects for growth and carcass traits in cattle using published crossbreeding studies. J Anim Sci. 2010;88:460-466
5. Kahi AK, Hirooka H. Genetic and economic evaluation of Japanese Black (Wagyu) cattle breeding schemes. J Anim Sci. 2005;83:2021-2032
6. Radunz AE, Loerch SC, Lowe GD. et al. Effect of Wagyu- versus Angus-sired calves on feedlot performance, carcass characteristics, and tenderness. J Anim Sci. 2009;87:2971-2976
7. Oka A, Iwaki F, Dohgo T. et al. Genetic effects on fatty acid composition of carcass fat of Japanese Black Wagyu steers. J Anim Sci. 2002;80:1005-1011
8. Bureš D, Bartoň L, Zahrádková R. et al. Chemical composition, sensory characteristics, and fatty acid profile of muscle from Aberdeen Angus, Chaolais, Simmental, and Hereford bulls. Czech J Anim Sci. 2006;51:279-284
9. Jiang Z, Michal JJ, Chen J. et al. Discovery of novel genetic networks associated with 19 economically important traits in beef cattle. Int J Biol Sci. 2009;5:528-542
10. Daniels TF, Wu XL, Pan Z. et al. The reverse cholesterol transport pathway improves understanding of genetic networks for fat deposition and muscle growth in beef cattle. PLoS One. 2010;5:e15203
11. Jiang Z, Michal JJ, Wu XL. et al. The heparan and heparin metabolism pathway is involved in regulation of fatty acid composition. Int J Biol Sci. 2011;7:659-663
12. O'Fallon JV, Busboom JR, Nelson ML. et al. A direct method for fatty acid methyl ester synthesis: Application to wet meat tissues, oils, and feedstuffs. J Anim Sci. 2007;85:1511-1521
13. Marshall TC, Slate J, Kruuk LEB. et al. Statistical confidence for likelihood-based paternity inference in natural populations. Mol Ecol. 1998;7:639-655
14. Slate J, Marshall TC, Pemberton JM. A retrospective assessment of the accuracy of the paternity inference program CERVUS. Mol Ecol. 2000;9:801-808
15. Kalinowski ST, Taper ML, Marshall TC. Revising how the computer program CERVUS accommodates genotyping error increases success in paternity assignment. Mol Ecol. 2007;16:1099-1106
16. Barrett JC, Fry B, Maller J. et al. Haploview: analysis and visualization of LD and haplotype maps. Bioinformatics. 2005;21:263-265
17. McCullagh P, Nelder JA. Generalized Linear Models, Second Edition. London: Chapman and Hall. 1989
18. Schabenberger O. Introducing the GLIMMIX Procedure for Generalized Linear Models. SUGI 30. Cary, NC: SAS Institute. 2007
19. Akaike H. A new look at the statistical model identification. IEEE Transactions on Automatic Control. 1974;6:716-723
20. Waits LP, Luikart G, Taberlet P. Estimating the probability of identity among genotypes in natural populations: cautions and guidelines. Mol Ecol. 2001;10:249-256
21. Jamieson A, Taylor SC. Comparisons of three probability formulae for parentage exclusion. Anim Genet. 1997;28:397-400
22. Tokushige K, Yamaguchi N, Ikeda I. et al. Significance of soluble TNF receptor- in acute-type fulminant hepatitis. Am J Gastroenterol. 2000;95:2040-2046
23. Mellick GD. TNF gene polymorphism and quantitative traits related to cardiovascular disease: getting to the heart of the matter. Eur J Hum Genet. 2007;15:609-611
24. Gray SB, Langefeld CD, Ziegler JT. et al. Single-nucleotide polymorphisms in the TNF gene are associated with obesity-related phenotypes in vervet monkeys. Obesity (Silver Spring). 2011;7:1427-1432
25. Steinberg GR, Michell BJ, van Denderen BJ. et al. Tumor necrosis factor alpha-induced skeletal muscle insulin resistance involves suppression of AMP-kinase signaling. Cell Metab. 2006;4:465-474
26. Shin SY, Choo SM, Kim D. et al. Switching feedback mechanisms realize the dual role of MCIP in the regulation of calcineurin activity. FEBS Lett. 2006;580:5965-5973
27. Shin SY, Yang JM, Choo SM. et al. System-level investigation into the regulatory mechanism of the calcineurin/NFAT signaling pathway. Cell Signal. 2008;20:1117-1124
28. Chung AS, Guan YJ, Yuan ZL. et al. Ankyrin repeat and SOCS box 3 (ASB3) mediates ubiquitination and degradation of tumor necrosis factor receptor II. Mol Cell Biol. 2005;25:4716-4726
29. Sologub M, Litonin D, Anikin M. et al. TFB2 is a transient component of the catalytic site of the human mitochondrial RNA polymerase. Cell. 2009;139:934-944
30. Dear TN, Meier NT, Hunn M. et al. Gene structure, chromosomal localization, and expression pattern of Capn12, a new member of the calpain large subunit gene family. Genomics. 2000;68:152-160
31. Morris CA, Cullen NG, Hickey SM. et al. Genotypic effects of calpain 1 and calpastatin on the tenderness of cooked M. longissimus dorsi steaks from Jersey x Limousin, Angus and Hereford-cross cattle. Anim Genet. 2006;37:411-414
32. Barendse W, Harrison BE, Bunch RJ. et al. Variation at the Calpain 3 gene is associated with meat tenderness in zebu and composite breeds of cattle. BMC Genet. 2008;9:41
33. Gill JL, Bishop SC, McCorquodale C. et al. Association of selected SNP with carcass and taste panel assessed meat quality traits in a commercial population of Aberdeen Angus-sired beef cattle. Genet Sel Evol. 2009;41:36
34. Koohmaraie M, Kent M P, Shackelford SD. et al. Meat tenderness and muscle growth: Is there any relationship? Meat Sci. 2002;62:345-352
35. Van Eenennaam AL, Li J, Thallman RM. et al. Validation of commercial DNA tests for quantitative beef quality traits. J Anim Sci. 2007;85:891-900
36. De Smet S, Raes K, Demeyer D. Meat fatty acid composition as affected by fatness and genetic factors: a review. Anim Res. 2004;53:81-98
37. Whetsell MS, Rayburn EB, Lozier JD. Human Health Effects of Fatty Acids in Beef Fact Sheet. US: West Virgina University & USDA Agriculture Research Service. 2003
38. Lee JY, Karwatsky J, Ma L. et al. ABCA1 increases extracellular ATP to mediate cholesterol efflux to apoA-I. Am J Physiol Cell Physiol. 2011;301:C886-894
39. Porchay I, Péan F, Bellili N. et al. ABCA1 single nucleotide polymorphisms on high-density lipoprotein-cholesterol and overweight: the D.E.S.I.R. study. Obesity (Silver Spring). 2006;14:1874-1879
40. Slatter TL, Jones GT, Williams MJ. et al. Novel rare mutations and promoter haplotypes in ABCA1 contribute to low-HDL-C levels. Clin Genet. 2008;73:179-184
41. Hotamisligil GS, Shargill NS, Spiegelman BM. Adipose expression of tumor necrosis factor-a: direct role in obesity-linked insulin resistance. Science. 1993;259:87-91
42. Bradley RL, Fisher FF, Maratos-Flier E. Dietary fatty acids differentially regulate production of TNF-alpha and IL-10 by murine 3T3-L1 adipocytes. Obesity (Silver Spring). 2008;16:938-44
43. de Lima-Salgado TM, Alba-Loureiro TC, do Nascimento CS. et al. Molecular mechanisms by which saturated fatty acids modulate TNF-α expression in mouse macrophage lineage. Cell Biochem Biophys. 2011;59:89-97
44. Jové M, Planavila A, Sánchez RM. et al. Palmitate induces tumor necrosis factor-alpha expression in C2C12 skeletal muscle cells by a mechanism involving protein kinase C and nuclear factor-kappaB activation. Endocrinology. 2006;147:552-561
45. Grundy SM. Influence of stearic acid on cholesterol cholesterol metabolism relative to other long-chain fatty acids. Am J Clin Nutr. 1994;60(Suppl):986S-990S
46. Kuang YL, Eric Paulson K, Lichtenstein AH. et al. Regulation of the expression of key genes involved in HDL metabolism by unsaturated fatty acids. Br J Nutr. 2012;6:1-9
47. Wang Y, Oram JF. Unsaturated fatty acids phosphorylate and destabilize ABCA1 through a phospholipase D2 pathway. J Biol Chem. 2005;280:35896-35903
48. Wang Y, Oram JF. Unsaturated fatty acids phosphorylate and destabilize ABCA1 through a protein kinase C delta pathway. J Lipid Res. 2007;48:1062-1068
49. Ku CS, Park Y, Coleman SL. et al. Unsaturated fatty acids repress expression of ATP binding cassette transporter A1 and G1 in RAW 264.7 macrophages. J Nutr Biochem. 2011 [Epub ahead of print]
50. Timpl R, Sasaki T, Kostka G. et al. Fibulins: a versatile family of extracellular matrix proteins. Nat Rev Mol Cell Biol. 2003;4:479-489
51. Song EL, Hou YP, Yu SP. et al. EFEMP1 expression promotes angiogenesis and accelerates the growth of cervical cancer in vivo. Gynecol Oncol. 2011;121:174-180
52. Takeuchi T, Hayashi T, Bedell M. et al. A novel haplotype with the R345W mutation in the EFEMP1 gene associated with autosomal dominant drusen in a Japanese family. Invest Ophthalmol Vis Sci. 2010;51:1643-1650
53. Paternoster L, Howe LD, Tilling K. et al. Adult height variants affect birth length and growth rate in children. Hum Mol Genet. 2011;20:4069-4075
54. Binnert C, Koistinen HA, Martin G. et al. Fatty acid transport protein-1 mRNA expression in skeletal muscle and in adipose tissue in humans. Am J Physiol Endocrinol Metab. 2000;279:E1072-E1079
55. Wu Q, Ortegon AM, Tsang B. et al. FATP1 is an insulin-sensitive fatty acid transporter involved in diet-induced obesity. Mol Cell Biol. 2006;26:3455-3467
56. Gimeno RE. Fatty acid transport proteins. Curr Opin Lipidol. 2007;18:271-276
57. DRI. Dietary Reference Intakes for Energy, Carbohydrate, Fiber, Fat, Fatty Acids, Cholesterol, Protein, and Amino Acids (Macronutrients). 2002.
58. Simopoulos AP. The importance of the ratio of omega-6/omega-3 essential fatty acids. Biomed Pharmacother. 2002;56:365-379
59. Ferguson JF, Phillips CM, McMonagle J. et al. NOS3 gene polymorphisms are associated with risk markers of cardiovascular disease, and interact with omega-3 polyunsaturated fatty acids. Atherosclerosis. 2010;211:539-544
60. Mathias RA, Vergara C, Gao L. et al. FADS genetic variants and omega-6 polyunsaturated fatty acid metabolism in a homogeneous island population. J Lipid Res. 2010;51:2766-2774
61. Wang T, Liu C, Xiong YZ. et al. Isolation and cloning of porcine SLC27A2 gene and detection of its polymorphism associated with growth and carcass traits. Asian-australas J Anim Sci. 2007;8:1169-1173
62. Seasholtz AF, Valverde RA, Denver RJ. Corticotropin-releasing hormone-binding protein: biochemistry and function from fishes to mammals. J Endocrinol. 2002;175:89-97
63. Buchanan FC, Thue TD, Yu P. et al. Single nucleotide polymorphisms in the corticotrophin-releasing hormone and pro-opiomelancortin genes are associated with growth and carcass yield in beef cattle. Anim Genet. 2005;36:127-131
64. Wibowo TA, Michal JJ, Jiang Z. The corticotropin releasing hormone is a promising candidate gene for marbling and subcutaneous fat depth in beef cattle. Genome. 2007;50:939-945
65. Mulvihill B. Ruminant meat as a source of conjugated linoleic acid (CLA). Nutr Bull. 2001;26:295-299
66. Herbein JH, Loor JJ, Wark WA. Conjugated linoleic acids-An opportunity for pasture-based dairy farms? Proc Mid-Atlantic Dairy Grazing Field Day. 2000:16-20
67. Murdoch SJ, Kahn SE, Albers JJ. et al. PLTP activity decreases with weight loss: changes in PLTP are associated with changes in subcutaneous fat and FFA but not IAF or insulin sensitivity. J Lipid Res. 2003;44:1705-1712
68. Tzotzas T, Desrumaux C, Lagrost L. Plasma phospholipid transfer protein (PLTP): review of an emerging cardiometabolic risk factor. Obes Rev. 2009;10:403-411
69. de Vries R, Kappelle PJ, Dallinga-Thie GM. et al. Plasma phospholipid transfer protein activity is independently determined by obesity and insulin resistance in non-diabetic subjects. Atherosclerosis. 2011;217:253-259
70. Kaess BM, Tomaszewski M, Braund PS. et al. Large-scale candidate gene analysis of HDL particle features. PLoS One. 2011;6:e14529
71. Lettre G, Palmer CD, Young T. et al. Genome-wide association study of coronary heart disease and its risk factors in 8,090 African Americans: the NHLBI CARe Project. PLoS Genet. 2011;7:e1001300
72. Zayed H, Chao R, Moshrefi A. et al. A maternally inherited chromosome 18q22.1 deletion in a male with late-presenting diaphragmatic hernia and microphthalmia-evaluation of DSEL as a candidate gene for the diaphragmatic defect. Am J Med Genet A. 2010;152A:916-923
73. Turpeinen AT, Mutanen M, Aro A. et al. Bioconversion of vaccenic acid to conjugated linoleic acid in humans. Am J Clin Nutr. 2002;76:504-510
74. Nakamura MT, Nara TY. Structure, function, and dietary regulation of delta6, delta5, and delta9 desaturases. Annu Rev Nutr. 2004;24:345-376
75. Minville-Walz M, Pierre AS, Pichon L. et al. Inhibition of stearoyl-CoA desaturase 1 expression induces CHOP-dependent cell death in human cancer cells. PLoS One. 2010;5:e14363
76. Schwindinger WF, Giger KE, Betz KS. et al. Mice with deficiency of G protein gamma3 are lean and have seizures. Mol Cell Biol. 2004;24:7758-7768
Author contact
![]() Corresponding author: Zhihua Jiang, Tel: +509 335 8761; Fax: +509 335 4246; E-mail: jiangzedu
Corresponding author: Zhihua Jiang, Tel: +509 335 8761; Fax: +509 335 4246; E-mail: jiangzedu