Impact Factor ISSN: 1449-2288

 Global reach, higher impact
Int J Biol Sci 2012; 8(6):870-881. doi:10.7150/ijbs.4027 This issue Cite
Research Paper
Genome-wide Association Study of Porcine Hematological Parameters in a Large White × Minzhu F2 Resource Population
Weizhen Luo1*, Shaokang Chen2*, Duxue Cheng1*, Ligang Wang1, Yong Li1, Xiaojun Ma1, Xin Song3, Xin Liu1, Wen Li1, Jing Liang1, Hua Yan1, Kebin Zhao1, Chuduan Wang2 ![]() , Lixian Wang1
, Lixian Wang1 ![]() , Longchao Zhang1
, Longchao Zhang1 ![]()
1. Key Laboratory of Farm Animal Genetic Resources and Germplasm Innovation of Ministry of Agriculture of China, Institute of Animal Science, Chinese Academy of Agricultural Sciences, Beijing 100193, China.
2. College of Animal Science and Technology, and State Key Laboratory of Agrobiotechnology, China Agricultural University, Beijing 100193, China.
3. College of Veterinary Medicine, Sichuan Agricultural University, Ya'an 625014, China.
* These authors contributed equally to this work.
Received 2011-12-30; Accepted 2012-5-15; Published 2012-6-15
Abstract
Hematological traits, which are important indicators of immune function in animals, have been commonly examined as biomarkers of disease and disease severity in humans and animals. Genome-wide significant quantitative trait loci (QTLs) provide important information for use in breeding programs of animals such as pigs. QTLs for hematological parameters (hematological traits) have been detected in pig chromosomes, although these are often mapped by linkage analysis to large intervals making identification of the underlying mutation problematic. Single nucleotide polymorphisms (SNPs) are the common form of genetic variation among individuals and are thought to account for the majority of inherited traits. In this study, a genome-wide association study (GWAS) was performed to detect regions of association with hematological traits in a three-generation resource population produced by intercrossing Large White boars and Minzhu sows during the period from 2007 to 2011. Illumina PorcineSNP60 BeadChip technology was used to genotype each animal and seven hematological parameters were measured (hematocrit (HCT), hemoglobin (HGB), mean corpuscular hemoglobin (MCH), mean corpuscular hemoglobin concentration (MCHC), mean corpuscular volume (MCV), red blood cell count (RBC) and red blood cell volume distribution width (RDW)). Data were analyzed in a three step Genome-wide Rapid Association using the Mixed Model and Regression-Genomic Control (GRAMMAR-GC) method. A total of 62 genome-wide significant and three chromosome-wide significant SNPs associated with hematological parameters were detected in this GWAS. Seven and five SNPs were associated with HCT and HGB, respectively. These SNPs were all located within the region of 34.6-36.5 Mb on SSC7. Four SNPs within the region of 43.7-47.0 Mb and fifty-five SNPs within the region of 42.2-73.8 Mb on SSC8 showed significant association with MCH and MCV, respectively. At chromosome-wide significant level, one SNP at 29.2 Mb on SSC1 and two SNPs within the region of 26.0-26.2 Mb were found to be significantly associated with RBC and RDW, respectively. Many of the SNPs were located within previously reported QTL regions and appeared to narrow down the regions compared with previously described QTL intervals. In current research, a total of seven significant SNPs were found within six candidate genes SCUBE3, KDR, TDO, IGFBP7, ADAMTS3 and AFP. In addition, the KIT gene, which has been previously reported to relate to hematological parameters, was located within the region significantly associated with MCH and MCV and could be a candidate gene. These results of this study may lead to a better understanding of the molecular mechanisms of hematological parameters in pigs.
Keywords: genome-wide association study, porcine, hematological parameters
Introduction
Hematological traits are important indicators of immune function in animals [1, 2]. Some hematological traits i.e. hematocrit (HCT), hemoglobin (HGB), mean corpuscular hemoglobin concentration (MCHC) and red cell distribution width (RDW) are similar between humans and pigs (normal and mini pigs) [3-5]. These hematological traits are commonly examined as biomarkers of disease and disease severity in human and animals. Besides being an agriculturally important resource for meat production, pig is also a large-animal model for human genetic diseases due to the high degree of similarity with human physiological characteristics.
Genome-wide significant quantitative trait loci (QTL) for hematological parameters (hematological traits) have been detected on all pig chromosomes (http://www.animalgenome.org/cgi-bin/QTLdb/SS/index). However, QTLs are often mapped by linkage analysis to a large interval of 20 centimorgans (cM) or more [6]. Single nucleotide polymorphisms (SNPs) provide more markers covering the genome than microsatellite markers and are the common form of genetic variation among individuals. Genome-wide association studies (GWAS) that survey most of the genome using genetic variants [7] have been developed and applied widely in analysis of human disease and complex traits. As a result of the development of Illumina SNP genotyping technology, 50000 to 60000 SNPs have been detected among domestic animals for GWAS of complex traits in chickens [8, 9], dairy cattle [10-12] and pigs [13]. Although many studies have identified QTLs for porcine hematological traits, GWAS of these traits are yet to be performed. In this study, a GWAS was undertaken using the PorcineSNP60 Genotyping BeadChip technology (Illumina, San Diego, CA. USA) to detect potential genetic variants associated with hematological traits in a porcine Large White × Minzhu intercross population.
Materials and Methods
Animals
In this study, a three-generation resource population was produced by intercrossing Large White boars and Minzhu sows during the period from 2007 to 2011. All animal procedures were performed according to guidelines developed by the China Council on Animal Care, and protocols were approved by the Animal Care and Use Committee of Beijing, China. The approval ID or permit numbers are SYXK (Beijing) 2008-007 and SYXK (Beijing) 2008-008. Four Large White boars were mated to 16 Minzhu sows. Nine boars and 46 sows of their offspring were used (avoiding full-sib mating) to produce 430 F2 animals (90 litters) in three parities. Male pigs of the F2 generation were castrated 15 days after birth. The average number of half-sibs per sire was 64. All animals were raised under identical feeding conditions at the experimental farm of the Institute of Animal Science, Chinese Academy of Agricultural Sciences. All parental animals were apparently healthy.
Blood samples collection and analysis of hematological traits
Blood samples (2 ml) were obtained from F2 animals at 240 days of age in 49 batches (blood collection group). Blood samples were obtained by venipuncture and immediately injected into tubes containing K3-EDTA anti-coagulant for measurement of hematological parameters. All blood samples were conserved in a condition of 4 °C and sent to the Xiyuan Hospital of the China Academy of Chinese Medical Sciences and analyzed within 24 hours.
Seven hematological parameters, including hematocrit (HCT), hemoglobin (HGB), mean corpuscular hemoglobin (MCH), mean corpuscular hemoglobin concentration (MCHC), mean corpuscular volume (MCV), red blood cell count (RBC) and red cell distribution width (RDW), were measured using a fully automatic Hematology Analyzer (MEK-6318K, Nihon-Kohden, Tokyo, Japan). All traits were analyzed by professional researchers in order to assure accuracy of the results.
Genotyping and quality control
A total of 20 F0, 55 F1, and 430 F2 animals were genotyped using the PorcineSNP60 BeadChip (Illumina). Pedigree mismatching was first checked by the Cervus program [14] using the SNPs information. Data were quality controlled for sample call rate, SNP call rate, minor allele frequency (MAF) and deviation from Hardy-Weinburg Equilibrium (HWE). Quality control procedures were performed for the F2 individuals using GenABEL package [15] within the R statistical environment. Gender errors were identified and SNPs were excluded according to the following criteria: (1) MAF < 3%, (2) call rate < 90%, (3) significant divergence from HWE with p-values < 10-6. Genotyping efficiency for samples was also verified and individuals were excluded with threshold call rates < 90%.
Following quality control, 112 X-linked SNPs were excluded because they were likely to be autosomal (odds > 1000), 11211 SNPs were excluded due to MAF < 3%, 3993 SNPs were excluded due to call rate < 90%, 1367 SNPs were excluded with divergence from HWE with p < 10-6 and one animal was excluded with a call rate < 90%. The final data set used in this GWAS contained 429 animals and 48355 SNPs. The distribution of SNPs after quality control and the average distance between adjacent SNPs on each chromosome are shown in Table 1.
Distribution of SNPs after quality control and average distances on each chromosome.
| Chromosome | No. SNPs | Average distance (kb)a |
|---|---|---|
| 1 | 5165 | 61.05 |
| 2 | 2108 | 77.12 |
| 3 | 1672 | 86.60 |
| 4 | 2910 | 49.30 |
| 5 | 1778 | 62.71 |
| 6 | 1510 | 104.48 |
| 7 | 2846 | 47.35 |
| 8 | 1772 | 83.80 |
| 9 | 2095 | 73.35 |
| 10 | 1096 | 72.17 |
| 11 | 1486 | 59.01 |
| 12 | 895 | 71.05 |
| 13 | 2864 | 76.34 |
| 14 | 3161 | 48.67 |
| 15 | 2031 | 77.64 |
| 16 | 1262 | 68.86 |
| 17 | 1318 | 52.88 |
| 18 | 901 | 67.95 |
| X | 669 | 215.68 |
| Y | 1 | 1637.72 |
| 0b | 10815 | |
| Total | 48355 |
aDerived from Sus scrofa Build 10.2 (http://pre.ensembl.org/Sus_scrofa_map/Info/Index).
bThese SNPs are not assigned to any chromosome according as Illumina PorcineSNP60 Beadchip.
Statistical analysis
Genome-wide association analysis was performed using a three step GRAMMAR-GC approach (Genome-wide Rapid Association using the Mixed Model and Regression-Genomic Control) [15, 16] as follows:
Firstly, data were analyzed using the mixed model:
y=1μ+Xb+Tc+Zα+e
where y is the vector of phenotypes of 429 F2 animals, b is the vector of fixed effects (consisting of sex, parity and batch effects), c is the vector of litter effect (considered as a random effect, c~N(0,σc2)), a is the vector of random additive genetic effects with α~N(0,Aσα2) (where A is the relationship matrix calculated from the corrected pedigree and σα2 is the additive genetic variance) and e is the vector of residual errors with e~N(0,Iσe2),where I is the identity matrix and σe2 is the residual variance. X, T and Z are incidence matrices relating records in y to fixed and random effects. The herd-year-season effect was contained in the batch effect. The vector of residuals y* is estimated as:
y*=y-(1μ^+Xb^+Tc^+Zα^)
where b^, c^ and α^ are estimates and predictors for b, c and a, respectively.
Secondly, the residuals were used as the dependent trait and the associations were tested using the single locus regression analysis:
y*=1μ+kg+e*
where g is the vector of genotypes, k is the regression coefficient and e* is the vector of random residuals.
Thirdly, in the GC procedure, the unadjusted test statistic factor of the ith SNP Ti2 was calculated as:
Ti2=k^i2/var(k^i)
where k^i and var(k^i), are the estimate and sample variance of k, respectively. The deflation factor λ, was estimated as λ^=median(T12,T22,…,Ti2)/0.456, where 0.456 is the median of χ(1)2 [17]. Association of the ith SNP with the trait was examined by comparison of Ti2/λ^ with χ(1)2.
The first step was performed using DMU software [18] and the remainder of the analysis was performed using GenABEL package within the R statistical environment [14]. The genome-wide significance threshold was determined by the Bonferroni method, in which the conventional p-value was divided by the number of tests performed [19]. A SNP was considered to have genome-wide significance at p < 0.05/N, where N is the number of SNPs tested in the analyses. In this study, N was 48355 and the genome-wide significant threshold was 1.03e-6. The chromosome-wide significant thresholds for SSC1 and SSC12 were 9.63e-6 and 5.67e-5, respectively.
Population stratification
Population stratification for GWAS can lead to false positive results [6]. In this study, the influence of population stratification was assessed in a quantile-quantile (Q-Q) plot by examining the distribution of test statistics generated from association tests and the deviation from the null hypothesis of no SNP association with the trait was assessed. Comparison of the GWAS results with and without the GC procedure were shown in the Q-Q plot to assess the validity of this method for adjustment of population stratification. The Q-Q plot was constructed within the R statistical environment.
Results
Phenotype description
Means, standard deviations, minimum, and maximum values of the traits measured in the current experiment were presented in Table 2. Means for HCT, HGB, MCH, MCHC, MCV, RBC and RDW were 44.20%, 142.29 g/L, 17.56 pg, 321.68 g/L, 53.72 fL, 7.97 (10^12/L) and 16.94%, respectively.
Descriptive statistics of seven hematological parameters for 430 individuals.
| Traits | Mean | Standard deviation | Minimum | Maximum |
|---|---|---|---|---|
| HCT(%) | 44.20 | 5.29 | 15.00 | 76.10 |
| HGB(g/L) | 142.29 | 22.67 | 12.50 | 208.00 |
| MCH(pg) | 17.56 | 1.02 | 15.00 | 21.20 |
| MCHC(g/L) | 321.68 | 43.35 | 30.40 | 375.00 |
| MCV(fL) | 53.72 | 4.11 | 44.10 | 74.00 |
| RBC(10^12/L) | 7.97 | 1.43 | 0.02 | 9.96 |
| RDW(%) | 16.94 | 0.92 | 14.30 | 22.10 |
HCT, hematocrit; HGB, hemoglobin; MCV, mean corpuscular volume; MCH, mean corpuscular hemoglobin concentration; MCHC, mean corpuscular hemoglobin concentration; RBC, red blood cell count; RDW, red cell distribution width.
Population stratification assessment
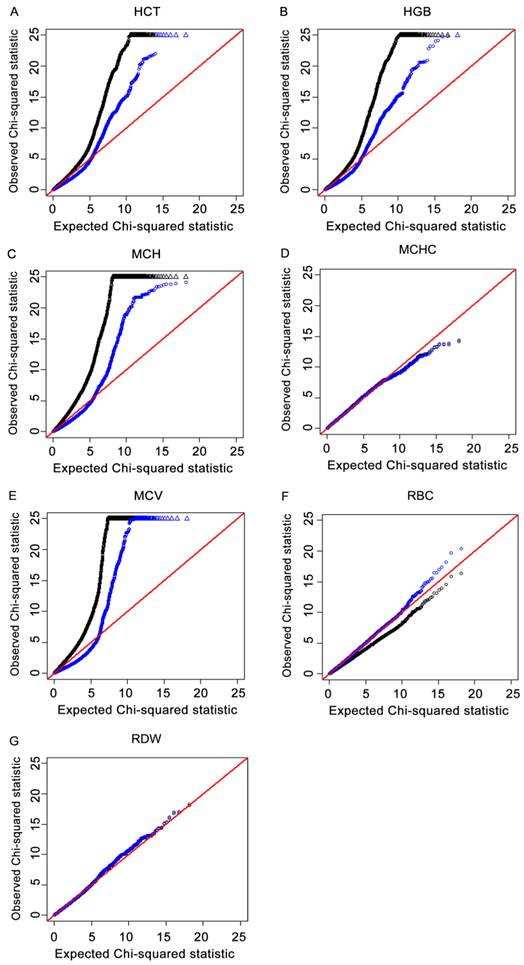
The Q-Q plots that compared the distribution of observed χ2 statistics with the distribution of those expected under the null hypothesis for the seven traits are shown in Fig.1A-1G. The deflation factors λ for HCT, HGB, MCH, MCHC, MCV, RBC and RDW were 1.55, 1.63, 2.05, 1.01, 2.26, 0.80 and 0.99, respectively. From theses plots, it was observed that there were early and dramatic deviations from the null hypothesis expectation for the results without adjustment of deflation factors, which indicated population stratification. Deviations were reduced in the Q-Q plots using the GC adjustment, which suggested proper type I error control. These results indicated that the potential influence of population stratification was reduced to a certain degree by using the GRAMMAR-GC method.
For each of the four immune traits, a quantile-quantile (Q-Q) plot of the results derived without adjustment for the inflation factor (λ) are shown in black. Results derived using the genomic control (GC) procedure are shown in blue. SNPs for which the test statistic exceeds 25 are represented by triangles. 1A, 1B, 1C, 1D, 1E, 1F and 1G refer to Q-Q plots for HCT, HGB, MCH, MCHC, MCV, RBC and RDW, respectively. Results indicated that population stratification was reduced to a certain degree by using the GC method.
Hematological parameters
Hematocrit
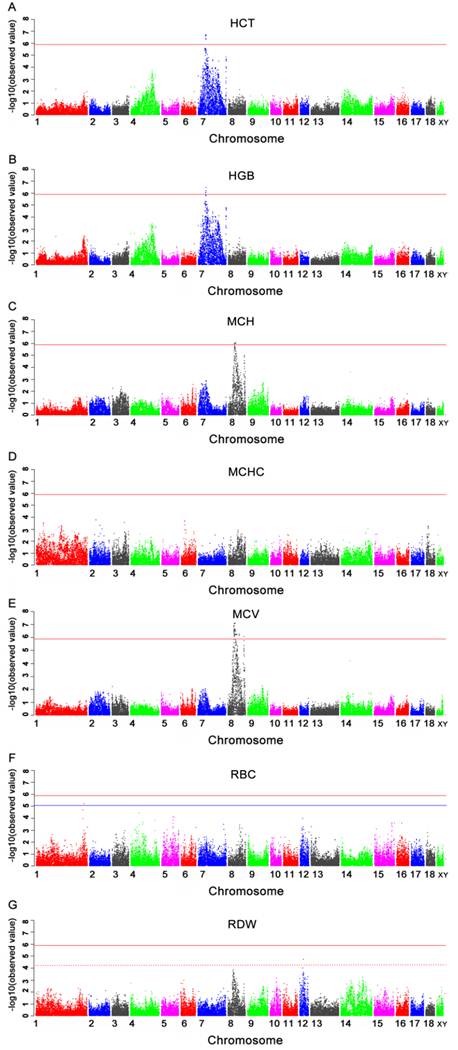
Seven genome-wide significant SNPs for HCT were located within a 1.9 Mb segment (34.6-36.5 Mb) on SSC7 (Table 3 and Fig.2A). Two of these (MARC0039836 and H3GA0020849) were located in an annotated genes signal peptide, CUB domain, EGF-like 3 (SCUBE3). One SNPs H3GA0020739 was located in the predicted gene ENSSSCP00000001643. The remaining SNPs were located 21.3 Kb to 47.7 Kb from the nearest genes.
Manhattan plots of genome-wide association study of seven immune traits. Chromosomes 1-18, X and Y are represented by different colors. 2A, 2B, 2C, 2D, 2E, 2F and 2G refer to plots for HCT, HGB, MCH, MCHC, MCV, RBC, and RDW, respectively. Values above -log10(Observed value) > 5.88 (red horizontal) are of genome-wide significance. Values above -log10(Observed value) > 5.02 (blue horizontal) and -log10(Observed value) > 4.25 (dashed horizontal) are of chromosome-wide significance on SSC1 and 12, respectively.
Significant SNPs associated with HCT, HGB, MCH, RBC and RDW.
| Trait | SNP | Chr.1 | Position2 | Nearest Gene3 | Distance (bp)4 | P-Value |
|---|---|---|---|---|---|---|
| HCT* | H3GA0020739 | 7 | 34556148 | ENSSSCP00000001643 | within | 2.54E-07 |
| H3GA0020765 | 7 | 34755602 | ENSSSCP00000001643 | 47403 | 2.45E-07 | |
| MARC0058766 | 7 | 34803564 | GRM4 | 35680 | 2.10E-07 | |
| MARC0033464 | 7 | 35177641 | ENSSSCP00000001654 | 47720 | 1.94E-07 | |
| MARC0039836 | 7 | 35935629 | SCUBE3 | within | 4.75E-07 | |
| H3GA0020849 | 7 | 36004578 | SCUBE3 | within | 3.99E-07 | |
| ASGA0032595 | 7 | 36497507 | LOC100157423 | 21323 | 4.33E-07 | |
| HGB* | H3GA0020739 | 7 | 34556148 | ENSSSCP00000001643 | within | 9.27E-07 |
| H3GA0020765 | 7 | 34755602 | ENSSSCP00000001643 | 47403 | 6.56E-07 | |
| MARC0058766 | 7 | 34803564 | GRM4 | 35680 | 6.24E-07 | |
| MARC0033464 | 7 | 35177641 | ENSSSCP00000001654 | 47720 | 3.53E-07 | |
| ASGA0032595 | 7 | 36497507 | LOC100157423 | 21323 | 8.92E-07 | |
| MCH* | ALGA0115258 | 8 | 43651607 | KIT | 51004 | 1.02E-06 |
| MARC0039159 | 8 | 46447819 | GUCY1A3 | 42366 | 1.03E-06 | |
| MARC0075425 | 8 | 46706900 | TDO | within | 1.03E-06 | |
| MARC0029724 | 8 | 47035822 | GUCY1B3 | 270324 | 8.83E-07 | |
| RBC† | ALGA0009920 | 1 | 292414075 | CDK5RAP2 | 40830 | 6.15E-06 |
| RDW† | MARC0049315 | 12 | 26022727 | LOC100511101 | within | 1.94E-05 |
| MARC0036181 | 12 | 26162083 | ENSSSCP00000018640 | 12305 | 3.83E-05 |
*Genome-wide significant.
†Chromosome-wide significant.
1SNP location adjusted on chromosome in Sus scrofa Build 10.2 assembly.
2SNP position derived from Sus scrofa Build 10.2 assembly.
3Gene location on the Sus scrofa Build 10.2 assembly. Gene names starting with ENSSSCG represent Ensembl nomenclature while other gene symbols represent GenBank nomenclature.
4SNP designated as in a gene or distance (bp) from a gene region in Sus scrofa Build 10.2 assembly.
Hemoglobin
The results of significant SNPs detected in this GWAS and Manhattan plot for HGB were presented in Table 3 and Fig.2B. Five SNPs were located in the region from 34.6 Mb to 36.5 Mb on pig chromosome 7 (SSC7). Only one SNP (MARC0033464) was located in a predicted gene ENSSSCP00000001643. The remaining SNPs were located 21.3 Kb to 47.7 Kb from the nearest genes.
Mean corpuscular hemoglobin concentration
The SNPs significantly associated with MCH were presented in Table 3 and Manhattan plot was shown in Fig.2C. These SNPs were all located in the region of 43.7-47.0 Mb on chromosome 8 (SSC8). Four significant SNPs were identified in this region, of which, only one SNP (MARC0075425) was located within tryptophan 2,3-dioxygenase (TDO) gene. The most significant SNP (MARC0029724) was located near guanylate cyclase 1, soluble, beta 3 (GUCY1B3) gene.
Mean corpuscular hemoglobin concentration, Red blood cell count and red cell distribution width
Except for MCHC, there were chromosome-wide significant associations of SNPs with RBC and RDW in current study (Table 3 and Fig.2D, 2F and 2G). Only one SNP ALGA0009920, which was located at 292414075 bp on SSC1 and 40.8 Kb away from CDK5 regulatory subunit associated protein 2 (CDK5RAP2) gene, showed significant association with RBC. Two significant SNPs associated with RDW were located in the region from 26.0 Mb to 26.2 Mb on SSC12. The most significant SNP was MARC0049315 and located in a predicted gene LOC100511101.
Mean corpuscular volume
Fifty-five SNPs showed significant association with MCV (Table 4). The Manhattan plot was shown in Fig.2E. These significant SNPs were located within a 31.6 Mb segment (42.2-73.8 Mb) on SSC8. Five of the 55 SNPs were located within regions of known genes, while the remainders were located 0.9 kb to > 1Mb away from the nearest known genes. The most significant SNP MARC0029724 was located 270.3 Kb from the GUCY1B3 gene on SSC8.
Genome-wide significant SNPs associated with MCV.
| SNP | Chr.1 | Position2 | Nearest Gene3 | Distance (bp)4 | P-Value |
|---|---|---|---|---|---|
| DRGA0008574 | 8 | 42150857 | ENSSSCP00000009423 | 112244 | 7.62E-07 |
| ALGA0115258 | 8 | 43651607 | KIT | 51004 | 2.70E-07 |
| ALGA0047798 | 8 | 43730377 | KIT | 129777 | 5.37E-07 |
| MARC0053405 | 8 | 43955459 | KDR | within | 1.40E-07 |
| ALGA0047813 | 8 | 44927836 | TLL1 | 6928 | 1.53E-07 |
| ASGA0038785 | 8 | 45310709 | CPE | 84772 | 1.25E-07 |
| MARC0039159 | 8 | 46447819 | GUCY1A3 | 42366 | 8.66E-08 |
| MARC0075425 | 8 | 46706900 | TDO | within | 8.66E-08 |
| MARC0029724 | 8 | 47035822 | GUCY1B3 | 270324 | 7.98E-08 |
| ALGA0047834 | 8 | 47498650 | ENSSSCP00000009463 | 179502 | 4.03E-07 |
| ALGA0047829 | 8 | 47560329 | ENSSSCP00000009463 | 117823 | 2.11E-07 |
| INRA0029810 | 8 | 49000633 | ENSSSCP00000009465 | 266787 | 3.01E-07 |
| MARC0085941 | 8 | 49027286 | ENSSSCP00000009465 | 240134 | 3.01E-07 |
| MARC0007151 | 8 | 50562134 | LOC100517409 | 64593 | 2.68E-07 |
| ALGA0108841 | 8 | 50670176 | LOC100517409 | within | 2.91E-07 |
| MARC0063673 | 8 | 51018121 | ENSSSCP00000009476 | 148401 | 4.26E-07 |
| MARC0038980 | 8 | 51070662 | LOC100517409 | 388568 | 3.40E-07 |
| ASGA0038810 | 8 | 51093615 | ENSSSCP00000009476 | 223895 | 5.35E-07 |
| INRA0029816 | 8 | 51235665 | ENSSSCP00000009476 | 365945 | 5.35E-07 |
| MARC0056888 | 8 | 51623467 | ENSSSCP00000009476 | 753747 | 5.51E-07 |
| ALGA0047879 | 8 | 52301582 | NONE | >1Mb | 6.15E-07 |
| DBWU0000619 | 8 | 52565396 | NONE | >1Mb | 5.94E-07 |
| MARC0087739 | 8 | 52958719 | ENSSSCP00000009478 | 635959 | 6.15E-07 |
| MARC0071439 | 8 | 53555323 | ENSSSCP00000009478 | 39600 | 2.80E-07 |
| MARC0024662 | 8 | 54201619 | O62706 | 310552 | 8.40E-07 |
| MARC0076384 | 8 | 54466796 | O62706 | 45375 | 7.44E-07 |
| ALGA0047889 | 8 | 55181102 | LOC100518673 | 32491 | 7.36E-07 |
| INRA0029827 | 8 | 55332803 | ENSSSCP00000009481 | 22346 | 6.15E-07 |
| MARC0017124 | 8 | 55529571 | LOC100517956 | 31601 | 6.15E-07 |
| ALGA0047893 | 8 | 55690977 | ENSSSCP00000009483 | 29672 | 6.15E-07 |
| ALGA0047912 | 8 | 57588232 | HOPX | 40950 | 3.42E-07 |
| ALGA0047931 | 8 | 58493225 | LOC100523263 | 81173 | 6.15E-07 |
| ASGA0100508 | 8 | 59002762 | REST | 13690 | 6.15E-07 |
| MARC0041089 | 8 | 59080961 | IGFBP7 | within | 6.15E-07 |
| MARC0036671 | 8 | 59578284 | IGFBP7 | 438883 | 6.15E-07 |
| ALGA0047954 | 8 | 59813269 | IGFBP7 | 673868 | 6.15E-07 |
| MARC0020164 | 8 | 60101923 | IGFBP7 | 962522 | 6.15E-07 |
| DRGA0008593 | 8 | 60847500 | NONE | >1Mb | 2.30E-07 |
| H3GA0024898 | 8 | 61863927 | NONE | >1Mb | 2.30E-07 |
| H3GA0024902 | 8 | 63746669 | ENSSSCP00000009510 | 504438 | 2.30E-07 |
| H3GA0024903 | 8 | 64355935 | ENSSSCP00000009510 | within | 2.30E-07 |
| MARC0051033 | 8 | 66027078 | NONE | >1Mb | 2.88E-07 |
| DRGA0008614 | 8 | 68524361 | ENSSSCP00000009514 | 984471 | 5.75E-07 |
| MARC0005619 | 8 | 70772472 | ENSSSCP00000009529 | 69642 | 5.55E-07 |
| MARC0070956 | 8 | 70907832 | ENSSSCP00000009529 | 205002 | 5.55E-07 |
| INRA0029885 | 8 | 71603584 | LOC100517174 | within | 6.35E-07 |
| ASGA0038909 | 8 | 72656941 | ADAMTS3 | within | 3.80E-07 |
| ASGA0038910 | 8 | 72893479 | ADAMTS3 | 112533 | 5.57E-07 |
| ASGA0038912 | 8 | 73265823 | LOC100520317 | 77758 | 5.57E-07 |
| MARC0029095 | 8 | 73279054 | LOC100520317 | 64527 | 7.58E-07 |
| ALGA0048087 | 8 | 73286056 | LOC100520317 | 57525 | 5.57E-07 |
| DIAS0000495 | 8 | 73355105 | LOC100520317 | within | 5.57E-07 |
| MARC0109837 | 8 | 73611944 | ALB | 903 | 5.57E-07 |
| ASGA0100173 | 8 | 73675216 | ALB | 45136 | 5.57E-07 |
| DIAS0002183 | 8 | 73783363 | AFP | within | 8.26E-07 |
1SNP location adjusted on chromosome in Sus scrofa Build 10.2 assembly.
2SNP position derived from Sus scrofa Build 10.2 assembly.
3Gene location on the Sus scrofa Build 10.2 assembly. Gene names starting with ENSSSCG represent Ensembl nomenclature while other gene symbols represent GenBank nomenclature.
4SNP designated as in a gene or distance (bp) from a gene region in Sus scrofa Build 10.2 assembly.
Discussion
In the present research, genome-wide association studies were performed for seven hematological parameters. A total of 62 SNPs showed significant association with four hematological parameters (HCT, HGB, MCH and MCHC) in this GWAS. Although some QTLs for MCHC be mapped to chromosomes 2, 3, 4, 6, 7, 9, 11, 14, 16, 17 and X (http://www.animalgenome.org/cgi-bin/QTLdb/SS/index), no SNPs was found to be associated with this trait significantly in our work. Comparing to the population size in human GWAS (over 10,000), a small population (430 animals) was used in this work. The limitation of population size might decrease the power of GWAS.
The QTLs for HCT have been located on pig chromosomes 1, 2, 3, 4, 5, 6, 7, 8, 10, 12, 13 and 18, and for HGB on chromosomes 1, 2, 3, 4, 5, 7, 8, 9, 10, 12, 13, 16 and X [20-23]. In this study, significantly associated SNPs for HCT and HGB were detected within regions on pig chromosome 7 (SSC7). SSC7 has been widely investigated and the QTLs for HCT and HGB have been located in the regions of 27.65-101.73 Mb and 12.01-72.54 Mb [22, 23]. In contrast with previous studies, these significant SNPs for the two traits have been located to a shorter region (34.6-36.5 Mb) on SSC7 in this study. However, there are no reports for association of these SNPs with HCT and HGB in the pig previously. When the genome-wide significance level was adopted, the significant associated SNPs for HCT were located in the region from 34.6 Mb to 36.5 Mb. Two SNPs (MARC0039836 and H3GA0020849), which were located within intron of SCUBE3 gene, were detected to associate with HCT. The SCUBE3 gene may act locally and/or distantly through a proteolytic mechanism, and may play an important role in bone cell biology [24]. In addition, two significant SNP, MARC0058766 for HCT and MARC0058766 for HGB, in this study were near the glutamate receptor, metabotropic 4 (GRM4) gene. The GRM4 is preferentially localized in presynaptic terminals and negatively regulates glutamate release [25] and adaptive immunity and modulates restrains neuroinflammation [26]. However, the association of SNP in the two genes with hematological parameters was not reported previously and need to be studied further.
The QTLs for MCH have been located on pig chromosomes 2, 3, 6, 7, 8, 9, 10, 11, 12, 13, 14, 16 and X, and for MCV on chromosomes 3, 4, 6, 7, 8, 9, 10, 12 and 13 [20-23]. In this study, the significantly associated SNPs for MCH and MCV were located in regions of 43.7-47.0 Mb and 42.2-73.8 Mb on pig chromosome 8 (SSC8), respectively. Four significant SNPs for MCH were located in the vicinity of, or within, four annotated genes. Fifty-five significant SNPs for MCV were located in the vicinity of, or within, 13 annotated genes. Five SNPs MARC0053405, MARC0075425, MARC0041089, ASGA0038909 and DIAS0002183 were found within five annotated genes kinase insert domain receptor (KDR), TDO, insulin-like growth factor binding protein 7 (IGFBP7), ADAM metallopeptidase with thrombospondin type 1 motif, 3 (ADAMTS3) and alpha-fetoprotein (AFP), respectively. Through checking the annotated gene functions, except for KDR gene, these genes were not found to affect erythropoiesis. Vascular endothelial growth factor (VEGF) and its receptor [fetal liver kinase 1 (Flk-1)/kinase insert domain-containing receptor (KDR) play an important role in vascular permeability and tumor angiogenesis [27]. Binding with KDR, VEGF can also modulate erythropoiesis through regulation of adult hepatic erythropoietin synthesis [28]. So, KDR gene could be an important candidate gene for MCV to be studied further. Eight genes (c-kit (KIT), tolloid-like 1 (TLL1), carboxypeptidase E (CPE), guanylate cyclase 1, soluble, alpha 3 (GUCY1A3), GUCY1B3, HOP homeobox (HOPX), RE1-silencing transcription factor (REST) and albumin (ALB) ) were found near the significant SNPs for MCV. For these genes, it was notable that only KIT gene could relate to erythropoiesis from gene function information. The KIT gene, also known as c-kit or CD117, encodes a tyrosine kinase (mast/stem cell growth factor receptor) essential for the development of hematopoietic stem cells and melanocytes in the human, mouse and pig [29-32] and has been shown to be expressed in hemoatopoietic cells [32]. Many reports have demonstrated KIT gene mutation association with the dominant white (I) coat color in the pig [34-36]. Moreover, a strong association of the KIT locus with blood phenotypes (MCH and MCV) has been confirmed using dense single nucleotide polymorphism marker data on SSC 8 and marker-assisted association tests [37]. Johansson et al. [38] found that pigs with different KIT genotypes differ in hematological parameters and homozygous dominant white (I/I) piglets had larger erythrocytes with lower hemoglobin concentrations. However, Fésüs et al. [39] found that there was no significant association between porcine KIT mutations and hematological parameters. That blood samples were taken at different ages in the first and second farrowing might be the reason of no significant association in their work. Haase et al. [40] did not detect any statistically significant differences in peripheral blood parameters between different KIT genotypic horses due to the limited statistical power in the small cohorts (15 dominant white and 18 solid-coloured horses). Therefore, further investigation is required to study the influence of the KIT gene on hematological parameters in pigs.
Although no QTL was mapped on SSC1 (http://www.animalgenome.org/cgi-bin/QTLdb/SS/index), one SNP ALGA0009920 showed chromosome-wide significant association with RBC in this study. The CDK5 regulatory subunit associated protein 2 (CDK5RAP2) gene is near the SNP. CDK5RAP2 is a γ-tubulin complex-binding protein and functions in γ-tubulin attachment to centrosomes [41-43]. It localizes to the Golgi complex in an ATP- and centrosome-dependent manner and associates with Golgi membranes independently of microtubules [44]. While no report about this gene was found to relate to RBC previously. For RDW, the QTL was mapped to the region of 26.4-41.9 Mb on SSC12 [21]. Near the QTL region, two significant SNPs MARC0049315 and MARC0036181 were located within the region 26.0-26.2 Mb on SSC12 in the present work. However, no annotated gene was found in this region. So, it is necessary to study the two traits in a larger population in future.
There are certain logic relationships among red blood cell related parameters. Hemoglobin (HGB) equals red blood cell count (RBC) multiplied by mean corpuscular hemoglobin (MCH). Red blood cell count (RBC) is a variate instead of a constant. And one SNP ALGA0009920 on SSC1 was found to be chromosome-wide significantly associated with RBC in this work. Moreover, the phenotypic correlations between HGB and MCH was low (0.28) in this research (data not shown). As a result of significant SNPs for HGB located on SSC7 while those for MCH located on SSC8, different genetic mechanisms and a certain interaction might exist between HGB and MCH.
Population stratification is a confounding component known to affect GWAS results. False associations could result from the use of two different genetic parental lines, a complex population structure due to the high level of relatedness and absence of pedigree information [45]. In this study, GRAMMAR-GC analysis was used to consider within-family and between-family variation. Trait phenotypes were adjusted for the fixed and random effects and the test statistic was adjusted by the inflation factor. In this work, Q-Q plots were used to assess the effectiveness of GC method for population stratification. Results indicated that this method could adjust population stratification and the F2 intercross population design was suitable for use in this GWAS.
In summary, 62 genome-wide significant and three chromosome-wide significant SNPs associated with hematological parameters were detected in this GWAS. Many of the SNP effects overlapped with previously reported QTL regions in the pig, providing evidence towards confirmation of QTL effects. Furthermore, these results appeared to narrow down the regions compared with previously described QTL intervals. Therefore, these results are of importance for identification of exact QTL locations using the much improved map resolution provided by analysis of this 60k SNP panel. To date, this type of GWAS study of hematological parameters has not been conducted in pigs and these results may lead to a better understanding of the molecular mechanisms of hematological parameters.
Acknowledgements
This research was supported by the National Key Technology R&D Program of China (No.2011BAD28B01), the earmarked fund for Modern Agro-industry Technology Research System, and Chinese Academy of Agricultural Sciences Foundation (No.2011cj-5 and 2012ZL069).
Competing Interests
The authors have declared that no competing interest exists.
References
1. Müller M, Brem G. Disease resistance in farm animals. Experientia. 1991;47:923-34
2. Oddgeirsson O, Simpson SP, Morgan ALG. et al. Relationship between the bovine major histocompatibility complex (BoLA), erythrocyte markers and susceptibility to mastitis in Icelandic cattle. Anim Genet. 1988;19:11-6
3. Chen Y, Qin S, Ding Y. et al. Reference values of biochemical and hematological parameters for Guizhou minipigs. Exp Biol Med. 2011;236:477-82
4. Qiu JH. Detection of haemal physiological and biochemical parameters in Putian black pigs. J Mountain Agric Biol. 2009;28:317-23
5. Qiu X, Liu P, Zhang Q. et al. A comparative study on the normal values of hematology between Jianhe Xiang pig and Landrace. J Mountain Agric Biol. 2005;24:209-12
6. Pearson TA, Manolio TA. How to interpret a genome-wide association study. JAMA. 2008;299:1335-44
7. Hirschhorn JN, Daly MJ. Genome-wide association studies for common diseases and complex traits. Nat Rev Genet. 2005;6:95-108
8. Liu W, Li D, Liu J. et al. A genome-wide SNP scan reveals novel loci for egg production and quality traits in white leghorn and brown-egg dwarf layers. PLoS ONE. 2011;6:e28600
9. Gu X, Feng C, Ma L. et al. Genome-wide association study of body weight in chicken F2 resource population. PLoS ONE. 2011;6:e21872
10. Bolormaa S, Neto LRP, Zhang YD. et al. A genome-wide association study of meat and carcass traits in Australian cattle. J Anim Sci. 2011;89:2297-309
11. Bouwman AC, Bovenhuis H, Visker MH. et al. Genome-wide association of milk fatty acids in Dutch dairy cattle. BMC Genet. 2011;12:43
12. Jiang L, Liu J, Sun D. et al. Genome-wide association studies for milk production traits in Chinese Holstein population. PLoS ONE. 2010;5:e13661
13. Fan B, Onteru SK, Du ZQ. et al. Genome-wide association study identifies loci for body composition and structural soundness traits in pigs. PLoS ONE. 2011;6:e14726
14. Marshall TC, Slate J, Kruuk LE. et al. Statistical confidence for likelihood-based paternity inference in natural populations. Mol Ecol. 1998;7:639-55
15. Aulchenko YS, de Koning DJ, Haley C. Genome-wide rapid association using mixed model and regression: a fast and simple method for genome-wide pedigree-based quantitative trait loci association analysis. Genetics. 2007;177:577-85
16. Amin N, van Duijn CM, Aulchenko YS. A genomic background based method for association analysis in related individuals. PLoS ONE. 2007;2:e1274
17. Hao K, Li C, Rosenow C. et al. Detect and adjust for population stratification in population-based association study using genomic control markers: an application of Affymetrix Genechip Human Mapping 10k array. Eur J Hum Genet. 2004;12:1001-6
18. Madsen P, Sørensen P, Su G. et al. DMU- a package for analyzing multivariate mixed models. In 8th World Congress on Genetics Applied to Livestock Production. Brasil. 2006
19. Yang Q, Cui J, Chazaro I. et al. Power and type I error rate of false discovery rate approaches in genome-wide association studies. BMC Genet. 2005;6(suppl 1):S134
20. Wattrang E, Almqvist M, Johansson A. et al. Confirmation of QTL on porcine chromosomes 1 and 8 influencing leukocyte numbers, hematological parameters and leukocyte function. Anim Genet. 2005;36:337-45
21. Gong YF, Lu X, Wang ZP. et al. Detection of quantitative trait loci affecting hematological traits in swine via genome scanning. BMC Genet. 2010;11:56
22. Reiner G, Fischer R, Hepp S. et al. Quantitative trait loci for red blood cell traits in swine. Anim Genet. 2007;38:447-52
23. Zou Z, Ren J, Yan X. et al. Quantitative trait loci for porcine baseline erythroid traits at three growth ages in a White Duroc × Erhualian F(2) resource population. Mammal Genom. 2008;19:640-6
24. Wu BT, Su YH, Tsai MT. et al. A novel secreted, cell-surface glycoprotein containing multiple epidermal growth factor-like repeats and one CUB domain is highly expressed in primary osteoblasts and bones. J Biol Chem. 2004;279:37485-90
25. Pin JP, Duvoisin R. The metabotropic glutamate receptors: structure and functions. Neuropharmacology. 1995;34:1-26
26. Fallarino F, Volpi C, Fazio F. et al. Metabotropic glutamate receptor-4 modulates adaptive immunity and restrains neuroinflammation. Nat Med. 2010;16:897-902
27. Neufeld G, Cohen T, Gengrinovitch S. et al. Vascular endothelial growth factor (VEGF) and its receptors. FASEB J. 1999;13:9-22
28. Tam BYY, Wei K, Rudge JS. et al. VEGF modulates erythropoiesis through regulation of adult hepatic erythropoietin synthesis. Nat Med. 2006;12:793-800
29. Sakurai M, Zhou JH, Ohtaki M. et al. Assignment of c-KIT gene to swine chromosome 8p12-p21 by fluorescence in situ hybridization. Mammal Genom. 1996;7:397
30. Wan-sheng L, Ingrid H, Ingemar G. et al. Mapping of the porcine erythropoietin gene to chromosome 3p16-pl5 and ordering of four related subclones by fiber-FISH and DNA-combing. Hereditas. 1998;128:77-81
31. Fahrenkrug SC, Campbell EM, Vallet JL. et al. Physical assignment of the porcine erythropoietin receptor gene to SSC2. Anim Genet. 2000;31:69-70
32. Escribano L, Ocqueteau M, Almeida J. et al. Expression of the c-kit (CD117) molecule in normal and malignant hematopoiesis. Leuk Lymphoma. 1998;30:459-66
33. Johansson Moller M, Chaudhary R, Hellmén E. et al. Pigs with the dominant white coat color phenotype carry a duplication of the KIT gene encoding the mast/stem cell growth factor receptor. Mamm Genom. 1996;7:822-30
34. Johansson M, Ellegren H, Marklund L. et al. The gene for dominant white color in the pig is closely linked to ALB and PDGRFRA on chromosome 8. Genomics. 1992;14:965-9
35. Marklund S, Kijas J, Rodriguez-Martinez H. et al. Molecular basis for the dominant white phenotype in the domestic pig. Genom Res. 1998;8:826-33
36. Giuffra E, Tornsten A, Marklund S. et al. A large duplication associated with dominant white color in pigs originated by homologous recombination between LINE elements flanking KIT. Mammal Genom. 2002;13:569-77
37. Cho IC, Park HB, Yoo CK. et al. QTL analysis of white blood cell, platelet and red blood cell-related traits in an F2 intercross between Landrace and Korean native pigs. Anim Genet. 2011;42:621-6
38. Johansson A, Pielberg G, Andersson L. et al. Polymorphism at the porcine Dominant white/KIT locus influence coat color and peripheral blood cell measures. Anim Genet. 2005;36:288-96
39. Fésüs L, Zsolnai A, Komlósi I. Influence of porcine coat color genotypes on hematological parameters, piglet birth weight and body weight gain until weaning. J Anim Breed Genet. 2005;122:127-30
40. Haase B, Obexer-Ruff G, Dolf G. et al. Hematological parameters are normal in dominant white Franches-Montagnes horses carrying a KIT mutation. Vet J. 2010;184:315-7
41. Bond J, Roberts E, Springell K. et al. A centrosomal mechanism involving CDK5RAP2 and CENPJ controls brain size. Nat Genet. 2005;37:353-5
42. Fong KW, Choi YK, Rattner JB. et al. CDK5RAP2 is a pericentriolar protein that functions in centrosomal attachment of the gamma-tubulin ring complex. Mol Biol Cell. 2008;19:115-25
43. Graser S, Stierhof YD, Nigg EA. Cep68 and Cep215 (Cdk5rap2) are required for centrosome cohesion. J Cell Sci. 2007;120:4321-31
44. Wang Z, Wu T, Shi L. et al. Conserved motif of CDK5RAP2 mediates its localization to centrosomes and the golgi complex. J Biol Chem. 2010;285:22658-65
45. Minozzi G, Buggiotti L, Stella A. et al. Genetic loci involved in antibody response to mycobacterium avium ssp. paratuberculosis in Cattle. PLoS ONE. 2010;5:e11117
Author biography
Dr Longchao Zhang is one of the members of Pig Science Group, Institute of Animal Science, Chinese Academy of Agricultural Sciences. Dr Zhang is a research scientist with 10 years of research experience in the animal science area with support by fund of National Key Technology R&D Program of China (2008-2010), National Key Technology R&D Program of China (2011-2015), and Chinese Academy of Agricultural Sciences Foundation (2007-2013). He focuses on the research for reproduction, meat quality traits, and health in pig.
Dr Lixian Wang heads the Pig Science Group, which focuses on pig breeding and the molecular mechanisms of porcine meat quality, reproduction, health, and production. The group is housed in Institute of Animal Science, Chinese Academy of Agricultural Sciences. Dr Wang is a famous research scientist in China and with support by fund of National Key Technology R&D Program of China (2006-2008, 2008-2010, 2011-2015), National High-Tech Research and Development Program (2008-2010), earmarked fund for Modern Agro-industry Technology Research System.
Dr Chuduan Wang is currently a professor in Animal Genetics and Breeding at China Agricultural University, his research interests are swine genetics and breeding, especially genetics effection on pork quality improvement and disease resistance, and pig production and management.
Dr Weizhen Luo is a research scientist with 7 years of research experience in animal genetics and breeding. Dr Luo has a special interest in simulation study of breeding schemes for farm animals, microarray data analysis and bioinformatics. Currently she focuses on the data analysis of genome-wide association study of the resource population.
Mr Shaokang Chen is a Ph.D candidate and has been engaged in pig genetics and breeding research, and has especially accumulated a wealth of experience in the study that elucidates the genetic and molecular mechanism in pig performance. Recently he focuses on the research in swine health breeding and Immunogenetics.
Mr Duxue Cheng is a Ph.D candidate and has been engaged in pig genetics and breeding research for 9 years, and focus on the genetic and molecular mechanism in pig performance. Recently he focuses on the work in porcine meat quality traits.
![]() Corresponding author: Chuduan Wang, College of Animal Science and Technology, China Agricultural University, Beijing 100193, China. Fax: +86-10-62732731. Email: wangchuduancom. Lixian Wang, Institute of Animal Science, Chinese Academy of Agricultural Sciences, Beijing 100193, China. Fax: +86-10-62818771. Email: iaswlxnet. Longchao Zhang, Institute of Animal Science, Chinese Academy of Agricultural Sciences, Beijing 100193, China. Fax: +86-10-62818771. Email: lczhangnet.cn.
Corresponding author: Chuduan Wang, College of Animal Science and Technology, China Agricultural University, Beijing 100193, China. Fax: +86-10-62732731. Email: wangchuduancom. Lixian Wang, Institute of Animal Science, Chinese Academy of Agricultural Sciences, Beijing 100193, China. Fax: +86-10-62818771. Email: iaswlxnet. Longchao Zhang, Institute of Animal Science, Chinese Academy of Agricultural Sciences, Beijing 100193, China. Fax: +86-10-62818771. Email: lczhangnet.cn.