Impact Factor ISSN: 1449-2288

 Global reach, higher impact
Int J Biol Sci 2014; 10(2):200-211. doi:10.7150/ijbs.7301 This issue Cite
Research Paper
A Cryptic Species of the Tylonycteris pachypus Complex (Chiroptera: Vespertilionidae) and Its Population Genetic Structure in Southern China and nearby Regions
Chujing HUANG1*, Wenhua YU1*, Zhongxian XU1, Yuanxiong QIU1, Miao CHEN1, Bing QIU1, Masaharu MOTOKAWA2, Masashi HARADA3, Yuchun LI4 ![]() , Yi WU1
, Yi WU1 ![]()
1. College of Life Sciences, Guangzhou University, Guangzhou 510006, China.
2. The Kyoto University Museum, Kyoto 606-8501, Japan.
3. Laboratory Animal Center, Graduate School of Medicine, Osaka City University, Osaka 545-8585, Japan.
4. Marine College, Shandong University (Weihai), Weihai 264209, China.
* These authors contribute to this work equally.
Received 2013-7-30; Accepted 2014-1-9; Published 2014-2-5
Abstract
Three distinct bamboo bat species (Tylonycteris) are known to inhabit tropical and subtropical areas of Asia, i.e., T. pachypus, T. robustula, and T. pygmaeus. This study performed karyotypic examinations of 4 specimens from southern Chinese T. p. fulvidus populations and one specimen from Thai T. p. fulvidus population, which detected distinct karyotypes (2n=30) compared with previous karyotypic descriptions of T. p. pachypus (2n=46) and T. robustula (2n=32) from Malaysia. This finding suggested a cryptic Tylonycteris species within T. pachypus complex in China and Thailand. Morphometric studies indicated the difficulty in distinguishing the cryptic species and T. p. pachypus from Indonesia apart from the external measurements, which might be the reason for their historical misidentification. Based on 623 bp mtDNA COI segments, a phylogeographic examination including T. pachypus individuals from China and nearby regions, i.e., Vietnam, Laos, and Cambodia, was conducted to examine the population genetic structure. Genealogical and phylogeographical results indicated that at least two diverged lineages existed in these regions (average 3.4 % of Kimura 2-parameter distances) and their population structure did not match the geographic pattern. These results suggested that at least two historical colonizations have occurred by the cryptic species. Furthermore, through integration of traditional and geometric morphological results, morphological differences on zygomatic arches, toothrows and bullae were detected between two lineages in China. Given the similarity of vegetation and climate of Guangdong and Guangxi regions, we suggested that such differences might be derived from their historical adaptation or distinct evolutionary history rather than the differences of habitats they occurred currently.
Keywords: cryptic species, karyotypic examination, morphometric studies, population genetic structure, Tylonycteris.
Introduction
Bamboo bats (genus Tylonycteris, Chiroptera, Vespertilionidae) are a group of small bats with a remarkably flattened braincase, small size, light weight, and unique well-developed thumbpads at the bases of the first fingers and flat footpads on hindfeet. They have the peculiar habit of roosting inside hollow bamboo stems. Their dental formula is  [1-3]. Three species are recognized at present, which are found in tropical and subtropical Asia and the Ambon Islands, i.e., T. pachypus (Temminck, 1840) [1], T. robustula Thomas, 1915 [2], and T. pygmaeus Feng et al. 2008 [3]. Among them, greater bamboo bat (T. robustula) is the largest species with dark and more gray pelage, and T. pygmaeus, a recently recognized species, is the smallest one in Tylonycteris, while the lesser bamboo bat (T. pachypus) is a medium-sized species with a distinct golden brown pelage [3, 4]. Although several forms of T. pachypus have been attributed historically, e.g., T. fulvidus, T. meyeri, and T. aurex [4], after examinations of their external and skull features Tate assigned them to a single T. pachypus complex [5]. Subsequently, in consideration of their smaller size relative to T. robustula and their distinct supraorbital tubercles, all members of this complex were condensed into one species, namely T. pachypus [4, 6-11]. Nowadays, five subspecies of T. pachypus are proposed [3, 4, 12, 13]: T. p. pachypus (Temminck, 1840) originally described from Java [1]; T. p. fulvidus (Blyth, 1859) from Burma [14]; T. p. meyeri Peters, 1872 from Philippines [15]; T. p. aurex Thomas, 1915 from Bombay, India [2]; T. p. bhaktii Oei, 1960 from Lombok [16]. Individuals from southern China, Vietnam, Laos, Thailand, and Burma are often referred to as T. p. fulvidus, which is a large-sized form within the T. pachypus that is similar to T. p. aurex from southern India, although it has a more drab brown appearance and a relatively shorter forearm [3, 4, 12, 13]. However, many puzzles are still unsolved, including the validity of this subspecies, karyotype of T. p. fulvidus, morphological differences between T. p. pachypus and T. p. fulvidus from China, and their population genetic structure.
In this study, a karyotypic examination of T. p. fulvidus individuals from two Chinese populations (Guangdong and Guangxi provinces) and one Thai population was conducted, and a cryptic species was identified by its unique chromosomal characteristics when compared with previous study that referred to the karyotype of other Tylonycteris [3]. Secondly, a phylogeographic analysis was performed for the examination of population genetic structure of T. p. fulvidus from China and nearby regions including Vietnam, Laos, and Cambodia. Thirdly, morphometric comparisons using individuals of T. p. fulvidus from China and T. p. pachypus from Malaysia as well as the T. p. fulvidus individuals from two distinct lineages were conducted to investigate their morphological differences.
Material and methods
Sampling
Twenty-four specimens of T. p. fulvidus were collected from Guangdong and Guangxi provinces in China between 2000 and 2012 (Table 1). All of the voucher specimens were adult stage according to the stage of epyphyseal-diapyseal fusion, and were further preserved in 70-100% ethanol and deposited at the College of Life Sciences, Guangzhou University, Guangdong, for further morphometric and phylogeographic analyses. To analyze the karyotype, T. p. fulvidus were collected in Guangdong province (2 males, 1 female) and in Guangxi province (1 male), and T. robustula was collected in Guangxi province (2 males, 5 females). In addition, one T. p. fulvidus was collected from Chiangmai, Thailand on 1982 (no. 11276).
Haplotype diversity, nucleotide diversity, and haplotypes for different populations of Tylonycteris pachypus fulvidus.
| Population | N | Vouch number of specimen | Number of | Haplotype diversity | Nucleotide diversity | Haplotype (label of related individuals) |
|---|---|---|---|---|---|---|
| haplotypes | (h±SD) | (π±SD) | ||||
| Guangdong (China) | 16 | 2000156, 04353♀, 06219, 09339♀, 09340, 09343, 01001♀, 02001, 0437♀, 0439, 0440, 2000-09, 10199♀, 12173, 12174♀, 12175 | 4 | 0.81±0.13 | 0.003±0.002 | TP-H5, TP-H6, TP-H7, TP-H17 |
| Guangxi (China) | 8 | 10221, 10222, 10223, 10224, 10225, 10226♀, 10227♀, 10230 | 5 | 0.93±0.12 | 0.007±0.005 | TP-H2, TP-H8, TP-H9, TP-H14, TP-H16 |
| Vietnam | - | - | 6 | - | 0.017±0.010 | TP-H1, TP-H2, TP-H3, TP-H4, TP-H9, TP-H10 |
| Laos | - | - | 4 | - | 0.016±0.011 | TP-H9, TP-H11, TP-H13, TP-H15 |
| Cambodia | - | - | 1 | - | - | TP-H12 |
a Specimens that were amplified successfully are labeled in bold.
Karyotypic analyses
Chromosomal preparations were made from tail and lung tissue cultures following Harada and Yosida [17]. Differential staining using the G-band and C-band techniques was applied following Seabright [18] and Sumner [19], respectively. The nomenclature of chromosomes followed Levan et al. [20]. The diploid number (2n) and the total number of autosomal arms (FN) were determined by observing 30 metaphase cells in each specimen.
Phylogeographic analyses
All of the specimens were used in the phylogeographic analyses to infer the population genetic structure of T. p. fulvidus from China, although only 7/15 Guangdong specimens and 6/8 Guangxi specimens were amplified and sequenced successfully (Table 1). In addition, three T. robustula specimens from Guangxi were also included in genealogic analysis in this study (no. 08004, 07345 and 07346). Genomic DNA was isolated from approximately 20 mg of muscle tissue using a Universal Genomic DNA Extraction Kit (TAKARA). A partial segment of mtDNA cytochrome oxidase subunit I gene (COI), an acknowledged barcoding region used for species and subspecies identification, was amplified by polymerase chain reaction (PCR) using the primers that deposited in NBCI-nt: F (5'- TGT AAA ACG ACG GCC AGT TCT CAA CCA ACC ACA AAG ACA TTG G -3') and R (5'- CAG GAA ACA GCT ATG ACT AGA CTT CTG GGT GGC CAA AGA ATC A -3'). PCRs were performed using a final volume of 50 μl, which contained approximately 5.0-50 ng DNA, 0.2 mM of each dNTP, 0.4 mM of each primer, 1.5 mM MgCl2, and 2.0 U Taq polymerase (TAKARA), using the manufacturer's buffer. Amplification was performed using a MyCycler Thermal Cycler (BioRad) as follows: 94C for 4 min; 37 cycles at 94C for 30 s, 50C for 30 s, and 72C for 1 min; and 72C for 5 min. DNA sequencing was performed using an ABI PRISM 3700 DNA Analyzer (Applied Biosystems). The chromatograms were checked and edited using GENEIOUS [21] and aligned with MUSCLE [22]. All sequences of T. pachypus and T. robustula were blasted against the NCBI-nt database with GENEIOUS [21] and only matching sequences with a max score value of >1,000 were included in subsequent phylogeographic and genealogic analysis.
To verify the monophyly of Tylonycteris species and T. p. fulvidus Chinese population, all matching sequences from nearby regions were included, i.e., sequences from Vietnam, Laos, and Cambodia (GenBank Accession Numbers: GU684765, GU684774, GU684806, HM541981-HM541989, HM914916, HM914920, HM914921, GU684753, GU684758, GU684766, GU684779, GU684781, HM541990-HM542004, HM914929, and HM914947). The genealogical relationships were reconstructed among all uniquely identified sequences, using the COI segments from Myotis yumanensis and Pipistrellus subflavus (GenBank accession numbers GU723138 and GU723142) as outgroups. A maximum likelihood (ML) phylogeny was reconstructed with RAxML V7.2.7 [23] using 500 bootstrap replicates via the CIPRES Science Gateway V3.1 [24]. A neighbor-joining (NJ) tree was constructed with MEGA 4 [25] using the approximate model selected by Modeltest 3.06 [26]. A Bayesian analysis was conducted with MrBayes 3.1.2 [27]. Convergence was indicated when the standard deviation (SD) of the split frequencies was < 0.01 [27]. Chains were sampled every 2,000 generations. The starting trees were generated randomly and the prior probability indicated that all trees were equally likely. Divergence times were estimated with COI sequences using Bayesian MCMC as implemented in BEAST [28]. Because no direct estimates of COI mutation rate are available for bats and no appropriate fossil record that could be used for divergence time estimation, we estimated minimum and maximum divergence times using two substitution rates, 2% and 5% per million years [29]. Similar estimates of 2.6% for phyllostomid bats [30], 2.3-5% in Carollia [31], and 4% from fossil calibrations [32] have been suggested. The nucleotide substitution model was the same as that used for phylogenetic analysis. Two MCMC chains were run for 10,000,000 generations with a burnin of 2,500,000. The means and 95% confidence interval (CI) of the divergence times were estimated from two samplings using Tracer v.1.4.1 [33], and the trees were summarized using TreeAnnotator v.1.4.8 [28].
The haplotype number, haplotype diversity (h), and nucleotide diversity (π) were calculated using ARLEQUIN 3.01 [34]. A hierarchical analysis of molecular variation (AMOVA) [34] was performed in ARLEQUIN using 1,000 permutations to estimate the partitioning of genetic variation among different populations of T. p. fulvidus. To overcome the pitfalls of traditional phylogenetic reconstruction in intra-species phylogenetic studies and to explore the phylogeographic history of T. p. fulvidus, a haplotype network was also constructed using the statistical parsimony method [35] in TCS [36].
Morphometric analyses
The following external and cranial measurements were taken using electronic vernier calipers (Guogen, Serial number: 00000315) during the morphometric analyses: length of the hind foot (HF), ear length (E), forearm length (FA), tibia length (TB), length of third digit metacarpal (III0), length of fourth digit metacarpal (IV0), length of fifth digit metacarpal (V0), greatest length of skull (GLS), condylobasal length (CBL), condylocanine length (CCL), height of braincase (HBC), breadth of braincase (BBC), height of occipital (HOC), occipital condyle width (OW), zygomatic width (ZW), interorbital breadth (IOB), palatal bridge length (PBL), upper tooth row (C-M3), width of the crowns of the upper canines (C1-C1), width of the crowns of the upper molars (M3-M3), lower tooth row (C-M3), and the mandibular length (MDL). A principal component analysis (PCA) was performed for each type of traits (external and cranial measurements) of 20 T. p. fulvidus specimens from the Guangdong and Guangxi populations, as well as 3 T. p. pachypus specimens from Komodo and Java, Indonesia, to compare the overall similarities in their external and cranial characteristics. The variation between different variables from two Chinese populations (lineages) was analyzed using Student's t-test. All statistical analyses were performed using SPSS Statistics 17.0 (SPSS Inc. 2000).
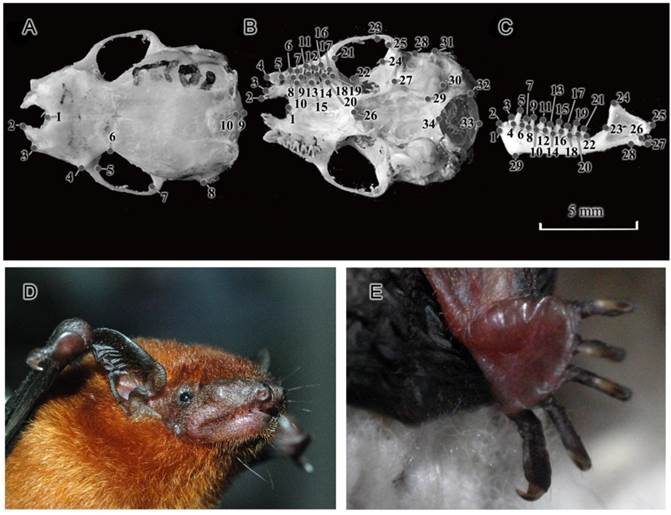
Through geometric morphometric analysis, size and shape variations were used to discriminate between two distinct lineages of T. p. fulvidus from China. A Nikon D80 camera with AF MICRO NIKKOR 60mm 1:2.8 D lens, mounted on a tripod at a fixed distance of 10 cm from the skull (which was always mounted on graph paper), was used to take dorsal, lateral and mandibular images for skulls from our samples. Landmark placement and further analysis were performed using the thin plate spline (TPS) series of programs [37-39]. The program tpsDig version 2.1 [40] was used to capture landmarks in two dimensions for dorsal (10 landmarks) ventral (34 landmarks) and mandibular views (29 landmarks) (Fig. 1A-C, for a more detailed landmark description see Appendix I). In order to superimpose the data, landmarks were subjected to Generalized Procrustes Analysis (GPA) which removes variation in digitizing location, orientation, and scale, and superimposes the objects in a common coordinate system [41] using the Morphologika2 software program (version 2.5) [42]. The size difference between two lineages was tested using t-test basing on the centroid size (CS) [43] of each individual that obtained using Geometric Morphometrics Tools Package (GMTP) version 2.1 [44]. To elucidate the shape differences between two lineages, a Principal Components Analysis (PCA) was employed in Morphologika2 (version 2.5) [42] to calculate principal axes of variation. Discriminant functions were generated from the samples from two different populations on the basis of PC scores from PCA. A Discriminant Analysis with cross-validations was carried out to assess the power of the discriminant function in SPSS Statistics 17.0 (SPSS Inc. 2000). Thin plate splines were also produced for a visual representation of the morphological differences in the skull between lineages using Morphologika2 (version 2.5) [42].
Landmarks locations used in the present study and external morphology of Tylonycteris pachypus fulvidus from China. Landmarks of the dorsal (A) and ventral (B) sides of the cranium, and the labial side of the mandible (C) (no. 10221). The external morphology of a live T. p. fulvidus individual from Guangzhou population (D and E).
Results
Distinct karyotypes of T. p. fulvidus from China and Thailand
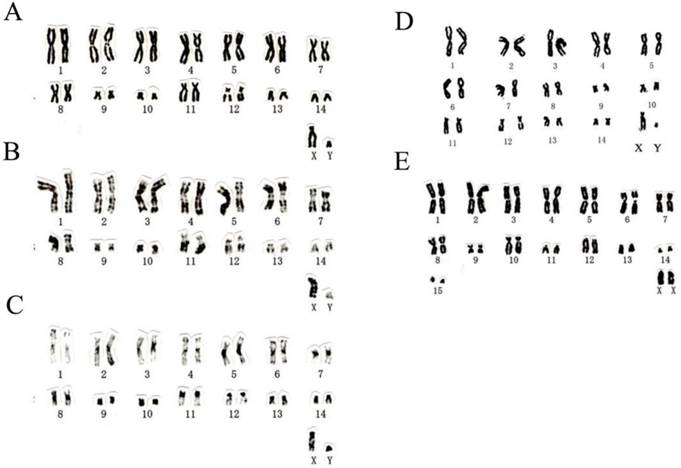
Chromosome numbers of T. p. fulvidus from Guangdong and Guangxi of China were 2n=30, FN=56 (Table 2; Fig. 2A-D), which was identical with the karyotypic features from Thai sample. There were eight large metacentric or submetacentric pairs, two pairs of small submetacentrics, four pairs of medium to small subtelocentrics in the autosomes, with a medium-sized subtelocentric X and a small, submetacentric Y chromosome (Table 2; Fig. 2A-D). One autosome pairs of subtelocentric chromosome (no. 12) had secondary constrictions adjacent to the centromere (Fig. 2A-D). The chromosome number of T. robustula from Guangxi province was 2n=32, FN=52 (Table 2; Fig. 2E). There were eight metacentric or subumetacentric pairs, one pair of small submetacentrics, two pairs of subtelocentrics and four pairs of acrocentrics in the autosomes, with a medium-sized acrocentric X chromosome (Table 2; Fig. 2E). The diploid number, the placement of centromeres, and the size of the biarmed elements of T. p. fulvidus from China and Thailand differed from the chromosomes of T. p. pachypus (2n=46) and T. robustula (2n=32) from the Malayan Peninsula [45] and Guangxi province (Table 2).
Karyotype descriptions for Tylonycteris pachypus pachypus (Temminck, 1840), T. p. fulvidus (Blyth, 1859) and T. robustula Thomas, 1915.
| Species/subspecies | 2n | FN | Pairs of autosomes | Sex chromosomes | Reference | |||
|---|---|---|---|---|---|---|---|---|
| M | ST | A | X | Y | ||||
| Tylonycteris pachypus (Malayan peninsula) | 46 | 56 | 4 | 2 | 16 | A | M | Yong et al. (1971) |
| Tylonycteris robustula (Malayan peninsula) | 32 | 56 | 11 | 2 | 2 | A | M | Yong et al. (1971) |
| Tylonycteris robustula (Guangxi, China) | 32 | 52 | 9 | 2 | 4 | A | M | present study |
| Tylonycteris pachypus fulvidus (Guangdong, China) | 30 | 56 | 10 | 4 | ST | M | present study | |
| Tylonycteris pachypus fulvidus (Guangxi, China) | 30 | 56 | 10 | 4 | ST | M | present study | |
| Tylonycteris pachypus fulvidus (Chiangmai, Thailand) | 30 | 56 | 10 | 4 | ST | M | present study | |
* M, meta/submeta-centric; ST, subtelocentrics; A, acrocentric.
The karyotypes of Tylonycteris pachypus fulvidus from Guangdong and Guangxi, and T. robustula from Guangxi analyzed in this study. Conventional (A, no. 2000156), G-banded (B, no. 2000156), and C-banded (C, no. 2000156) karyotypes of T. p. fulvidus from Guangzhou, Guangdong province, China; conventional (D, no. 10230) karyotype of T. p. fulvidus from Chongzuo, Guangxi province, China; conventional (E, no. 10229) karyotype of T. robustula from Chongzuo, Guangxi province, China.
Phylogeny and population genetic structure
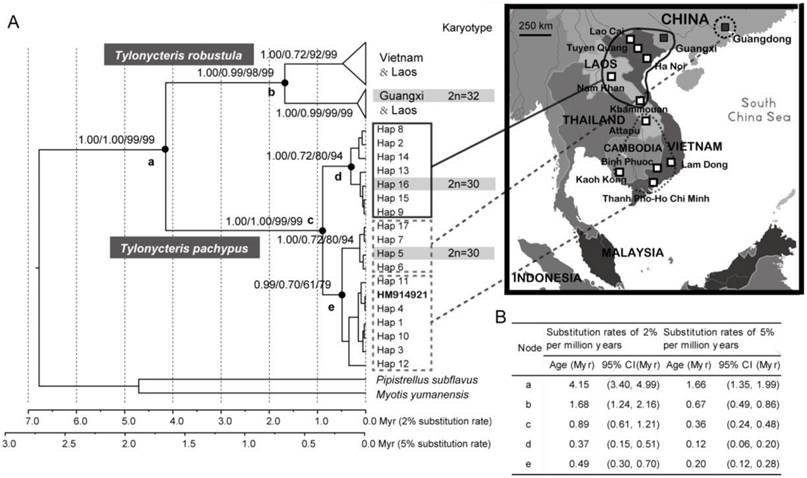
The monophyly of T. pachypus and T. robustula was well supported using the most commonly used phylogenetic methods (NJ, ML, and Bayes) (Fig. 3A), and the splitting event should have occurred during Pliocene or Pleistocene period (1.35-4.99 Myr) (Fig. 3A-B). The blast results obtained from the NCBI-nt database showed that the COI sequences of the T. pachypus specimens from nearby regions were very similar to the haplotypes from the Chinese populations. Furthermore, some were actually identical (Table 1). Two divergent lineages of T. p. fulvidus were emerged (Figs. 3A and 4), and their splitting event was estimated to be around 0.24 - 1.21 Myr ago according to our divergence time estimations (Fig. 3A-B). The intertwined relationships among haplotypes and their similar external features (see subsequent sections for full details) suggested that individuals from the regions should be the same as the cryptic species found in China. Note that one T. robustula haplotype (GenBank accession numbers: HM914921) clustered into the T. pachypus lineage (Fig. 3A). Such phenomenon may be derived from the contamination of samples in molecular experiment, the misidentification of the specimens, or the incomplete lineage sorting. However, due to difficulty in checking the specimens and discriminating the potential causes, this haplotype was excluded in our sequent phylogeographic analysis.
Genealogical reconstruction of Tylonycteris pachypus fulvidus from China and nearby regions and the divergence time of related nodes. (A) Biogeographical distribution of haplotypes identified in this study and their phylogenetic relationships based on Bayesian, maximum likelihood (ML), and neighbor-joining (NJ) methods. The values on the nodes represented the posterior probabilities from BEAST, MrBayes, the ML bootstrap values, and the NJ bootstrap values, respectively. Bayesian estimates of divergence time used 2 fixed substitution rates of 2% per million years and 5% per million years. Geographical distributions of major groups were mapped onto the phylogenetic trees and the haplotypes of specimens used in the karyotypic analysis are highlighted in the light gray and gray bars. The T. robustula haplotype (GenBank accession numbers: HM914921) that clustered into the T. pachypus lineage is labeled in bold. (B) Summarized table of Bayesian estimates of divergence time of related nodes using two fixed substitution rates.
TCS network of COI haplotypes for the Tylonycteris pachypus fulvidus. The size of each circle is proportional to the frequency of the specific haplotype used in this study.
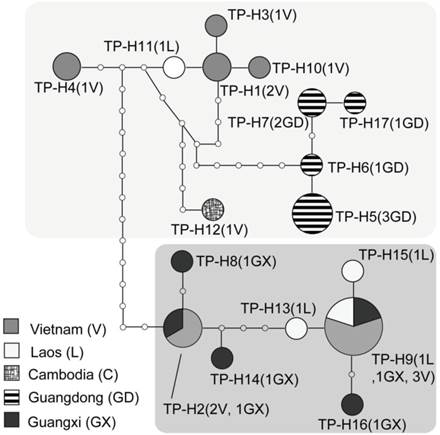
Based on 623 base pairs from the partial mitochondrial cytochrome oxidase subunit 1 (COI) gene, 17 unique haplotypes were identified from the Chinese and nearby populations of T. pachypus (Figs. 3A and 4; Table 1). Thirty-nine polymorphic sites were detected, but no insertions or deletions were found among the haplotypes. Haplotypes TF-H5, TF-H6, TF-H7, and TF-H17 were found only in the Guangdong population, while haplotype TF-H9 were found within the Guangxi, Laos, and Vietnam populations (Figs. 3A and 4; Table 1). Using a traditional regional group setting (Chinese group vs. Southeast Asia group), the variances among groups within populations and among populations within groups were -14.60% and 54.87% (P<0.01), respectively (Table 3). Using a no group setting, the variances among populations (52.09%, P<0.01) and within populations (47.91%) were roughly the same as the regional group setting (Table 3). However, when the groups were arranged according to the genealogical result that detected two diverged lineages in these regions, the variance among groups (lineages) increased to 64.30% (P < 0.05) (Figs. 3A and 4; Table 3).
AMOVA analysis of the genetic variation in Tylonycteris pachypus fulvidus populations.
| Structure | Source of variation | Variation (%) | Fixation indices | P |
|---|---|---|---|---|
| China group vs. Southeast Asia group | Among regions | -14.60 | -0.18 | 0.7 |
| Among populations/within regions | 54.87 | 0.57 | <0.01** | |
| Within populations | 59.87 | 0.49 | <0.01** | |
| Two diverged lineages | Among lineages | 64.3 | 0.64 | <0.05* |
| Among populations/within lineages | 22.22 | 0.62 | <0.01** | |
| Within populations | 13.48 | 0.87 | <0.01** | |
| No group | Among populations | 43.2 | 0.52 | <0.01** |
| Within populations | 56.8 |
*Statistically significant (P < 0.05), **statistically significant (P < 0.01).
NS, nonsignificant.
The statistical parsimony haplotype network of COI also produced two divergent cladograms (where over 14 mutation steps were required for connection), which resembled the relationships detected by phylogenetic reconstruction (Figs. 3A and 4). Sequence divergence between the two lineages ranged from 3.0% to 4.2% of Kimura 2-parameter model distances (average 3.4%) for COI segment. These results were consistent with the AMOVA results, which indicated that most of the genetic variance was attributable to variance among lineages. Our haplotype network and phylogenetic topologies indicated the monophyly of Guangdong population, whereas an intertwined relationship of haplotypes was found in the Guangxi and southern Vietnam and Laos populations, i.e., Lao Cai, Tuyen Quang, Ha Noi, Nam Khan, and Khammouan (Figs. 3A and 4).
External and cranial size differences
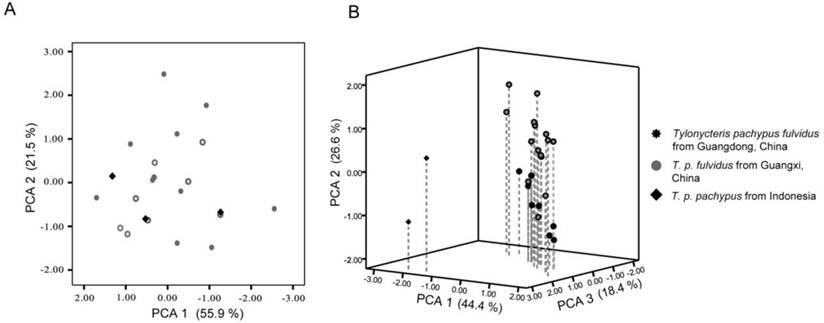
The external and cranial measurements collected in this study are provided in Table 4. The PCA analysis of the external characteristics showed that the eigenvalues of the first two principal components were 3.64 and 1.47, respectively, which explained 73.01% of the total variance. Plots of principal components 1 and 2 indicated that the T. p. pachypus could not be distinguished from the T. p. fulvidus (Fig. 5A). The eigenvalues of the first three principal components for the cranial measurements were 6.39, 3.87, and 2.61, respectively, which explained 85.79% of the total variance (Table 5). The number of specimens from Indonesia was limited in this study, but the 3D plots of principal components 1, 2, and 3 detected differences between T. p. fulvidus from China and T. p. pachypus from Indonesia. The first principal component was strongly correlated with CBL, CCL, BBC, OW, ZW, and IOB, which might reflect a skull size effect (Table 5). The second principal component was strongly correlated with tooth measurements, such as C-M3, M3-M3, and C-M3, while the third principal component was strongly correlated with PBL and HOC (Table 5). The plots derived from the Guangdong specimens were difficult to distinguish from the Guangxi specimens (Table 5), but the pairwise comparison (t-test) of the Guangdong and Guangxi specimens showed that the BBC, C-M3, M3-M3, and C-M3 measurements were significantly different (P < 0.05), and the specimens of Guangdong are slightly larger than the Guangxi specimens (Table 4).
External and cranial measurements (mm) of Tylonycteris pachypus used in this study.
| T. p. fulvidus | n | T. p. fulvidus | n | P* | T. p. pachypus | n | |
|---|---|---|---|---|---|---|---|
| Guangdong (China) | Guangxi (China) | Indonesia | |||||
| FA | 26.07±0.89 (24.86-27.86) | 12 | 25.96±0.83 (24.56-27.00) | 8 | 0.98 | 26.01±0.94 (25.09-26.97) | 3 |
| E | 6.80±0.93 (4.90-8.34) | 9 | 6.79±0.52 (5.88-7.50) | 8 | 0.79 | 5.68±0.20 (5.51-5.90) | 3 |
| III0 | 24.33±0.66 (23.58-25.83) | 12 | 24.50±0.80 (23.41-25.38) | 8 | 0.19 | 24.66±1.27 (23.23-25.66) | 3 |
| IV0 | 24.07±0.60 (23.30-25.20) | 12 | 24.20±0.69 (23.34-24.93) | 8 | 0.34 | 24.22±0.87 (23.22-24.80) | 3 |
| V0 | 23.66±0.60 (22.82-24.96) | 12 | 23.86±0.67 (22.79-24.66) | 8 | 0.36 | 24.23±1.05 (23.03-24.93) | 3 |
| HF | 4.89±0.48 (4.22-5.79) | 11 | 4.67±0.45 (4.00-5.52) | 8 | 0.11 | 5.32±0.14 (5.19-5.46) | 3 |
| TB | 11.25±0.45 (10.33-11.81) | 12 | 11.17±0.67 (9.94-11.93) | 8 | 0.72 | 10.79±1.11 (9.91-12.04) | 3 |
| GLS | 11.29±0.30 (10.65-11.65) | 12 | 11.06±0.22 (10.72-11.44) | 8 | 0.06 | (10.49, 11.01) | 2 |
| CBL | 11.08±0.27 (10.58-11.45) | 12 | 10.84±0.20 (10.55-11.09) | 8 | 0.61 | (8.86, 9.08) | 2 |
| CCL | 10.68±0.25 (10.12-10.99) | 12 | 10.45±0.21 (10.05-10.69) | 8 | 0.11 | 10.84±1.18 (9.63-12.20) | 4 |
| HBC | 3.61±0.22 (3.26-3.97) | 12 | 3.49±0.10 (3.31-3.61) | 8 | 0.28 | (3.56, 3.74) | 2 |
| BBC | 6.67±0.17 (6.39-6.98) | 12 | 6.56±0.10 (6.40-6.70) | 8 | 0.06 | 6.55±0.17 (6.40-6.80) | 4 |
| HOC | 1.14±0.04 (1.06-1.21) | 12 | 1.07±0.10 (0.93-1.20) | 8 | 0.06 | (3.17, 3.18) | 2 |
| OW | 4.33±0.10 (4.19-4.52) | 12 | 4.26±0.16 (3.97-4.44) | 8 | 0.29 | (3.79, 3.93) | 2 |
| ZW | 7.82±0.27 (7.41-8.25) | 12 | 7.94±0.10 (7.76-8.05) | 8 | 0.57 | 8.15±1.21 (7.19-9.50) | 3 |
| IOB | 3.42±0.09 (3.23-3.55) | 12 | 3.45±0.08 (3.36-3.55) | 8 | 0.88 | (3.17, 3.23) | 2 |
| PBL | 3.82±0.28 (3.48-4.27) | 12 | 3.97±0.20 (3.61-4.16) | 8 | 0.29 | (4.77, 4.99) | 2 |
| C-M3 | 3.68±0.14 (3.36-3.87) | 12 | 3.41±0.06 (3.32-3.50) | 8 | <0.01 | 3.71±0.35 (3.31-4.00) | 4 |
| C1-C1 | 3.71±0.19 (3.45-4.08) | 12 | 3.57±0.10 (3.44-3.68) | 8 | 0.06 | (3.08, 3.35) | 2 |
| M3-M3 | 5.10±0.16 (4.75-5.30) | 12 | 4.86±0.13 (4.70-5.04) | 8 | <0.01 | (4.61, 5.07) | 2 |
| C-M3 | 4.00±0.12 (3.73-4.20) | 12 | 3.73±0.10 (3.60-3.84) | 8 | <0.01 | (3.88, 4.01) | 2 |
| MDL | 8.13±0.17 (7.86-8.34) | 12 | 7.99±0.17 (7.73-8.27) | 8 | >0.07 | (7.48, 7.69) | 2 |
* P-value for t-test comparisons between Guangdong and Guangxi specimens.
Principal components plots based on the external and cranial of Tylonycteris pachypus measurements. (A) Principal components plots of the external measurements showing components 1 and 2; (B) principal components 3D plots of cranial measurements for T. p. fulvidus showing components 1, 2, and 3. The contribution of each axis for total variation is indicated in parenthesis.
Factor loadings, eigenvalues, and the variance explained by each principal component based on the cranial measurements of Tylonycteris pachypus fulvidus examined in this study.
| Variable | PCA 1 | PCA 2 | PCA 3 |
|---|---|---|---|
| GLS | 0.27 | 0.77 | -0.23 |
| CBL | 0.84 | 0.22 | -0.48 |
| CCL | 0.89 | 0.24 | -0.07 |
| HBC | 0.57 | 0.16 | 0.69 |
| BBC | 0.88 | 0.31 | 0.28 |
| HOC | -0.51 | -0.09 | 0.83 |
| OW | 0.89 | 0.17 | -0.18 |
| ZW | 0.85 | 0.01 | 0.05 |
| IOB | 0.93 | -0.02 | -0.09 |
| PBL | -0.01 | -0.21 | 0.93 |
| C-M3 | 0.19 | 0.88 | -0.01 |
| C1-C1 | 0.43 | 0.70 | -0.34 |
| M3-M3 | 0.05 | 0.91 | -0.14 |
| C-M3 | -0.03 | 0.90 | 0.20 |
| MDL | 0.93 | 0.26 | -0.06 |
| Eigenvalues | 6.39 | 3.87 | 2.61 |
| % of variance explained | 42.60 | 25.78 | 17.41 |
Cranial differences between two lineages
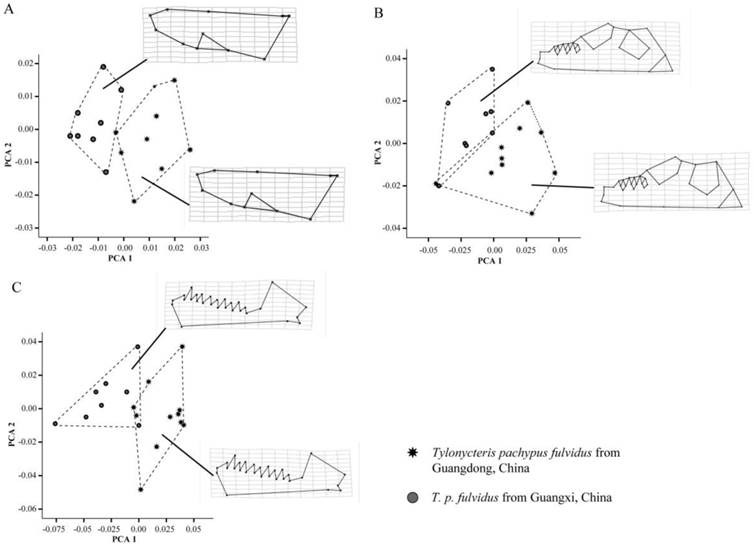
Geometric morphometric analysis confirmed earlier traditional morphometric results and indicated the T. p. fulvidus from Guangdong were significantly larger than Guangxi specimens (dorsum: lnCSGuangzhou=7.16, lnCSGuangxi=7.13, t-test P=0.02; ventrum: lnCSGuangzhou=7.55, lnCSGuangxi=7.53, t-test P=0.05; mandible: lnCSGuangzhou=7.08, lnCSGuangxi=7.03, t-test P<0.01). Both the Mahlanobis and Procrustes distances of the dorsum, ventrum and mandible between the lineages mean were significant (D=9.95, P=0.02 and d=0.02, P<0.01 for the dorsum; D=2.72, P=0.01 and d=0.03, P<0.01 for the ventrum; D=3.75, P<0.01 and d= 0.03, P<0.01 for the mandible). The number of the axes required to explain 99% of the overall shape variance was 13 principal components (PC) for dorsum, 16 for the ventrum and 16 for the mandible. The first two PC accounted for 29.10% and 17.13% of the overall shape variance of dorsum, 24.18% and 13.30% for the ventrum, 24.28% and 18.50% for the mandible. From the PC plots of the dorsum, ventrum and mandible, two lineages could be mostly separated (Fig. 6A-C). At the cross-validation of the discriminant function, 7 out of 16 specimens, 4 out of 18 specimens and 3 out of 19 specimens were misclassified at the dorsum, ventrum and mandible, respectively. As regards the shape changes, Guangzhou population has an elongated zygomatic arches, and wider toothrows of the upper jaw, elongated bullae, and larger and longer toothrows of the mandible (Fig. 6A-C).
Plots of principal components factors 1 and 2 for the dorsal (A) and ventral (B) sides of the cranium, and the labial side of the mandible (C), as well as the thin plate splines (TPS) of Tylonycteris pachypus fulvidus from Guangdong and Guangxi, China.
Discussion
Karyotypic information is one of the most valuable data used in systematic and genetic studies of bats [46]. It is important for identifying cryptic species, clarifying debates in taxonomic settings, assessing the relationships between taxa, and studying the processes of speciation and evolution [46]. The chromosomes of bats have been studied and reviewed extensively, and taxon samplings have increased continuously, but the karyotypic data available for many species and subspecies are still limited. The present chromosomal study of T. p. fulvidus from China and Thailand detected a cryptic species within the T. pachypus complex, which was identified based on its diploid number, the placement of centromeres, and the size of biarmed elements compared with the karyotypes of T. p. pachypus and T. robustula from Malay Peninsula (Table 3). The chromosomal rearrangements among them supported the existence of distinct Tylonycteris cryptic species and reproductive isolation among recognized subspecies. Because, if a species/subspecies becomes subdivided into two geographic forms, one of them is characterized by a series of chromosomal rearrangements and the hybrids between these geographic forms are expected to experience reduced fertility due to the meiotic difficulties caused by the heterozygosity of the rearrangements [47-49].
An accepted hypothesis for the karyotypic evolution of vespertilionids bats is conservatism in the chromosome arms and Robertsonian translocation due to fusion of the whole long arms of two acrocentric chromosomes, which resulted in a decrease in the chromosomal diploid number [50-52]. If so, T. p. pachypus should be a primitive form within Tylonycteris because it contains higher chromosomal diploids number than any other reported Tylonycteris species (Table 2), whereas cryptic species from Southeast Asia may be a more derived form that emerged following Robertsonian fusion events involving subacrocentric or/and acrocentric autosomes. However, this hypothesis needs to be validated using other chromosome staining methods, such as fluorescence in situ hybridization (FISH) [53-55]. The assumed evolutionary scenario within Tylonycteris also raises another puzzling question about their phylogenetic relationship and phenotypes because T. p. pachypus from Southeast Asia is more similar to the cryptic species found in this study in terms of its external features than T. robustula [3]. In a broader sense, the external and life habit similarities of Tylonycteris species suggest that they are excellent subjects for studies of speciation based on karyotypic organization and genetic variations, as well as the dependence of genetic mechanisms on phenotypic constraints.
High genetic similarities of the related COI segments of T. pachypus specimens from Laos, Cambodia, and Vietnam, as well as individuals from China, the intertwined phylogenetic relationships, and their similar external features suggest that the specimens from Laos, Cambodia, and Vietnam should be attributed as the same cryptic species from China and Thailand. The similar external features and pelage of T. p. fulvidus from China and T. p. pachypus from Indonesia [3, 12] could be a major cause of the historical failure to distinguish them (Figs. 1A-E and 5A; Table 4). This phenomenon might have occurred because the long-term convergent evolution of Tylonycteris species constrained their external differentiation due to their similar and specialized habitats and ecotypes [3, 5, 10, 12]. The results of the multivariate analyses of the cranial measurements showed that although the skull and tooth size characteristics of the 2 species overlapped, cryptic species from China could be distinguished from T. p. pachypus based on HOC and PBL, where PC 3 was strongly correlated (Fig. 5B). These measurements may be critical for the identification of T. pachypus subspecies in future.
The contrasting patterns of the haplotype relationships, distribution, and branching provide insights into the evolutionary processes that have shaped the population genetic structure of T. p. fulvidus in China and nearby regions. The AMOVA analysis and phylogeographic reconstruction both detected a population genetic structure that did not match the geographic distribution, and this common pattern is often observed in small mammals characterized by ecomorphological traits that limit dispersal [56, 57]. The coexistence of two divergent lineages (average 3.4% of Kimura 2-parameter model distances for COI segment) in these regions suggests a complex evolutionary history for this cryptic species with multiple historical colonization events (at least twice) in China. All of the haplotypes from Guangdong population, which formed a single clade, were grouped with haplotypes from Cambodia and populations from the far south of Vietnam (e.g., Attapu, Binh Phuoc, Lam Dong, Kaoh Kong, and Ho Chi Minh city), rather than nearby populations (Figs. 3A and 4). This pattern might be explained by a historical long-distance colonization from southern Asia to Guangdong and the extinction of transitional populations, or biogeographical rearrangements due to the environmental changes of Pleistocene [58]. The intertwined haplotypes of the clade inhabiting Guangxi, northern Vietnam, and Laos might be attributed to historical colonization by a single ancestral population containing diverse lineages or frequent gene flow among populations. Given their ecomorphological traits implying limited dispersal capability [56, 57], however, it is suggested that a lineage derived from a diverse ancestral population may be more likely. Both the traditional and geometric morphological analyses detected size and shape differences between two divergent lineages. Considering the fact that most of variations are related to zygomatic arch, upper jaw, mandible and bullae (Figs. 5B and 6A-C), these differences may be resulted from the ecological feature regarding foraging, echolocation, varied diets, and distinct evolutionary history [59-67]. It is worthwhile to note that since the similar latitude and close distance between Guangdong and Guangxi, they share similar sub-tropic vegetation and climate [68]. In consideration of the distinct evolutionary scenarios of two lineages in present study, we suggested that such difference might be derived from their historical adaptation or evolutionary history rather than the differentiation due to the habitat they occurred currently. However, to confirm this hypothesis and clarify the causes of cranial differences, a comparative study on diet and echolocation of two lineages is required in the future.
This study integrated karyotypic, morphometric, and phylogeographic data to recognize a distinct cryptic species within T. pachypus. Its primary phylogeographic framework in China and nearby regions, and morphometric differences between two lineages were also studied. The results indicated that all T. p. fulvidus specimens from China and nearby regions belong to a newfound cryptic species. Similarities in their external features may be a major cause of historical misidentifications. This study also addressed the question of the source of the species diversity found within the Tylonycteris complex, which appears to have undergone long-term convergent evolution. Cryptic species may be a significant problem that affects many taxonomic groups in bats [69-73]. It is required to clarify the species boundary and distribution range of T. pachypus complex, especially in the continental Asia attributed to T. p. fulvidus, T. p. pachypus, and T. p. aurex.
Acknowledgements
This study was financially supported by the NSFC Major International (Regional) Joint Research Project Grant (No. 31110103910), the National Natural Science Foundation of China (No31172045, No31300314), Natural Science Foundation of Guangdong (8151009101000005), and Japan Society for the Promotion of Science AA Science Platform Program.
Competing Interests
The authors have declared that no competing interest exists.
References
1. Temminck CJ. Monographies de Mammalogie, ou description de quelques genres de mammifères, dont les espèces ont été observées dans les différens musées de l'Europe. CC Leiden: Vander Hoek. 1827 [1824]-1841
2. Thomas O. On bats of the genera Nyctalus, Tylonycteris, and Pipistrellus. Ann Mag Nat Hist. 1915;15:227
3. Feng Q, Li S, Wang Y. A New Species of Bamboo Bat (Chiroptera: Vespertilionidae: Tylonycteris) from Southwestern China. Zool Sci. 2008;25:225-234
4. Simmons NB. Order Chiroptera. In: (ed.) Wilson DE, Reeder DM. Mammal species of the world: a taxonomic and geographic reference, 3rd edn. Baltimore: The Johns Hopkins University Press. 2005:312-529
5. Tate GHH. Review of the Vespertilioninae bats, with special attention to genera and species of the Archbold collections. Bull Am Nat Hist. 1942;80:221-297
6. Ellerman JR, Morrison-Scott TGS. Checklist of Palaearctic and Indian mammals. Trusteees of the British Museum (Natural History): London. 1951:1758-1946
7. Corbet GB, Hill JE. The Mammals of the Indomalayan Region: A Systematic Review. Oxford: Oxford University Press. 1992
8. Heaney LR, Alcala AC. Flat-headed bats (Mammalia: Tylonycteris) from the Philippine islands. Silliman J. 1986;33:117-123
9. Honacki JH, Kinman KE, Koeppl JW. Mammal Species of the World. A Taxonomic and Geographic Reference. Lawrence, Kansas: Allen Press and The Association of Systematics Collections. 1982
10. Nowak RM. Walker's Mammals of the Word Vol 1. 6th ed. Baltimore: Johns Hopkins University Press. 1999
11. Koopman KF. Chiroptera: Vespertilionidae: Vespertilioninae. In: (ed.) Wilson DE, Reeder DM. Mammal Species of the World A Taxonomic and Geographic Reference 2nd ed. Washington: Smithsonian Institution Press. 1993
12. Bates PJJ, Harrison DL. Bats of the Indian Subcontinent. Sevenoaks: Harrison Zoological Museum Publications. 1997
13. Hendrichsen DK, Bates PJJ, Hayes BD, Walston JL. Recent records of bats (Mammalia: Chiroptera) from Vietnam, with six species new to the country. Myotis. 2001;39:35-122
14. Blyth E. Proceedings of the Asiatic Society: Report of Curator. Zoological Department, for February to May Meetings. J Asiatic Soc Bengal. 1859;28:271-298
15. Peters W, Berl MB. Uber den Vespertilio calcaratus Prinz zu Wied und eine neue Gattung der Flederthiere, Tylonycteris. Monatsber K Preuss Akad Wiss Berlin. 1872: 699-706.
16. Oei HP. Notes on bats from Bali Lombok amd Sumba. Hemera Zoa. 1960;67:23-32
17. Harada M, Yosida TH. Karyological study of four Japanese Myotis bats (Chiroptera, Mammalia). Chromosoma. 1978;65:283-91
18. Seabright M. A rapid banding technique for human chromosomes. Lancet. 1971;2:971-972
19. Sumner AT. A simple technique for demonstrating centromeric heterochromatin. Exp Cell Res. 1972;75:304-6
20. Levan A, Fredga K, Sandberg AA. Nomenclature for centromeric position on chromosomes. Hereditas. 1964;52:201-220
21. Drummond AJ, Ashton B, Buxton S, Cheung M, Cooper A, Duran C, et al. Geneious v5.4. http://www.geneious.com
22. Edgar RC. MUSCLE: multiple sequence alignment with high accuracy and high throughput. Nucleic Acids Res. 2004;32:1792-1797
23. Stamatakis A, Hoover P, Rougemont J. A rapid bootstrap algorithm for the RAxML Web servers. Syst Biol. 2008;57:758-771
24. Miller MA, Pfeiffer W, Schwartz T. Creating the CIPRES Science Gateway for inference of large phylogenetic trees. Proceedings of the Gateway Computing Environments Workshop (GCE). New Orleans, LA. 2010:1-8
25. Tamura K, Peterson D, Peterson N, Stecher G, Nei M, Kumar S. MEGA5: molecular evolutionary genetics analysis using maximum likelihood, evolutionary distance, and maximum parsimony methods. Mol Biol Evol. 2011;28:2731-2739
26. Posada D, Crandall KA. MODELTEST: testing the model of DNA substitution. Bioinformatics. 1998;14:817-818
27. Ronquist F, Huelsenbeck JP. MrBayes 3: Bayesian phylogenetic inference under mixed models. Bioinformatics. 2003;19:1572-1574
28. Drummond AJ, Rambaut A. BEAST: Bayesian evolutionary analysis by sampling trees. Bmc Evol Biol. 2007;7:214
29. Smith M, Patton J. Phylogenetic Relationships and the Radiation of Sigmodontine Rodents in South America: Evidence from Cytochrome b. J Mamm Evol. 1999;6:89-128
30. Hoffmann FG, Owen JG, Baker RJ. mtDNA perspective of chromosomal diversification and hybridization in Peters' tent-making bat (Uroderma bilobatum: Phyllostomidae). Mol Ecol. 2003;12:2981-2993
31. Hoffmann FG, Baker RJ. Comparative phylogeography of short-tailed bats (Carollia: Phyllostomidae). Mol Ecol. 2003;12:3403-3414
32. Hulva P, Horacek I, Strelkov PP, Benda P. Molecular architecture of Pipistrellus pipistrellus/Pipistrellus pygmaeus complex (Chiroptera: Vespertilionidae): further cryptic species and Mediterranean origin of the divergence. Mol Phylogenet Evol. 2004;32:1023-1035
33. Rambaut A, Drummond AJ. Tracer v1.4, Available from http://beast.bio.ed.ac.uk/Tracer. 2007.
34. Excoffier L, Laval G, Schneider S. Arlequin (version 3.0): an integrated software package for population genetics data analysis. Evol Bioinform Online. 2005;1:47-50
35. Templeton AR, Crandall KA, Sing CF. A cladistic analysis of phenotypic associations with haplotypes inferred from restriction endonuclease mapping and DNA sequence data. III. Cladogram estimation. Genetics. 1992;132:619-633
36. Clement M, Posada D, Crandall KA. TCS: a computer program to estimate gene genealogies. Mol Ecol. 2000;9:1657-1659
37. Rohlf F. TpsSPLIN: thin-plate splines. Version 1.15. New York: Department of Ecology and Evolution, State University, Stony Brook. 1997
38. Rohlf F. TpsPLS. New York: Department of Ecology and Evolution, State University, Stony Brook. 1998
39. Rohlf F. TpsREGR. New York: Department of Ecology and Evolution, State University, Stony Brook. 1998
40. Rohlf F. TPSDIG, version 1.18. New York: Department of Ecology and Evolution, State University of New York, Stony Brook. 1999
41. Rohlf FJ, Slice DE. Extensions of the procustes method for the optimal superimposition of landmarks. Syst Zool. 1990;39:40-59
42. O'Higgins P, Jones N. Tools for statistical shape analysis. 2006.
43. Bookstein FL. Size and shape spaces for landmark data in two dimensions. Stat. Sci. 1986;1:181-222
44. Taravati S. GMTP: Geometric Morphometric Tools Package. Version 2.1. 2010
45. Yong HS, Dhaliwal SS, Teh KL. Somatic chromosome of the flat-headed bats (Tylonycteris spp). Experientia. 1971;27:1353
46. Robert JB, Mazin BQ. Methods in Chiropteran Mitotic Chromosomal Studies. In: (ed.) Thomas HK. Ecological and behavioral methods for the study of bats. London: Johns Hopkins University Press. 1988:425-436
47. King M. Species Evolution: The Role of Chromosome Change. Cambridge: Cambridge University Press. 1993
48. Searle JB. Speciation, chromosomes, and genomes. Genome Res. 1998;8:1-3
49. Spirito F. The role of chromosomal change in speciation. In: (ed.) Howard DJ, Berlocher SH. Endless Forms: Species and Speciation. New York: Oxford Univ. Press. 1998:320-329
50. Bickham JW. Banded karyotypes of 11 species of American bats(genus Myotis). Cytologia. 1979;44:789-497
51. Harada M, Yenbutra S, Tsuchiya K, Takada S. Karyotypes of seven species of bats from Thailand (Chiroptera, Mammalia). Cell Mol Life Sci. 1985;41:1610-1611
52. Ao L, Gu X, Feng Q, Wang J, O'Brien PCM, Fu B. et al. Karyotype relationships of six bat species (Chiroptera, Vespertilionidae) from China revealed by chromosome painting and G-banding comparison. Cytogenet Genome Res. 2006;115:145-153
53. Volleth M, Heller KG, Pfeiffer RA, Hameister H. A comparative ZOO-FISH analysis in bats elucidates the phylogenetic relationships between Megachiroptera and five microchiropteran families. Chromosome Res. 2002;10:477-497
54. Ao L, Mao X, Nie W, Gu X, Feng Q, Wang J. et al. Karyotypic evolution and phylogenetic relationships in the order Chiroptera as revealed by G-banding comparison and chromosome painting. Chromosome Res. 2007;15:257-267
55. Eick GN, Jacobs DS, Yang F, Volleth M. Karyotypic differences in two sibling species of Scotophilus from South Africa (Vespertilionidae, Chiroptera, Mammalia). Cytogenet Genome Res. 2007;118:72-77
56. Norberg UM. Morphological adaptations for flight in bats. In: (ed.) Kunz TH, Racey PA. Bat Biology and Conservation. Washington, D.C: Smithsonian Institution Press. 1998:93-108
57. Norberg UM, Rayner JMV. Ecological Morphology and Flight in Bats (Mammalia; Chiroptera): Wing Adaptations, Flight Performance, Foraging Strategy and Echolocation. Philos Trans R Soc Lond B Biol Sci. 1987;316:335-427
58. Louys J, Meijaard E. Palaeoecology of Southeast Asian megafauna-bearing sites from the Pleistocene and a review of environmental changes in the region. J Biogeogr. 2010;37:1432-1449
59. Bogdanowicz W, Fenton MB, Daleszczyk K. The relationships between echolocation calls, morphology and diet in insectivorous bats. J Zool (London). 1999;247:381-393
60. Bogdanowicz W, Juste J, Owen RD, Sztencel A. Geometric morphometrics and cladistics: testing evolutionary relationships in mega- and microbats. Acta Chiropterol. 2005;7:39-49
61. Storz JF, Balasingh J, Bhat HR, Thiruchenthil PN, Swami Doss DP, Prakash AA. et al. Clinal variation in body size and sexual dimorphism in an Indian fruit bat, Cynopterus sphinx (Chiroptera: Pteropodidae). Biol J Linn Soc. 2001;72:17-31
62. Fenton MB, Bogdanowicz W. Relationships between external morphology and foraging behaviour: bats in the genus Myotis. Can J Zool. 2002;80:1004-1013
63. Nogueira MR, Monteiro LR, Peracchi AL, De Araújo AFB. Ecomorphological analysis of the masticatory apparatus in the seed-eating bats, genus Chiroderma (Chiroptera: Phyllostomidae). J Zool (London). 2005;266:355-364
64. Gannon WL, Racz GR. Character displacement and ecomorphological analysis of two long-eared Myotis (M. auriculus and M. evotis). J Mammal. 2006;87:171-179
65. Bornholdt R, Oliveira LR, Fabian ME. Size and shape variability in the skull of Myotis nigricans (Schinz, 1821) (Chiroptera: Vespertilionidae) from two geographic areas in Brazil. Braz J Biol. 2008;68:623-631
66. Evin A, Baylac M, Ruedi M, Mucedda M, Pons JM. Taxonomy, skull diversity and evolution in a species complex of Myotis (Chiroptera: Vespertilionidae): a geometric morphometric appraisal. Biol J Linn Soc. 2008;95:529-538
67. Sztencel-Jabłonka A, Jones G, BogdanowicZ W. Skull morphology of two cryptic bat species: Pipistrellus pipistrellus and P. pygmaeus — A 3D geometric morphometrics approach with landmark reconstruction. Acta Chiropterol. 2009;11:113-126
68. Fang J-y, Yoda K. Climate and vegetation in China II. Distribution of main vegetation types and thermal climate. Ecol Res. 1989;4:71-83
69. Barlow KE, Jones G, Barratt EM. Can skull morphology be used to predict ecological relationships between bat species? A test using two cryptic species of pipistrelle. Proc Biol Sci. 1997;264:1695-1700
70. von Helversen OvH, Heller KGH, Mayer FM, Nemeth AN, Volleth MV, Gombkötö PG. Cryptic mammalian species: a new species of whiskered bat (Myotis alcathoe n. sp.) in Europe. Naturwissenschaften. 2001;88:217-223
71. Berthier P, Excoffier L, Ruedi M. Recurrent replacement of mtDNA and cryptic hybridization between two sibling bat species Myotis myotis and Myotis blythii. P R Soc B. 2006;273:3101-3109
72. Furman A, Postawa T, Oztunc T, Coraman E. Cryptic diversity of the bent-wing bat, Miniopterus schreibersii (Chiroptera: Vespertilionidae), in Asia Minor. Bmc Evol Biol. 2010;10:121
73. Siemers BM, Greif S, Borissov I, Voigt-Heucke SL, Voigt CC. Divergent trophic levels in two cryptic sibling bat species. Oecologia. 2011;166:69-78
Author contact
![]() Corresponding authors: E-mail: wuyizhouqnet or li_yuchuncom.
Corresponding authors: E-mail: wuyizhouqnet or li_yuchuncom.