Impact Factor ISSN: 1449-2288
- Issue 9; 2026
- Issue 8; 2026
- Issue 7; 2026
- Issue 6; 2026
- Issue 5; 2026
- Volume 22; 2026
- Past Issues
- Advance Articles
- Editorial Board
- Cover Images
- Index & Coverage
- Cover Suggestion
- Special Issues
Introduction
Materials and Methods
Results
Discussion
Supplementary Material
Acknowledgements
References
Author Biography

 Global reach, higher impact
Int J Biol Sci 2014; 10(7):677-688. doi:10.7150/ijbs.8430 This issue Cite
Research Paper
Predicting Disease-Related Proteins Based on Clique Backbone in Protein-Protein Interaction Network
Lei Yang1,2 ![]() , Xudong Zhao1, Xianglong Tang1
, Xudong Zhao1, Xianglong Tang1
1. School of Computer Science and Technology, Harbin Institute of Technology, Harbin, China;
2. Information and Network Management Centre, Heilongjiang University, Harbin, China.
Received 2013-12-25; Accepted 2014-5-21; Published 2014-6-11
Abstract
Network biology integrates different kinds of data, including physical or functional networks and disease gene sets, to interpret human disease. A clique (maximal complete subgraph) in a protein-protein interaction network is a topological module and possesses inherently biological significance. A disease-related clique possibly associates with complex diseases. Fully identifying disease components in a clique is conductive to uncovering disease mechanisms. This paper proposes an approach of predicting disease proteins based on cliques in a protein-protein interaction network. To tolerate false positive and negative interactions in protein networks, extending cliques and scoring predicted disease proteins with gene ontology terms are introduced to the clique-based method. Precisions of predicted disease proteins are verified by disease phenotypes and steadily keep to more than 95%. The predicted disease proteins associated with cliques can partly complement mapping between genotype and phenotype, and provide clues for understanding the pathogenesis of serious diseases.
Keywords: predicting disease proteins, clique centrality analysis, association with complex diseases, data integration, protein-protein interaction networks.
Introduction
Protein-protein interaction networks (PPINs) are fundamental to understanding of cellular organizations, biological processes, and protein functions [1]. PPINs have been used to explore disease mechanisms via associating the genotype with the phenotype built in the Online Mendelian Inheritance in Man (OMIM) database [2]. Network biology integrates data of cellular networks and gene diseases to provide insightful models that unravel the complex relationship of human diseases [3]. Ideker and Sharan [4] indicate four major areas applied PPINs to diseases including identifying new disease genes, the study of their network properties, identifying disease-related subnetworks and network-based disease classification. This paper deals with discovering disease-related proteins. This is a basic work because a large number of disease proteins are still unknown and what's known is just like the tip of the iceberg [5].
Topological properties of PPINs are often investigated in predicting disease genes [3, 4, 6]. A hub (a node with a high degree) in a network is more likely to be associated with essential genes and cancers [2]. Betweenness centrality (bottleneck) measures the relative number of shortest paths passing through a vertex in connecting with all pairs of nodes and can be used to associate with mendelian and complex disease genes [7]. A topological module is a particularly dense region in PPIN. Topological modules may be network patterns owning particular characters (e.g. Graphlet [8], motif [9] and k-core [10]) or a variety of subgraphs identified by network clustering algorithms [11], etc. These topological modules can be used to predict disease genes due to the fact that genes associated with the same or similar diseases often carry specific cellular functions, cluster round common neighborhoods or share same topological features with each other [12]. Besides topological modules, there are the other two categories of modules, i.e. the module of function and disease. A functional module clusters nodes prone to similar function. A disease module encloses several nodes corresponding to a disease [3]. In practical application, the three modules are often considered to overlap each other and are approbated the hypothesis stating that proteins involved in the same disease have a tendency to interact with each other as a module [13]. Graphlet [14] and k-core [15] approaches have successfully been used to predict disease genes. Clustering subgraphs also can be used to predict new disease proteins [16]. Approaches of predicting disease proteins based on topological properties of networks can complement each other. However, data errors (false positives) and defections (false negatives) in PPINs may distort physical structure of networks and interfere topological properties associated with diseases [17].
A clique is a fully connected subgraph and possesses advantages of topological modules. And, the changeless paradigm of a clique construction is unique and rigorous compared with clusters. Cliques have been used successfully to identify functional modules and protein complexes in PPINs [18]. A clique approach of associating diseases is proved to be feasible and effective in a small pathway [19]. However, clique centrality based on a large PPIN applied to disease study also have some limitations, involving complex computation, the stringent rule of forming clique and the obstruction of incomplete data. Undeniably, cliques in PPINs have importantly biological significance. The complex diseases (e.g. cancers) exhibit an increase in connectivity [15], which properly agrees with the clique structure. Proteins in disease-related cliques are more likely to associates with diverse phenotypes. Perturbation of arbitrary node in a clique will directly destroy the function of other neighbors. Furthermore, disease-related cliques provide a good clue for disease pathogenesis. For instance, the neighbors of disease-related cliques exhibit to be valuable candidates because they may be connected by high-degree hubs in a network [17], or may represent interesting drug targets [20].
We propose an approach based on cliques in a large scale PPIN to predict disease-related proteins. First, we annotate each protein in a PPIN with a known disease dataset. Then, we mine cliques in the PPIN and identify the disease-related cliques via a statistical significance test of disease proteins. Finally, disease proteins are predicted based on disease-related cliques. The disadvantage of the approach of only using clique topology is easily impacted by the deficient data in a PPIN. The structure of a clique is so stringent that false negative interactions in a PPIN will easily interfere with the number of mined cliques. Hence, we relax the clique criterion, i.e., allowing a clique to have a few missed edges, to increase the number and size of cliques. The extended cliques that closely approximate to cliques are named as ex-cliques. Extending cliques increases the number and size of cliques, which directly leads to the increment of predicted disease proteins. But many false positive interactions may be included in ex-cliques and affect the accuracy of predicting disease proteins. So, gene ontology (GO) scoring is introduced to decide the final predictions of disease proteins according to the fact that genes associated with the same disorder have significantly higher GO homogeneity than random expectation [2]. Scoring predicted disease proteins is based on three hierarchies of GO containing molecular functions (MF), biological processes (BP) and cellular components (CC) [21]. GO scoring improves the quality of predicted disease proteins.
The performance of our approach is estimated under two conditions of the simulated deficiency, i.e., incomplete protein interaction data and missing known disease proteins. To simulate the first situation, we use two real PPINs. One comes from the Human Protein Reference Database (HPRD) [22], and the other is the Online Predicted Human Interaction Database (OPHID) [23], which is larger than HPRD and almost covers it. HPRD dataset can simulate a PPIN with data defection if the PPIN of OPHID is viewed as a relatively full dataset. The predicted numbers of disease proteins based on the two PPINs are 69 and 83, respectively. The predicted disease proteins are verified by the Genetic Association Database (GAD) [24] with precisions of 95.65% and 95.18%, respectively. The original number of protein-protein interactions lightly affects the prediction number of disease proteins but not the precision. It demonstrates that our approach is robust against noise of false negatives. To simulate the second situation, known disease proteins are hidden randomly with various numbers of four groups. The experiment of each group is repeated 1000 times (details see results). The precision expectation of each group is still stably above 95% and the recall expectation of hidden disease proteins is ~10%. Therefore, the approach of predicting disease-related proteins is reliable. It contributes to emphasize some significant proteins on pathogenic mechanism of complex or serious diseases.
Materials and Methods
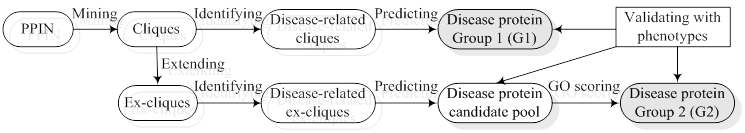
Predicting disease proteins is based on a PPIN and known disease proteins (see Fig. 1), which mainly includes the steps of mining and extending cliques, identifying disease-related cliques and scoring the predicted disease proteins with GO. We obtain two groups of the predicted disease proteins via selecting different routes in Fig. 1. The first group (G1) of the predicted disease proteins is generated only based on network topology of cliques. The second group (G2) is derived from the appended steps of extending cliques and scoring predictions with GO. The predicted disease proteins are evaluated with disease phenotypes, respectively. Via estimating the number and precision of predictions between G1 and G2, we can identify a suitable route to predict disease proteins.
Flowchart of predicting disease proteins.
Data materials
We applied our approach to two human PPINs, respectively. The version of HPRD was Release9 and the one of OPHID was 2.0. The PPIN of OPHID was a mixed dataset which contained the protein-protein interactions oriented from multiple databases. We picked through interactions from databases of BIND [25], HPRD and MINT [26] to insure the reliability of interactions. The self and repeat interactions in these two PPINs were eliminated in order to mine cliques in a PPIN. Proteins in a PPIN were labeled with the state of normal or disease (0/1). The information of disease proteins could be extracted from the Online Mendelian Inheritance in Man (OMIM) database [27], which contained 5,662 diseases in the file “morbidmap” and was last updated on February 22, 2011. Protein names in OPHID were translated from Swiss-Prot name to gene symbol name using the UniProt Knowledgebase [28] since the genotype-phenotype relationship in OMIM only contained gene symbol names. Proteins which did not match gene symbol names and their interactions were removed from the PPIN of OPHID. The final PPIN of HPRD contained 36,867 interactions of the original 39,240 ones; the PPIN of OPHID kept 43,180 interactions from the original ~64,000 ones. The protein nodes in HPRD and OPHID were 9,463 and 9,969, of which 1,840 and 1,887 were labeled as disease proteins via the map of OMIM, respectively.
Mining cliques in a PPIN
A PPIN is modeled as an undirected graph G = (V, E), where V is the set of all vertices (proteins) and E is the set of all edges (interactions) in the graph G. Mining cliques in a graph is well known as an NP-complete problem [29]. Due to the scale-free character of a PPIN, i.e. most proteins participate in only a few interactions, the current enumeration algorithms of mining clique works well. This paper applied the method of mining clique proposed by Gendreau et al. [30] to obtain all cliques in a PPIN.
Extending the minded cliques
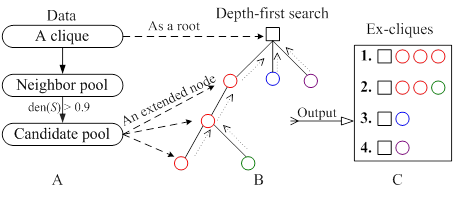
The mined cliques as kernels were extended by relaxing the density of a clique from 1 to 0.9. For a cluster (highly connected subgraph) S, the density, den(S), of S is defined as den(S)=2m/n(n-1), where m and n are the number of edges and nodes in S, respectively. Fig. 2 showed the process of extending a clique based on a tree approach. For a given clique, the potentially extended nodes came from the neighbor of clique components, which constituted a neighbor pool. Every node in the neighbor pool was appended into the clique. The density of the new clique was calculated. If it was more than 0.9, the node of neighbor pool would be appended into the candidate pool (Fig. 2A). The nodes of candidate pool enlarged a clique to an extended clique. The clique was viewed as a root and was extended by one or more nodes from the candidate pool. We applied a greedy depth-first search, i.e., the node was selected to generate a bigger ex-clique if it was appended into the current clique and the new clique had the highest density, and then the node was removed from the candidate pool. Once an ex-clique was not enlarged, the tree investigation returned to the up level to begin a new search (see Fig. 2B and 2C). This process was repeated until the candidate pool was null. Detail contents of the algorithm could be seen in the supplementary material.
The process of extending a clique. (A) Identification of the extended nodes space; (B) A depth-first search tree with the square and circle representing a clique and an extended node from the candidate pool, respectively; (C) The extended clique set.
Scoring predicted disease proteins with GO terms
Proteins in disease-related cliques were prone to having the similar GO terms. We partitioned proteins in a disease-related clique into two groups, i.e. normal set and disease set corresponding to depositing predicted disease proteins and known disease proteins, respectively. A protein in the normal set would be compared with every protein in the disease set to investigate whether a common term existed on three respective levels of GO. For example, in a disease clique, m proteins (p1, p2, … , pm) were involved in the disease set and a protein p0 came from the normal set. They were annotated with GO terms. A common term between protein p0 and pi (i = 1,…, m) was required at least on MF, BP and CC level of GO, respectively. If there was not a common term between p0 and a disease protein pi on a level of GO, p0 was not predicted as a disease protein and would be filtered out from predictions. The process of scoring the predicted disease protein p0 on MF of GO was calculated as follows (Formula 1 and 2).
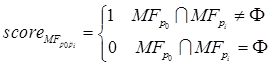
(1)
(2)
The scores of the protein p0 based on BP of GO (scoreBP) and CC of GO (scoreCC) were similarly obtained just like scoreMF. The final GO score of the protein p0 in the clique was as bellow.
(3)
The GO score of every predicted disease protein was from 0 to 3. The predicted disease proteins were abandoned if the GO score was smaller than 3.
Validating the predicted disease proteins
In order to validate our predicted disease-related proteins, we compared them with the dataset of the Genetic Association Database (GAD), which contained curated data extracted from references on candidate gene studies and afforded information of disease phenotypes and classifications. The quality of predicted disease proteins was evaluated by Precision. A predicted disease protein was confirmed as a true positive (TP) if it mapped a phenotype of a protein in GAD at least, otherwise it was a false positive (FP). Precision was the proportion of the predicted disease proteins hit in GAD and was defined as bellow. Furthermore, we evaluated the recovery performance of our approach under the deficiency of known disease proteins. Some known disease proteins associated with disease-related cliques and ex-cliques were hidden. The proteins of the hidden set found in the predictions were true positives (TP), otherwise were false negatives (FN). Recall was defined as follows,
, and
.
Results
Performance on different PPINs
Our approach was applied to the PPINs of HPRD and OPHID, respectively. The interactions of OPHID were ~6000 more than the ones of HPRD. Fig. 3 showed the related data in each step of our approach. We obtained three predicted groups from a PPIN based on different steps, i.e., G1 (only using cliques), the candidate pool (only using ex-cliques) and G2 (using ex-cliques and GO scoring). The numbers of every predicted group from HPRD were less than the ones of OPHID. The more interactions generated the more cliques and ex-cliques, leading to predicting more disease proteins. The overlaps of predictions between the two PPINs had high proportions to predictions derived from HPRD, i.e. 88.24% and 92.75%, respectively. For all predictions from the two PPINs, the overlap ratio of various predicted groups between the two PPINs was defined as follows,
Data flowchart of every performed process based on two PPINs.

Oi = |Gi∩Gi'| / |Gi∪Gi'| (i = 1, 2),
where O1 represented the overlap ratio between G1 and G1', and O2 represented the overlap ratio between G2 and G2'. We found O2 (73%) > O1 (67%), which implied that predicting disease protein based on the process of ex-cliques and GO scoring was more stable than only using cliques. And we noted that the number of predictions of HPRD based on ex-cliques and GO scoring was more than the one from OPHID only using cliques (|G2|>|G1'|). This also illustrated that the process of extending cliques could compensate the deficiency of a PPIN in some ways.
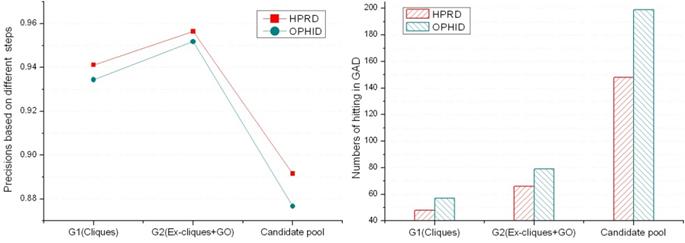
Evaluating predicted diseases with GAD
According to known disease phenotypes in GAD, we evaluated six groups of predicted disease proteins. Fig. 4 showed that precisions between the same kinds of predicted groups from two PPINs were close. The precisions of G2 are better than others, and the predicted numbers of the candidate pool are much more than the ones of G1 and G2. Predicting disease proteins was feasible only based on cliques if the PPIN was relatively complete and reliable. But using ex-cliques and GO scoring to predict disease proteins was more recommended according to the three factors (precision, predicted number and reliability of a PPIN). We applied it in predicting disease proteins based on the PPIN. For G2 derived from the PPIN of HPRD, 66 proteins of the 69 predicted disease ones were verified by GAD (Details could be seen in the supplementary material). The three remained proteins were found in another online disease database, Cancer Genome Anatomy Project (CGAP) [31], including genomic data for human, such as single nucleotide polymorphisms (SNPs). Protein KAT5 (OMIM: 601409), GTF2I (OMIM: 601679) and SUV39H1 (OMIM: 300254) were not hit in GAD. The state of KAT5 was the candidate SNPs, and GTF2I and SUV39H1 were the validated SNPs. Similarly, 79 proteins of the 83 predicted disease proteins derived from the PPIN of OPHID were verified by GAD (see the supplement material). There were four unconfirmed proteins. Three were as same as the unconfirmed ones in HPRD. The new protein was KPNA1 (OMIM: 600686), which was a candidate SNPs in CGAP. In the other hand, the precision of G2 was better than the one of G1'. This illustrated that the performance based on ex-cliques and GO scoring from a deficient PPIN was better than the one only using cliques from a relatively complete PPIN.
The precisions and numbers of the predicted disease proteins hitting in GAD.
Performance under deficiency of known disease proteins
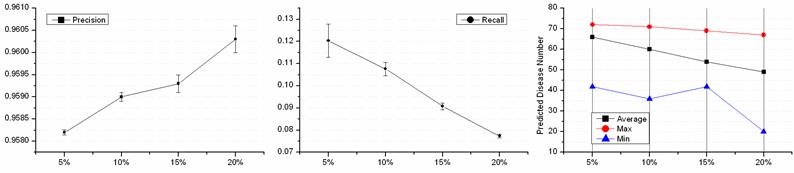
A PPIN decided the number of cliques, and identifying disease-related cliques depended on known disease proteins. 220 disease proteins were involved in the disease-related cliques and ex-cliques based on the PPIN of HPRD. A leave-out approach was introduced to examine the performance of disease-related protein predictions with the defection of the disease data. We randomly hid k% disease proteins of the 220 disease proteins and artificially turned them to normal state. Four groups of disease defection, i.e. 5%, 10%, 15% and 20%, were evaluated. The test of each group was repeated 1000 times and the performance was shown in Fig. 5. The precisions of four groups were from 95.82% to 96.03% and almost equaled each other. And, the less known disease proteins were hidden, the smaller the precision of predictions waved. With the hidden disease proteins increasing, the numbers of the predicted disease proteins decreased. Interestingly, each average of the decreased ratio was ~10% of the predicted disease proteins while hiding 5% known disease ones. This illustrated that the deficiency of known disease proteins affected predictions of disease proteins not in the aspect of the precision but the number. The more disease proteins were known, the more new disease proteins could be predicted. The average Recall showed that recovering disease proteins was not a superior ability. Thus, the integrity of more information of known disease proteins contributed to the discovery of disease ones.
Performance on disease proteins defection. The horizontal coordinate represents the deficient percentage of the known disease proteins.
Contribution of GO scoring
Extending cliques in a PPIN enlarged the number and size of disease-related cliques. As a result, the more disease proteins were predicted. But ex-cliques might contain some false positive interactions. This decreased the strict rule of forming a clique, reducing precisions of predicting disease protein. The precision of the predicted disease proteins from the candidate pool dropped about 5% compared with the one based on cliques (see Fig. 4). GO terms were independent of PPIN datasets, which could reduce the interference of the false positive interactions in a PPIN and improve the precision of predictions. On the other hand, the common predicted disease proteins between G1 and G2 were almost one-third of total predictions corresponding to the PPINs of HPRD and OPHID, respectively (see table 1). There were many different predictions based on the methods between GO similarity and pure network topology of cliques. This was because not only the process of extending cliques predicted news disease proteins, but also GO scoring filtered out many predictions of G2 contained in G1. This also illustrated that predictions from G1 and G2 could compensated each other.
A contrast between having GO and without GO.
| G1 | G2 | G1∩G2 | G1∪G2 | Overlap | |
|---|---|---|---|---|---|
| HPRD | 51 | 69 | 29 | 91 | 32% |
| OPHID | 61 | 79 | 36 | 104 | 35% |
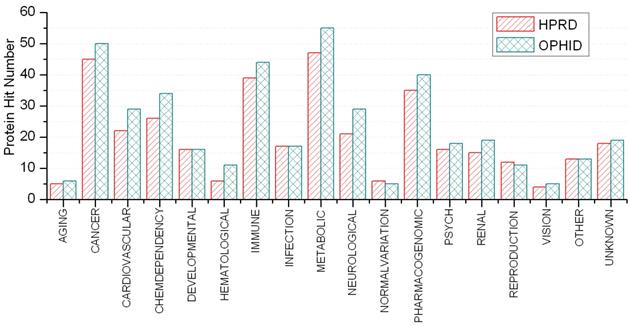
Disease classification on predicted disease-related proteins
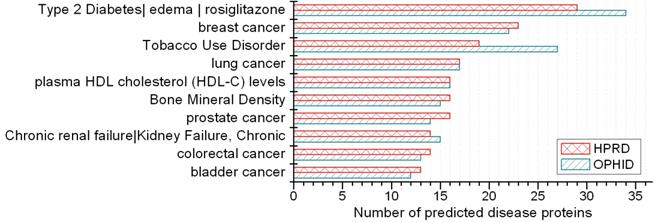
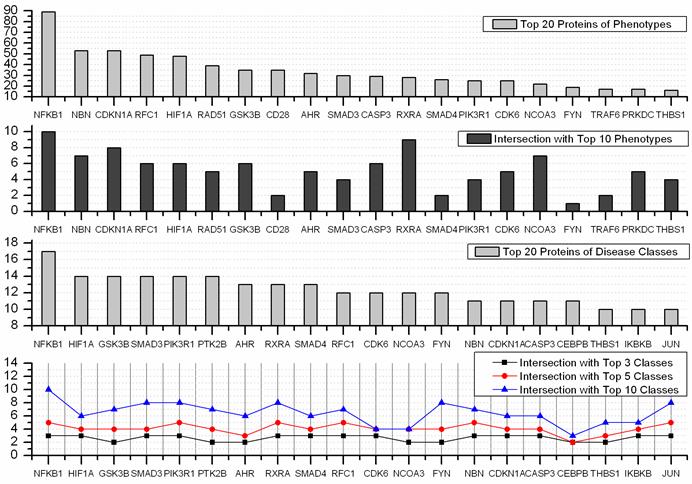
A disease class always includes various phenotypes, and a phenotype may associate with one or multiple disease classes. A predicted protein may correspond to various disease phenotypes which possibly belong to the same or multiple disease classes. The predicted disease proteins (G2 and G2') from HPRD and OPHID involved 461 and 473 disease phenotypes, respectively. These phenotypes related to 18 disease classes (see Fig 6). The top three disease classes were same as the predictions based on HPRD and OPHID, which were METABOLIC, CANCER and IMMUNE. The top ten phenotypes of the predicted disease proteins were showed in Fig. 7 and the top fifty of frequent phenotypes were listed in the supplementary material. Of the top ten and fifty phenotypes from the 66 predicted disease proteins of HPRD, six and 23 phenotypes belonged to cancer class, respectively. These top phenotypes represented the common diseases which the predicted disease proteins based on cliques were most likely tended to link with. We listed the twenties predicted disease proteins of HPRD having the most numbers of phenotypes and disease classes, respectively (see Fig. 8). Most of the proteins were consistent with the top phenotypes and disease classes, but some were not. This illustrated that the proteins having most phenotypes and disease classes were not always associated with the top ones.
Disease classifications of predicted disease proteins.
Top 10 phenotypes of predicted disease proteins.
Top 20 predicted disease proteins of phenotypes and disease classes, and their intersections with the top n phenotypes and classes.
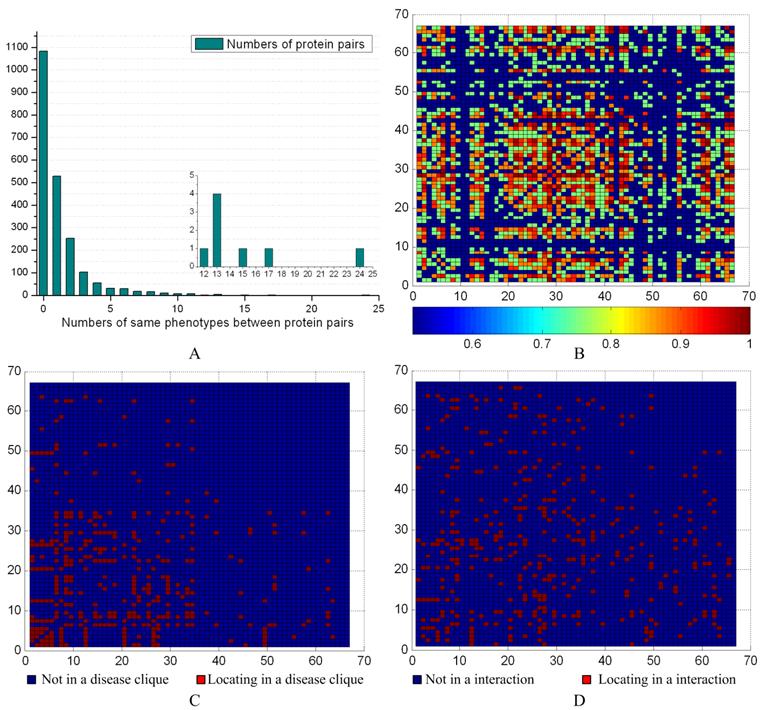
Phenotypes similarity of predicted disease proteins based on cliques
We evaluated the phenotype associations with disease-related ex-cliques and interactions for the 66 predicted disease proteins from G2 based on the PPIN of HPRD (see Fig. 9). The maximal number of having common phenotypes was 24 between the proteins NBN and RAD51. The detail contents of phenotype between protein pairs could be seen from the supplement materials. There were 1067 pairs (about ~50%) having common phenotypes between 66 proteins (see Fig. 9A). According to the distribution of the common phenotypes between protein pairs, we obtained their similarity degree (p-value) with a significance test for each pair (see Fig 9B). The Fig. 9C and 9D showed that most of pairs were not from a disease-related ex-clique or an interaction, respectively. Overall, the pairs between predicted disease proteins derived from the different disease-related ex-cliques and interactions might have a common phenotype. On the other hand, a pair from a disease-related ex-clique or an interaction was prone to having a common phenotype, but not necessary.
Phenotype similarities of predicted disease proteins. (A) The distribution of the common phenotypes between predicted disease proteins. The inset highlights the lower left corner of the histogram to show the numbers of common phenotypes between 12 and 24. (B) The horizontal and vertical coordinates represent the 66 predicted disease proteins based on the PPIN of HPRD. The heat map shows the significance between two predicted disease proteins, and values were calculated with 1-p. (C) The mark in a common disease-related clique between two proteins. (D) The mark in an interaction between two proteins.
Assistance to studying complex disease with predicted disease proteins in cliques
Appending the predicted disease proteins into the PPIN resulted in all of components of a disease-related clique to be disease proteins. According to relationships between genotype and phenotype, subgraphs of protein interaction were converted to the corresponding subgraphs of phenotype similarity and disease classification, respectively. The phenotype similarity between protein pairs in a disease-related clique C could be measured by the common phenotype density of a clique which was defined as CP(C)=2m/n(n-1), where m was the number of protein pairs in C having a or more common phenotype(s) and n was the number of nodes in C, respectively. There were 228 disease ex-cliques (including cliques) in the PPIN of HPRD whose all components possessed phenotypes. The mean value of CP(C) of them was 0.8469 and the standard deviation of CP(C) was 0.1625. This also indicated that most protein pairs between disease-related cliques had common phenotypes. Integration of three kinds of networks provided a wide insight in investigating human diseases. The predicted disease proteins had a pushing effect on this process. Fig. 10 showed the relationships of interaction, phenotype and disease classes between proteins in the clique using three examples to make us understand related diseases directly.
The network of protein interaction, phenotype and disease class based on disease-related cliques. The red node represents known disease proteins, and the yellow nodes are predicted disease proteins. The blue dot line denotes non-interaction relationship between nodes in the “Interaction” subgraphs. The disease proteins are connected by same phenotypes and disease classes in the “Phenotype” and “Disease class” subgraphs, respectively. Gray lines of varying thickness indicate the degree of disease phenotypic and the class similarity between disease genes, respectively.
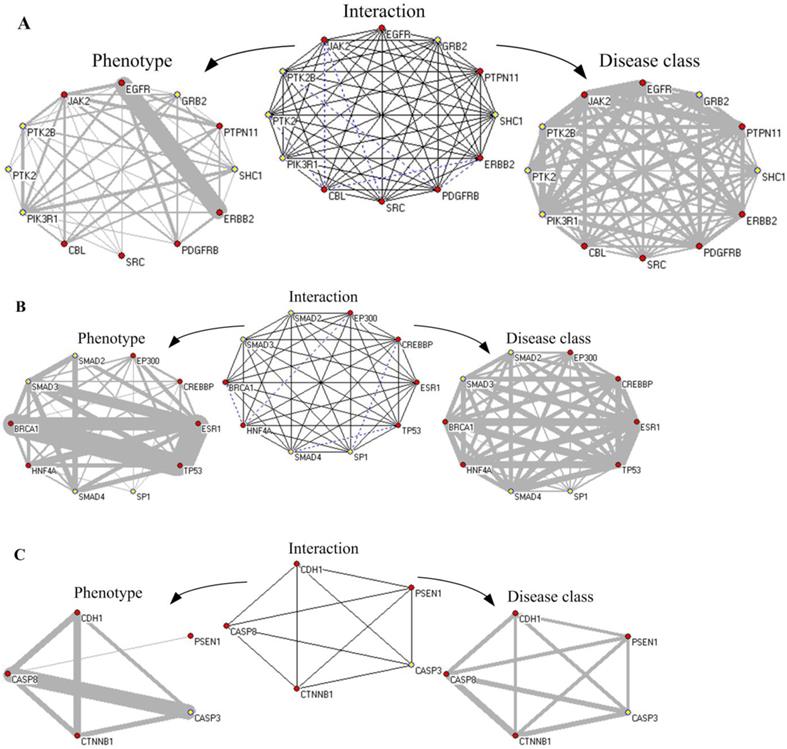
First, Fig. 10A showed an ex-clique of 12 nodes, including five disease proteins (yellow nodes). Based on the knowledge of GAD and GO terms, four predicted disease proteins (excluding PTK2) involved the phenotype of “Tobacco Use Disorder” and participated in the biological process of “epidermal growth factor receptor signaling pathway”; PTK2, PTK2B and PIK3R1 belonged to “HIV”; PTK2B, SHC1 and PIK3R1 were related with “longevity”; and PTK2B, GRB2 and PIK3R1 were associated with “Type 2 Diabetes”. GRB2, SHC1 and PIK3R1 participated in the biological process of “leukocyte migration” and “insulin receptor signaling pathway”. Especially, there were 21 common phenotypes between EGFR and ERBB2. All of proteins in the clique were associated with cancer. Multiple proteins annotated with GO terms in the ex-cliques were various growth factors or cell proliferation.
Second, in Fig. 10B, the predicted disease proteins, SMAD3, SMAD2 and SMAD4, were annotated by GAD and involved in diverse disease, such as hepatopulmonary syndrome, bone and colorectal cancer. SMAD3 and SP1 were associated with head and neck neoplasms. The proteins in the clique of size 10 denoted various diseases, i.e. breast cancer, Alzheimer's disease, epithelial ovarian cancer and pancreatic neoplasms, etc. The proteins in the clique were classified into cancer. Most of them (excluding EP300 and SP1) belonged to immune class. All of the four predicted disease proteins had the GO annotation on the biological process of “positive regulation of transcription from RNA polymerase II promoter”.
Third, Fig. 10C showed a clique of five nodes containing one predicted disease protein, CASP3. The five proteins in the clique were annotated with GO and they all participated in the biological process of “apoptosis”. CASP3, CDH1, CTNNB1 and CASP8 were explained by GAD, including multiple diseases, such as bladder cancer, lung cancer, colorectal cancer and chronic obstructive pulmonary disease. In the clique, PSEN1 played a role of regulation with other proteins in the clique. CASP3 and CASP8 had 21 common phenotypes about various cancers and the common biological process of “response to tumor necrosis factor”. The five proteins in the clique belonged to metabolic and developmental classifications.
Discussion
Predicting disease proteins only using the network topology of cliques is feasible in a large PPIN. But a PPIN may include various false positive and negative interactions and will affect disease protein predictions. This paper proposes a clique method combined clique extending and GO scoring which has the advantage of being more robust against the deficiency of network data. The precision and number of the predicted disease proteins are better than only using clique topology. However, extending clique and GO scoring also have to face with certain problems to be solved. For instance, how do we identify the density of extended cliques? We present the relaxation threshold 0.9, which is applied based on two reasons, i.e. computational complexity and clique approximation. Generally, the density of tightly connected clusters (modules) derived from PPINs is required to be more than 0.7. If we set the density of extended cliques to 0.7, the number of the extended cliques will increase dramatically and the computational time is oppressive. The quality of the extended cliques is lower than that of clustering subgraphs in PPINs. This is because the density of the kernel of the extended cliques is high and the density of peripheral subgraphs containing extended nodes is low. Under the situation of the same subgraph density, the edge distribution of the subgraphs identified with clustering methods is more symmetric than the one of ex-cliques. To keep the stringent rule of clique, we propose a tradeoff density of ex-cliques to be 0.9 corresponding to a good result of extending cliques. Another interference comes from the absent knowledge of GO. GO scoring may filter some predictions of true disease proteins due to the incompleteness of GO annotations.
Predicted disease proteins based on cliques are always associated with multiple diseases. It is prone to having common phenotypes between them; especially they are from a clique. Active phenotypes of disease proteins may be decided by their neighbors in a clique. The predicted disease proteins enrich disease-related cliques, and we can get more important clues in studying complex diseases from them. However, the information is diverse and tangled. The components of the cliques are associated with multiple diseases, between which logical relationships probably exists. For instance, in Fig. 10A, there are multiple proteins having the disease phenotypes “Tobacco Use Disorder”, “Type 2 Diabetes” and “Pancreatic Neoplasms”. Maybe a leader phenotype induces the others, or the one is guided by the combination of two other phenotypes. Regretfully, a PPIN is an undirected graph and it is unknown who the origin is and who the result is. This may be solved via integrating interaction networks with other corresponding cellular networks, such as metabolic and gene regulatory networks.
Supplementary Material
S1 - S6.
Acknowledgements
We gratefully acknowledge Dr. Alex Wang for providing the GAD dataset.
Competing Interests
The authors have declared that no competing interest exists.
References
1. Barabasi AL, Oltvai ZN. Network biology: Understanding the cell's functional organization. Nat Rev Genet. 2004;5:101-U15
2. Goh K-I, Cusick ME, Valle D, Childs B, Vidal M, Barabasi A-L. The human disease network. Proc Natl Acad Sci USA. 2007;104:8685-90
3. Furlong LI. Human diseases through the lens of network biology. Trends Genet. 2013;29:150-9
4. Ideker T, Sharan R. Protein networks in disease. Genome Res. 2008;18:644-52
5. Wang X, Gulbahce N, Yu H. Network-based methods for human disease gene prediction. Brief Funct Genomics. 2011;10:280-93
6. Vidal M, Cusick ME, Barabasi A-L. Interactome networks and human disease. Cell. 2011;144:986-98
7. Cai JJ, Borenstein E, Petrov DA. Broker genes in human disease. Genome Biol Evol. 2010;2:815-25
8. Przulj N. Biological network comparison using graphlet degree distribution. Bioinformatics. 2007;23:e177-e83
9. Wuchty S, Oltvai ZN, Barabasi A-L. Evolutionary conservation of motif constituents in the yeast protein interaction network. Nature Genet. 2003;35:176-9
10. Dorogovtsev SN, Goltsev AV, Mendes JFF. K-core organization of complex networks. Phys Rev Lett. 2006;96:040601
11. Brohee S, van Helden J. Evaluation of clustering algorithms for protein-protein interaction networks. BMC Bioinformatics. 2006;7:488
12. Oti M, Brunner HG. The modular nature of genetic diseases. Clin Genet. 2007;71:1-11
13. Barabasi AL, Gulbahce N, Loscalzo J. Network medicine: a network-based approach to human disease. Nat Rev Genet. 2011;12:56-68
14. Sarajlic A, Janjic V, Stojkovic N, Radak D, Przulj N. Network Topology Reveals Key Cardiovascular Disease Genes. PLoS One. 2013 8
15. Wachi S, Yoneda K, Wu R. Interactome-transcriptome analysis reveals the high centrality of genes differentially expressed in lung cancer tissues. Bioinformatics. 2005;21:4205-8
16. Sun PG, Gao L, Han S. Prediction of human disease-related gene clusters by clustering analysis. Int J Biol Sci. 2011;7:61
17. Taylor IW, Wrana JL. Protein interaction networks in medicine and disease. Proteomics. 2012;12:1706-16
18. Spirin V, Mirny LA. Protein complexes and functional modules in molecular networks. Proc Natl Acad Sci USA. 2003;100:12123-8
19. Massa MS, Chiogna M, Romualdi C. Gene set analysis exploiting the topology of a pathway. BMC Syst Biol. 2010;4:121
20. Yildirim MA, Goh KI, Cusick ME, Barabasi AL, Vidal M. Drug-target network. Nat Biotechnol. 2007;25:1119-26
21. Harris MA, Clark J, Ireland A, Lomax J, Ashburner M, Foulger R. et al. The Gene Ontology (GO) database and informatics resource. Nucleic Acids Res. 2004;32:D258-61
22. Prasad TSK, Goel R, Kandasamy K, Keerthikumar S, Kumar S, Mathivanan S. et al. Human Protein Reference Database-2009 update. Nucleic Acids Res. 2009;37:D767-D72
23. Brown KR, Jurisica I. Online predicted human interaction database. Bioinformatics. 2005;21:2076-82
24. Becker KG, Barnes KC, Bright TJ, Wang SA. The genetic association database. Nature Genet. 2004;36:431-2
25. Bader GD, Betel D, Hogue CWV. BIND: the biomolecular interaction network database. Nucleic Acids Res. 2003;31:248-50
26. Chatr-Aryamontri A, Ceol A, Palazzi LM, Nardelli G, Schneider MV, Castagnoli L. et al. MINT: the molecular INTeraction database. Nucleic Acids Res. 2007;35:D572-D4
27. Hamosh A, Scott AF, Amberger JS, Bocchini CA, McKusick VA. Online Mendelian Inheritance in Man (OMIM), a knowledgebase of human genes and genetic disorders. Nucleic Acids Res. 2005;33:D514-D7
28. Bairoch A, Apweiler R, Wu CH, Barker WC, Boeckmann B, Ferro S. et al. The universal protein resource (UniProt). Nucleic Acids Res. 2005;33:D154-D9
29. Garey MR, Johnson DS. Computers and intractability. San Francisco, USA: Freeman New York. 1979
30. Gendreau M, Soriano P, Salvail L. Solving the maximum clique problem using a tabu search approach. Ann Oper Res. 1993;41:385-403
31. Strausberg RL, Buetow KH, Emmert-Buc MR, Klausner RD. The cancer genome anatomy project: Building an annotated gene index. Trends Genet. 2006;16:103-6
Author Biography
Lei Yang is a doctoral fellow in School of Computer Science and Technology, Harbin Institute of Technology. His research focuses on discovery of disease-related proteins and modules derived from protein interaction networks.
Xudong Zhao received his Ph.D. degree and worked as a research assistant in School of Computer Science, Harbin Institute of Technology. His research interests include biostatistics and cancerous gene mining on expression profiles.
Xianglong Tang is a professor in School of Computer Science and Technology, Harbin Institute of Technology. He is the director of research center of pattern recognition who aims to understand relationships within various human diseases based on molecular networks using methodologies of machine learning and artificial intelligence.
![]() Corresponding author: yangledu.cn.
Corresponding author: yangledu.cn.