Impact Factor ISSN: 1449-2288
- Issue 12; 2026
- Issue 11; 2026
- Issue 10; 2026
- Issue 9; 2026
- Issue 8; 2026
- Volume 22; 2026
- Past Issues
- Advance Articles
- Editorial Board
- Cover Images
- Index & Coverage
- Cover Suggestion
- Special Issues
Introduction
Materials and Methods
Results
Discussion
Abbreviations
Supplementary Material
Acknowledgements
References

 Global reach, higher impact
Int J Biol Sci 2015; 11(2):199-208. doi:10.7150/ijbs.10430 This issue Cite
Research Paper
A Soluble Activin Receptor Type IIB Does Not Improve Blood Glucose in Streptozotocin-Treated Mice
Qian Wang1, Tingqing Guo2, Jennifer Portas, Alexandra C. McPherron3 ![]()
Genetics of Development and Disease Branch, National Institute of Diabetes and Digestive and Kidney Diseases, National Institutes of Health, Bethesda, Maryland, USA
1. Current Addresses: Pathology Department, Stony Brook University Medical Center, Stony Brook, New York, USA
2. Novo Nordisk Research Centre China, Changping District, Beijing, China
3. Myotherapeutics, Silver Spring, Maryland, USA
Received 2014-8-28; Accepted 2014-11-5; Published 2015-1-5
Abstract

Type 1 diabetes mellitus (T1DM), or insulin dependent DM, is accompanied by decreased muscle mass. The growth factor myostatin (MSTN) is a negative regulator of muscle growth, and a loss of MSTN signaling has been shown to increase muscle mass and prevent the development of obesity, insulin resistance and lipodystrophic diabetes in mice. The effects of MSTN inhibition in a T1DM model on muscle mass and blood glucose are unknown. We asked whether MSTN inhibition would increase muscle mass and decrease hyperglycemia in mice treated with streptozotocin (STZ) to destroy pancreatic beta cells. After diabetes developed, mice were treated with a soluble MSTN/activin receptor fused to Fc (ACVR2B:Fc). ACVR2B:Fc increased body weight and muscle mass compared to vehicle treated mice. Unexpectedly, ACVR2B:Fc reproducibly exacerbated hyperglycemia within approximately one week of administration. ACVR2B:Fc treatment also elevated serum levels of the glucocorticoid corticosterone. These results suggest that although MSTN/activin inhibitors increased muscle mass, they may be counterproductive in improving health in patients with T1DM.
Keywords: activin receptor, glucocorticoid, myostatin, muscle hypertrophy, type 1 diabetes
Introduction
Insulin-dependent diabetes, or type 1 diabetes (T1DM), is caused by an autoimmune reaction against the insulin-producing beta cells of the pancreas (1). The prevalence of type 1 diabetes varies widely with geography and appears to be increasing due to a recent rise in incidence (2-4). In addition to its function in regulating glucose metabolism, insulin is an anabolic hormone that promotes lipid and protein synthesis and inhibits protein degradation (5). There are many possible complications from poorly controlled diabetes including neuropathy and muscle atrophy (6,7). T1DM patients have reduced muscle mass and myofiber size even at the time of diagnosis and before pathological change at the neuromuscular junction (8-10). Within days of the induction of insulin deficiency in rodents, muscle protein degradation is increased by activation of the ubiquitin-proteasome pathway (11-14). Taken together, these results suggest that muscle fiber atrophy is manifest early in the disease and can occur independent of neuronal pathology.
One means of increasing muscle mass is by inhibiting the signaling pathway of the transforming growth factor β (TGFβ) superfamily member myostatin (MSTN). MSTN is primarily expressed in skeletal muscle and is found in circulation in an inactive latent complex (15-17). MSTN normally inhibits skeletal muscle growth as shown by an increase in skeletal muscle mass in mice, cattle, sheep, dogs and in one child with inactivating mutations in the MSTN gene (18). Overexpression of the MSTN gene causes muscle wasting in rodents as would be expected for an inhibitor of muscle growth (19,20). MSTN binds to the type II activin receptors, particularly activin receptor type IIB (ACVR2B) (21-23). The ligand-receptor complex then recruits a type I receptor, activin-like kinase (ALK) 4 or 5, to initiate signal transduction (23,24). The activin receptors can also mediate signaling of other TGF-beta family members, some of which have also been demonstrated to negatively regulate muscle growth (22,25-27). When given to adult mice, inhibitors of this pathway cause fiber hypertrophy and increased muscle mass (22,28,29). MSTN antagonists or ACVR2B antagonists are currently in clinical trials for a variety of muscle wasting conditions including hip replacement, cachexia, and muscular dystrophies.
Lean mass is also important for glucose metabolism. Lean mass, muscle mass or strength is inversely associated with insulin resistance in humans (30-34). In rodents, increasing skeletal muscle mass in mice prevents the development of obesity and impaired whole body glucose metabolism under conditions that promote obesity and/or insulin resistance (35). This process is not fully understood in detail, but in general, these results suggest that hypertrophied muscle may use energy that would otherwise be stored as lipid and lead eventually to insulin resistance. Along these lines, a MSTN inhibitor was shown to increase glucose transporter 4 (GLUT4) expression and glucose uptake in response to glucose injection more than might be expected by the increase in muscle mass alone (36). This result raises the possibility that MSTN may have effects on glucose metabolism that are not solely due to a proportional increase in muscle mass. The effects of hypertrophy on T1DM are unknown, but an increase in basal or contraction-induced glucose into muscle could improve glucose control.
Several studies have examined the expression of the MSTN gene or protein in muscle from rodent models of T1DM as a potential explanation for reduced muscle size (37-44). However, these results are conflicting. Regardless of whether MSTN causes the reduced lean mass in T1DM, MSTN inhibitors could potentially aid in increasing muscle mass or glucose control in this condition. Therefore, we treated mice previously made hyperglycemic by streptozotocin (STZ) treatment with a soluble ACVR2B and analyzed muscle growth and glucose metabolism. We asked two questions: 1) Does blocking this pathway increase muscle mass in the absence of insulin after mice become hyperglycemic? 2) If so, does increasing muscle mass improve hyperglycemia in a T1DM model?
Materials and Methods
Animals
All animal procedures were approved by the Animal Care and Use Committee of the National Institute of Diabetes and Digestive and Kidney Diseases (NIDDK), NIH. Male C57BL/6Ncr mice were purchased from the NIH Animal Production Program (Frederick, MD) at age 5-6 weeks and used for experiments two weeks after arrival. Mice were fed NIH-07 chow diet ad libitum and kept under a 12-hr light/dark cycle with lights on at 6am.
Streptozotocin (STZ) treatment
STZ (Sigma) was freshly dissolved in sterile 50 mM sodium citrate buffer, pH 4.5. On day 1, mice were fasted for 4 hr prior to a single i.p. injection of 40 mg/kg body weight followed by daily injections without fasting for the next 4 days (n = 20/experiment). For a normal control group, citrate buffer was injected using the same time course (n = 4/experiment). Tail blood glucose was measured 7-10 days after the final STZ injection. STZ-treated mice with stable hyperglycemia defined as non-fasting blood glucose levels of >250 mg/dl for at least 2 consecutive days were used in the experiments (n = 14-16/experiment).
ACVR2B:Fc treatment
ACVR2B:Fc was purified as described (45). Mice with stable hyperglycemia were individually housed. Mice were randomly assigned to receive i.p. injections of 10 mg/kg body weight of ACVR2B:Fc (STZ+ACVR2B:Fc) or PBS vehicle injections (STZ+PBS) twice in the first week and weekly thereafter for the indicated number of days (n = 7-8/group). STZ with ACVR2B:Fc or PBS treatment was performed in three separate groups of mice treated for different lengths of time to assess reproducibility. PBS or the soluble receptor was given for a treatment period of 58 days (Group A), 42 days (Group B), or 11 days (Group C).
Metabolic measurements
Tail blood glucose was measured using a Contour glucometer (Bayer) after nicking the tail tip. Non-fasting glucose levels were measured between 3 and 5pm. Mice were deprived of food overnight for ~16 hr for fasting glucose measurements.
Tolerance tests were performed to assay hepatic and renal gluconeogenesis as described (from Group B; control n = 4; STZ-PBS, n = 8; STZ-ACVR2B:Fc, n = 8) (46). Briefly, to assay hepatic gluconeogenesis, mice were fasted for 16 hr and injected i.p. with sodium pyruvate (Sigma) dissolved in saline (1 g/kg body weight). Blood glucose was measured at 0, 15, 30, 60 and 120 min. To assay non-hepatic gluconeogenesis, mice were fasted overnight for ~20 hr and then injected i.p. with freshly dissolved L-glutamine (VWR) in water (1 g/kg body weight), and blood glucose was measured at 0, 15, 30, 60 and 120 min.
Body composition, tissue and serum collection and analysis
Total lean or fat mass was measured in conscious mice (from Group A; control n = 4; STZ-PBS, n = 8; STZ-ACVR2B:Fc, n = 8) in an EchoMRI™-100 body composition analyzer (EchoMRI, LLC, Houston, TX).
Serum was collected by cardiac puncture under pentobarbital anesthesia (80 mg/kg body weight) in the morning between 10am and noon. Serum insulin, glucagon (Millipore) and corticosterone (MP Biomedicals) concentrations were determined by radioimmunoassay kits according to the manufacturer's instructions. Liver and kidneys were collected and frozen immediately in liquid nitrogen. Pancreas tissues were weighed and fixed overnight with 4% paraformaldehyde in PBS followed by embedding in Optimal Cutting Temperature Compound (Tissue-Tek) for cryosectioning.
Measurement of alpha cell number
Whole pancreata were sectioned at 12 µm on a cryostat. Four sections per block were selected for immunofluorescence starting from section #120 and separated by 30 sections (from Group C; STZ-PBS, n = 7 mice; STZ-ACVR2B:Fc, n = 7 mice). Primary antibodies were rabbit anti-glucagon (1:50, AnaSpec, Inc.) and guinea pig anti-insulin (1:200, Invitrogen). Secondary antibodies were Alexa 488-conjugated donkey anti-rabbit IgG (1:200, Molecular Probes) and Alexa 568-conjugated donkey anti-guinea pig IgG (1:200, Molecular Probes). Sections were mounted in medium containing 4′,6-diamidino-2-phenylindole (DAPI) (Vectashield, Vector Laboratories) to visualize nuclei. To quantitatively evaluate alpha cells, all glucagon-positive cells were counted in the selected sections. The total pancreas area on the same sections was measured by NIS Elements analysis software (Nikon). The density of alpha cells was calculated by dividing the total number of glucagon-positive cells in the four sections by the total area of the pancreas in the same sections. The relative total alpha cell number was calculated by multiplying the alpha cell density by the pancreas weight and dividing the STZ-ACVR2B:Fc values by the mean of STZ-PBS values.
RNA isolation and quantitative (q) RT-PCR
Total RNA was isolated using Trizol Reagent (Invitrogen) and cleaned up with an RNeasy kit (Qiagen) according to the manufacturer's instructions. For qRT-PCR, samples were digested with DNase, followed by reverse transcription of up to 1 µg total RNA using Superscript II (Invitrogen). cDNA was quantified on an ABI Prism 7000 Sequence Detection System using SYBR green master mix (Applied Biosystems) with indicated primers and normalized to 18s rRNA expression (from Group B; control n = 4; STZ-PBS, n = 8; STZ-ACVR2B:Fc, n = 8). Primers used were 18s (m), 5'-tcaagaacgaaagtcggagg-3' and 5'-ggacatctaagggcatcaca-3'; Glucose-6-phosphatase (G6Pase), 5'-ccggatctaccttgctgctcacttt-3' and 5'-tagcaggtagaatccaagcgcgaaa-3'; Fructose-1,6-bisphosphatase (Fbpase), 5'-gctctgcaccgcgatca-3' and 5'-acattggttgagccagcgata-3'; Phosphoenolpyruvate carboxykinase (Pepck), 5'-ccacagctgctgcagaaca-3' and 5'-gaagggtcgcatggcaaa-3'. Amplification efficiencies were between 95-105%. Dissociation analysis was performed at the end of each reaction to confirm the presence of a single product.
Statistical analysis
Results were expressed as mean ± SE. For measurements with two groups, Student's t-test with two-tailed distribution was used. For measurements with three groups, one way ANOVA or repeated measures ANOVA were used as appropriate with Bonferroni correction for multiple comparisons (SPSS version 19). Data with unequal variance between groups were log transformed to restore equal variance. P < 0.05 was considered significant.
Results
Muscle mass
STZ treatment reduced insulin concentration of ~4% of untreated mice as expected and were not significantly different between PBS and ACVR2B:Fc treatment groups [control, 1.51 ± 0.35 ng/ml; STZ-PBS, 0.068 ± 0.017; STZ-ACVR2B:Fc, 0.06 ± 0.005; P < 0.001 for control vs. each STZ group]. Body weights of STZ-treated mice were significantly smaller than those of untreated control mice. ACVR2B:Fc treatment restored body weight to levels similar to control animals by one week after the first soluble receptor injection (Figure 1A). The average daily food intake was higher in both STZ groups compared to control mice but was not significantly different between PBS and ACVR2B:Fc treatment groups (Figure 1B).
ACVR2B:Fc increases body weight and muscle mass in STZ-treated mice. (A) Body weight of STZ-treated mice increases after ACVR2B:Fc injections to the level of control (no STZ) mice. (B) The average daily food intake. The x-axes (A and B) show time relative to the start of PBS or ACVR2B:Fc injection, and statistical significance was determined by repeated measures ANOVA. (C) Body composition analysis in conscious mice showing total lean mass (left panel) and fat (right panel) mass. (D) Weight of quadriceps and gastrocnemius muscles from control, STZ-PBS or STZ-ACVR2B:Fc mice. Data shown are all from Group A mice. Control, n = 4; STZ-PBS, n = 8; STZ-ACVR2B:Fc, n = 8. *P < 0.05, **P < 0.01, ***P < 0.001.
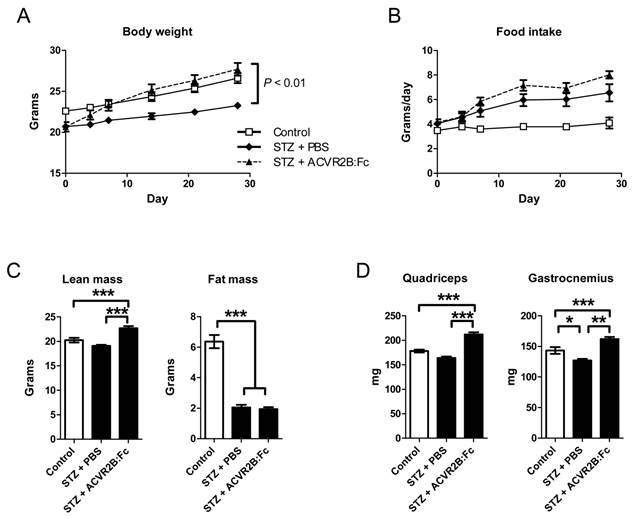
A difference in body composition accounted for the difference in body weight between PBS and ACVR2B:Fc treatment groups. Lean mass was higher in mice treated with ACVR2B:Fc compared to PBS (Figure 1C). ACVR2B:Fc treatment increased lean mass to a level higher than that of the control group that did not receive STZ (Figure 1C). Similarly, quadriceps and gastrocnemius muscle masses were increased by soluble receptor treatment compared to either STZ-PBS or to untreated control muscle (Figure 1D). This difference is muscle weight between STZ-PBS and STZ-ACVR2B:Fc mice occurred as early as 11 days after soluble receptor treatment (Supplementary Material: Figure S1). Thus, as in other mouse models, a soluble ACVR2B increases muscle mass. However, ACVR2B:Fc did not affect total fat mass in STZ mice compared to PBS treatment. Both STZ groups had a decrease in total fat mass of ~4 g compared to untreated control mice (Figure 1C). These results show that although overall body weight was recovered by ACVR2B:Fc injection in STZ-treated mice to a level comparable to that of control mice that did not receive STZ, body composition was quite different between control and STZ-ACVR2B:Fc groups.
Blood glucose
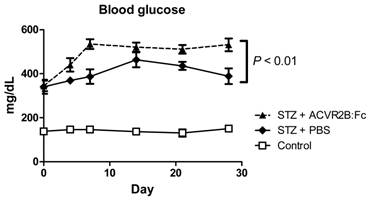
We measured blood glucose to see if increasing muscle mass would reduce blood glucose. Rather than improve hyperglycemia in STZ-treated mice, however, ACVR2B:Fc treatment further elevated blood glucose compared to PBS treatment (Figure 2). We repeated the induction of diabetes and treatment with ACVR2B:Fc or vehicle twice in additional mice and consistently found increased hyperglycemia in STZ-ACVR2B:Fc mice compared to STZ-PBS mice (Supplementary Material: Figure S2). This difference in blood glucose between STZ-PBS and STZ-ACVR2B:Fc mice was evident within in a week of ACVR2B:Fc treatment and persisted for at least five weeks (Figure 2 and Figure S2).
ACVR2B:Fc increases blood glucose in STZ-treated mice. Fed blood glucose is significantly higher in STZ-treated mice receiving ACVR2B:Fc compared to PBS by repeated measures ANOVA. The x-axis shows time relative to the start of PBS or ACVR2B:Fc injection. Data shown are from Group A mice. See also Figure S2 for replication in Groups B and C. Control, n = 4; STZ-PBS, n = 8; STZ-ACVR2B:Fc, n = 8.
We also measured fasting blood glucose in three different groups of diabetic mice treated with ACVR2B:Fc or PBS. Fasting glucose was reproducibly and significantly higher in all mice that received STZ compared to control mice (Figure S2). Compared to STZ-PBS mice, fasting glucose was 21-51% higher in STZ-ACVR2B:Fc mice depending on the group. However, this result was statistically significant in only one of the three groups (Figure S2).
Glucocorticoids
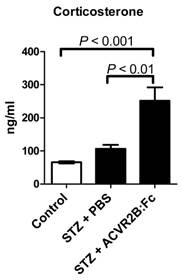
Glucocorticoids are elevated after STZ treatment, are known to induce gluconeogenesis (47,48), promote protein degradation and inhibit protein synthesis (49). We therefore measured the serum concentration of the glucocorticoid corticosterone. We found that corticosterone was significantly higher in STZ-ACVR2B:Fc compared to STZ-PBS or control mice in serum samples taken 42 days after the start of ACVR2B:Fc treatment (Group B, Figure 3). This result was reproduced in serum collected from another group (Group C) at 11 days after initial treatment with ACVR2B:Fc (Figure S2). These results suggest that elevated corticosterone is a persistent feature of ACVR2B:Fc treatment in STZ mice.
ACVR2B:Fc increases serum corticosterone in STZ-treated mice. Corticosterone concentration was significantly increased in STZ-ACVR2B:Fc mice compared to either Control or STZ-PBS by one-way ANOVA. See also Figure S2 for replication. Data shown are from Group B mice. Serum was collected 42 days after the start of ACVR2B:Fc or PBS injections in STZ-treated mice. Control, n = 4; STZ-PBS, n = 8; STZ-ACVR2B:Fc, n = 8.
Gluconeogenesis
Gluconeogenesis is increased in T1DM (50). In addition, the exacerbated glucocorticoid increase in ACVR2B:Fc-treated STZ mice suggest that endogenous glucose production may be increased STZ-ACVR2B:Fc mice. We challenged mice with pyruvate, a substrate for hepatic gluconeogenesis, to see if STZ-ACVR2B:Fc mice had an elevated response to a gluconeogenic substrate. The blood glucose time course measured during pyruvate challenge is known to be altered in mice with liver-specific changes in expression of genes important for gluconeogenesis (51,52). We found that both STZ treatment groups responded strongly to pyruvate by increasing blood glucose more than control mice (Figure 4A). Starting blood glucose was higher in STZ-ACVR2B:Fc mice compared to STZ-PBS mice and remained higher over 180 min (Figure 4A). By repeated measures ANOVA, the blood glucose curve from STZ-ACVR2B:Fc was significantly different from that of STZ-PBS mice. When expressed as a percent of starting glucose, however, the response of STZ-ACVR2B:Fc mice was similar to that of STZ-PBS mice (Figure 4B).
Gluconeogeneic response and enzyme gene expression. (A, B) Blood glucose (A) or the percent starting blood glucose (B) after injection of pyruvate to measure hepatic gluconeogenesis. STZ-ACVR2B:Fc mice had higher fasting blood glucose at the time of injection (*P < 0.05). The plot of blood glucose over 180 minutes was significantly different from that of STZ-PBS mice by repeated measures ANOVA (A), whereas the percent increase over starting blood glucose was not significant (B). (C, D) Blood glucose (C) or the percent starting blood glucose (D) after injection of glutamine to measure non-hepatic gluconeogenesis. Neither was significantly different from that of STZ-PBS mice by repeated measures ANOVA. The final 180 minute time point was significant by one way ANOVA (C, *P < 0.05). (E, F) Relative gene expression levels for enzymes involved in gluconeogenesis in the liver (E) and kidney (F). Data shown are from Group B mice. Control, n = 4; STZ-PBS, n = 7; STZ-ACVR2B:Fc, n = 8.
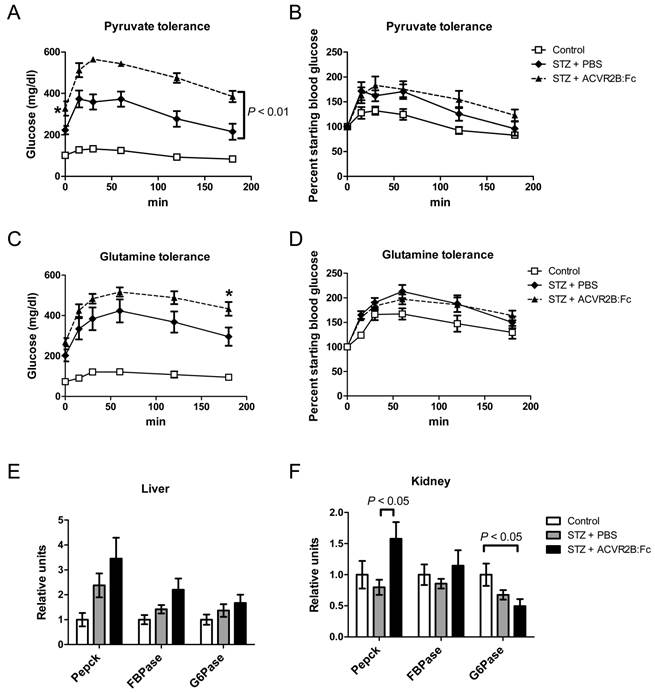
Renal gluconeogenesis is now known to make a significant contribution to blood glucose levels (53,54). Seventy-three percent of the glutamine that is incorporated into glucose is converted by the kidney and the rest by the liver (55). Because of this difference, glutamine tolerance tests have been used previously to differentiate renal from hepatic gluconeogenesis (46). To see if renal gluconeogenesis was elevated in STZ-ACVR2B:Fc mice, we performed glutamine tolerance tests. Glutamine injection in STZ mice also raised glucose levels more than in control mice (Figure 4C). However, the curves for STZ-PBS and STZ-ACVR2B:Fc mice were not significantly different from each other by repeated measures ANOVA, and only the final time point (180 min) was significantly different when considering individual time points (Figure 4C). As a percent of starting blood glucose, the STZ-PBS and STZ-ACVR2B:Fc glucose curves are nearly identical (Figure 4D). Thus, there does not seem to be a difference in glutamine-induced gluconeogenesis between STZ-ACVR2B:Fc and STZ-PBS groups.
We also analyzed the expression of genes involved in gluconeogenesis. Phosphoenolpyruvate carboxykinase (Pepck), fructose-1,6-bisphosphatase (FBPase) and glucose-6-phosphatase (G6Pase) were not significantly elevated in liver from STZ-ACVR2B:Fc mice compared to that of STZ-PBS or control mice although they all tended to be higher (Figure 4E). In the kidney, only the expression of Pepck was significantly higher in STZ-ACVR2B:Fc compared to STZ- PBS mice (Figure 4F).
Pancreas phenotype in STZ-ACVR2B:Fc mice
MSTN, growth/differentiation factor 11 (GDF11), the activins, and the activin receptors are expressed in the pancreas (56). We therefore wondered whether ACVR2B:Fc treatment would affect regeneration after STZ-induced beta cell destruction and account for the difference in blood glucose between STZ-PBS and STZ-ACVR2B:Fc mice. By 11 days after the start of PBS or ACVR2B:Fc treatment, pancreata from STZ-ACVR2B:Fc mice weighed ~15% more than those from STZ-PBS mice (Group C, Figure 5A). To examine the difference in islet cell types, we carried out morphometric analysis on the pancreas. It was not possible to accurately analyze beta cell mass due to the faint, diffuse anti-insulin immunostaining after STZ treatment. In pancreata taken 11 days after the initial ACVR2B:Fc injection, however, we found a non-significant increase in alpha cell number of 27% in ACVR2B:Fc-treated mice compared to that of STZ-PBS mice (Supplementary Material: Figure S3 and Figure 5B).
Pancreas phenotype in STZ-PBS and STZ-ACVR2B:Fc mice. (A) Pancreas weight of STZ-ACVR2B:Fc mice compared to STZ-PBS mice. (B) The alpha cell number as measured by glucagon positive cells in STZ-ACVR2B:Fc mice compared to STZ-PBS mice (no significant difference). (A,B) Data shown are from Group C mice at 11 days after starting ACVR2B:Fc or PBS treatment. STZ-PBS, n = 7; STZ-ACVR2B:Fc, n = 7. (C) Serum glucagon at 42 days after starting ACVR2B:Fc or PBS treatment (Group B). Control, n = 4; STZ-PBS, n = 7; STZ-ACVR2B:Fc, n = 8.
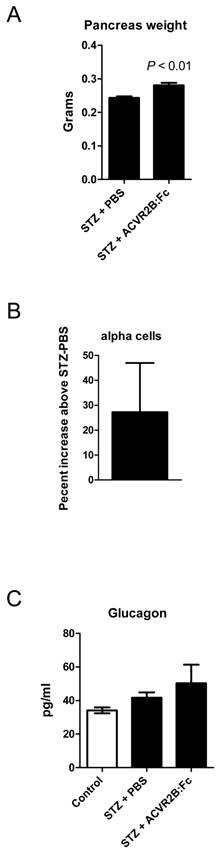
We measured glucagon levels because the hormone is secreted by alpha cells and promotes gluconeogenesis in both the liver and the kidney (57). Serum glucagon levels in STZ-PBS or STZ-ACVR2B:Fc mice were not significantly different from control mice (Figure 5C).
Discussion
Our results demonstrate that MSTN inhibitors increase muscle mass in T1DM mice as they do in mice that are WT, aged, obese, androgen-deprived or immobilized, or are models of muscular dystrophy or amyotrophic lateral sclerosis (35,58-60). This muscle hypertrophy occurred with very little, if any, insulin. In comparison with previous studies in our laboratory and others, the increase in muscle mass did not seem to be as great as in previous experiments in healthy mice treated with ACVR2B:Fc (22,45). We cannot say whether this is due to a requirement for insulin for the full hypertrophic response to MSTN inhibitors or due to other metabolic derangements that were not ameliorated such as elevated glucocorticoids or glucose toxicity. ACVR2B:Fc or other MSTN pathway inhibitors increase muscle mass in many different types of atrophy, but this is not proof for a causative role for excess MSTN signaling in various types of atrophy. The effects of STZ treatment on MSTN gene or protein expression are mixed, and whether MSTN might cause STZ-induced atrophy is debatable. Five studies have found increased MSTN levels (37,39,42-44), one found decreased levels (40), and two found no change (38,41). Testing the resistance of mice STZ-induced muscle wasting with blockade of the MSTN/activin signaling pathway in muscle would be informative.
Muscle hypertrophy caused by MSTN inhibition, insulin-like growth factor 1 signaling or c-ski overexpression is associated with greater insulin sensitivity and prevention of diet-induced increases in fasting glycemia (35). It has been difficult to determine whether MSTN inhibition directly regulates insulin signaling or glucose uptake apart from the effects of hypertrophy or secondarily to the reduction in overall body fat accumulation that is found in virtually all mutant mice with muscle hypertrophy. A recent study showed that glucose uptake and glycogen concentration after a glucose challenge are increased more than might be expected by hypertrophy alone in muscle treated with an adeno-associated virus expressing a MSTN inhibitor (36). This inhibitor increased GLUT1 and GLUT4 expression which could improve muscle glucose uptake through basal, insulin-stimulated and/or exercise-induced mechanisms. GLUT4 gene expression is also higher in muscle of cattle carrying null mutations in the MSTN gene (61). Furthermore, MSTN treatment suppresses expression of GLUT4 in differentiated myoblasts from these mutant cattle (61). These experiments suggest that MSTN may regulate glucose metabolism by mechanisms other than, or in addition to, regulating insulin signaling. This raises the possibility that muscle hypertrophy could reduce hyperglycemia independent of insulin such as by increased exercise-induced GLUT4 translocation. However, the lack of efficacy of ACVR2B:Fc in reducing hyperglycemia in STZ-treated mice suggests that muscle hypertrophy improves glucose utilization in models of insulin resistance primarily by improving insulin sensitivity. To mimic treatment of a T1DM patient and see if ACVR2B:Fc therapy in STZ treated mice would improve blood glucose in the presence of a insulin, we tried treating mice with a low level of long-acting insulin prior to soluble receptor treatment. Unfortunately, blood glucose levels swung so dramatically throughout the day from hypoglycemic to hyperglycemic that this experiment was abandoned.
A role for MSTN in regulating insulin sensitivity independent of its regulation of muscle mass was suggested by injection of MSTN in vivo. Daily MSTN treatment at concentrations that do not decrease muscle or adipose tissue mass worsens insulin tolerance in mice (62). However, in vitro experiments contradict the expected results for a direct role for MSTN in regulating glucose uptake in muscle. In differentiated rodent myoblast cell lines, MSTN increased glucose uptake and glycolysis alone or in the presence of insulin (63). These results are the opposite of what is expected given an increase in GLUT4 expression (36,61) and improved insulin sensitivity of animals with loss of function mutations in MSTN signaling. The effects of MSTN in vitro often require high concentrations of the ligand which raises some concerns about the physiological relevance of some in vitro results. The use of myoblasts such as commercially available human primary lines that show inhibition of differentiation by MSTN in the 10 ng/ml range to confirm in vitro glucose metabolism studies would be of value (64).
We were unable to convincingly determine an explanation for increased hyperglycemia in STZ-treated mice with muscle hypertrophy. There was a trend toward higher fasting glucose in STZ-ACVR2B:Fc mice which reached significance in one of our three experiments. (For the mice used in one of these two negative experiments (Group B, Figure S2), a significant increase in fasting glucose was also found during the pyruvate tolerance test (Figure 4A).) Insulin suppresses endogenous glucose production (48), and gluconeogenesis is higher in poorly controlled T1DM (50) and STZ-treated rodents (65). The strong response to pyruvate suggests higher hepatic gluconeogenesis in STZ-ACVR2B:Fc mice, but gene expression analysis does not confirm this result. ACVR2B:Fc treatment of mice on a standard diet improves suppression of endogenous glucose production in response to insulin after 10 weeks, an effect not seen at 4 weeks (66). This long delay suggests that ACVR2B:Fc affects gluconeogenesis indirectly by increasing insulin sensitivity rather than by directly acting on hepatocytes. However, high concentrations of MSTN inhibit insulin signaling in hepatocyte cell lines (67). Whether hepatocytes are able to activate the latent MSTN complex to allow MSTN to bind to the receptor on hepatocytes in vivo is unknown. Hepatocytes also respond to activin by increasing insulin sensitivity for glucose uptake (68).
Many TGFβ family members including MSTN, activin and GDF11 are expressed in the pancreas along with the type I and type II receptors and the secreted inhibitors follistatin and follistatin-like 3 (56). Mutants in some of these genes cause an imbalance in pancreas cell types (69-73). Although higher, the number of alpha cells in STZ-ACVR2B:Fc mice compared to STZ-PBS mice was not significant. The increased pancreas weight seen with ACVR2B:Fc treatment is likely due to higher exocrine mass which comprises most of the pancreatic mass.
We found a large increase in levels of the glucocorticoid corticosterone in mice treated with ACVR2B:Fc both compared to STZ-PBS mice and to control mice. Glucocorticoids have a variety of metabolic effects including inhibition of insulin signaling, promotion of protein degradation in muscle and promotion of endogenous glucose production and insulin resistance in liver (48). Glucocorticoids are increased in T1DM and in STZ-treated rodents (47,74,75). A relationship between MSTN or activin signaling and glucocorticoid signaling has previously been demonstrated in other models. There are glucocorticoid response elements in the MSTN promoter (76), and the glucocorticoid dexamethasone upregulates MSTN gene expression in muscle (77,78). MSTN-/- mice or mice injected with an antibody that recognizes ACVR2 and ACVR2B are resistant to dexamethasone-induced muscle atrophy (79,80). Our results showing increased corticosterone levels in serum suggest that the activin receptor and glucocorticoid pathways may be reciprocally regulated in that ACVR2 signaling could also inhibit glucocorticoid production. In this vein, it has been shown previously that activin A inhibits the secretion of cortisol, the human equivalent of corticosterone, by cultured adrenocortical carcinoma cells (81) and ACTH-stimulated primary adrenocortical cells (82).
One limitation to our study is the use of STZ-induced hyperglycemia as a model for T1DM. STZ is taken up by the glucose transporter GLUT2 and induces DNA damage by alkylation and increased reactive oxygen species (83) DNA damage causes activation of poly ADP-ribosylation which leads to NAD+ and ATP depletion. Variability in expression of GLUT2 between species accounts for toxicity of STZ in cells other than beta cells (84). It is possible that ACVR2B:Fc treatment may have some effects on GLUT2-expressing non-beta cells that have previously taken up STZ that would not be seen with ACVR2B:Fc treatment of auto-immune diabetes.
Other possible alternative explanations for the increased corticosterone and hyperglycemia could be a higher susceptibility to stress in mice with blunted ACVR signaling or infection from contamination of the ACVR2B:Fc preparation that caused an increase in glucocorticoid production. However, our protein preparations are filtered and vehicle controls receive injections from the same solutions used to dilute the inhibitor. Furthermore, we are consistently seeing the higher blood glucose and corticosterone despite having used different preparations of ACVR2B:Fc. Treated mice gained weight rapidly and ate well. Nonetheless, the use of different inhibitors and replication from other laboratories will probably be necessary to definitively rule out contaminants as the cause of the increased corticosterone and glycemia.
In conclusion, we have found that inhibition of MSTN/activin signaling in a T1DM model causes muscle hypertrophy and further increases blood glucose and corticosterone levels. Our findings raise the possibility that blood glucose or glucocorticoids might be elevated in other disease models or healthy animals receiving ACVR2B:Fc or other MSTN inhibitors. Regardless, these results indicate that MSTN/activin inhibitors may not be an appropriate approach to increase muscle mass in patients with T1DM.
Abbreviations
ACVR2: activin receptor type 2; ACVR2B:Fc: ACVR fused to Fc; ALK: activin receptor-like kinase; Fbpase: fructose-1,6-bisphosphatase; G6Pase: glucose-6-phosphatase; Pepck: phosphoenolpyruvate carboxykinase; STZ: streptozotocin; TGFβ: transforming growth factor beta.
Supplementary Material
Figures S1 - S3.
Acknowledgements
We thank Se-Jin Lee for the ACVR2B:Fc cell line, Obiageri Okafor for technical assistance and Oksana Gavrilova for advice about animal procedures. This work was supported by the Intramural Research Program of the NIDDK, NIH.
Competing Interests
Under a licensing agreement between Pfizer and the Johns Hopkins University, A.C.M. is entitled to a share of royalty received by the University on sales of myostatin. A.C.M. also is a co-inventor on a GDF11 patent. The terms of these arrangements are being managed by the University in accordance with its conflict of interest policies. All other authors have no competing interests.
References
1. Thomas HE, Kay TW. Intracellular pathways of pancreatic β-cell apoptosis in type 1 diabetes. Diabetes Metab Res Rev. 2011;27(8):790-6
2. Atkinson MA, Eisenbarth GS, Michels AW. Type 1 diabetes. Lancet. 2014;383(9911):69-82
3. Patterson CC, Gyürüs E, Rosenbauer J, Cinek O, Neu A, Schober E. et al. Trends in childhood type 1 diabetes incidence in Europe during 1989-2008: evidence of non-uniformity over time in rates of increase. Diabetologia. 2012;55(8):2142-7
4. Writing Group for the SEARCH for Diabetes in Youth Study Group, Dabelea D, Bell RA, D'Agostino RB Jr, Imperatore G, Johansen JM. et al. Incidence of diabetes in youth in the United States. JAMA J Am Med Assoc. 2007;297(24):2716-24
5. Dimitriadis G, Mitrou P, Lambadiari V, Maratou E, Raptis SA. Insulin effects in muscle and adipose tissue. Diabetes Res Clin Pract. 2011;93:S52-9
6. Andersen H, Gjerstad MD, Jakobsen J. Atrophy of foot muscles: a measure of diabetic neuropathy. Diabetes Care. 2004;27(10):2382-5
7. Forbes JM, Cooper ME. Mechanisms of diabetic complications. Physiol Rev. 2013;93(1):137-88
8. Jakobsen J, Reske-Nielsen E. Diffuse muscle fiber atrophy in newly diagnosed diabetes. Clin Neuropathol. 1986;5(2):73-7
9. Reske-Nielsen E, Harmsen A, Vorre P. Ultrastructure of muscle biopsies in recent, short-term and long-term juvenile diabetes. Acta Neurol Scand. 1977;55(5):345-62
10. Reske-Nielsen E, Gregersen G, Harmsen A, Lundbaek K. Morphological abnormalities of the terminal neuromuscular apparatus in recent juvenile diabetes. Diabetologia. 1970;6(2):104-9
11. Lecker SH, Solomon V, Price SR, Kwon YT, Mitch WE, Goldberg AL. Ubiquitin conjugation by the N-end rule pathway and mRNAs for its components increase in muscles of diabetic rats. J Clin Invest. 1999;104(10):1411-20
12. Mitch WE, Bailey JL, Wang X, Jurkovitz C, Newby D, Price SR. Evaluation of signals activating ubiquitin-proteasome proteolysis in a model of muscle wasting. Am J Physiol - Cell Physiol. 1999;276(5):C1132-8
13. Pepato MT, Migliorini RH, Goldberg AL, Kettelhut IC. Role of different proteolytic pathways in degradation of muscle protein from streptozotocin-diabetic rats. Am J Physiol. 1996;271(2 Pt 1):E340-7
14. Price SR, Bailey JL, Wang X, Jurkovitz C, England BK, Ding X. et al. Muscle wasting in insulinopenic rats results from activation of the ATP-dependent, ubiquitin-proteasome proteolytic pathway by a mechanism including gene transcription. J Clin Invest. 1996;98(8):1703
15. Hill JJ, Davies MV, Pearson AA, Wang JH, Hewick RM, Wolfman NM. et al. The myostatin propeptide and the follistatin-related gene are inhibitory binding proteins of myostatin in normal serum. J Biol Chem. 2002;277(43):40735-41
16. Lee SJ. Extracellular Regulation of Myostatin: A Molecular Rheostat for Muscle Mass. Immunol Endocr Metab Agents Med Chem. 2010;10(4):183-94
17. Lee SJ. Genetic analysis of the role of proteolysis in the activation of latent myostatin. PLoS ONE. 2008;3(2):e1628
18. Georges M. When less means more: Impact of myostatin on animal breeding. Immunol Endocr Metab Agents Med Chem. 2010;10(4):240-8
19. Reisz-Porszasz S, Bhasin S, Artaza JN, Shen R, Sinha-Hikim I, Hogue A. et al. Lower skeletal muscle mass in male transgenic mice with muscle-specific overexpression of myostatin. Am J Physiol Endocrinol Metab. 2003;285(4):E876-88
20. Zimmers TA, Davies MV, Koniaris LG, Haynes P, Esquela AF, Tomkinson KN. et al. Induction of cachexia in mice by systemically administered myostatin. Science. 2002;296(5572):1486-8
21. Lee S-J, McPherron AC. Regulation of myostatin activity and muscle growth. Proc Natl Acad Sci. 2001;98(16):9306-11
22. Lee SJ, Reed LA, Davies MV, Girgenrath S, Goad ME, Tomkinson KN. et al. Regulation of muscle growth by multiple ligands signaling through activin type II receptors. Proc Natl Acad Sci U A. 2005;102(50):18117-22
23. Rebbapragada A, Benchabane H, Wrana JL, Celeste AJ, Attisano L. Myostatin Signals through a Transforming Growth Factor β-Like Signaling Pathway To Block Adipogenesis. Mol Cell Biol. 2003;23(20):7230-42
24. Kemaladewi DU, de Gorter DJ, Aartsma-Rus A, van Ommen GJ, ten Dijke P, 't Hoen PA. et al. Cell-type specific regulation of myostatin signaling. FASEB J. 2012;26(4):1462-72
25. De Caestecker M. The transforming growth factor-β superfamily of receptors. Cytokine Growth Factor Rev. 2004;15(1):1-11
26. He L, Vichev K, Macharia R, Huang R, Christ B, Patel K. et al. Activin A inhibits formation of skeletal muscle during chick development. Anat Embryol Berl. 2005;209(5):401-7
27. Lee S-J, Lee Y-S, Zimmers TA, Soleimani A, Matzuk MM, Tsuchida K. et al. Regulation of muscle mass by follistatin and activins. Mol Endocrinol. 2010;24(10):1998-2008
28. Whittemore LA, Song K, Li X, Aghajanian J, Davies M, Girgenrath S. et al. Inhibition of myostatin in adult mice increases skeletal muscle mass and strength. Biochem Biophys Res Commun. 2003;300(4):965-71
29. Wolfman NM, McPherron AC, Pappano WN, Davies MV, Song K, Tomkinson KN. et al. Activation of latent myostatin by the BMP-1/Tolloid family of metalloproteinases. Proc Natl Acad Sci. 2003;100(26):15842-6
30. Srikanthan P, Karlamangla AS. Relative muscle mass is inversely associated with insulin resistance and prediabetes. Findings from the third National Health and Nutrition Examination Survey. J Clin Endocrinol Metab. 2011;96(9):2898-903
31. Srikanthan P, Hevener AL, Karlamangla AS. Sarcopenia Exacerbates Obesity-Associated Insulin Resistance and Dysglycemia: Findings from the National Health and Nutrition Examination Survey III. PLoS ONE. 2010;5(5):e10805
32. Park BS, Yoon JS. Relative Skeletal Muscle Mass Is Associated with Development of Metabolic Syndrome. Diabetes Metab J. 2013;37(6):458-64
33. Atlantis E, Martin SA, Haren MT, Taylor AW, Wittert GA. Inverse associations between muscle mass, strength, and the metabolic syndrome. Metabolism. 2009;58(7):1013-22
34. Jurca R, Lamonte MJ, Barlow CE, Kampert JB, Church TS, Blair SN. Association of muscular strength with incidence of metabolic syndrome in men. Med Sci Sports Exerc. 2005;37(11):1849-55
35. McPherron AC. Metabolic functions of myostatin and GDF11. Immunol Endocr Metab Agents Med Chem. 2010;10(4):217-31
36. Cleasby ME, Jarmin S, Eilers W, Elashry M, Andersen DK, Dickson G. et al. Local overexpression of the myostatin propeptide increases glucose transporter expression and enhances skeletal muscle glucose disposal. AJP Endocrinol Metab. 2014;306(7):E814-23
37. Hulmi JJ, Silvennoinen M, Lehti M, Kivelä R, Kainulainen H. Altered REDD1, myostatin, and Akt/mTOR/FoxO/MAPK signaling in streptozotocin-induced diabetic muscle atrophy. Am J Physiol - Endocrinol Metab. 2012;302(3):E307-15
38. Barazzoni R, Zanetti M, Bosutti A, Stebel M, Cattin L, Biolo G. et al. Myostatin expression is not altered by insulin deficiency and replacement in streptozotocin-diabetic rat skeletal muscles. Clin Nutr. 2004;23(6):1413-7
39. Chen Y, Cao L, Ye J, Zhu D. Upregulation of myostatin gene expression in streptozotocin-induced type 1 diabetes mice is attenuated by insulin. Biochem Biophys Res Commun. 2009;388(1):112-6
40. Lehti TM, Silvennoinen M, Kivela R, Kainulainen H, Komulainen J. Effects of streptozotocin-induced diabetes and physical training on gene expression of titin-based stretch-sensing complexes in mouse striated muscle. Am J Physiol Endocrinol Metab. 2007;292(2):E533-42
41. Mastrocola R, Reffo P, Penna F, Tomasinelli CE, Boccuzzi G, Baccino FM. et al. Muscle wasting in diabetic and in tumor-bearing rats: Role of oxidative stress. Free Radic Biol Med. 2008;44(4):584-93
42. Wieteska-Skrzeczynska W, Grzelkowska-Kowalczyk K, Jank M, Maciejewski H. Transcriptional dysregulation of skeletal muscle protein metabolism in streptozotocin-diabetic mice. J Physiol Pharmacol. 2009;60(Suppl 1):29-36
43. Sriram S, Subramanian S, Juvvuna PK, McFarlane C, Salerno MS, Kambadur R. et al. Myostatin induces DNA damage in skeletal muscle of streptozotocin-induced type 1 diabetic mice. J Biol Chem. 2014;289(9):5784-98
44. Jeong J, Conboy MJ, Conboy IM. Pharmacological inhibition of myostatin/TGF-β receptor/pSmad3 signaling rescues muscle regenerative responses in mouse model of type 1 diabetes. Acta Pharmacol Sin. 2013;34(8):1052-60
45. Wang Q, McPherron AC. Myostatin inhibition induces muscle fibre hypertrophy prior to satellite cell activation. J Physiol. 2012;590(9):2151-65
46. Pennisi P, Gavrilova O, Setser-Portas J, Jou W, Santopietro S, Clemmons D. et al. Recombinant Human Insulin-Like Growth Factor-I Treatment Inhibits Gluconeogenesis in a Transgenic Mouse Model of Type 2 Diabetes Mellitus. Endocrinology. 2006;147(6):2619-30
47. Bitar MS. Glucocorticoid dynamics and impaired wound healing in diabetes mellitus. Am J Pathol. 1998;152(2):547-54
48. Van Raalte DH, Ouwens DM, Diamant M. Novel insights into glucocorticoid-mediated diabetogenic effects: towards expansion of therapeutic options? Eur J Clin Invest. 2009;39(2):81-93
49. Schakman O, Gilson H, Thissen JP. Mechanisms of glucocorticoid-induced myopathy. J Endocrinol. 2008;197(1):1-10
50. Pehling G, Tessari P, Gerich JE, Haymond MW, Service FJ, Rizza RA. Abnormal meal carbohydrate disposition in insulin-dependent diabetes. Relative contributions of endogenous glucose production and initial splanchnic uptake and effect of intensive insulin therapy. J Clin Invest. 1984;74(3):985-91
51. Rodgers JT, Puigserver P. Fasting-dependent glucose and lipid metabolic response through hepatic sirtuin 1. Proc Natl Acad Sci U S A. 2007;104(31):12861-6
52. Miyake K, Ogawa W, Matsumoto M, Nakamura T, Sakaue H, Kasuga M. Hyperinsulinemia, glucose intolerance, and dyslipidemia induced by acute inhibition of phosphoinositide 3-kinase signaling in the liver. J Clin Invest. 2002;110(10):1483-91
53. Triplitt CL. Understanding the kidneys' role in blood glucose regulation. Am J Manag Care. 2012;18(1 Suppl):S11-6
54. Gerich JE, Meyer C, Woerle HJ, Stumvoll M. Renal Gluconeogenesis: Its importance in human glucose homeostasis. Diabetes Care. 2001;24(2):382-91
55. Stumvoll M, Meyer C, Perriello G, Kreider M, Welle S, Gerich J. Human kidney and liver gluconeogenesis: evidence for organ substrate selectivity. Am J Physiol - Endocrinol Metab. 1998;274(5):E817-26
56. Brown ML, Schneyer AL. Emerging roles for the TGFβ family in pancreatic β-cell homeostasis. Trends Endocrinol Metab. 2010;21(7):441-8
57. Mutel E, Gautier-Stein A, Abdul-Wahed A, Amigó-Correig M, Zitoun C, Stefanutti A. et al. Control of blood glucose in the absence of hepatic glucose production during prolonged fasting in mice: induction of renal and intestinal gluconeogenesis by glucagon. Diabetes. 2011;60(12):3121-31
58. Koncarevic A, Cornwall-Brady M, Pullen A, Davies M, Sako D, Liu J. et al. A soluble activin receptor type IIb prevents the effects of androgen deprivation on body composition and bone health. Endocrinology. 2010;151(9):4289-300
59. MacDonald EM, Andres-Mateos E, Mejias R, Simmers JL, Mi R, Park J-S. et al. Denervation atrophy is independent from Akt and mTOR activation and is not rescued by myostatin inhibition. Dis Model Mech. 2014;7(4):471-81
60. Wagner KR. Clinical Applications of Myostatin Inhibitors for Neuromuscular Diseases. Immun Endoc Metab Agents Med Chem. 2010;10:204-10
61. Takahashi H, Sato K, Yamaguchi T, Miyake M, Watanabe H, Nagasawa Y. et al. Myostatin alters glucose transporter-4 (GLUT4) expression in bovine skeletal muscles and myoblasts isolated from double-muscled (DM) and normal-muscled (NM) Japanese shorthorn cattle. Domest Anim Endocrinol. 2014;48:62-8
62. Hittel DS, Axelson M, Sarna N, Shearer J, Huffman KM, Kraus WE. Myostatin decreases with aerobic exercise and associates with insulin resistance. Med Sci Sports Exerc. 2010;42(11):2023-9
63. Chen Y, Ye J, Cao L, Zhang Y, Xia W, Zhu D. Myostatin regulates glucose metabolism via the AMP-activated protein kinase pathway in skeletal muscle cells. Int J Biochem Cell Biol. 2010;42(12):2072-81
64. Trendelenburg AU, Meyer A, Rohner D, Boyle J, Hatakeyama S, Glass DJ. Myostatin reduces Akt/TORC1/p70S6K signaling, inhibiting myoblast differentiation and myotube size. Am J Physiol Cell Physiol. 2009;296(6):C1258-70
65. Blackshear PJ, Holloway PA, Aberti KG. The effects of inhibition of gluconeogenesis on ketogenesis in starved and diabetic rats. Biochem J. 1975;148(3):353-62
66. Akpan I, Goncalves MD, Dhir R, Yin X, Pistilli EE, Bogdanovich S. et al. The effects of a soluble activin type IIB receptor on obesity and insulin sensitivity. Int J Obes. 2009;33(11):1265-73
67. Watts R, Ghozlan M, Hughey CC, Johnsen VL, Shearer J, Hittel DS. Myostatin inhibits proliferation and insulin-stimulated glucose uptake in mouse liver cells. Biochem Cell Biol. 2014;92(3):226-34
68. Ungerleider NA, Bonomi LM, Brown ML, Schneyer AL. Increased activin bioavailability enhances hepatic insulin sensitivity while inducing hepatic steatosis in male mice. Endocrinology. 2013;154(6):2025-33
69. Yamaoka T, Idehara C, Yano M, Matsushita T, Yamada T, Ii S. et al. Hypoplasia of pancreatic islets in transgenic mice expressing activin receptor mutants. J Clin Invest. 1998;102(2):294-301
70. Kim SK, Hebrok M, Li E, Oh SP, Schrewe H, Harmon EB. et al. Activin receptor patterning of foregut organogenesis. Genes Dev. 2000;14(15):1866-71
71. Bonomi L, Brown M, Ungerleider N, Muse M, Matzuk MM, Schneyer A. Activin B regulates islet composition and islet mass but not whole body glucose homeostasis or insulin sensitivity. Am J Physiol Endocrinol Metab. 2012;303(5):E587-96
72. Dichmann DS, Yassin H, Serup P. Analysis of pancreatic endocrine development in GDF11-deficient mice. Dev Dyn. 2006;235(11):3016-25
73. Harmon EB, Apelqvist AA, Smart NG, Gu X, Osborne DH, Kim SK. GDF11 modulates NGN3+ islet progenitor cell number and promotes β-cell differentiation in pancreas development. Development. 2004;131(24):6163-74
74. Cameron OG, Thomas B, Tiongco D, Hariharan M, Greden JF. Hypercortisolism in diabetes mellitus. Diabetes Care. 1987;10(5):662-4
75. Roy M, Collier B, Roy A. Hypothalamic-pituitary-adrenal axis dysregulation among diabetic outpatients. Psychiatry Res. 1990;31(1):31-7
76. Ma K, Mallidis C, Artaza J, Taylor W, Gonzalez-Cadavid N, Bhasin S. Characterization of 5'-regulatory region of human myostatin gene: regulation by dexamethasone in vitro. Am J Physiol Endocrinol Metab. 2001;281(6):E1128-36
77. Ma K, Mallidis C, Bhasin S, Mahabadi V, Artaza J, Gonzalez-Cadavid N. et al. Glucocorticoid-induced skeletal muscle atrophy is associated with upregulation of myostatin gene expression. Am J Physiol Endocrinol Metab. 2003;285(2):E363-71
78. Lang CH, Silvis C, Nystrom G, Frost RA. Regulation of myostatin by glucocorticoids after thermal injury. FASEB J. 2001;15(10):1807-9
79. Gilson H, Schakman O, Combaret L, Lause P, Grobet L, Attaix D. et al. Myostatin gene deletion prevents glucocorticoid-induced muscle atrophy. Endocrinology. 2007;148(1):452-60
80. Lach-Trifilieff E, Minetti GC, Sheppard K, Ibebunjo C, Feige JN, Hartmann S. et al. An Antibody Blocking Activin Type II Receptors Induces Strong Skeletal Muscle Hypertrophy and Protects from Atrophy. Mol Cell Biol. 2014;34(4):606-18
81. Vänttinen T, Liu J, Kuulasmaa T, Kivinen P, Voutilainen R. Expression of activin/inhibin signaling components in the human adrenal gland and the effects of activins and inhibins on adrenocortical steroidogenesis and apoptosis. J Endocrinol. 2003;178(3):479-89
82. Nishi Y, Haji M, Tanaka S, Yanase T, Takayanagi R, Etoh Y. et al. Human recombinant activin-A modulates the steroidogenesis of cultured bovine adrenocortical cells. J Endocrinol. 1992;132(3):R1-4
83. Szkudelski T. The mechanism of alloxan and streptozotocin action in B cells of the rat pancreas. Physiol Res Acad Sci Bohemoslov. 2001;50(6):537-46
84. Kramer J, Moeller EL, Hachey A, Mansfield KG, Wachtman LM. Differential expression of GLUT2 in pancreatic islets and kidneys of New and Old World nonhuman primates. Am J Physiol Regul Integr Comp Physiol. 2009;296(3):R786-93
Author contact
![]() Corresponding author: Alexandra C. McPherron, Myotherapeutics, 10169 New Hampshire Ave. #149, Silver Spring, Maryland 20903, USA Email: amcpherroncom
Corresponding author: Alexandra C. McPherron, Myotherapeutics, 10169 New Hampshire Ave. #149, Silver Spring, Maryland 20903, USA Email: amcpherroncom