Impact Factor ISSN: 1449-2288
- Issue 12; 2026
- Issue 11; 2026
- Issue 10; 2026
- Issue 9; 2026
- Issue 8; 2026
- Volume 22; 2026
- Past Issues
- Advance Articles
- Editorial Board
- Cover Images
- Index & Coverage
- Cover Suggestion
- Special Issues
Introduction
Material and Methods
Results
Discussion
Conclusion
Supplementary Material
Abbreviations
Acknowledgements
Conflicts of Interest
References

 Global reach, higher impact
Int J Biol Sci 2016; 12(8):964-978. doi:10.7150/ijbs.15165 This issue Cite
Research Paper
Selecting Cells for Bioartificial Liver Devices and the Importance of a 3D Culture Environment: A Functional Comparison between the HepaRG and C3A Cell Lines
Martien van Wenum1,2, Aziza A.A. Adam1, Theodorus B.M. Hakvoort2, Erik J. Hendriks1, Valery Shevchenko3, Thomas M. van Gulik1, Robert A.F.M. Chamuleau2, Ruurdtje Hoekstra1,2 ![]()
1. Surgical laboratory, Academic Medical Center, University of Amsterdam, the Netherlands.
2. Tytgat Institute for Liver and Intestinal Research, Academic Medical Centre, University of Amsterdam, the Netherlands.
3. Biopredic International, Rennes, France.
Received 2016-2-1; Accepted 2016-5-15; Published 2016-6-24
Abstract

Recently, the first clinical trials on Bioartificial Livers (BALs) loaded with a proliferative human hepatocyte cell source have started. There are two cell lines that are currently in an advanced state of BAL development; HepaRG and HepG2/C3A. In this study we aimed to compare both cell lines on applicability in BALs and to identify possible strategies for further improvement. We tested both cell lines in monolayer- and BAL cultures on growth characteristics, hepatic differentiation, nitrogen-, carbohydrate-, amino acid- and xenobiotic metabolism. Interestingly, both cell lines adapted the hepatocyte phenotype more closely when cultured in BALs; e.g. monolayer cultures produced lactate, while BAL cultures showed diminished lactate production (C3A) or conversion to elimination (HepaRG), and urea cycle activity increased upon BAL culturing in both cell lines. HepaRG-BALs outperformed C3A-BALs on xenobiotic metabolism, ammonia elimination and lactate elimination, while protein synthesis was comparable. In BAL cultures of both cell lines ammonia elimination correlated positively with glutamine production and glutamate consumption, suggesting ammonia elimination was mainly driven by the balance between glutaminase and glutamine synthetase activity. Both cell lines lacked significant urea cycle activity and both required multiple culture weeks before reaching optimal differentiation in BALs.
In conclusion, culturing in BALs enhanced hepatic functionality of both cell lines and from these, the HepaRG cells are the most promising proliferative cell source for BAL application.
Keywords: HepaRG, C3A, BAL, Liver support, Hepatocytes, Bioartificial liver.
Introduction
Bioartificial livers (BALs) have been developed as a bridging therapy to liver regeneration or transplantation for patients suffering from acute liver failure (ALF). In the past, BAL systems were mainly based on primary hepatocytes (PHs), most commonly of porcine origin (primary porcine hepatocytes; PPHs) [1]. PPHs pose several problems related to regulatory demands, reproducibility, stability, logistics and, arguably, safety due to the risk of zoonosis [2]. Although there is still at least one group that is in the advanced stage of developing a BAL for clinical use based on PPHs [3], the concept was largely abandoned after the European Union imposed a moratorium on xenotransplantation in 2004, which also includes BALs loaded with xenogeneic cells.
Proliferative hepatocyte-like cell types, such as stem cell derived hepatocyte-like cells and tumour-derived cell lines are alternative BAL biocomponents. These can be expanded under tightly controlled conditions and have a more stable phenotype, yielding a reproducible and well-characterized end-product, in line with the demands posed by the regulatory authorities.
However, although differentiation protocols of stem cells become increasingly more sophisticated and effective; the in vitro hepatic functionality does not reach an acceptable level [4, 5]. In addition, stem cell technology does not yet allow for affordable large-scale cell expansion.
Currently the biocomponent of choice for BAL application is a highly differentiated human liver tumour-derived cell line. The cell lines that are most suitable for use in BALs are HepaRG and HepG2 sub-clone C3A [6].
C3A was obtained from the hepatocellular carcinoma derived cell line HepG2 by selection on contact inhibition and protein synthesis, leading to a more hepatocyte-like phenotype compared to the parental line [7] (Kelly, JH US Patent 5290684, 1990). C3A cells are used in several BAL systems and the first phase III clinical trial of a C3A BAL has recently been completed (clinicaltrials.gov NCT00973817).
HepaRG cells were also derived from a hepatocellular carcinoma and resemble hepatic progenitor cells in their capacity to differentiate into hepatocytes and cholangiocytes [8].
There are no data available that allows for a comparison between the functionality of C3A and HepaRG cells in BAL systems. Culture conditions have been shown to be of great influence on the performance of both C3A and HepaRG cells [9, 10]. Therefore it is essential to compare the cell lines under identical experimental conditions and to include a BAL system providing medium perfusion, three-dimensional configuration and optimized oxygenation.
The cell lines should be evaluated for most important functions, however, the hepatic functions that contribute to improved survival in liver support settings, such as auxiliary liver transplantation in the clinic and BAL-support in animal models, are unknown and may well vary according to aetiology and from case to case [5]. Therefore the aim should be a biocomponent that is functionally comparable to mature PHs as much as possible. In a recent review we identified a set of functional parameters to test the applicability of cell sources for clinical BAL systems [5]. Briefly, these are: protein synthesis, xenobiotic detoxification, ammonia detoxification, carbohydrate metabolism, foetal hepatocyte markers and transcription factors driving hepatic differentiation.
In this study we compared these parameters of HepaRG and C3A cultures in 2D and in laboratory-sized BALs and developed possible strategies for functional improvement.
Material and Methods
Monolayer culture
HepaRG cells were provided by Biopredic International cultured as described previously [10]. Briefly, cultures were maintained in culture flasks in HepaRG medium (=WE+ medium) and passaged at a split ratio of 1:5 every 2 weeks. To obtain differentiated HepaRG cultures, the cells were seeded in 12-well culture plates (Corning, NY, USA) at 27.000 cells/cm2 and cultured for 28 days in WE+ medium. At day 25, three days prior to testing, the WE+ medium was supplemented with 1mM N-carbamoyl-L-glutamate (Sigma Aldrich, St. Louis, USA) to promote carbamoyl phosphate synthetase 1 (CPS1) activity [11].
C3A cells [HepG2/C3A, derivative of Hep G2 (ATCC HB8065)] (ATCC® CRL10741™) were cultured according to the suppliers instructions. Briefly, cultures were maintained in culture flasks in MEM+ medium and passaged 1:10 every week. For experiments, C3A cells were seeded in 12-well plates at 20.000 cells/cm2 and unless stated otherwise, cultured in WE+ medium for 7 days, supplemented with N-carbamoyl-L-glutamate three days prior to testing.
BAL culture
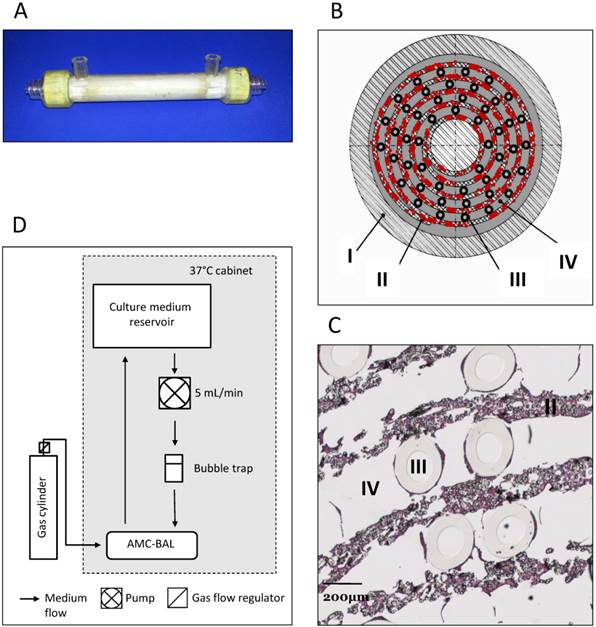
In this study, we used the previously described scaled-down models of the AMC-BAL [12], with a priming volume of 9 mL, 127 cm2 of DuPont™ Spunlaced Nonwoven Fabric- matrix (DuPont, Wilmington, DE, USA), interlaced with 160 gas capillaries for oxygenation (Fig. 1A-D). Nine mL suspensions from 2mL cell pellets were loaded into the BALs, where cells were allowed to attach and subsequently to mature for 3-14 days, as described previously [13]. The BALs were perfused with WE+ medium supplemented with N-carbamoyl-L-glutamate (1mM) at a rate of 5 mL/min and a gas mixture consisting of 5% CO2, 40% O2 and 55% N2 was led through the gas capillaries at 30 ml/min. For this study we cultured four BALs per cell line, however, one C3A BAL was excluded due to a bacterial infection.
AMC-BAL Culture. (A) AMC-BAL cartridge. (B-C) Schematic cross-section and detail of a HE-staining of a paraffin embedded HepaRG-AMC BAL. Depicted are: I, The outer shell of the cartridge; II, the matrix and attached cells; III, gas capillaries and IV, the intercapillary space through which the culture medium is perfused. (D) Schematic representation of the culture set-up.
Hepatic function tests
The function tests were performed as described [10]. Briefly, monolayer cultures (n=8 per cell line) were exposed to 1 ml, and BAL cultures (C3A n=3,HepaRG n=4) to 120 ml of test medium for 24 h. Test medium was WE+ with 1 mM N-carbamoyl-l-glutamate, 1.5 mM 15NH4Cl, 2.27 mM D-galactose, 2 mM L-lactate and 125 μM testosterone (all compounds from Sigma Aldrich). During the function test, medium samples were taken at 0.75, 6 and 24 h (monolayers) or at 0.5, 1, 2, 8 and 24h (BALs). In the obtained samples we quantified L-lactate, ammonia, urea, 15N-urea, aspartate aminotransferase (AST), lactate dehydrogenase (LDH) and glucose, as described [10]. Enzyme leakage was expressed as a fraction of the total cellular content.
Human albumin was quantified using the Human Serum Albumin DuoSet ELISA according to instructions of the supplier (R&D systems Inc., Minneapolis, USA) function test samples taken after 0, 6 or 8 (monolayer/BAL) and 24 h. An overview of the data is given in supplemental table S2 and S4.
High-performance liquid chromatography (HPLC)
Cytochrome P450 3A4 (CYP3A4) activity was determined in function test samples taken after 45 minutes by quantification of 6B-hydroxylation of testosterone (6B-OH testosterone) through HPLC tandem mass spectrometry. Samples were diluted with the same volume of formic acid 0.1%. The system consisted of an AB Sciex (Framingham, U.S.A) API3200 triple quadrupole mass spectrometer interfaced with an Agilent (Santa Clara, U.S.A ) 1200SL HPLC. Chromatography was performed at 70°C with 20 µL injected into a Zorbax Eclipse XDB C18 column (50 mm x 4.6 mm, 1.5µm particle size), at a flow rate of 1.5 ml/min. The column eluent was split to an electrospray ionization interface, operating at 650°C in positive mode operating in multiple reaction monitoring mode. Q1 mass was 305.3 amu, Q3 mass was 269.2 amu and retention time was 3.0 min. The mobile phase was ammonium acetate 5mM in ultrapure water (A) and 0.3% formic acid in a mixture of methanol and acetonitrile (B). The proportion of the mobile phase B was increased linearly from 30 to 37% in 2.8 min, and then, after 1 min at 99% of B, the column was allowed to re-equilibrate at the initial conditions. The total run time was 5 min.
Amino Acids were quantified in function test samples taken after 0.75, 6 and 24 h (monolayer) and after 0, 2, 8 and 24 h (BAL), n=3 per group. One-hundred µl aliquots were added to 4 mg sulfosalicylic acid, snap-frozen in liquid nitrogen and stored at -80°C. Prior to amino acid analysis, proteins were removed by centrifugation at 20.000xG at 4°C. For the separation of the o-phthalaldehyde -derivatizated amino acids, two serial coupled BDS Hypersil C18 columns (150 x 4.8 mm, 3 um particles, Thermo Scientific) were used. Flowrate was 0.7 ml/min, solvent A: 12.5 mM sodium phosphate pH7.0 + 0.005% tetrahydrofuran, solvent B: 6 mM sodium phosphate pH7.0 + 0.07% tetrahydrofuran + 40% acetonitrile. For normalization purpose we used norvaline and methylargenine (respectively IS-1 and IS-2 in the chromatogram, Fig. S1). A typical chromatogram is depicted in supplemental figure S1 and an overview of the data is given in supplemental table S6.
Quantitative reverse transcription-polymerase chain reaction (qRT-PCR)
For gene expression analyses we obtained matrix samples (T-bags) from the BALs at different time points as described [14]. RNA from BALs (C3A: n=3, HepaRG: n=4) and monolayers (C3A: n=6, HepaRG: n=4) were isolated using the RNeasy Mini Kit (Qiagen, Hilden, Germany). qRT-PCR was performed using a touchdown annealing temperature protocol, as previously described [10].Transcript levels were normalized for 18S ribosomal RNA and are expressed as % of the average level of two human liver samples isolated from the healthy parenchyma in liver resection material from female patients, aged 40 and 41, with liver adenomas and no signs of liver damage. The transcript levels of the tested genes differed no more than 1,45 fold between these samples, except for CEBPA, AFP and CYP3A7 which differed 1.88, 2.19 and 4.24 fold respectively. The procedure was in accordance with the ethical standards of the institutional committee on human experimentation (protocol number 03/024) and the Helsinki Declaration of 1975. Primer sequences and amplicon sizes are listed in supplemental table S1. An overview of the transcript data is given in supplemental tables S2, S3 and S5.
Statistical analyses
We performed one-way ANOVA and Holm Sidak's multiple comparisons test (alpha = 0.05) to assess differences between more than 2 groups, and multiple t-tests with Sidak-Bonferroni's multiple testing correction for the comparison between two groups on multiple parameters. Statistical analyses were performed in Prism version 6 (GraphPad Prism Inc. San Diego, CA, USA). Data are presented as mean ± SD. The clustering and graphical representation of amino-acid metabolism were performed with City-block distance analysis in Gene-E (Broad-institute, Cambridge, MA, USA)
Results
Standardization of the culture medium for C3A and HepaRG cells
In order to standardize the culture conditions between the cell lines, we compared the performance of C3A monolayer cultures in their standard medium (MEM+) and in HepaRG medium (WE+). There was no difference in growth rate as determined by total protein content at day 7. In both culture media ammonia was produced rather than eliminated at equal rates (Fig. 2A).
C3A culture medium selection. Comparison of C3A cells in monolayers cultured in MEM+ or WE+ medium for 7 days. (A) Hepatic functions and total protein content normalized to MEM+ cultured cells. (B) Gene transcript levels relative to MEM+ cultured cells. N.D.= not detectable. a= p.<0.05 compared to MEM+.
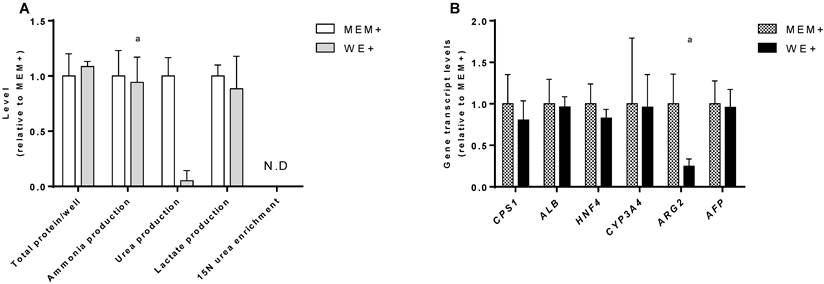
In MEM+, urea production was higher, however, this coincided with a relatively high transcript level of Arginase 2 (ARG2) (Fig. 2B), and the lack of incorporation of mass enriched 15N-ammonia into 15N-urea. This indicates that urea is formed through degradation of arginine by ARG2, which is not hepatocyte-specific and does not contribute to ammonia detoxification [15]. The MEM+ and WE+ cultures showed similar transcript levels of a panel of hepatic genes (Fig. 2B). Therefore, we concluded that WE+ is an appropriate culture medium for both C3A and HepaRG cells and all further experiments in this study were performed in WE+ medium to maximally standardize the testing conditions.
BAL culturing of C3A cells promotes differentiation in time in contrast to monolayer culturing
We then established the optimal maturation time of C3A cells in monolayer and BAL cultures. In the past the optimal maturation time of HepaRG cultures was found to be 28 days in monolayer and 14 days in the AMC-BAL [10]. In C3A monolayers, the transcript levels of genes associated with immature liver, encoding serum protein Alpha Fetoprotein (AFP) and Cytochrome P450 3A7 (CYP3A7), decreased after day 7 (Fig. 3A, supplemental table S3). However, the transcript levels of eight out of sixteen tested mature hepatic genes were also downregulated >2-fold, and thus hepatic differentiation could not be confirmed. These genes encoded for hepatic transcription factors (HNF4A, CEBPA, PXR, CAR), as well as for proteins involved in the urea cycle (OTC, CPS1), plasma protein synthesis (TF) and transport (NTCP). The other tested mature hepatic genes that remained stable in their expression (<2-fold up/down) were involved in plasma protein synthesis (ALB, FVII), nitrogen metabolism (GLUL, ARG1) biotransformation (CYP3A4, CYP2B6) and transport (SLCO1B1). Moreover, the panel of tested hepatic functions (ammonia elimination, urea production, albumin synthesis) did not increase after day 7 (Table 1).
Hepatic functionality and integrity of C3A monolayers and BALs in time.
| C3A monolayer | C3A BAL | |||||||
|---|---|---|---|---|---|---|---|---|
| Function | Unit | 7 days | 14 days | 21 days | Unit | 3 days | 7 days | 14 days |
| Ammonia elimination | µmol·h1· g protein-1 | -33.54 ± 9.59 | -55.93 ± 9.18 | -37.57 ± 6.99 | µmol·h1 per BAL | -2.06 ± 0.40 | -1.66 ± 1.19 | -2.02 ±0.60 |
| Urea production | µmol·h1· g protein-1 | 1.42± 0.34 | 1.19 ± 0.27 | 0.86 ± 0.14 | µmol·h1 per BAL | 0.042 ±0.053 | 0.37 ± 0.06 | 0.44 ± 0.08 |
| Albumin Synthesis | mg·h1· g protein-1 | 35.65± 3.12 | 35.34 ± 6.34 | NM | mg·h1 per BAL | NM | 12.17 ±0.82 | 15.52 ±1.5 |
| CYP3A4 activity | nmol·h1· g protein-1 | 2.27 ± 0.12 | 4.26 ± 0.78 | NM | nmol·h1 per BAL | NM | 87.33 ±75.5 | 95.66 ±15.89 |
| Lactate elimination | µmol·h1 per BAL | -17.10 ±0.66 | 4.03 ±1.66 | 1.24 ±1.8 | ||||
| AST leakage | IU·h1 per BAL | 0.16 ±0.12 | 0.62 ±0.13 | 1.38 ±0.07 | ||||
| LDH leakage | IU·h1 per BAL | 0.78 ±0.06 | 1.14 ±0.07 | 2.00 ±0.20 | ||||
NM=not measured.
Time course of differentiation, morphology and proliferation. (A) Transcript levels of hepatic in time in C3A cells cultured in monolayer and BALs (B) Morphology of monolayer cultures at days 7 and 14 for C3A and days 7 and 28 for HepaRG. C3A cells form confluent monolayer patches (I), flanked by open spaces (II) and areas with overgrowing cells (III) at day 7. HepaRG cells form strict monolayers with islands of hepatocytes (I) surrounded by cholangiocyte-like cells (II) at day 28. (C) Total protein per culture well of C3A and HepaRG monolayer cultures in time.
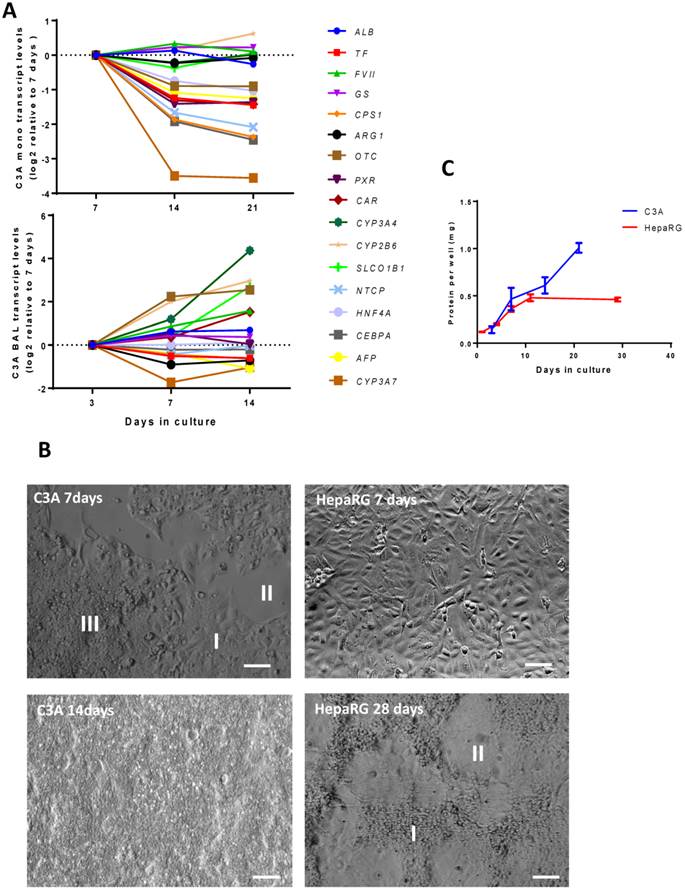
In C3A BALs, we assessed hepatic functionality (Table 1) and transcript levels (Fig. 3A, supplemental table S3) of hepatic genes at 3, 7 and 14 days. There was a trend of AFP and CYP3A7 downregulation (>2-fold), however, in contrast to C3A monolayer cultures, none of the investigated mature hepatic genes were downregulated >2-fold, and four were upregulated >2-fold (OTC, CYP3A4, CYP2B6 and SLCO1B1, p<0,05). Albumin production increased 1,3-fold between day 7 and 14, the urea production increased ~10- fold between day 3 and day 14, while lactate production converted into elimination. Glucose consumption, ammonia production and CYP3A4 activity did not change significantly between day 3 and 14, while enzyme leakage increased 8-fold.
In the following part of the study we compared HepaRG cultures with C3A cultures at their optimal maturation times, being 28 days and 7 days for the HepaRG and C3A monolayers respectively, and 14 days for both HepaRG and C3A BALs.
HepaRG cells exhibit contact inhibition in monolayers, in contrast to C3A cells
As previously reported, HepaRG monolayers followed a distinct proliferation- and differentiation pattern [8]. After seeding, the cells proliferated for ~14 days, after which they differentiated into hepatocyte-like clusters surrounded by cholangiocyte-like cells during the following 2 weeks (Fig. 3B). HepaRG cells strictly grew in monolayers and did not proliferate during the last 2 weeks, as determined by total protein/culture well, indicating strong contact inhibition (Fig. 3C). C3A cells are reported to exhibit increased contact inhibition compared to their parental HepG2 cell line (Kelly, JH US Patent 5290684, 1990). In our hands, C3A monolayers cultured for seven days contained areas of cells in monolayer, cells overgrowing each other and non-confluent patches, while after 14 days the cultures were completely overgrown (Fig. 3B). The total protein per culture well continuously increased in time (Fig. 3C). These results indicate that, in monolayers, HepaRG cells exhibit contact inhibition and C3A cells do not.
HepaRG cells have lower AFP transcript levels and are more robust than C3A cells
To compare the differentiation status of C3A and HepaRG cells in monolayer and BAL cultures, we quantified the transcript levels of genes of immature liver, i.e. AFP and CYP3A7. AFP was highly expressed in C3A monolayers and BALs, ~400- to 800-fold higher than in HepaRG cells and ~5000-fold higher than in human liver (Fig. 4C). CYP3A7 expression did not differ significantly between cell lines or culture platforms, with expression levels between 54% and 154% of human liver (Fig. 4D). Gene transcript levels of the hepatic transcription factors HNF4A and CEBPA were within the range of 2-fold down to 4-fold up compared to human liver (Fig. 4E-F). The only significant difference for the transcript levels of these two genes between cell lines and culture platforms was a ~3-fold higher level for CEBPA in C3A compared to HepaRG monolayers (Fig. 4F).
Differentiation and integrity. Comparison of HepaRG and C3A cultures in monolayers and BALs for (A-B) enzyme leakage and (C-D) transcript levels of fetal hepatic genes and of (E-F) hepatic transcription factors. b=p≤0.05 compared to C3A cells in the same culture platform.
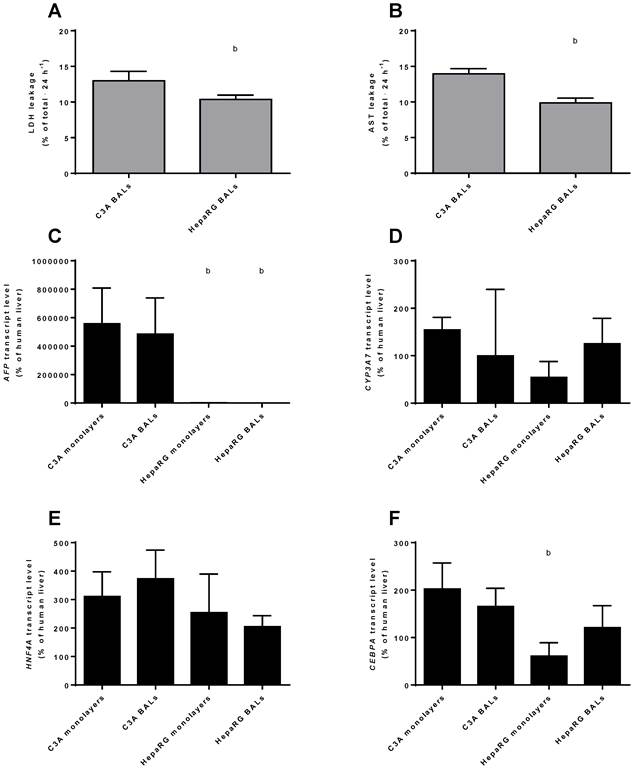
Leakage of AST and LDH was measured as a marker for cell death in BAL cultures upon 24 h exposure to ammonia and lactate. C3A BALs leaked a significantly higher proportion of intracellular enzymes amounting to 13%-14% of total cellular content against ~10% per 24 hours for HepaRG BALs (Fig. 4A-B).
In conclusion, AFP, but not CYP3A7 expression was significantly higher in C3A compared to HepaRG cultures, while the tested hepatic transcription factor expression was within the physiological range for all cultures. Therefore, HepaRG cells show a tendency to higher maturation compared to C3A cells.
BAL culturing improves nitrogen metabolism of both C3A and HepaRG cells
In monolayer cultures, C3A cells produced ammonia, in contrast to HepaRG cells that consistently eliminated ammonia (Fig. 5A). When cultured in BALs, ammonia elimination increased ~4-fold in HepaRG cells. BAL culturing reduced ammonia production ~17-fold in C3A cells, yet conversion into elimination was not established (Fig. 5A).
Nitrogen metabolism. Comparison of HepaRG and C3A cultures in monolayers and BALs for (A-C) functional parameters and (D-G) gene transcript levels. Diagram H illustrates the two pathways producing urea. a=p≤0.05 compared to same cell line in monolayer, b=p≤0.05 compared to C3A cells in the same culture platform.
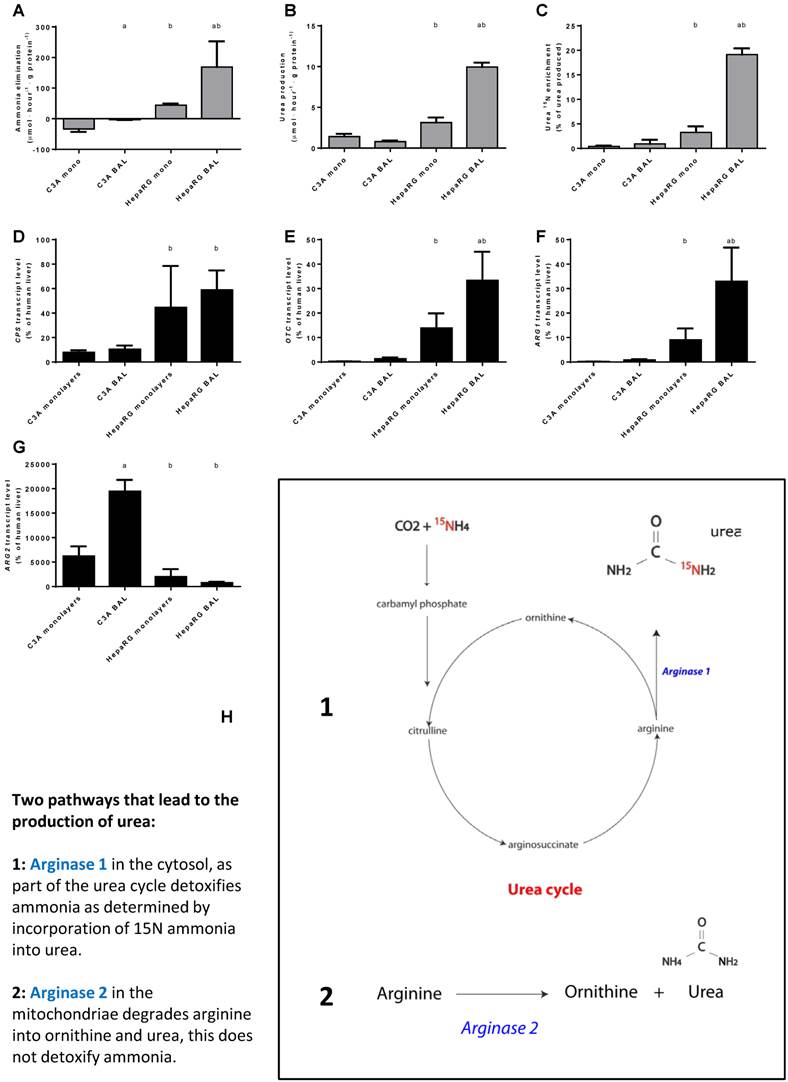
Next, we investigated the contribution of the urea cycle (UC)-activity to ammonia elimination. Urea production alone is not an adequate measure of UC-activity, since urea can also be formed by the degradation of arginine into ornithine and urea through (non-hepatic) Arginase 2 activity [15] (Fig. 5H). The production of 15N-urea after a challenge with 15N-ammonia is a measure of the contribution of UC- activity to urea production (Fig. 5H).
Urea production in BALs compared to monolayers was ~3-fold higher for HepaRG cultures and not different in C3A cultures. In HepaRG cells compared to C3A cells, urea production was ~2 and 13-fold higher in monolayers and BALs respectively (Fig. 5B). In line with a previous report, we found that 15N-urea enrichment in C3A monolayers was around the detection limit (Fig. 5C) [15]. However, BAL culturing induced a trend towards higher 15N-urea enrichment (~2-fold) and higher expression of urea cycle genes CPS1, ARG1 and OTC (2- to 5-fold) (Fig. 5B-F). For HepaRG cells, BAL culturing increased the transcript levels of two of the three tested urea cycle genes (OTC and ARG1, up to 4-fold) and the 15N-urea enrichment (6-fold) (Fig. 5C-F). 15N-urea enrichment was 10- to 20-fold higher compared to C3A cultures and the transcript levels of the tested urea cycle genes were 5- to 77-fold higher (Fig. 5C-F). ARG2 expression was highest in C3A cultures and lowest in HepaRG BALs, explaining the high production of non- 15N enriched urea (Fig. 5G-H). Because, even in HepaRG BALs, the estimated urea cycle activity amounts to <10% of total ammonia elimination, we conclude that the urea cycle does not play a significant role in ammonia detoxification in either of the cell lines.
Ammonia elimination is a function of glutamine metabolism in both C3A and HepaRG cells
The other main route through which ammonia can be eliminated next to the irreversible fixation into urea by UC-activity, is the reversible fixation into glutamine through glutamine synthetase (enzyme: GS, gene: GLUL) activity (Fig. 6G). Conversely, ammonia can be produced during the degradation of glutamine, mainly through the activity of Glutaminase I (GLS1; non-liver specific isoform) and II (GLS2; liver-specific isoform). The ammonia concentration in culture media is a product of both ammonia production and elimination.
Nitrogen balance. Comparison of HepaRG and C3A cultures in monolayers and BALs after 24 hours exposure to culture medium containing 1,5 mM of ammonia and 2 mM lactate for (A-C) ammonia, glutamine and glutamate balance, and for (D-F) transcript levels of GLS, GLS1 and GLUL. Diagram G illustrates the reversible conversion of glutamine into glutamate. a=p≤0.05 compared to same cell line in monolayer, b=p≤0.05 compared to C3A cells in the same culture platform.
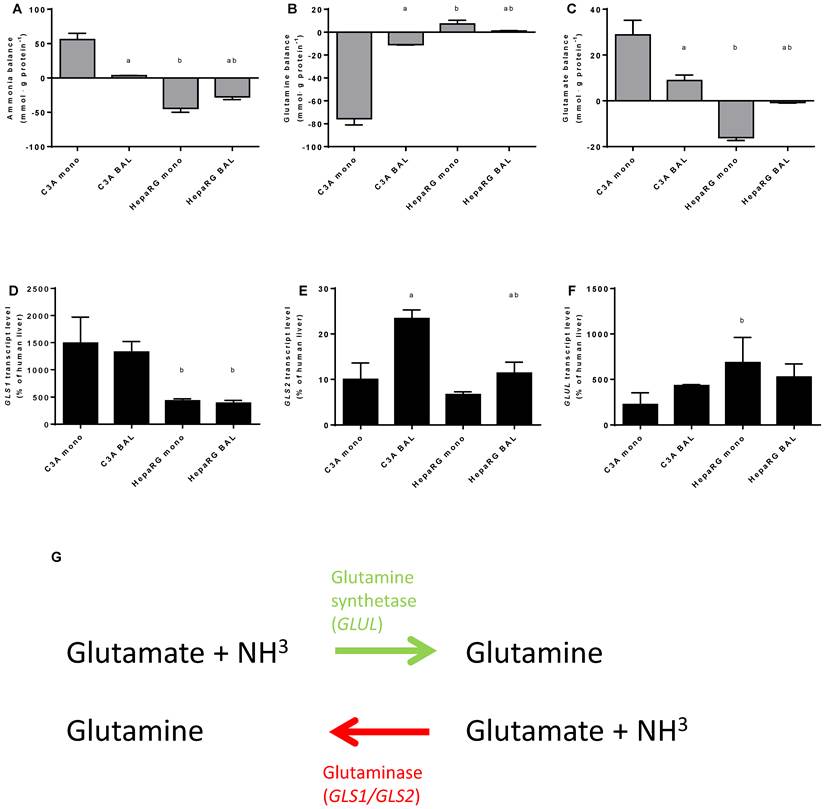
To gain an insight into these processes, we quantified ammonia, glutamine and glutamate, as well as GLS1, GLS2 and GLUL transcript levels at 24 hours after ammonia exposure in culture media (Fig. 6A-F). Ammonia elimination in HepaRG BALs was limited by substrate availability (data not shown) and reaction products are subject to further processing, therefore the results obtained should be considered as a qualitative rather than a quantitative representation. Net ammonia elimination was associated with net glutamine production and glutamate elimination in HepaRG cultures (Fig. 6A-C). In contrast, C3A cultures produced ammonia, consumed glutamine and produced glutamate (Fig. 6A-C). Glutamate production was associated with higher GLS1 transcript levels which were >3-fold higher in C3A cells compared to HepaRG cells, both in monolayers and in BALs (Fig. 6C-E). GLUL transcript levels varied less between both cell lines (Fig. 6F).
BAL culturing of C3A cells shifted the glutamate metabolism towards elimination and glutamine metabolism towards production, in contrast to HepaRG cells (Fig. 6B-C). On transcript level, the differences between BAL and monolayer cultures were non-significant, except for a 2-fold upregulation of GLS2 expression in C3A BALs compared to monolayers (Fig. 6D-E).
BAL culturing shifts the metabolism of amino acids in C3A cells towards the HepaRG phenotype
To further investigate the amino acid metabolism, we quantified the resultant of production and consumption for the main amino acids, depicted these in a heat map and performed a cluster analysis (Fig. 7A). C3A monolayer cultures clustered separately from the three other groups. This indicates that BAL culturing induces a shift in amino acid metabolism of C3A cells towards the HepaRG phenotype. Several samples could not be analysed reliably for all amino acids due to overlapping peaks; these data points were excluded.
Amino acid and carbohydrate metabolism. HepaRG and C3A cells, cultured in monolayers and BALs, were analysed for metabolism of (A) amino acids, several amino acids could not be analysed in a number of samples due to overlapping peaks, these data points were excluded from analysis and depicted as a black box in the heat map. (B) glucose consumption and (C) lactate. a=p≤0.05 compared to same cell line in monolayer, b=p≤0.05 compared to C3A cells in the same culture platform.
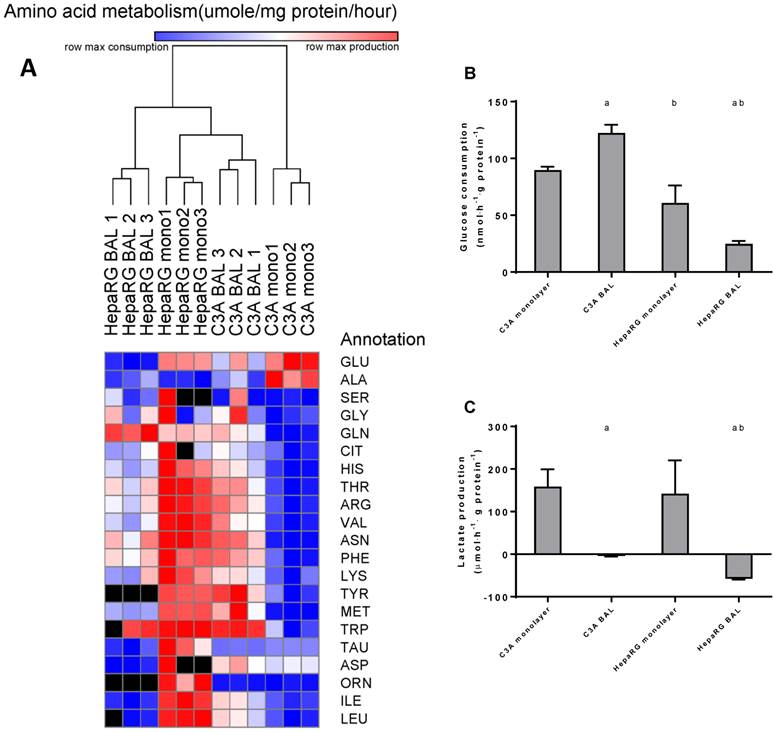
Aromatic amino acids (AAA: phenylalanine, tryptophan, histidine, and tyrosine) and branched chain amino acids (BCAA: leucine, isoleucine and valine) are of interest, as an increased AAA/BCAA ratio has been proposed as a causal factor in the development of hepatic encephalopathy [16]. Both AAAs and BCAAs were consumed more in C3A monolayers compared to all other conditions. In HepaRG BALs, there was no net change of the measured AAAs and a consumption of BCAAs. In C3A BALs, consumption levels of the measured AAAs and BCAAs were lower and comparable to HepaRG BALs respectively (Fig. 7A, supplemental table S6).
BAL culturing converts lactate production into elimination in HepaRG cultures
Glucose consumption was 1,5-fold higher in C3A compared to HepaRG monolayers (Fig. 7B). In BAL cultures this difference between cell lines increased to 5-fold. HepaRG and C3A monolayer cultures both produced lactate at similar rates (Fig. 7C). When cultured in BALs, lactate production seized in C3A cells and converted to elimination in HepaRG cells. This suggests that both C3A and HepaRG cells depended on anaerobic glycolysis in monolayers, which was ameliorated by BAL culturing, albeit more so in HepaRG than in C3A BAL cultures.
Changes in the metabolism of amino-acids, ammonia and lactate upon BAL culturing of C3A cells imply a shift in phenotype towards that of PHs, although not to the extent of BAL-cultured HepaRG cells.
Protein synthesis is similar between culture platforms and cell lines
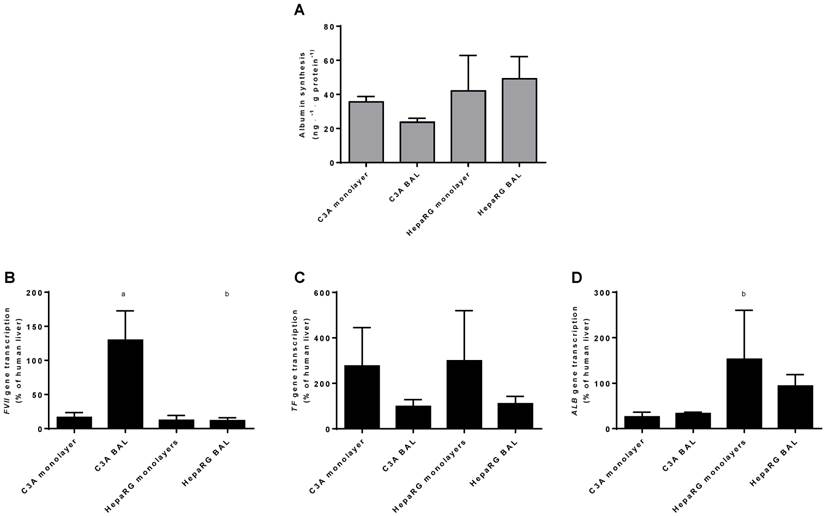
As a measure of hepatic protein synthesis we quantified albumin production in culture media and transcript levels of three genes encoding plasma proteins (ALB, TF and FVII) (Fig. 8A-D). Albumin synthesis rate was not statistically different between HepaRG and C3A cultures, and there was no difference between culture platforms (Fig. 8A).There was no consistent pattern in transcript levels of ALB, TF and FVII between the four groups (Fig. 8B-D). The ALB transcript level was higher in HepaRG BALs compared to C3A BALs, FVII transcript levels were upregulated in C3A BALs compared to all other groups and transcript levels of TF showed a trend towards upregulation in both monolayer groups compared to BAL groups. Combined, these results do not indicate a difference in protein synthesis between cell lines and/or culture platforms.
Protein synthesis in culture medium. Comparison of HepaRG and C3A cultures in monolayers and BALs for (A) albumin synthesis and (B) transcript levels of genes encoding proteins related to hepatic protein synthesis. a=p≤0.05 compared to same cell line in monolayer, b=p≤0.05 compared to C3A cells in the same culture platform.
Drug detoxification is enhanced in HepaRG vs C3A and in BALs vs monolayers
Transcript levels of CYP3A4 and CYP2B6 relative to human liver were highest in HepaRG BAL cultures (20%-75%) followed by HepaRG monolayers (~8%), C3A BALs (~0.02%) and C3A monolayers (under the detection limit) (Fig. 9 B-C).
Xenobiotic metabolism. Comparison of HepaRG and C3A cultures in monolayers and BALs for (A) CYP3A4 activity and transcript levels of genes encoding (B-C) enzymes related to xenobiotic metabolism (D-E) basolateral transporter proteins, and (F-G) nuclear hormone receptors. ND= not detectable. a=p≤0.05 compared to same cell line in monolayer, b=p≤0.05 compared to C3A cells in the same culture platform.
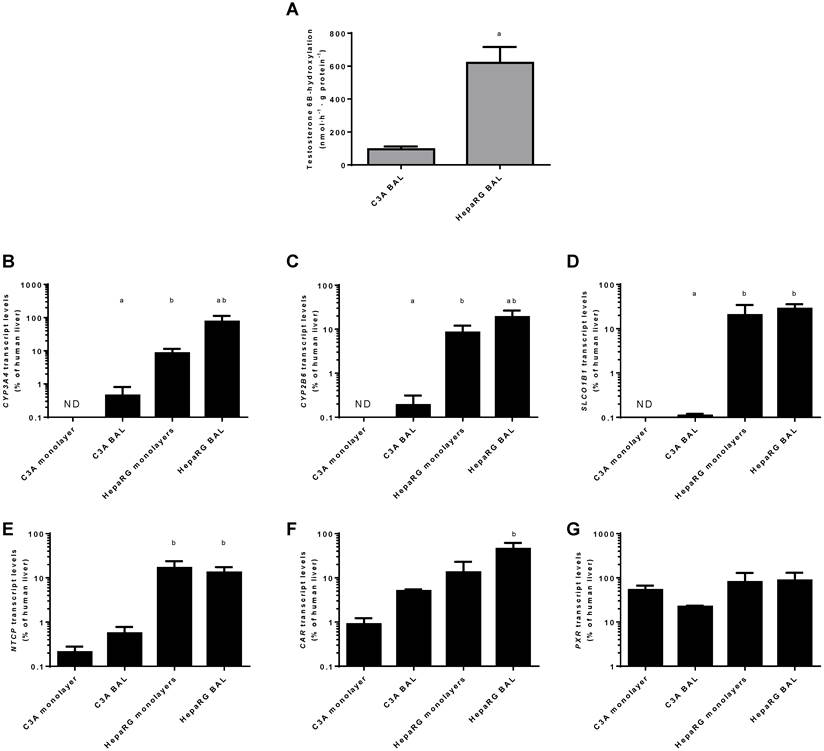
For genes encoding basolateral membrane transporters NTCP and SLCO1B1 a similar trend was observed, with transcript levels ranging from undetectable in C3A monolayers to 13%-28% of human liver in HepaRG BALs (Fig. 9D-E).
The transcript levels of two genes encoding regulators of xenobiotic detoxification, CAR and PXR, ranged from 1%-45% and 22%-87% of human liver, respectively (Fig. 9F-G). The only statistically significant difference between cell lines in the same culture platform or between culture platforms of the same cell line was a ~9-fold higher transcript level of CAR in HepaRG BALs vs C3A BALs (Fig. 9F)On a functional level, CYP3A4 activity, as determined by testosterone 6B-hydroxylation, was tested in BAL cultures only and was 6-fold higher in HepaRG BALs compared to C3A BALs (Fig. 9A).
Discussion
We compared hepatic differentiation and functionality of the two main candidate cell lines to be applied in BALs: C3A and HepaRG. HepaRG BALs had the most favourable outcome on xenobiotic detoxification, nitrogen metabolism and lactate elimination, while protein synthesis was not different between cell lines. Therefore we conclude that HepaRG is currently the most promising cell line to be applied in BALs.
Both cell lines differentiated markedly in AMC-BALs compared to monolayers, hallmarked by significant differences in hepatic gene expression levels and xenobiotic-, nitrogen-, carbohydrate-, and amino acid metabolism. This confirms that cells can only be properly assessed for their applicability as a BAL biocomponent when cultured in a BAL device.
When cultured in AMC-BALs, HepaRG cells eliminated ammonia and lactate at pathophysiological concentrations, whereas C3A BALs did not eliminate lactate and produced ammonia. Cyp3A4 activity and UC-activity were 6- and 110-fold higher in HepaRG BALs, while glucose consumption was 5-fold lower and albumin synthesis did not differ from C3A BALs. Out of the 16 tested mature hepatic genes, 6 were expressed equally, 2 were highest in C3A BALs and 8 were highest in HepaRG BALs.
HepaRG BALs consumed BCAAs, which might lead to an increase in AAA/BCAA ratio in patients plasma when applied clinically. This ratio has been proposed to be associated to HE in ALF, although this remains debated. [16, 17] A recent meta-analysis on the effects of BCAA suppletion on hepatic encephalopathy in chronic liver diseases showed a small beneficial effect on encephalopathy grade, but not survival or morbidity [18]. We propose that this is not a contraindication for the use of HepaRG cells in BALs, but that BCAA suppletion might be considered.
High expression of AFP against relatively low expression of ALB in C3A cells suggests that C3A cells are less differentiated on the foetal-mature hepatocyte axis compared to HepaRG cells. Interestingly, although CYP3A7 is considered a foetal hepatocyte marker, expression was not increased in C3A cells compared to HepaRG cells. We propose that since CYP3A7 is regulated similarly to mature CYP enzymes, the low expression level has to be considered in extension of the generally minimal expression of detoxification genes in C3A cells [19].
C3A cells have been studied in the context of BAL application by others in the past, although one should exercise caution in comparing outcomes due to differences in test- conditions, culture time, culture platforms and normalization methods [20-24]. One study reported conditions similar to this study, except for a difference in culture time. In this study, urea and albumin synthesis were 2 fold lower and 3-fold higher respectively, indicating external validity of the data in our current research [24].
C3A monolayers did not exhibit contact inhibition, in contrast to HepaRG monolayers. This gives rise to the concern that C3A cells are tumorigenic and may compromise safety. From studies in immunocompromised mice, HepaRG cells are known to have some remnant tumorigenicity when undifferentiated, but not when differentiated [25]. Data on tumorigenicity of C3A are not available to the best of our knowledge. The parental cell line of C3A, HepG2, is known to be highly tumorigenic [26]. Since HepaRG cells become strictly non-tumorigenic only when differentiated, it is conceivable that tumorigenicity in C3A cells decreases and contact inhibition increases with increased differentiation upon BAL-culture. Due to technical limitations, contact inhibition could only be assessed in monolayers and therefore we feel we cannot draw firm conclusions on the tumorigenicity of C3A cells in BAL cultures. To eliminate the risk of tumorigenicity in patients, plasma should be passed over multiple barriers before re-entering the body in order to prevent cells from entering the circulation [27].
Ammonia is believed to be an important agent in ALF disease progression and therefore ammonia detoxification is regarded as a key function of BALs [3, 5, 28, 29]. Our data indicate that HepaRG cells have a higher ammonia elimination capacity compared to C3A cells, and that ammonia balance in both cell lines is associated with the conversion of glutamate into glutamine and vice versa. These processes are driven by the balance between the enzymes GS and GLS I (non-liver specific isoform) or II (liver-specific isoform). The activity of these enzymes is linked to the metabolic state through regulation by nucleotides. For example, adenosine diphosphate (ADP) is a prototypical activator of glutaminases and capable of inhibiting GS [30, 31]. As lactate production correlated negatively with ammonia elimination in this study, we propose that the metabolic state drives the net ammonia eliminating capacity in hepatocyte cell lines that rely on GS activity for ammonia detoxification. If this is indeed the case, proliferation is likely to have a negative impact on ammonia elimination capacity due to its large demand for energy. As HepaRG cells showed contact inhibition, but C3A cells continued to proliferate, the observed difference in ammonia elimination capacity could be explained through this mechanism. A possible strategy to solve this issue would be to physically limit proliferation by space restriction, e.g. in hydrogel beads, which has indeed been shown to increase hepatic functions in C3A as well as in HepaRG cells [32, 33]. This may also limit differentiation time, which should be minimal to effectively control logistics and finance of clinical BAL therapy.
Another way to improve ammonia detoxification would be to increase UC-activity up to the level of PHs. In vivo, PHs exhibit a specific functional phenotype depending on their distance from the portal- and central vein [34]. The GS activity is restricted to the pericentral region, whereas UC-activity takes place in the intermediate and portal zones. Recently it was described how this metabolic zonation is driven by the Wnt signalling pathway: proliferative pericentral hepatocytes are high in β-catenin expression, maintained by Wnt factor secreting endothelial cells adjacent to the central vein. The hepatocytes lose GS expression and gain CPS expression as they migrate away from the central vein [35]. Wnt signalling poses an interesting target to induce UC-activity in hepatocyte cell lines for BAL application.
Conclusion
We conclude that culturing proliferative hepatocyte sources in BALs enhances hepatic functionality and that the cell line HepaRG is currently the most promising proliferative cell source for BAL application. In addition, we identified two strategies for functional improvement. First, UC-activity may be improved though manipulation of the Wnt signalling pathway. Second, the capacity for fixation of ammonia into amino acids may be improved by decreasing basal energy expenditure, e.g. by physically limiting proliferation.
Supplementary Material
Additional File 1Figure S1, Table S1.
Table S2-S6.
Abbreviations
AAA: aromatic amino acids; ADP: adenosine diphosphate; AFP: alpha fetoprotein; ALB: albumin; ALF: Acute liver failure; AMC: Academic medical center; ARG1: Arginase 1; AST: aspartate aminotransferase; BAL: bioartificial liver; BCAA: branched chain amino acids; CAR: constitutive androstane receptor; CEBPA: CCAAT/enhancer-binding protein alpha; CPS1: carbamoyl phosphate synthetase 1; CYP2B6: cytochrome P450 2B6; CYP3A4: cytochrome P450 3A4; CYP3A7: cytochrome P450 3A7; FVII: blood coagulation factor VII; GLS1: Glutaminase1; GLS2: Glutaminase2; GLUL: glutamine synthetase; HNF4A: hepatic nuclear factor four-alpha; HPLC: High-performance liquid chromatography; LDH: lactate dehydrogenase; NTCP: Sodium/bile acid cotransporter; OTC: Ornithine transcarbamylase; PPH: primary porcine hepatocyte; PXR: Pregnane X receptor; qRT-PCR: quantitative reverse transcription-polymerase chain reaction; SLCO1B1: solute carrier organic anion transporter family member 1B1; TF: transferrin; UC: urea cycle.
Acknowledgements
The authors thank M.T. Ackermans and A. Ruiter from the Laboratory of Endocrinology, AMC, for performing the 6B-OHT analyses.
The research leading to these results has received funding from the European Community's Seventh Framework Programme FP7/2007-2013 under grant agreement n304914.
Conflicts of Interest
Robert Chamuleau, is Chief Scientific Officer of the university spin-off company Hep-Art Medical Devices B.V that holds the exclusive licence to the AMC-Bioartificial liver. Ruurdtje Hoekstra was previously employed part-time by Hep-Art Medical Devices B.V.
Valery Shevchenko is an employee of Biopredic International, which currently holds the exclusive license to the HepaRG cell line. The contribution of Biopredic Int. was strictly limited to the technical execution of tests, as proposed by MW and RH. Biopredic Int. had no influence on the content of this article, nor on the decision to publish.
The authors have no other relevant affiliations or financial involvement with any organization or entity with a financial interest in or financial conflict with the subject matter or materials discussed in the manuscript apart from those disclosed.
References
1. Park JK, Lee DH. Bioartificial liver systems: current status and future perspective. Journal of bioscience and bioengineering. 2005;99:311-9
2. Onions DE, Witt CJ. Xenotransplantation: an overview of microbiological risks and potentials for risk management. Rev Sci Tech. 2000;19:289-301
3. Glorioso JM, Mao SA, Rodysill B, Mounajjed T, Kremers WK, Elgilani F. et al. Pivotal preclinical trial of the spheroid reservoir bioartificial liver. Journal of hepatology. 2015;63:388-98
4. Huch M, Gehart H, van Boxtel R, Hamer K, Blokzijl F, Verstegen MM. et al. Long-term culture of genome-stable bipotent stem cells from adult human liver. Cell. 2015;160:299-312
5. van Wenum M, Chamuleau RA, van Gulik TM, Siliakus A, Seppen J, Hoekstra R. Bioartificial livers in vitro and in vivo: tailoring biocomponents to the expanding variety of applications. Expert opinion on biological therapy. 2014;14:1745-60
6. Nibourg GA, Chamuleau RA, van Gulik TM, Hoekstra R. Proliferative human cell sources applied as biocomponent in bioartificial livers: a review. Expert opinion on biological therapy. 2012;12:905-21
7. Knowles BB, Howe CC, Aden DP. Human hepatocellular carcinoma cell lines secrete the major plasma proteins and hepatitis B surface antigen. Science. 1980;209:497-9
8. Gripon P, Rumin S, Urban S, Le Seyec J, Glaise D, Cannie I. et al. Infection of a human hepatoma cell line by hepatitis B virus. Proceedings of the National Academy of Sciences of the United States of America. 2002;99:15655-60
9. Prot JM, Aninat C, Griscom L, Razan F, Brochot C, Guillouzo CG. et al. Improvement of HepG2/C3a cell functions in a microfluidic biochip. Biotechnology and bioengineering. 2011;108:1704-15
10. Nibourg GA, Hoekstra R, van der Hoeven TV, Ackermans MT, Hakvoort TB, van Gulik TM. et al. Increased hepatic functionality of the human hepatoma cell line HepaRG cultured in the AMC bioreactor. The international journal of biochemistry & cell biology. 2013;45:1860-8
11. Hoekstra R, Nibourg GA, van der Hoeven TV, Ackermans MT, Hakvoort TB, van Gulik TM. et al. The HepaRG cell line is suitable for bioartificial liver application. The international journal of biochemistry & cell biology. 2011;43:1483-9
12. Flendrig LM, la Soe JW, Jorning GG, Steenbeek A, Karlsen OT, Bovee WM. et al. In vitro evaluation of a novel bioreactor based on an integral oxygenator and a spirally wound nonwoven polyester matrix for hepatocyte culture as small aggregates. Journal of hepatology. 1997;26:1379-92
13. Nibourg GA, Chamuleau RA, van der Hoeven TV, Maas MA, Ruiter AF, Lamers WH. et al. Liver progenitor cell line HepaRG differentiated in a bioartificial liver effectively supplies liver support to rats with acute liver failure. PloS one. 2012;7:e38778
14. Poyck PP, Hoekstra R, Chhatta A, Bloemendaal LT, van Wijk AC, Galavotti D. et al. Time-related analysis of metabolic liver functions, cellular morphology, and gene expression of hepatocytes cultured in the bioartificial liver of the Academic Medical Center in Amsterdam (AMC-BAL). Tissue engineering. 2007;13:1235-46
15. Mavri-Damelin D, Damelin LH, Eaton S, Rees M, Selden C, Hodgson HJ. Cells for bioartificial liver devices: the human hepatoma-derived cell line C3A produces urea but does not detoxify ammonia. Biotechnology and bioengineering. 2008;99:644-51
16. Dejong CH, van de Poll MC, Soeters PB, Jalan R, Olde Damink SW. Aromatic amino acid metabolism during liver failure. J Nutr. 2007;137:1579S-85S discussion 97S-98S
17. Honda T, Fukuda Y, Nakano I, Katano Y, Goto H, Nagasaki M. et al. Effects of liver failure on branched-chain alpha-keto acid dehydrogenase complex in rat liver and muscle: comparison between acute and chronic liver failure. Journal of hepatology. 2004;40:439-45
18. Gluud LL, Dam G, Les I, Cordoba J, Marchesini G, Borre M. et al. Branched-chain amino acids for people with hepatic encephalopathy. The Cochrane database of systematic reviews. 2015;2:Cd001939
19. Bertilsson G, Heidrich J, Svensson K, Asman M, Jendeberg L, Sydow-Backman M. et al. Identification of a human nuclear receptor defines a new signaling pathway for CYP3A induction. Proceedings of the National Academy of Sciences of the United States of America. 1998;95:12208-13
20. Gautier A, Carpentier B, Dufresne M, Vu Dinh Q, Paullier P, Legallais C. Impact of alginate type and bead diameter on mass transfers and the metabolic activities of encapsulated C3A cells in bioartificial liver applications. European cells & materials. 2011;21:94-106
21. David B, Dufresne M, Nagel MD, Legallais C. In vitro assessment of encapsulated C3A hepatocytes functions in a fluidized bed bioreactor. Biotechnol Prog. 2004;20:1204-12
22. Iyer VV, Yang H, Ierapetritou MG, Roth CM. Effects of glucose and insulin on HepG2-C3A cell metabolism. Biotechnology and bioengineering. 2010;107:347-56
23. Filippi C, Keatch SA, Rangar D, Nelson LJ, Hayes PC, Plevris JN. Improvement of C3A cell metabolism for usage in bioartificial liver support systems. Journal of hepatology. 2004;41:599-605
24. Yang Y, Li J, Pan X, Zhou P, Yu X, Cao H. et al. Co-culture with mesenchymal stem cells enhances metabolic functions of liver cells in bioartificial liver system. Biotechnology and bioengineering. 2013;110:958-68
25. Higuchi Y, Kawai K, Yamazaki H, Nakamura M, Bree F, Guguen-Guillouzo C. et al. The human hepatic cell line HepaRG as a possible cell source for the generation of humanized liver TK-NOG mice. Xenobiotica; the fate of foreign compounds in biological systems. 2014;44:146-53
26. Wang X, Dong JH, Zhang WZ, Leng JJ, Cai SW, Chen MY. et al. Double stranded RNA-dependent protein kinase promotes the tumorigenic phenotype in HepG2 hepatocellular carcinoma cells by activating STAT3. Oncol Lett. 2014;8:2762-8
27. Ellis AJ, Hughes RD, Wendon JA, Dunne J, Langley PG, Kelly JH. et al. Pilot-controlled trial of the extracorporeal liver assist device in acute liver failure. Hepatology (Baltimore, Md). 1996;24:1446-51
28. Bernal W, Hall C, Karvellas CJ, Auzinger G, Sizer E, Wendon J. Arterial ammonia and clinical risk factors for encephalopathy and intracranial hypertension in acute liver failure. Hepatology (Baltimore, Md). 2007;46:1844-52
29. Selden C, Spearman CW, Kahn D, Miller M, Figaji A, Erro E. et al. Evaluation of encapsulated liver cell spheroids in a fluidised-bed bioartificial liver for treatment of ischaemic acute liver failure in pigs in a translational setting. PloS one. 2013;8:e82312
30. Liaw SH, Pan C, Eisenberg D. Feedback inhibition of fully unadenylylated glutamine synthetase from Salmonella typhimurium by glycine, alanine, and serine. Proceedings of the National Academy of Sciences of the United States of America. 1993;90:4996-5000
31. Masola B, Ngubane NP. The activity of phosphate-dependent glutaminase from the rat small intestine is modulated by ADP and is dependent on integrity of mitochondria. Arch Biochem Biophys. 2010;504:197-203
32. Elkayam T, Amitay-Shaprut S, Dvir-Ginzberg M, Harel T, Cohen S. Enhancing the drug metabolism activities of C3A-a human hepatocyte cell line-by tissue engineering within alginate scaffolds. Tissue engineering. 2006;12:1357-68
33. Rebelo SP, Costa R, Estrada M, Shevchenko V, Brito C, Alves PM. HepaRG microencapsulated spheroids in DMSO-free culture: novel culturing approaches for enhanced xenobiotic and biosynthetic metabolism. Archives of toxicology. 2015;89:1347-58
34. Smith DD Jr, Campbell JW. Distribution of glutamine synthetase and carbamoyl-phosphate synthetase I in vertebrate liver. Proceedings of the National Academy of Sciences of the United States of America. 1988;85:160-4
35. Wang B, Zhao L, Fish M, Logan CY, Nusse R. Self-renewing diploid Axin2(+) cells fuel homeostatic renewal of the liver. Nature. 2015;524:180-5
Author contact
![]() Corresponding author: RH. r.hoekstranl.
Corresponding author: RH. r.hoekstranl.