Impact Factor ISSN: 1449-2288
- Issue 12; 2026
- Issue 11; 2026
- Issue 10; 2026
- Issue 9; 2026
- Issue 8; 2026
- Volume 22; 2026
- Past Issues
- Advance Articles
- Editorial Board
- Cover Images
- Index & Coverage
- Cover Suggestion
- Special Issues
Introduction
Results
Discussion
Conclusions
Material and Methods
Abbreviations
Supplementary Material
Acknowledgements
References

 Global reach, higher impact
Int J Biol Sci 2016; 12(11):1382-1393. doi:10.7150/ijbs.16472 This issue Cite
Research Paper
Genetic Variant in Flavin-Containing Monooxygenase 3 Alters Lipid Metabolism in Laying Hens in a Diet-Specific Manner
Jing Wang, Cheng Long, Haijun Zhang, Yanan Zhang, Hao Wang, Hongyuan Yue, Xiaocui Wang, Shugeng Wu ![]() , Guanghai Qi
, Guanghai Qi ![]()
Key Laboratory of Feed Biotechnology of Ministry of Agriculture, Feed Research Institute, Chinese Academy of Agricultural Sciences, Beijing 100081, China.
Received 2016-6-14; Accepted 2016-9-4; Published 2016-10-25
Abstract

Genetic variant T329S in flavin-containing monooxygenase 3 (FMO3) impairs trimethylamine (TMA) metabolism in birds. The TMA metabolism that under complex genetic and dietary regulation, closely linked to cardiovascular disease risk. We determined whether the genetic defects in TMA metabolism may change other metabolic traits in birds, determined whether the genetic effects depend on diets, and to identify genes or gene pathways that underlie the metabolic alteration induced by genetic and diet factors. We used hens genotyped as FMO3 c.984 A>T as well as those with the homozygous normal genotype. For each genotype, hens were provided with either a corn-soybean meal basal diets (SM), which contains lower levels of TMA precursor, or the basal diets supplemented with 21% of rapeseed meal (RM), which contains higher levels of TMA precursor. An integrative analysis of metabolomic and transcriptomic was used to explore the metabolic patterns of FMO3 genetic variant in hens that were fed the two defined diets. In birds that consumed SM diets, the T329S mutation increased levels of plasma TMA and lipids, FMO3 mRNA levels, and the expression of genes involved in long chain polyunsaturated fatty acid biosynthesis. In birds that consumed RM diets, the T329S mutation induced fishy odor syndrome, a repression in LXR pathway and a reciprocal change in lipid metabolism. Variations in TMA and lipid metabolism were linked to the genetic variant in FMO3 in a diet-specific manner, which suggest FMO3 functions in TMA metabolism and lipid homeostasis. LXR pathway and polyunsaturated fatty acid metabolism are two possible mechanisms of FMO3 action in response to dietary TMA precursor.
Keywords: flavin-containing monooxygenase 3, trimethylamine, lipid metabolism, laying hen, genetic variant, dietary TMA precursor
Introduction
The contribution of gut microbiota-driven nutrient metabolism in host atherosclerosis and associated cardiovascular disease (CVD) pathogenesis is now generally recongnized [1,2]. Progress in studying the metabolic pathways involved in the diet-microbe-host interaction will provide new insights into therapeutic strategies for protection against CVD. One such meta-organismal pathway involves TMA production in the gut and its subsequent oxidation to form trimethylamine N-oxide (TMAO) by hepatic FMO3, and this pathway has been closely linked to CVD risk [2-5]. TMAO was first identified as a novel marker for CVD risk based on human population studies [3]. Further study showed that dietary TMAO supplementation promoted atherosclerosis [3] and enhanced thrombosis [6] in mice. Cholesterol accumulation in macrophages increased platelet hyperreactivity, and activation of inflammatory pathways have been recently proposed as the possible mechanism involved in the proatherogenic effect of TMAO [3,6,7]. Hepatic FMO3, the TMAO-generating enzyme, plays a direct role in modulating glucose and lipid homeostasis in genetically modified mouse models of hyperlipidemia [8]. FMO3 was also found to be a central regulator of hepatic cholesterol balance and inflammation in mouse models of reverse cholesterol transport [9]. Increasingly evidence reveals a relationship between the TMA metabolism pathway and CVD, acute heart failure and other diseases [10-12], and the importance of this pathway as a therapeutic target [13]. Thus, a clear understanding of the mechanisms by which this pathway contributes to this metabolism is very important.
TMA metabolism is regulated by a combination of genetic, dietary and hormonal factors, the complexity of which may obscure the interpretation of the precise roles of this pathway [14,15]. For example, in humans, more than 30 FMO3 genetic variants have been reported to impair N-oxygenation of TMA and contribute to the fish odor syndrome phenotype [16]. Fish odor syndrome is an inherited TMA metabolic disorder characterized by high levels of TMA in human bodily secretions. Given the link between TMAO metabolism and CVD risk and the discovery of novel roles for FMO3, functional variations in FMO3 are likely to perturb TMA, glucose and lipid metabolism, and thereby potentially increase the risk of developing atherosclerosis. In mice, natural variations in FMO3 expression alter TMAO levels and lipid metabolism [8]. In contrast, in a human genome-wide association study, the common variants (15 SNPs across FMO3) at the FMO locus did not show any strong association with plasma TMAO or lipid levels or with risk of coronary artery disease [17]. Although no phenotypes in individuals with the fish-odor syndrome have been reported other than the unpleasant odour [3], one crucial question is whether the genetic defects in TMA metabolism may change other metabolic traits that have thus far been undetected. Furthermore, genetic contributions to the causation of fish-odor syndrome and circulating TMAO levels is limited to the diet conditions [17]. Most fish odor syndrome cases are caused by the combination of genetics and diets [18]. Dietary composition is a major determinant of TMA synthesis, and FMO3 expression and activity are also largely affected by dietary factors [3,14]. Thus, variability in dietary composition should be taken into consideration in the study of genetic factors [17]. Finally, the other important questions are whether the genetic effects depends on dietary factors, and how FMO3 modulates metabolism under various diets.
Laying hens could provide a promising animal model to study the TMA metabolism pathway and its response to varied genetic and environmental factors [19-21]. Only the nonsynonymous mutation FMO3 c.984 A>T that causes a threonine to serine substitution at amino acid 329 (T329S) of the chicken FMO3 is highly associated with fish odor syndrome [19]. Rapeseed meal (RM) is a common feed ingredient for birds but rich in sinapine, a TMA precursor. TMA metabolism load and fish odor syndrome of laying hens is often induced by feeding RM [21]. Herein, we used nontargeted, nuclear magnetic resonance (NMR)-based metabolite profiling to explore the genetic variant-associated metabolic patterns in birds fed two defined diets that contained different amounts of TMA precursor. We then performed RNA sequencing (RNA-Seq) analysis to identify genes or gene pathways that underlie the metabolic alteration induced by the genetic factor.
Results
Genetic variant in FMO3 alters trimethylamine metabolism in birds
We initially examined the effect of the genetic variant T329S in FMO3 on the TMA metabolism in birds. We used hens genotyped as FMO3 c.984 A>T (TT) as well as those with the homozygous normal (AA) genotype. Given that both genetic and dietary factors have important roles in TMA metabolism, we provided hens with either a corn-soybean meal basal diets (SM), which contains lower levels of TMA precursor (< 0.15 mg/g), or the basal diets supplemented with 21% of RM, which contains higher levels of TMA precursor (1.33 mg/g sinapine; Table S1). We found a significant diet effect in the TMA levels in egg yolk (P < 0.001), cecal chyme (P < 0.001) and plasma (P = 0.021), and higher values in the RM diets (Figure 1a and 1b; Table S2), which suggested that the RM diets increased TMA synthesis in birds. RM diets caused fishy odor syndrome in T329S mutant birds, evidenced by the production of fishy-flavor tainted eggs (yolk TMA concentration ≥ ~ 4.5 μg/g [21,22]). Compared with the AA hens, TT hens produced eggs with higher TMA contents (P < 0.001) and showed lower liver microsomal FMO activity (P = 0.004, Table S2), which suggested that the lower hepatic FMO activity caused by T329S was responsible for the genotypic differences in TMA metabolism. But the genotype-related changes in TMA metabolism were affected by dietary factors. Compared with SM-fed AA birds, TT birds fed the SM diets had significantly decreased liver FMO3 activity (P = 0.003; Figure 1d) and circulating TMAO levels (P = 0.008; Figure 1e), whereas, reciprocally, there were increased levels of circulating TMA (P = 0.010; Figure 1f) and hepatic FMO3 mRNA (P = 0.002; Figure 1c). In contrast, there was no significant difference between AA and TT hens when fed the RM diets in hepatic FMO3 mRNA levels (Figure 1c), liver microsomal FMO3 activity (Figure 1d), or circulating levels of TMAO (Figure 1e) or TMA (Figure 1f). This diminished difference between the AA and TT hens when fed the RM diets seems to be caused mainly by a substantial change in TMA metabolic patterns in AA hens. When the SM and RM diets were compared, the RM diets significantly decreased FMO activity in AA hens by > 25% (P = 0.023), whereas the trend of decreased FMO activity (15%) in TT hens was not statistically significant (Figure 1d).
The genetic variant T329S in FMO3 alters trimethylamine metabolism in birds. (a) TMA levels in egg yolks, (b) TMA levels in cecal chime, (c) hepatic FMO3 mRNA levels, (d) ability of hepatic FMO, (e) plasma TMAO levels, (f) plasma TMA levels. Laying hens homozygous normal for FMO3 (AA genotype) and mutant hens genotyped as FMO3 c.984 A>T (i.e. T239S mutation; TT genotype) were fed either the corn-soybean meal basal diets (SM; < 0.15 mg/g sinapine) or the basal diets supplemented with 21% of rapeseed meal (RM; 1.33 mg/g sinapine) for 8 weeks. Data are presented as mean ± SEM. Data represent means from 6 replicates with 6 eggs each (a). Cecal chyme (b) and liver samples (c-d) from hens was analyzed, n = 6 birds/group. (e-f) Plasma samples from hens was analyzed, data are the mean of 6 replicates, and 3 birds from each replicate were analyzed. Significance was measured with Student's t-test. *P < 0.05. trimethylamine, TMA; trimethylamine-N-oxide, TMAO.
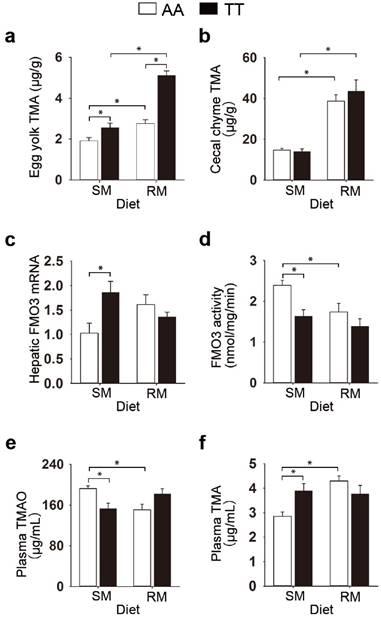
Corresponding trends were seen in the circulating levels of TMA and TMAO, where only the AA genotype led to a significant increase in TMA levels (P < 0.001; Figure 1f) and a reciprocal decrease in TMAO levels (P = 0. 007; Figure 1e) after consuming RM diets. Collectively, these results show that (1) the RM diets aggravated the burden of TMA metabolism and caused fishy odor syndrome in T329S mutant birds; (2) T329S mutation decreased the ability of hepatic FMO3 to convert TMA to TMAO; (3) metabolic response to TMA precursor in diet is different between genotypes.
Distinct variations in lipid metabolism linked to the genetic variant in FMO3
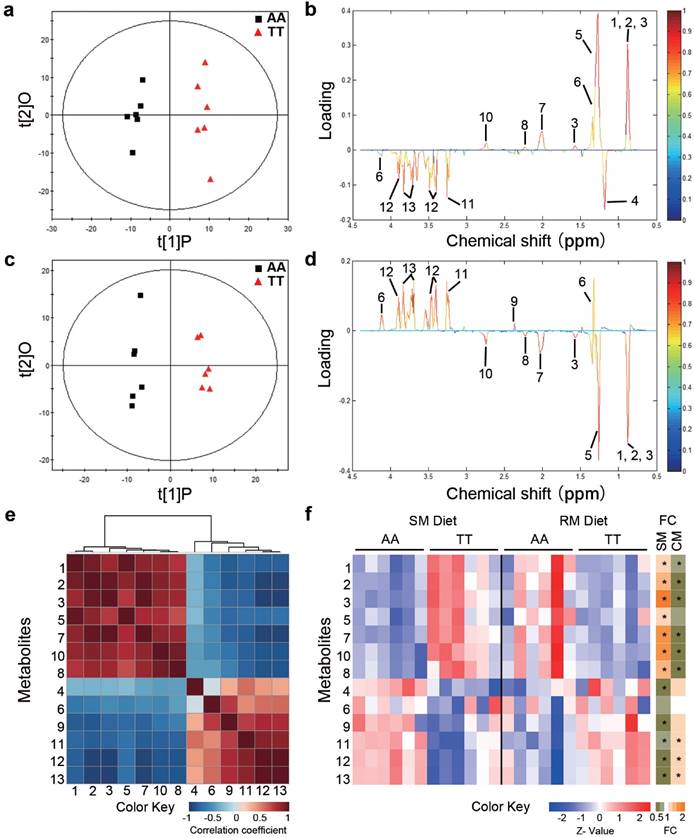
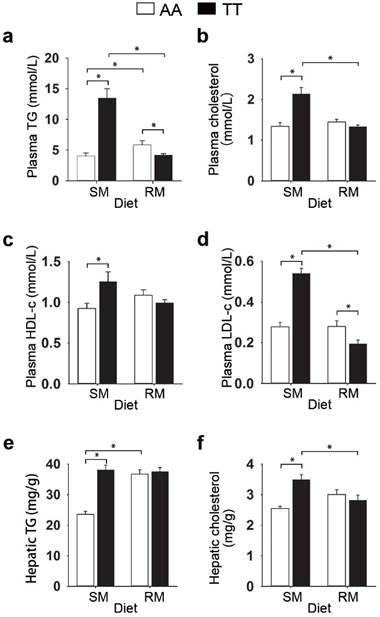
To determine whether the loss-of-function FMO3 gene mutation (i.e. T329S) influenced metabolic traits, we performed NMR-based metabolomic analysis in plasma from normal (AA) and mutant (TT) hens. An obvious group separation in the orthogonal partial least squares discriminant analysis (OPLS-DA) score plots suggested a significant metabolic change that is due to the genetic variant T329S in FMO3 (Figure 2a and 2c). Using the variable importance in projection (VIP) values (VIP > 1), the absolute value of the correlation coefficient (|r| > 0.53) derived from the OPLS-DA model and the P values (P < 0.05), we identified 13 metabolites that contribute to this genotypic separation (Table S3). These 13 detected genotype-associated features were classified into two groups according to the hierarchical analysis, and there was a negative correlation between the two groups of metabolites (Figure 2e). One group of metabolites was mainly involved in lipids metabolism and included high-density lipoprotein (HDL), very low-density lipoprotein (VLDL), low-density lipoprotein (LDL), saturated fatty acids (SFAs), unsaturated fatty acids (UFAs), PUFAs, and acetone. The other metabolite group was mainly distributed among the related pathways of glucose metabolism (α-glucose and β-glucose), ketone body metabolism (3-hydroxybutyrate), glutamate metabolism (glutamate), and TMA metabolism (TMAO). In addition, we found that the genotype-related metabolic patterns varied with the dietary condition. Plasma samples from SM-fed TT hens generally showed higher levels of lipids and acetone and lower levels of glucose and TMAO than that from AA hens (Figure 2b and 2f). In contrast, the plasma metabolic response was different for TT hens fed the RM diets, which led to higher levels of glucose but lower levels of lipids (especially PUFAs) and acetone (Figure 2d and 2f) relative to AA hens fed RM diets. Results from biochemical measurements confirmed the observations concerning plasma lipids obtained in metabolic profiling. In birds fed SM diets, T329S significantly increased plasma levels of triglycerides (Figure 3a), total cholesterol (Figure 3b), and HDL- and LDL- cholesterol (Figure 3c and 3d), and also showed higher hepatic triglycerides (Figure 3e) and total cholesterol level (Figure 3f). In contrast, when birds were fed the RM diets, the T329S mutation was associated with lower levels of plasma triglyceride (Figure 3a) and LDL- cholesterol (Figure 3d) compared with AA hens. There was no difference in plasma glucose levels between genotypes (data not shown). In summary, these observations suggest a distinct variation in lipid metabolism that is linked to the genetic variant T329S in FMO3, and demonstrated that this variation in lipid profiles was diet dependent.
Metabolic profiling in chickens reveals distinct variations in lipid metabolism linked to the T329S genetic variation in FMO3. Hens were fed the soybean meal (SM) diets (a, b) or rapeseed meal (RM) diets (c, d) (n = 6 birds/groups). (a, c) OPLS-DA score plots based on 1H NMR spectra of plasma samples from AA and TT genotype hens. t[1]P is the first principal component, and t[2]O is the second orthogonal component. ((b, d) Corresponding coefficient loading plots according to OPLS-DA analysis with the metabolites labeled from plasma samples of AA and TT hens. (e) Hierarchical clustering heat-map of Spearman's correlations among 13 identified differential metabolites. (f) Heatmap showing the degree of change (left) and fold change (FC, right) in the TT genotype hens compared with the AA genotype hens. An asterisk in the FC heatmap indicate a significant change (P < 0.05). Metabolites: 1, lipid (high-density lipoprotein); 2, lipid (low-density lipoprotein); 3, lipid (very low-density lipoprotein); 4, 3-hydroxybutyrate; 5, lipid (saturated fatty acids); 6, lactate; 7, lipid (unsaturated fatty acids); 8, acetone; 9, glutamate; 10, lipid (polyunsaturated fatty acids); 11, trimethylamine N-oxide; 12, β-glucose; 13, α-glucose.
Effect of the T329S genetic variation in FMO3 on plasma and liver lipids in birds. (a-d) Data are the mean of 6 replicates, and 3 birds from each replicate were analyzed, (e-f) Liver samples from hens was analysed, n = 6 birds/group. (a) Plasma total triglyceride (TG) levels. (b) Plasma cholesterol levels. (c) Plasma high-density lipoprotein cholesterol levels. (d) Plasma low-density lipoprotein cholesterol levels. (e) Hepatic total triglyceride levels. (f) Hepatic cholesterol levels. Data are presented as mean ± SEM. Significance was measured with student's t-test. *P < 0.05.
Genetic variant in FMO3 alters hepatic transcriptional profiles in a diet-specific manner
To identify the genes and mechanisms involved in T329S-induced changes in lipid metabolism, we investigated the gene expression profile in chicken livers using RNA-Seq. A total of ~15,500 genes were detected by RNA-Seq analysis. Differentially expressed genes (DEGs) were initially identified by the combined cut-offs of P < 0.05 and fold change > 2. Overall, 90 DEGs were identified between AA and TT hens when fed the SM diets, with 43 up-regulated genes and 47 down-regulated genes in TT hens (Figure 4a). The genetic difference in expression patterns was even more pronounced with the RM diet regimen, as indicated by the detection of a greater number of DEGs (306 DEGs), with 181 up-regulated genes and 125 down-regulated genes in the TT hens (Figure 4a). The gene ontology (GO) terms enrichment analysis showed that the DEGs between AA and TT hens were significantly enriched in lipid metabolic process under RM diets (P = 0.019; Figure S1).
Genetic variation in FMO3 alters hepatic transcriptional profiling in a diet-specific manner. Hepatic genes involved in lipid metabolism are highlighted. (a) Number of differentially expressed genes (DEGs) between AA and TT hens under the corn-soybean meal basal (SM) diets or rapeseed meal (RM) diets (n = 6 birds/groups). The DEGs were identified by the combined cut-offs of P < 0.05 and fold change > 2. (b) Venn diagrams showing 11 shared DEGs induced by genotypes. (c) Fold change analysis showing expression patterns of the 11 shared DEGs. Fold changes were determined by comparing the change in gene expression (reads per kilobase per million mapped reads, RPKM) of TT hens relative to AA hens, and were log2 transformed. (d, e) Heatmaps of expression data generated from the read counts of lipid metabolism-related genes in AA and TT genotype hens along with fold change (FC; to the right) analysis under the SM (d) or RM diets (e). Each column in the heatmap represents an individual animal. * P < 0.05; ** P < 0.01; *** P < 0.001.
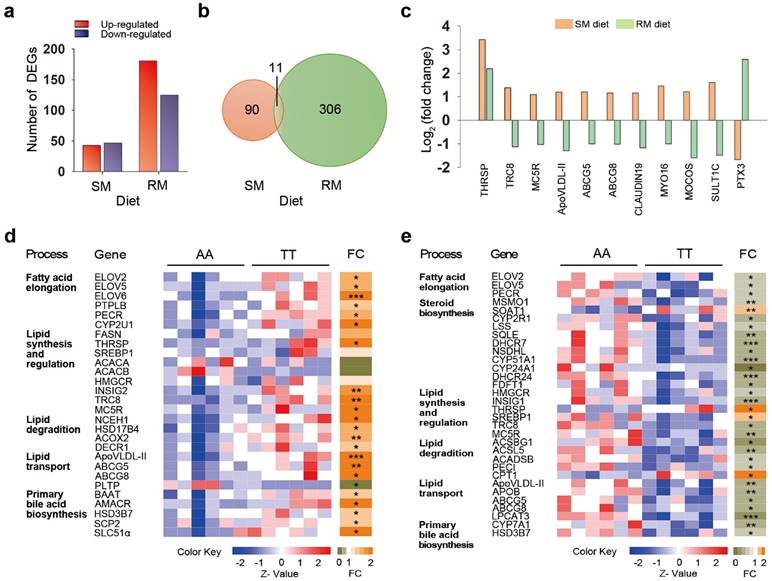
We focused our investigation on the 11 shared genes that were differentially expressed between the genotypes under both two diet conditions (Figure 4b). Of the 11 joint transcripts, 10 genes exhibited different patterns of expression, and only one gene that was coordinately regulated in both SM and RM diets (Figure 4c). This one coordinately regulated gene was thyroid hormone responsive spot 14 protein (THRSP, also known as Spot 14), a transcription factor associated with de novo fatty acid synthesis in the liver [23]. Interestingly, T329S induced a significant increase in THRSP expression that was more prominent under SM diets, suggesting that the genotype involved in regulating mechanisms through THRSP tend to become somewhat less efficient under the RM diets (Figure S2). There were another five genes encoding jointly affected transcripts that are involved in lipid metabolism or its regulation, including translocation in renal carcinoma on chromosome 8 protein (TRC8, also known as RNF139), melanocortin 5 receptor (MC5R), apovitellenin 1 (ApoVLDL-II, also known as APOV1), and ATP binding cassette transporters G5 (ABCG5) and G8 (ABCG8). T329S significantly increased expression of the five genes of the joint transcripts under the SM diets by qRT-PCR validation (Figure S2). In contrast, their expression (except MC5R) was significantly suppressed by T329S under the RM diets (Figure S2). Similarly, there were additional four joint transcripts that were up-regulated by the T239S under the SM diets while down-regulated under the RM diets. The corresponding genes function in the formation of tight junction strands (CLAUDIN 19), cytoskeleton proteins (Myosin XVI, MYO 16) and xenobiotic metabolism (molybdenum cofactor sulfurtransferase, MOCOS; sulfotransferase family, cytosolic,1C, member 3, SULT1C). Conversely, the joint transcripts associated with inflammatory cardiovascular diseases (pentraxin 3, PTX3) [24] was significantly decreased by the T329S under the SM diets and reciprocally increased under the RM diet regimen. Notably, ABCG5 and ABCG8, together with THRSP, are direct LXR target genes [25]. LXR also regulates expression of a cluster of apolipoprotein genes in murine and human macrophages [26,27]. Collectively, the hepatic transcriptional profiling results also link the genetic variant T329S in FMO3 to lipid metabolism, and the changes in gene expression exhibits diet-specific patterns similar to those that we detected when we assayed for metabolic changes.
Changes in expression of lipid metabolism-related genes by T329S
We next expanded our characterization of the effects of T329S on expression of genes related to lipid metabolism under the SM or RM diet condition (Figure 4d and 4e). T329S stimulated biosynthesis of long-chain PUFAs under the SM diets. Transcription of genes encoding enzyme related to long-chain PUFA biosynthesis was significantly increased by >1.5-fold in the liver of TT hens as compared with AA hens when fed the SM diets (Figure 4d). Significantly upregulated genes included three members of the elongation of very long chain fatty acid family (ELOVL2, ELOVL5 and ELOVL6); protein tyrosine phosphatase-like, member B (PTPLB); and peroxisomal trans-2-enoyl-CoA reductase (PECR). Cytochrome P450, family 2, subfamily U, polypeptide 1 (CYP2U1), an enzyme for the synthesis of arachidonic acid, was also up-regulated. In parallel, the transcript level of fatty acid synthase (FASN) also showed a >1.5-fold increase in the TT hens but failed to reach significance (P = 0.07). FASN is a target gene of THRSP and encodes a key enzyme involved in the synthesis of saturated fatty acids [28]. These data may explain, in part, the higher plasma fatty acids levels found in TT hens than AA hens when fed the SM diets.
T329S mutation seemed to induce an inhibition of triglyceride and cholesterol synthesis and a greater stimulation of lipid degradation. The mRNA levels of genes involved in triglyceride and cholesterol synthesis or regulation, such as sterol regulatory element-binding protein 1 (SREBP1), acetyl-CoA carboxylase alpha (ACACA), acetyl-CoA carboxylase beta (ACACB) and 3-hydroxy-3-methylglutaryl coenzyme A reductase (HMGCR), did not differ between AA and TT hens. However, the elevated expression of insulin induced gene 2 (INSIG2) suggests a decrease in the maturation of SREBP and stabilization of HMGCR [29,30]. The mRNA levels of TRC8 and MC5R were increased by T239S under SM diets conditions. TRC8 is involved in the sterol-accelerated ubiquitination of HMGCR, and MC5R plays a direct role in promoting lipolysis and repressing re-esterification [31,32]. In parallel, the mRNA levels of genes involved in hydrolysis of intracellular cholesteryl ester (neutral cholesterol ester hydrolase 1, NCEH1) and fatty acid β-oxidation in peroxisome, such as hydroxysteroid (17-beta) dehydrogenase 4 (HSD17B4), acyl-CoA oxidase 2 (ACOX2) and 2,4-dienoyl CoA reductase 1 (DECR1), were higher in TT hens.
T329S also enhanced the elimination of cholesterol and triglyceride from the liver via deposition in yolk or bile acid formation. The mRNA levels of ApoVLDL-II, ABCG5 and ABCG8, showed markedly higher expression in TT hens than in AA hens when fed the SM diets. ApoVLDL-II, ABCG5 and ABCG8 are involved in transporting cholesterol and triglyceride from the liver to the ovary and bile canaliculus. But T329S decreased mRNA levels of phospholipid transfer protein (PLTP), which involved in the transfer of phospholipids and free cholesterol between lipoproteins and are closely related to atherosclerosis [33]. In addition, we also observed increased primary bile acid biosynthesis in the livers of TT hens, as evidenced by increased mRNA levels of bile acid-CoA:amino acid N-acyltransferase (BAAT), alpha-methylacyl-CoA racemase (AMACR), hydroxy-delta-5-steroid dehydrogenase, 3 beta- and steroid delta-isomerase 7 (HSD3B7), sterol carrier protein 2 (SCP2) and solute carrier family 51, alpha subunit (SLC51α).
Under the RM diets, T329S induced a reciprocal change in expression of genes involved in lipid metabolism (Figure 4e). In RM-fed TT hens, there was a coordinated decrease in the expression of genes involved in the biosynthesis of long-chain PUFAs (ELOVL2, ELOVL5 and PECR), cholesterol synthesis (HMGCR) and efflux (ABCG5 and ABCG8), triglyceride transport (APOB and ApoVLDL-II), lipid lipolysis and fatty acid degradation (acyl-CoA synthetase long-chain family member 5, ACSL5; acyl-CoA synthetase bubblegum family member 1, ACSBG1; acyl-CoA dehydrogenase short chain, ACADSB; delta 3,delta 2-enoyl-CoA isomerases, PECI) and bile acid biosynthesis (HSD3B7; cytochrome P450 family 7 subfamily A member 1, CYP7A1). In parallel, transcript levels of SREBP also decreased in RM-fed TT hens. These data may explain, in part, the lower plasma fatty acids and lipid levels found in TT hens relative to AA hens when fed the RM diets. Furthermore, expression levels of 11 genes associated with steroids biosynthesis were also lower in TT hens, including methylsterol monooxygenase 1(MSMO1); cytochrome P450 family 2 subfamily R member 1 (CYP2R1); lanosterol synthase (LSS), squalene epoxidase (SQLE); 7-dehydrocholesterol reductase (DHCR7), NAD(P) dependent steroid dehydrogenase-like (NSDHL); cytochrome P450, family 51, subfamily A, polypeptide 1 (CYP51A1); cytochrome P450 family 24 subfamily A member 1 (CYP24A1); 24-dehydrocholesterol reductase (DHCR24) and farnesyl-diphosphate farnesyltransferase 1 (FDFT1). Correspondingly, the decreased expression of INSIG1 in livers of TT hens might be a response to the lower levels of sterols, which suggests a weakened repression of post-translational activation of SREBP.
Discussion
Metabolic and hepatic transcriptional analyses revealed a prominent change in lipid metabolism associated with the genetic variant T329S in FMO3 under both the SM and RM diets. In hens fed the SM diets, which contained a lower level of TMA precursor, T329S induced a coordinated increase in the levels of UFAs in the plasma and the expression of hepatic genes associated with biosynthesis of PUFAs (ELOVL2, ELOVL5, ELOVL6, PTLB and PECR). Together with the increase in THRSP expression, our results suggest that T329S promotes hepatic de novo UFA synthesis under the SM diets. The concomitant increase in plasma levels of lipid β-oxidation products (3-hydroxybutyrate and acetone) and mRNA levels of genes involved in lipid β-oxidation in peroxisomes (HSD17B4, ACOX2 and DECR1) suggested that T329S also induced higher long-chain PUFA bioavailability in the liver under the SM diets [34]. The observed increase in plasma triglyceride and cholesterol levels induced by the T329S mutation could be primarily attributed to the elevation of hepatic VLDL secretion. The major VLDL classes present in the plasma of laying hens are yolk-targeted small-diameter triacylglycerol-rich particles (VLDLy) that are produced by the liver [35]. The increased expression of ApoVLDL-II, a specific apolipoprotein of VLDLy, may have been in response to an increase in demand for VLDLy assembly. ApoVLDL-II provides VLDLy particles with resistance to degradation by lipoprotein lipase [36]. While the minor VLDL class produced by the kidney could be converted to LDL by the action of lipoprotein lipase [35]. The increase in plasma LDL suggested that this general VLDL secretion might also increase. We also observed higher hepatic cholesterol and triglyceride levels in SM-fed TT hens. Thus, the enhancement of hepatic VLDL secretion may protect the liver from triglyceride accumulation. Consistent with this speculation, the inhibition in transcriptional levels of triglyceride and cholesterol synthesis may have been in response to the increased cellular sterols [37]. In parallel, the increased plasma HDL-cholesterol levels and mRNA levels of genes involved in hepatic bile acid biosynthesis indicated enhanced reverse cholesterol transport.
The difference in lipid metabolism induced by T329S was further confirmed in birds that were fed the RM diets, which contained higher level of TMA precursor. Interestingly, T329S induced reciprocal changes in lipid metabolism under the RM diets, such as inhibition of PUFA synthesis, cholesterol and steroid biosynthesis and correspondingly decreased lipid transport and bile acid biosynthesis. The observed reciprocal changes in lipid metabolism induced by T329S may be partially mediated through the LXR pathway. LXRs functions as sterol sensors to maintain cholesterol and fatty acid homeostasis by regulating genes involved in reverse cholesterol transport and de novo fatty acid synthesis [25]. The reduction in expression of LXR direct target genes (ABCG5, ABCG8, LPCAT3, SREBP1 and CYP7A1) suggests that T329S may dampen LXR signaling under the RM diets. This repression in LXR signaling may have resulted from the inhibition of steroid biosynthesis in RM-fed TT hens, which would decrease the availability of endogenous oxysterol ligands in the liver [38]. In SM-fed birds, T329S increased expression of the target genes ABCG5, ABCG8 and THRSP. The altered PUFA metabolism may represent an additional response mechanisms and may partly explain the T329S mutation-related enhanced fatty acid oxidation and lipogenesis inhibition under the SM diets. UFA inhibits transcription of SREBP1 by accelerating its degradation directly [39] and inhibits proteolytic activation of SREBP1 by stabilization of INSIG1 [40], which may counteract the inductive effect of LXR. In addition, many UFAs are known PPARα ligands, and thus increased levels of UFAs may induce a greater stimulation of fatty acid oxidation by activation of PPARα [41]. Similarly, hepatic FMO3 knockdown decreases hepatic levels of UFAs and dampens the PPARα pathway in mice [8]. Together these data suggest a link between FMO3 and PUFA metabolism, although this possibility awaits further study. Collectively, our observation of T329S-related changes in lipid metabolism implies a role for FMO3 in the modulation of lipid homeostasis, and further suggests that the LXR pathway and PUFA metabolism may be involved in this modulation.
FMO3 may be a novel mediator of hepatic lipid metabolism. Knockdown of FMO3 decreases hepatic and plasma lipids levels in LDL receptor knockout mice [8], decreases VLDL- and LDL-associated cholesterol in liver insulin receptor-knockout mice [42], and limits the production of hepatic oxysterols and cholesteryl esters in cholesterol-fed mice [9]. Conversely, FMO3 overexpression in transgenic mice increased hepatic and plasma lipids [8,9]. It seems like that the regulatory role of FMO3 in lipid metabolism is dependent on diets, particularly with respect to the different levels of TMA precursor availability. In birds that were fed lower levels of TMA precursor, the T329S caused an elevation in the levels of plasma TMA, hepatic FMO3 mRNA, hepatic cholesterol and triglyceride levels. In contrast, in birds that were fed higher levels of TMA precursor and showed increased cecal TMA production, T329S mutation caused a repression in LXR pathway reduction, but did not affected plasma TMA contents or FMO3 mRNA levels. We hypothesize that TMA levels may act as proximal signals in the modulation of FMO3 expression.
FMO3 expression is regulated by a complex interaction of genetic and dietary factors in humans, mice and birds [14,19,20]. In the view of xenobiotic metabolism, exposure to substrates at high concentration triggers a cellular “stress” response leading to an increase in the expression of genes encoding metabolizing enzymes, thereby enhancing the elimination and clearance of these xenobiotics [43]. In the current study, the T329S mutation, which impairs TMA-oxygenation of FMO3 [19,20], leads to higher plasma TMA levels and a corresponding increase in FMO3 mRNA levels. But the diet factor might obscure this genetic change [20], as exposure to high levels of TMA precursor partially increased FMO3 mRNA levels in homozygous normal AA birds (Figure 1c, P = 0.077). The RM diets induced fishy odor-tainted eggs in TT hens, which indicates that a relatively large amount of the excess TMA was excreted into the eggs and which may explain why no increase was observed in plasma TMA. In addition, FMO3 could be a regulator of LXR activity [9]. We also observed hepatic FMO3 expression was positively correlated with LXR expression (Figure S3). It can be concluded that FMO3 is an important phase II metabolizing enzymes responsible for TMA oxygenation [14], but that it is also linked to nuclear receptors or transcription factors regulating the homeostasis of lipids, glucose, bile acids, inflammation and other metabolites [6-9]. In addition, further studies are required to determine whether other substrates metabolism of FMO3, for e.g., S-oxygenation substrate, also change metabolic traits in human and birds. Consequently, in the current study, the increase in FMO3 gene expression may be an active response to dietary TMA precursor levels, allowing FMO3 to alter lipid metabolism by activation of the LXR signaling pathway.
Conclusions
The studies described here showed the genetic variant T329S in FMO3 altered TMA and lipid metabolic response to two defined diets with different contents of TMA precursor. These data suggest FMO3 functions in TMA metabolism and lipid homeostasis in a diet-dependent manner, and further reveal that LXR pathway and PUFA metabolism may be involved in this modulation. Furthermore, our data showed the disturbance in TMA metabolism caused by genetic and dietary factors altered lipid metabolism in birds. This finding, in turn, reveals an association between the xenobiotic TMA metabolism and lipid homeostasis, and further supports that FMO3 may represent a central regulatory node for possible crosstalk between xenobiotic metabolism and lipid metabolism. Thus, these dietary factors and novel additional metabolic effects should be taken into consideration when pharmacological intervention is being considered as a means to target TMA metabolism in general, or FMO3 directly. These findings contribute to a broader appreciation of the regulatory role of FMO3, and may also provide clues for understanding the complex interaction of diets rich in TMA precursors with genetic variant in FMO3 in other poultry species and in mammals.
Material and Methods
Ethics Statement
The methods of this study were conducted in accordance with the Guidelines for Experimental Animals established by the Ministry of Science and Technology (Beijing, China), and the criteria outlined in the Guide for the Care and Use of Laboratory Animals of Feed Research Institute, Chinese Academy of Agricultural Sciences (FRICAAS). All animal experimental protocols were approved by the Animal Care and Use Committee of FRICAAS.
Birds, diets and sample collection
Hens were initially genotyped at FMO3 c.984 A>T by the PCR-RFLP assay [20]. A total of 144 45-week-old laying hens (Gallus gallus; Jing Brown), consisting of 72 hens of AA genotype and 72 hens of TT genotype, were used in this study. For each genotype, hens were randomly allotted to one of the two dietary treatments, either the corn-soybean meal basal diets (SM, < 0.15 mg/g sinapine) or this basal diets supplemented with 21% of rapeseed meal (RM), which contained higher levels of TMA precursor (1.33 mg/g sinapine). Each dietary treatment consisted of six replicates of six birds each. Diets (Table S1) were formulated according to the nutrient requirements of the National Research Council (1994) and Chinese Feeding Standard of Chicken (Ministry of Agriculture of China, 2004). Bird management was consistent with commercial management guide recommendations (Jing Brown). Feed was offered in a mash form for ad libitum consumption. Water was supplied by nipple drinkers. All hens were fed the SM basal diets for one-week adaptation followed by an eight-week trial period. Six eggs from each replicate were collected at d 54 to d 56 of the trial period for TMA analysis. At the end of the feeding trial, three birds were selected from each replicate for blood sampling. Blood samples were drawn from wing veins, and then centrifuged (3,000 × g for 10 min) at 4°C to obtain plasma, and stored at -20°C until analysis. After blood sampling, one bird each replicate was killed by exsanguinations of the left jugular vein by a trained personnel. Livers were sampled sequentially after slaughter, and immediately frozen in liquid nitrogen and stored at -80°C. Cecal chyme was also collected and kept at -20°C.
TMA, TMAO and FMO activity determination
The concentration of TMA in egg yolks, cecal chyme and plasma samples was determined by head space gas chromatography as described previously [20,44]. Plasma TMAO was determined as TMA after TiCl3 reduction [44]. Liver microsomes were prepared by differential centrifugation of the homogenates [20]. Determination of TMA N-oxygenase activity was performed as previously reported [20,45,46].
Biochemical measurements
Plasma levels of total triglyceride, total cholesterol, and HDL-and LDL- cholesterol were determined using an automatic biochemical analyzer (Model 7020, Hitachi, Tokyo, Japan). Hepatic total triglyceride and cholesterol levels were determined using assay kits obtained from the Nanjing Jiancheng Bioengineering Institute (Nanjing, Jiangsu, China).
Metabolic profiling
The plasma samples were thawed at room temperature, and 300 μL of each sample was mixed with 100 μL deuterated water (99.9% purity, Cambridge Isotope Laboratories, Tewksbury, MA) containing 1 mg/mL sodium trimethylsilyl-[2,2,3,3-2H4]-1-propionate (TSP, Merck, Whitehouse Station, NJ) as an internal chemical shift reference. The mixture was added to 200 μL deuterated water, vortexed and then centrifuged at 14,000 rpm for 10 min. The supernatant fraction (550 μL) was transferred into 5-mm NMR tubes. The spectra were measured using a Varian Unity INOVA 600 NMR spectrometer (Varian Inc., Palo Alto, CA). The NMR spectra were recorded using the Carr-Purcell-Meiboom-Gill spin-echo pulse sequence with presaturation and a total spin-echo delay (2 nτ) of 320 ms. A total of 64 transients were collected into 64 K data points using a sweep width of 8000 Hz, a relaxation delay of 2 s, and an acquisition time of 4 s. Prior to Fourier transformation, an exponential line broadening function of 1 Hz was applied to the free induction decay. The proton NMR spectra were manually phased and baseline corrected. The spectral matrix was further reduced in size by integrating the 0.01-ppm-wide bins in the range of δ 0.4 to δ 4.4 ppm. Each integrated region was normalized to the total intensity of spectrum to generate quantitative variables. The 1H NMR spectra of plasma samples were referenced to an internal lactic acid CH3 resonance at δ 1.33.
Transcriptomic profiling
Total RNA was isolated from liver samples from each of the 24 hens (six samples per group) with Trizol (Invitrogen, Carlsbad, CA). The quality and concentration of total RNA were measured by 1.0% agarose gel electrophoresis and spectrophotometric analysis (NanoDrop 8000 spectrophotometer, NanoDrop Technologies, Wilmington, DE), respectively. RNA library construction and sequencing were performed at Shanghai Personal Biotechnology Co., Ltd. (Shanghai, China). The cDNA libraries were constructed following the TruSeq RNA Sample Preparation Guide (Illumina, San Diego, CA). The poly(A) mRNA was isolated from purified total RNA using biotin-oligo (dT) magnetic beads and was fragmented to generated average insert sizes of ~350 bp before creating the cDNA libraries. Quality control was conducted using Pico green fluorescence spectrophotometry and an Agilent 2100 Bioanalyzer (Agilent Technologies, Palo Alto, CA). A cluster was generated, diluted to 4-5 pM and sequenced using the Illumina NextSeq 500 System with paired-end 2 × 150-bp reads.
Quantitative real-time PCR (qRT-PCR) analysis
To confirm the reproducibility and accuracy of the RNA-Seq gene expression data obtained from the chicken liver libraries, qRT-PCR was carried out on the six selected genes (Figure S2). The expression levels of FMO3 were also determined by qRT-PCR. The PCR primers used in this study are listed in Table S4. Real-time PCR was performed using ABI Step-One Plus Real-Time PCR system (ABI 2700, Applied Biosystems, Foster City, CA). The relative gene expression levels were normalized to the endogenous RNA control glyceraldehyde-3-phosphate dehydrogenase (GAPDH) with the 2-ΔΔCT method [47].
Statistical analysis
For metabolic profiling, the acquired data sets were imported into the SIMCA-P+ program (version 12.0, Umetrics, Umeå, Sweden) for multivariate statistical analysis. Filtered data were mean-centered and scaled (Pareto). Multivariate analysis included an unsupervised principal-component analysis and OPLS-DA, which were performed to discriminate between genotypes under SM and RM diets. All OPLS-DA models were constructed using a seven-fold cross-validation method to determine the number of latent variables to include in the OPLS-DA model and further assessed with a 200-permutation test to calculate the robustness and validity of the OPLS-DA results. The metabolites were identified by matching 1H-NMR data to reference spectra in a public database (http://www.hmdb.ca/) and to reports in the literature. The loadings from the OPLS-DA models were plotted using an in-house-developed MATLAB script (V7.1, The Mathworks, MA/2012) with correlation coefficients color-coded to reflect the significance of inter-group differentiations for all metabolites. The metabolites responsible for genotype separation were selected by using the VIP values (VIP > 1) and the absolute value of the correlation coefficient (|r| > 0.53). The selected metabolites were further compared using independent-sample t-tests (SPSS 16.0 for Windows, SPSS Inc., Chicago, IL, USA). Differences were considered statistically significant at P < 0.05. The corresponding fold change was also calculated.
Raw RNA-Seq data were preprocessed, assembled, and then filtered by standard QC criteria. The corresponding sequenced reads were mapped to the chicken genome in Ensembl using Bowtie2/Tophat2 (http://tophat.cbcb.umd.edu), and the reads of each gene were normalized by using the RPKM. The significance was determined by normalizing the raw reads and calculating the P-value by using DESeq (http://bioconductor.org/packages/release/bioc/html/DESeq.html). Genes with fold changes (log2 (RPKM (TT/AA))) > 2 and P-value < 0.05 were identified as DEGs. We have used Gene Ontology terms for chicken proteins annotated to lipid metabolic process to make relevant heatmaps of genes associated with these terms. These selected lipid metabolism-related gens were further compared using independent-sample t-tests. Differences were considered statistically significant at P < 0.05. The corresponding fold change was also calculated.
Other data analyses were performed using SPSS. Multivariate analysis of TMA metabolism data were performed using the General linear model procedure in SPSS. Descriptive statistics were calculated and statistical significance of comparisons between the two genotypes assessed using independent-sample t-tests. Differences were considered statistically significant at P < 0.05. Data are expressed as the mean and pooled SEM.
Abbreviations
TMA: trimethylamine; TMAO: trimethylamine N-oxide; FMO3: flavin-containing monooxygenase 3; CVD: cardiovascular disease; NMR: nuclear magnetic resonance; RNA-Seq: RNA sequencing; LXR: liver X receptor; PUFA: polyunsaturated fatty acid; SM: soybean meal; RM: rapeseed meal; OPLS-DA: orthogonal partial least squares discriminant analysis; HDL: high-density lipoprotein; VLDL: very low-density lipoprotein; LDL: low-density lipoprotein; SFAs: saturated fatty acids; UFAs: unsaturated fatty acids; DEGs: differentially expressed genes; GO: gene ontology; qRT-PCR: quantitative real-time PCR.
Supplementary Material
Supplementary figures and tables.
Acknowledgements
This study was supported by the National Natural Science Foundation of China (31301991), the earmarked fund for Modern Agro-industry Technology Research System (CARS-41-K13), China Agriculture Research System - Beijing Team for Poultry Industry, and National Key Technology Research and Development Program (2014BAD13B04).
Author contributions
G.H.Q. and J.W. conceived and designed the experiments; J.W. and C.L. performed all experiments; J.W. analyzed the data and wrote the paper; Y.N.Z. and H.W. participated in the genotyping analysis and animal experiments; X.C.W. and H.Y.Y. helped in the metabolomic and transcriptomic data analysis; H.J.Z. gave advice on the experiment design and manuscript revision; G.H.Q. and S.G.W. supervised and provided continuous guidance for the experiment and the data analysis. All authors reviewed the manuscript and approved the final manuscript.
Competing Interests
The authors have declared that no competing interest exists.
References
1. Koeth RA, Wang Z, Levison BS. et al. Intestinal microbiota metabolism of L-carnitine, a nutrient in red meat, promotes atherosclerosis. Nat Med. 2013;19:576-585
2. Tang WH, Wang Z, Levison BS. et al. Intestinal microbial metabolism of phosphatidylcholine and cardiovascular risk. N Engl J Med. 2013;368:1575-1584
3. Wang Z, Klifell E, Bennett BJ. et al. Gut flora metabolism of phosphatidylcholine promotes cardiovascular disease. Nature. 2011;472:57-63
4. Mente A, Chalcraft K, Ak H. et al. The relationship between trimethylamine-N-oxide and prevalent cardiovascular disease in a multiethnic population living in Canada. Can J Cardiol. 2015;31:1189-1194
5. Stubbs JR, House JA, Ocque AJ. et al. Serum trimethylamine-N-oxide is elevated in CKD and correlates with coronary atherosclerosis burden. J Am Soc Nephrol. 2016;27:305-313
6. Zhu W, Gregory JC, Org E. et al. Gut Microbial Metabolite TMAO Enhances Platelet Hyperreactivity and Thrombosis Risk. Cell. 2016;165:1-14
7. Seldin MM, Meng Y, Qi H. et al. Trimethylamine N-Oxide promotes vascular inflammation through signaling of mitogen-activated protein kinase and nuclear factor-kB. J Am Heart Assoc. 2016;5:e002767
8. Shih DM, Wang Z, Lee R. et al. Flavin containing monooxygenase 3 exerts broad effects on glucose and lipid metabolism and atherosclerosis. J Lipid Res. 2015;56:22-37
9. Warrier M, Shih DM, Burrows AC. et al. The TMAO-generating enzyme flavin monooxygenase 3 is a central regulator of cholesterol balance. Cell Rep. 2015;10:326-338
10. Tang WH, Wang Z, Kennedy DJ. et al. Gut microbiota-dependent trimethylamine N-oxide (TMAO) pathway contributes to both development of renal insufficiency and mortality risk in chronic kidney disease. Circ Res. 2015;116:448-455
11. Organ CL, Otsuka H, Bhushan S. et al. Choline diet and its gut microbe-derived metabolite, trimethylamine N-oxide, exacerbate pressure overload-induced heart failure. Circ Heart Fail. 2016;9:e002314
12. Suzuki T, Heaney LM, Bhandari SS. et al. Trimethylamine N-oxide and prognosis in acute heart failure. Heart. 2016;102:841-848
13. Wang Z, Roberts AB, Buffa JA. et al. Non-lethal inhibition of gut microbial trimethylamine production for the treatment of atherosclerosis. Cell. 2015;163:1585-1595
14. Bennett BJ, de Aguiar Vallim TQ, Wang Z. et al. Trimethylamine-N-oxide, a metabolite associated with atherosclerosis, exhibits complex genetic and dietary regulation. Cell Metab. 2013;17:49-60
15. Esposito T, Varriale B, D'Angelo R. et al. Regulation of flavin-containing mono-oxygenase (Fmo3) gene expression by steroids in mice and humans. Horm Mol Biol Clin Investig. 2014;20:99-109
16. Yamazaki H, Shimizu M. Survey of variants of human flavin-containing monooxygenase 3 (FMO3) and their drug oxidation activities. Biochem Pharmacol. 2013;85:1588-1593
17. Hartiala J, Bennett BJ, Wang Z. et al. Comparative genome-wide association studies in mice and humans for trimethylamine N-oxide, a proatherogenic metabolite of choline and L-carnitine. Arterioscler Thromb Vasc Biol. 2014;34:1307-1313
18. Shimizu M, Allerston CK, Shephard EA. et al. Relationships between flavin-containing mono-oxygenase 3 (FMO3) genotype and trimethylaminuria phenotype in a Japanese population. Br J Clin Pharmacol. 2014;77:839-851
19. Honkatukia M, Reese K, Preisinger R. et al. Fishy taint in chicken eggs is associated with a substitution within a conserved motif of the FMO3 gene. Genomics. 2005;86:225-232
20. Wang J, Yue HY, Xia ZQ. et al. Effect of dietary choline supplementation under different flavin-containing monooxygenase 3 genotypes on trimethylamine metabolism in laying hens. Poult Sci. 2012;91:2221-2228
21. Ward AK, Classen HL, Buchanan FC. et al. Fishy-egg tainting is recessively inherited when brown-shelled layers are fed canola meal. Poult Sci. 2009;88:714-721
22. Wang J, Wu SG, Zhang HJ. et al. Trimethylamine deposition in the egg yolk from laying hens with different FMO3 genotypes. Poult Sci. 2013;92:746-752
23. Wu J, Wang C, Li S. et al. Thyroid hormone-responsive SPOT 14 homolog promotes hepatic lipogenesis, and its expression is regulated by Liver X receptor a through a sterol regulatory element-binding protein 1c-dependent mechanism in mice. Hepatology. 2013;58:617-628
24. Savchenko AS, Imamura M, Ohashi R. et al. Expression of pentraxin 3 (PTX3) in human atherosclerotic lesions. J Pathol. 2008;215:48-55
25. Calkin AC, Tontonoz P. Transcriptional integration of metabolism by the nuclear sterol-activated receptors LXR and FXR. Nat Rev Mol Cell Biol. 2012;13:213-224
26. Laffitte BA, Repa JJ, Joseph SB. et al. LXRs control lipid-inducible expression of the apolipoprotein E gene in macrophages and adipocytes. Proc Natl Acad Sci USA. 2001;98:507-512
27. Mak PA, Laffitte BA, Desrumaux C. et al. Regulated expression of the apolipoprotein E/C-I/C-IV/C-II gene cluster in murine and human macrophages. A critical role for nuclear liver X receptors alpha and beta. J Biol Chem. 2002;277:31900-31908
28. Rudolph MC, Wellberg EA, Lewis AS. et al. Thyroid hormone responsive protein Spot14 enhances catalysis of fatty acid synthase in lactating mammary epithelium. J Lipid Res. 2014;25:1052-1065
29. Yabe D, Brown MS, Goldstein JL. Insig-2, a second endoplasmic reticulum protein that binds SCAP and blocks export of sterol regulatory element-binding proteins. Proc Natl Acad Sci USA. 2002;99:12753-12758
30. Song BL, Javitt NB, Debose-Boyd RA. Insig-mediated degradation of HMG CoA reductase stimulated by lanosterol, an intermediate in the synthesis of cholesterol. Cell Metab. 2005;1:179-189
31. Jo Y, Lee PC, Sguigna PV. et al. Sterol-induced degradation of HMG CoA reductase depends on interplay of two Insigs and two ubiquitin ligases, gp78 and Trc8. Proc Natl Acad Sci USA. 2011;108:20503-20508
32. Rodrigues AR, Almeida H, Gouveia AM. Alpha-MSH signalling via melanocortin 5 receptor promotes lipolysis and impairs re-esterification in adipocytes. Biochim Biophys Acta. 2013;1831:1267-1275
33. Jiang XC, Qin S, Qiao C. et al. Apolipoprotein B secretion and atherosclerosis are decreased in mice with phospholipid-transfer protein deficiency. Nat Med. 2001;7:847-852
34. Cherkaoui-Malki M, Surapureddi S, El-Hajj HI. et al. Hepatic steatosis and peroxisomal fatty acid beta-oxidation. Curr Drug Metab. 2012;13:1412-1421
35. Walzem RL, Hansen RJ, Williams DL. et al. Estrogen induction of VLDLy assembly in egg-laying hens. J Nutr. 1999;129:467S-472S
36. Schneider WJ, Carroll R, Severson DL. et al. Apolipoprotein VLDL-II inhibits lipolysis of triglyceride-rich lipoproteins in the laying hen. J Lipid Res. 1990;31:507-513
37. Espenshade PJ, Hughes AL. Regulation of Sterol Synthesis in Eukaryotes. Annu Rev Genet. 2007;41:401-427
38. Janowski BA, Grogan MJ, Jones SA. et al. Structural requirements of ligands for the oxysterol liver X receptors LXRαlpha and LXRbeta. Proc Natl Acad Sci USA. 1999;5:266-271
39. Ou J, Tu H, Shan B. et al. Unsaturated fatty acids inhibit transcription of the sterol regulatory element-binding protein-1c (SREBP-1c) gene by antagonizing ligand dependent activation of the LXR. Proc Natl Acad Sci USA. 2001;98:6027-6032
40. Lee JN, Zhang X, Feramisco JD. et al. Unsaturated fatty acids inhibit proteasomal degradation of insig-1 at a post ubiquitination. J Biol Chem. 2008;283:33772-33783
41. Pawar A, Jump DB. Unsaturated fatty acid regulation of PPARα activity in primary rat hepatocytes. J Biol Chem. 2003;278:35931-35939
42. Miao J, Ling AV, Manthena PV. et al. Flavin-containing monooxygenase 3 as a potential player in diabetes-associated atherosclerosis. Nat Commun. 2015;6:6498
43. Xu C, Li CY, Kong AN. Induction of phase I, II and III drug metabolism/transport by xenobiotics. Arch Pharm Res. 2008;28:249-268
44. Bain MA, Faull R, Fornasini G. et al. Accumulation of trimethylamine and trimethylamine-N-oxide in end-stage renal disease patients undergoing haemodialysis. Nephrol Dial Transplant. 2006;21:1300-1304
45. Mushiroda T, Yokoi T, Takahara E. et al. Sensitive assay of trimethylamine N-oxide in liver microsomes by headspace gas chromatography with flame thermionic detection. J Chromatogr B Biomed Sci Appl. 1999;734:319-323
46. Kubota M, Nakamoto Y, Nakayama K. et al. A mutation in the flavin-containing monooxygenase 3 gene and its effects on catalytic activity for N-oxidation of trimethylamine in vitro. Drug Metab Pharmacokinet. 2002;17:207-213
47. Livak KJ, Schmittgen TD. Analysis of relative gene expression data using real-time quantitative PCR and the 2-ΔΔCT method. Methods. 2001;25:402-408
Author contact
![]() Corresponding authors: Shugeng Wu (wushugengcn) or Guanghai Qi (qiguanghaicn), Feed Research Institute, Chinese Academy of Agricultural Sciences, 12 Zhongguancun Nandajie, Haidian, Beijing 100081, China. Tel: 86-10-82107317, Fax: 86-10-82106054.
Corresponding authors: Shugeng Wu (wushugengcn) or Guanghai Qi (qiguanghaicn), Feed Research Institute, Chinese Academy of Agricultural Sciences, 12 Zhongguancun Nandajie, Haidian, Beijing 100081, China. Tel: 86-10-82107317, Fax: 86-10-82106054.