Impact Factor ISSN: 1449-2288
- Issue 12; 2026
- Issue 11; 2026
- Issue 10; 2026
- Issue 9; 2026
- Issue 8; 2026
- Volume 22; 2026
- Past Issues
- Advance Articles
- Editorial Board
- Cover Images
- Index & Coverage
- Cover Suggestion
- Special Issues
Introduction
Materials and methods
Results
Discussion
Supplementary Material
Acknowledgements
References

 Global reach, higher impact
Int J Biol Sci 2017; 13(2):179-188. doi:10.7150/ijbs.17716 This issue Cite
Research Paper
Activated ClC-2 Inhibits p-Akt to Repress Myelination in GDM Newborn Rats
Feixiang He1, 2, Yuchen Peng3, Zhi Yang2, Zilu Ge2, Yanping Tian1, Teng Ma1, Hongli Li1 ![]()
1. Department of Histology and Embryology, Third Military Medical University, Chongqing, China.
2. Battalion 5 of Cadet Brigade, Third Military Medical University, Chongqing, China.
3. Battalion 4 of Cadet Brigade, Third Military Medical University, Chongqing, China.
Received 2016-9-26; Accepted 2016-11-8; Published 2017-1-15
Abstract

This study aims to investigate the effect and mechanism of type 2 voltage-gated chloride channel (ClC-2) on myelin development of newborn rats' cerebral white matter with gestational diabetes mellitus (GDM). In this study, GDM model was induced in late pregnant rat model. The alteration of ClC-2 expression in various developmental stages of cerebral white matter with/without being exposed to high glucose was analyzed using RT-PCR, active oxygen detection, TUNEL staining, Western Blot as well as immuno-histochemical staining. Our results showed that ClC-2 mRNA and protein expressions in GDM group were significantly increased in white matter of fetal rats after E18 stage, and elevated the level of TNF-α and iNOS in white matter at P0 and P3 stage of newborn rats. Meanwhile, In GDM group, reactive oxygen species (ROS) levels of the white matter at E18, P0, and P3 stage were significantly higher than control group. Furthermore, the expression level of myelin transcription factor Olig2 at P0 stage and CNPase at P3 stage were strikingly lower than that of the control group. In GDM group, ClC-2 expression in the corpus callosum (CC) and cingulate gyrus (CG) regains, and TUNEL positive cell number were increased at P0 and P3 stage. However, PDGFα positive cell number at P0 stage and CNPase expression at P3 stage were significantly decreased. Caspase-3 was also increased in those white matter regions in GDM group, but p-Akt expression was inhibited. While DIDS (a chloride channel blocker) can reverse these changes. In conclusion, ClC-2 and caspase-3 were induced by GDM, which resulted in apoptosis and myelination inhibition. The effect was caused by repressing PI3K-Akt signaling pathway. Application of ClC-2 inhibitor DIDS showed protective effects on cerebral white matter damage stimulated by high glucose concentration.
Keywords: type 2 voltage-gated chloride channel (ClC-2), Gestational Diabetes Mellitus (GDM), oligodendrocyte progenitor cell (OPCs), premyelinating oligodendrocytes (Pre-OLs), apoptosis, white matter development.
Introduction
Gestational diabetes mellitus (GDM) refers to any degree of glucose intolerance with onset or first recognition during pregnancy [1-3]. Patients develop high blood sugar concentration which can do harm to the intrauterine fetus. Clinical studies have provided evidence that high glucose level could affect the development of fetus' nervous system and result in a high possibility of neural tube defects (NTDs) [4, 5]. In addition, study in neuropathological showed that hyperglycemia is connected with oligodendrocytes (OLs) injury [6]. Most OLs are located in white matter regions [7]. In early stage of myelination, oligodendrocyte progenitor cells(OPCs) differentiate into OLs and form myelin sheath [8]. This process usually occurs in the third trimester of pregnancy and even last after birth [9]. Numerous studies have shown that during the period when OPCs differentiate into early OLs, immature OLs were vulnerable to injury factors, such as hypoxia-ischemia [10], toxicity [11], oxidative stress [12] etc. which led to OPCs/Pre-OLs injury and myelination disturbance [13]. In addition, high blood sugar concentration can induce cell apoptosis by increasing oxidative stress response [14] and glycosylation level [15]. In diabetic neuropathy, the apoptosis of rat primary dorsal root ganglion neurons is associated with generation of a variety of reactive oxygen species (ROS) [16]. Besides, Yu, J et al [17] demonstrated the involvement of oxidative stress in NTDs under maternal diabetic in vivo or high glucose in vitro. However, in the early development stage for the white matter, whether high glucose can induce OPCs/Pre-OLs injury and affected myelination development still remains unclear.
Type 2 voltage-gated chloride channels (ClC-2) is a member of the Cl- channel family. It is also connected with the regulation of cellular volume, proliferation and migration [18, 19]. Previous studies have demonstrated that ischemia and hypoxia induced the excessive opening of Cl- channels, which was involved in the apoptosis-induced volume decrease of the myocardial cells [20, 21]. Study on white matter of neonatal rats also showed that ischemia-hypoxia elevated ClC-2 activation which initiated apoptosis of OLs [10]. Moreover, serum and glucocorticoid inducible kinases (SGK1), which is up-regulated by high glucose concentration [22, 23], can enhance ClC-2 expression in plasma membrane in vitro [24, 25]. In our study, we made a research on whether abnormal ClC-2 activation was associated with GDM in the early stage of white matter development and whether OPCs/Pre-OLs injury or white matter damage involved GDM.
Previous studies have demonstrated that PI3K-Akt signal pathway played a crucial role in central nervous system (CNS) myelination [26-29]. It also regulated cellular survival [30], proliferation [31, 32], differentiation [32] and apoptosis [33]. Moreover, high glucose concentration was reported to induce apoptosis of hippocampal neurons via inhibiting the phosphorylation of Akt (p-Akt). In contrast, increasing p-Akt was able to repress apoptosis of hippocampal neurons and alleviate diabetes induced neuron-degeneration [34, 35]. SGK1, which is mentioned above, is associated with elevated ClC-2 membrane expression [24, 25] and is structurally and functionally similar to Akt [36]. Furthermore, activation of the ClC-3, another ClC family member, which subsequently inhibited the PI3K/Akt signaling pathway, was involved in tumor cell apoptosis [37]. Therefore we raised up the hypothesis that PI3K-Akt may be a downstream target of ClC-2.
GDM model was used to explore the effects of ClC-2 activation on neonatal rats' white matter at different development stages. We demonstrated that the activity of ClC2 was enhanced by GDM and this caused inflammation and oxidative stress. It led to apoptosis of white matter cells and decreased the number of OPCs/Pre-OLs. Subsequently white matter damage and myelination disturbance initiated. Furthermore, chloride channel blocker DIDS reversed down-regulation of p-Akt induced by ClC-2, indicating Akt is involved in GDM induced-OLs injury. Our work provides an important view into the molecular mechanism of GDM-induced white matter damage and myelination disturbance.
Materials and methods
Model Preparation and Sample Collection
Adult Sprague-Dawley (SD) rats, weighing 250-350 g, were provided by the Experimental Animal Center of the Third Military Medical University. The male and female mice were placed in the same cages in a 1:2 gender ratio at 06:00 pm and separated at 08:00 am the following day. When a vaginal plug in females was observed at 08:00 am, it was called embryonic day E0. After mating, the pregnant mice were randomly divided into a control group (CTL), a GDM group (GDM), and a DIDS treated group (GDM-DIDS).
On embryos E13, after overnight fasting (deprived of food for 12 h had been allowed free access to water), diabetes was induced in rats by intraperitoneal injection of STZ [38] (Sigma-Aldrich, St Louis, MO, USA) dissolved in 0.1M sodium citrate buffer (pH 4.5) at a dose of 45 mg/kg body weight. DIDS rats were injected with STZ dissolved in 0.1M sodium citrate buffer (pH 4.5) at a dose of 45 mg/kg body weight and DIDS [21] (Sigma-Aldrich, Saint Louis, MO, USA) dissolved in 0.1M sodium citrate buffer (pH 4.5) at a dose of 5 mg/kg body weight. Control rats were injected with citrate buffer alone. Blood was sampled from the vein of the tail under non-anesthesia and fasting for 12 hours. Blood glucose level was determined on 72 hours after administration by using “glucose tester” (Bayer Healthcare LLC, Mishawaka, IN, USA).
The rats were sacrificed respectively at embryonic 18, postoperative 0, 3, 7, 14, 21 and 28 days. Brain white matter was harvested and tissue harvested for the following experiments: single cell suspensions for ROS detection, protein extraction for Western blots, total RNA extraction for RT-PCR analysis, and frozen histological sections (10μm) for immunohistochemistry (IHC).
RT-PCR
For RT-PCR, total RNA from white matter tissue was extracted with Trizol (Invitrogen, NY, USA). Quality of extracted RNA was confirmed by spectrophotometer and agarose gel electrophoresis. 28 and 18 s bands were visible, and samples had no obvious degradation. The samples were stored at -80 °C until use. First chain cDNA synthesis was performed using kit following manufacturer's instructions. PCR was done and primer sequences were as follows: ClC-2 forward sequence: 5'-AGA CAA TCC CTA CAC CCT TCA A-3', reverse sequence: 5'-TGT CGG TAG AACACC TTG TCA C-3'; TNF-α forward sequence: 5'-TGT GCC TCA GCC TCT TCT CAT-3', reverse sequence: 5'-ACC ACC AGT TGG TTG TCT TTG A-3'; iNOS forward sequence: 5'-TTG GAG CGAGTT GTG GAT TGT-3', reverse sequence: 5'-CGT TGT ACT CTG AGG GCT GAC A-3'; Olig2 forward sequence: 5'-GGA GGA GAT GAA GCG ACT GG-3', reverse sequence: 5'-GCA GAC GGA GAC TTG AGT AGG-3'; CNPase forward sequence: 5'-ATTTTGGCAAGAGACCTCCA-3', reverse sequence: 5'-AAAGAGGGCAGAGATGGACA-3'; β-actin forward sequence: 5'-GAG ACC TTC AAC ACC CCA GCC-3', reverse sequence: 5'-TCG GGG GATCGG AAC CGC TCA-3'. β-actin was used as a normalizing control.
Active Oxygen Concentration Detection
2', 7'-dichlorofluorescin diacetate (DCFH-DA) 1μL was added to 1 mL single cell suspensions, according to the reactive oxygen species (ROS) detection kit (Zhongshan, Beijing, China). The samples were incubated in the dark at 37 °C for 30 min. 1μL rosup positive control was added to stimulate cells, and readings were taken 25 min later at 525 nm excitation wavelength in the spectrophotometer.
Western Blot
Rats were decapitated and brain tissues were quickly removed from the skull. For total protein extracts, individual tissue samples were homogenized with ice-cold lysis buffer and protease inhibitors, and total protein quantified using Bradford assays; 100μg was loaded per well and standard SDS gel electrophoresis and Western blotting techniques used. Immunoblots were incubated with primary antibodies against ClC-2 (1:500, Sigma-Aldrich, Saint Louis, MO, USA), iNOS (1:500, Sigma-Aldrich, Saint Louis, MO, USA), CNPase (1:500, Sigma-Aldrich, Saint Louis, MO, USA), Akt (1:500, Sigma-Aldrich, Saint Louis, MO, USA), p-Akt (1:500, Sigma-Aldrich, Saint Louis, MO, USA) or cleaved caspase-3 [39](1:500,Santa Cruz, Dallas, TX, USA) at 4 °C overnight. Horseradish peroxidase-conjugated secondary antibodies (1:5000, Santa Cruz) were used and immunoblots incubated at 37 °C for 4 h, followed by chemiluminescence detection for visualization. Protein bands were detected by the enhanced chemiluminescence method (ECL kit, Amersham, Pittsburgh, PA, USA) for 5 min. The β-actin protein was used as an internal control.
TUNEL staining
TUNEL staining was performed using an In Situ Cell Death Detection Kit, POD (Promega, Madison, WI, USA) according to the manufacturer's instructions. After washing with PBS, sections were incubated with 3%H2O2 in methanol for10 min at room temperature to block endogenous peroxidases. Then, they were placed in permeabilization solution containing 0.1%Triton X-100in0.1% sodium citrate for 2 min on ice. The sections were then incubated with TUNEL reaction mixture for 60 min at 37℃ and incubated with peroxidase streptavidin conjugate for 30 min at 37℃. The slides were further visualized using a diaminobenzidine (DAB) kit (Zhongshan, China). A negative control was set up using the Label Solution instead of the TUNEL reaction mixture.
Immunohistochemistry and Immunofluorescent Staining
For single-antibody immunostaining, frozen sections were rinsed three times in PBS, permeabilized and blocked with 10% goat serum in 0.1% (w/v) Triton X-100/PBS for 1 h at room temperature (RT). Then, sections were immunostained overnight at 4 °C using an antibody against ClC-2 (1:500, Sigma-Aldrich, USA). The following day, the sections were rinsed three times in PBS and incubated with a biotinylated anti-rabbit secondary antibody (Zhongshan, Beijing, China) at 37 °C for 4 h and DAB chromagen kit (Zhongshan, Beijing, China) used for detection.
For double-antibody immunostaining, sections were incubated with 5% normal goat serum and then incubated with primary antibodies and Secondary antibodies overnight at 4 °C. Sections were incubated with a mixture of FITC- and TRITC-conjugated secondary antibodies (1:100, Abcam, Cambridge, MA, USA) at 37 °C for 4 h. Slides were counterstained with DAPI (1:800, Sigma-Aldrich, Saint Louis, MO, USA) after rinsing and being cover-slipped with fluorescence mounting medium (Dako, Copenhagen, Denmark). Tissues were visualized using an Olympus fluorescence microscope (Olympus, Tokyo, Japan), and digital images of sections acquired with a Charge-coupled Device camera.
Quantities Image Analysis
For Statistical analysis, at least nine representative fields were randomly acquired at 20× magnification from each of the two experiments performed in triplicate. Cell counting was conducted on nine randomly-chosen fields for each sample. Quantification of immunostaining and cell counting was performed using the Image Pro Plus software. The optical density of the bands of PCR products or Western blot results (normalized with those of β-actin) was also determined by Image Pro Plus image analysis system.
Statistical Analysis
Statistical analyses were performed using one- or two-way analysis of variance (ANOVA) followed by Tukey's post hoc test. Comparisons between two experimental groups were made using Student's t-test. A significant statistical difference was determined by a value of at least p<0.05.
Results
Excessive activation of ClC-2 and increasing expression of TNF-α and iNOS were induced by GDM
RT-PCR results showed that ClC-2 mRNA expression in the white matter was higher at E18 than P0, P3, and P7 (p<0.01). It suggests that ClC-2 maintained a high degree of expression in the late stage of embryonic development, and then decreased after birth. Moreover, in GDM group ClC-2 mRNA expression increased significantly in the white matter at E18, P0, and P3 (p<0.01). Although ClC-2 mRNA expression decreased at P7 in GDM group, it was still higher than that of the control group (p<0.05). DIDS significantly reduced ClC-2 mRNA expression at E18, P0, and P3 when compared with the GDM group (p<0.01), but was still higher than the control group (p<0.01). After P7 (from P7 to P28) there were no significant difference between control, GDM and GDM-DIDS group (p>0.05) (Figure 1 A, B).
(A) RT-PCR showed ClC-2 mRNA relative expression levels in cerebral white matter at different development stages; (B) Quantification for RT-PCR results showing ClC-2 relative OD between different groups and stages. The values represent the mean ± S.E.M. (n = 3). * p<0.05, ** p< 0.01; (C) RT-PCR showed TNF-α and iNOS mRNA relative expression changes in cerebral white matter in P0 and P3 stage; (D) Quantification for RT-PCR results for TNF-α and iNOS between CTL, GDM and GDM-DIDS group. The values represent the mean ± S.E.M. (n = 3). * p<0.05, ** p< 0.01.
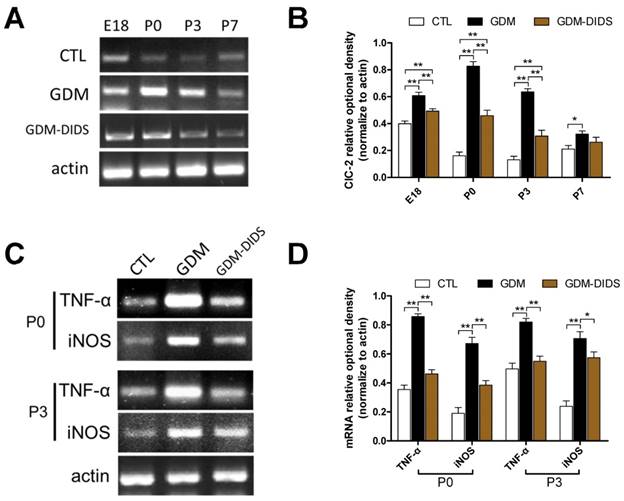
Further observation showed that in the white matter atP0 and P3, TNF-α and iNOS mRNA expressions were significantly elevated in GDM group than the control group (p<0.01). However, TNF-α and iNOS mRNA expressions in white matter regions at E18 and from P7 to P28 were not significantly different between the two groups (p>0.05). DIDS application significantly reduced the expression of TNF-α and iNOS mRNA at P0 and P3 stages (p<0.05) (Figure 1 C, D).
These results suggest that excessive activation of ClC-2 was induced by GDM and caused inflammatory effects.
ROS level was significantly increased in GDM, with differentiation of OLs and myelination being inhibited
The ROS level was maintained at a low level at E18, P0, P3, and P7 stages in normal rats. In the white matter region at E18, P0, and P3, the ROS level of the GDM group was significantly higher than control group (p<0.05). However, at P7 stage there was not significantly difference in ROS level between the two groups (p>0.05). Combined application of DIDS significantly reduced the ROS level in the white matter at E18, P0, and P3, when compared with GDM group (p<0.01). However, ROS level did not change significantly from P7 to P28 (p>0.05) (Figure 2 A).
(A) Quantification for ROS OD value. Data represents mean ± S.E.M. (n = 3). ** p< 0.01; (B) RT-PCR showed P0 stage Olig2 and P3 stage CNPase mRNA relative expression changes in cerebral white matter; (C) Quantification for RT-PCR. The values represent mean ± S.E.M. (n = 3). *p<0.05, ** p< 0.01; (D) Western blot for ClC-2, iNOS, CNPase in cerebral white matter in P3 stage; (E) Quantification for Western blot analysis. The values represent the mean ± S.E.M. (n = 3). *p<0.05, ** p< 0.01.
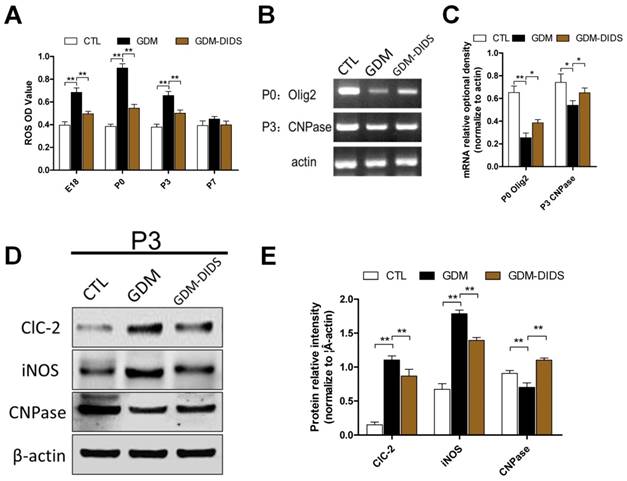
In early stage of myelination, transcription factor Olig2 expression level determines whether OPCs can differentiate into OLs. CNPase is a marker for immature OLs, therefore it can be used to reflect the degree of myelination. Olig2 mRNA expression at P0 and CNPase mRNA expression at P3 in white matter regions of the GDM group were both significantly lower than control group (p<0.01),(p<0.05). Combined application of DIDS could significantly increase the expression of Olig2 and CNPase mRNA when compared with GDM group (p<0.05) (Figure 2 B, C).
Expressions of inflammatory factors and myelin development-related factors in GDM rats were further confirmed by Western blot. The results showed that at P0 and P3 in white matter ClC-2 protein expression of the GDM group was significantly higher than control group (p<0.01). ClC-2 expression was reduced in GDM-DIDS group, which significantly lower than GDM group (p<0.01), but still higher than control group (p<0.01). In addition, iNOS expression of the GDM group at P0 and P3 in white matter was significantly higher than control group (p<0.01). Combined application of DIDS significantly reduced iNOS expression when compared with GDM group (p<0.01) but was still higher than control group (p<0.01). In contrast, Olig2 and CNPase protein levels at P0 and P3 of the GDM group were reduced and there was a significant difference between GDM group and control group (p<0.01); while DIDS could significantly increase the protein levels. There was a significant difference between GDM-DIDS and GDM groups (p<0.01) (Figure 2 D, E).
The results above suggest that ROS level was significantly increased in GDM and differentiation of OLs and myelination were inhibited, while DIDS reduced oxidative stress and inflammation caused by GDM. It reduced the damage to early development of OLs and promoted differentiation and maturation of OLs.
The number of TUNEL positive cells was increased in GDM, accompanied with decreased the number of PDGFα fluorescence positive cells in CC and CG regions
Immunohistochemistry staining showed that the ClC-2 positive signal in the CC and CG regions at E18, P0, and P3 stages in GDM group were increased, and the OD value of the positive signal was significantly higher than control group (p<0.01). Combined application of DIDS significantly reduced the OD value of ClC-2 positive signal, which was significantly different when compared with GDM group (p<0.01), but was still higher than control group (p<0.01). These findings showed that DIDS could partially reduce the overexpression of ClC-2 in the white matter induced in GDM (Figure 3 A above, B).
(A above) ClC-2 expression were identified by immunofluorescence staining in P0 stage in cerebral white matter, positive cells were stained brown; (B) Relative OD value of ClC-2 staining is depicted in the bar graphs. The values represent the mean ± S.E.M. (n = 3). ** p< 0.01; (A below) TUNEL staining in P0 stage in cerebral white matter, TUNEL positive cells, also called apoptosis cells, were stained brown; (C) Relative number of TUNEL positive cells is depicted in the bar graphs. The values represent the mean ± S.E.M. (n = 3). * p<0.05, ** p< 0.01; (D above) PDGFα expression were identified by immunofluorescence staining in P0 stage in cerebral white matter, PDGFα positive cells were stained red fluorescence, distributed in the cytoplasm. DAPI stained blue fluorescence showed the nucleus; (E) Percentage of PDGFα positive cells is depicted in the bar graphs. The values represent the mean ± S.E.M. (n = 3). * p<0.05; (D below) CNPase expression were identified by immunofluorescence staining in P3 stage in cerebral white matter, CNPase positive cells were stained green fluorescence, distributed in the cytoplasm and processes; (F) Relative quantification of CNPase relative optional density is depicted in the bar graphs. The values represent the mean ± S.E.M. (n = 3). * p<0.05, ** p< 0.01.
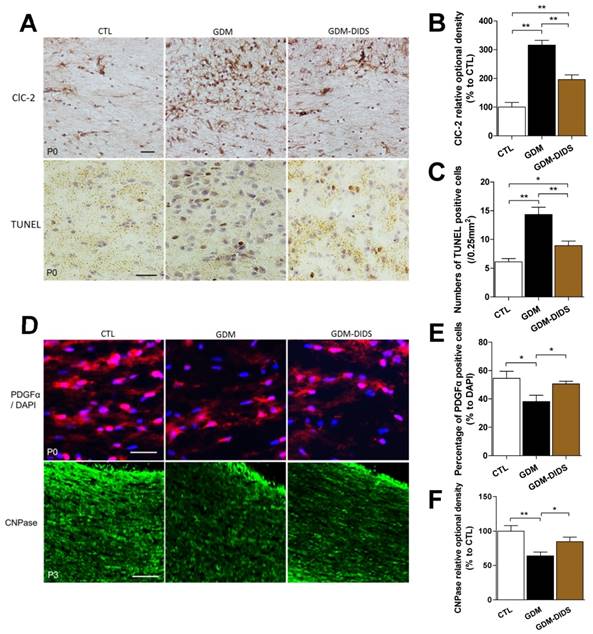
In order to confirm the apoptosis in GDM rats, TUNEL staining was used and found that the number of apoptotic cells in white matter at E18, P0, and P3 stages was significantly higher than control group (p<0.01). Although the number of apoptotic cells in white matter from P7 to P28 stage were slightly higher than control group, the difference was not statistically significant (p>0.05). Combined application of DIDS significantly reduced the number of apoptotic cells at E18, P0, and P3 stages (p<0.01), but the number was still higher than control group (p<0.05) (Figure 3 A below, C).
In order to clarify the types of the apoptotic cells, immunofluorescent staining was used to measure PDGFα, the OPCs/Pre-OLs marker, positive cell number in the early stage of development. Results showed that the number of cells with positive PDGFα fluorescence (the percentage to DAPI was 38.08±4.47) in CC and CG areas of white matter in P0 stage was significantly lower in the GDM group than control group (54.49±4.93) (p<0.05). Combined application of DIDS up-regulated the number PDGFα fluorescence positive cells (50.56±1.88), which was significantly different from the level in the GDM group (p<0.05) (Figure 3 D above, E).
Immunofluorescent staining was used to elucidate the effects of GDM on myelin development and maturation. The results showed that the CNPase positive fluorescence signal in the CC and CG regions of white matter at P3 stage was significantly lower in the GDM group than control group (p<0.01). Combined application of DIDS could significantly increase the CNPase expression as comparing with the GDM group (p<0.05) (Figure 3 D below, F).
These results suggest that apoptosis was accelerated in GDM in the CC and CG regions of cerebral white matter and the differentiation of OPCs to OLs and myelin mature were inhibited. DIDS reduced the apoptosis induced by GDM and promoted the differentiation and maturation of OLs.
Protein expression of caspase-3 in cerebral white matter was increased in GDM with p-Akt being inhibited
In order to elucidate the mechanisms of cell apoptosis in the white matter, western blot method was used to measure the caspase-3 expression level and the association with PI3K-Akt signaling pathway. The results showed that the caspase-3 expression level increased in the white matter at E18, P0, and P3 stages in the GDM group, which was significantly inhibited by the application of DIDS (p<0.05). The effects of DIDS was more pronounced at P0 stage (p<0.01), while the change of caspase-3 level in the white matter from P7 to P28 stage were not statistically significant (p>0.05) (Figure 4 A, B). Immunofluorescent double-staining was also used to measure PDGFα and caspase-3 in white matter. The result showed that percentage of caspase-3 positive cells in white matter was significantly higher than control group, especially at P0 stage (p<0.01). Combined application of DIDS significantly reduced the number of apoptotic cells (p<0.05), but the number was still higher than control group (p<0.01) (Figure S1).
(A) Western blot analysis showed caspase-3 protein expression changes in cerebral white matter in GDM group and DIDS group; (B) Relative quantification of Western blot analysis is depicted in the bar graphs. The values represent the mean ± S.E.M. (n = 3). * p<0.05, ** p< 0.01; (C) Western blot analysis showed p-Akt, Akt, caspase-3 protein expression changes in cerebral white matter in P0 stage; (D) Relative quantification of Western blot analysis is depicted in the bar graphs. Values represent mean ± S.E.M. (n = 3). * p<0.05, ** p< 0.01.
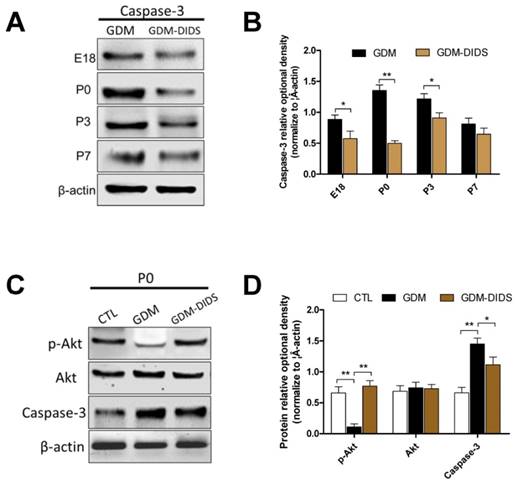
In addition to the increase of caspase-3 protein, the p-Akt protein expression decreased in the white matter at P0 stage in the GDM group, which was significantly different when compared with the control group (p<0.01). Combined application of DIDS could significantly increase the expression of p-Akt, and the difference with the GDM group was statistically significant (p<0.01). However, no significant change of Akt protein was found (p>0.05) (Figure 4 C, D).
These results indicated that DIDS could significantly increase p-Akt protein expression, OLs apoptosis induced by GDM may be induced by the activation of ClC-2 via caspase-3 and inhibiting PI3K-Akt pathway.
Discussion
ClC-2, a member of the voltage-gated chloride channel gene superfamily, transports Cl- and other anions into mammalian cells and is involved in various physiological processes. Recent studies have shown that in ischemia-hypoxia-induced white matter damage model over activation of ClC-2 cause apoptosis of OLs, while Cl- channel blockers can work against ClC-2 and protect the cells. Guo et al showed change expression of ClC was consistent with Cl- current change [40]. Thus, excessive activation of ClC-2 may be involved in cell damage. In vitro single cell recording result suggested that high glucose concentration causes excess opening of ClC-2 on cell membranes [22-25], therefore high glucose may induce activation of ClC-2. The findings of this study showed that the activation of ClC-2 was evidently induced by GDM in cerebral white matter at E18, P0 and P3 (p<0.01) and DIDS can significantly down-regulate the effect of ClC-2. Recent studies have reported that in early stage of cerebral ischemia and hypoxia, excessive activation of ClC-2 caused cerebral white matter damage [10], which also supported our findings.
High glucose is associated with oxidative stress and often leads to imbalance of antioxidant system [17, 41, 42]. Previous animal experiment shave proved that maternal diabetes caused oxidative stress in embryo by increasing intracellular ROS and undermining the endogenous antioxidant capacity [43]. Mitochondria are the main source of ROS. High ROS concentration can cause damage to mitochondria DNA and matrix enzymes in the metabolic pathway and ultimately initiates apoptosis [44, 45]. Although OLs have their own antioxidant system, they are still highly vulnerable to oxidative stress because the cells are rich in membrane lipids and intracellular iron and have few antioxidant enzymes [46, 47]. Our study showed that high glucose concentration significantly raised up cerebral white matter ROS level from E18 to P3, which induced intracellular oxidative stress and increased the release of inflammatory cytokines TNF -α and iNOS.
Excessive release of inflammatory factors (TNF-α et al.) caused by oxidative stress impairs OLs by increasing mitochondrial ROS levels [44]. Previous studies have reported that oxidative stress and proinflammatory cytokines are crucial for OLs apoptosis [48, 49]. Studies have shown that maternal diabetes increases the expression of inducible nitric oxide synthase (iNOS) [50], which can catalyze the reaction of superoxide and nitric oxide to produce reactive nitrogen species. Reactive nitrogen specie causes severe oxidative stress and nitrosative stress, which are responsible for cell damage [51, 52]. Our study found that combined application of DIDS can inhibit ROS level and the expression of inflammatory factors, indicating that oxidative stress and inflammation caused by GDM were closely related to the activity of ClC-2.
OLs are the CNS myelin-forming cells that have the critical function in supporting axons and sustaining their structural integrity and survival. It has been proved that last week of gestation and the first postnatal month are crucial periods for white matter maturation. Previous studies have reported that the most common types of CNS defects associated with GDM are NTDs [4, 51]. Studies in vitro also observed that the proliferation and differentiation of neural stem cells obviously suppressed cultures in high glucose medium [4, 53]. The findings of our study showed that in the late stage of pregnancy, in addition to ClC-2 activation, the increase of apoptotic cells in early stage white matter was also induced by GDM accompanied by PDGFα positive cells reduction (namely OPCs/Pre-OLs) and decreasing expression of transcription factor Olig2 initiated by OPCs/Pre-OLs differentiation in early stage (before P7), which affected the differentiation of OPCs/Pre-OLs. Meanwhile, the data still showed slight differences between different groups after P7 (from P7 to P28), but not statistically differences, indicating the indirect effects of GDM on baby rats' white matter gradually weakened with the growth and development of baby rats after birth. Using DIDS could reduce cell apoptosis in white matter, and promote the differentiation and differentiation of OLs, suggesting that the ClC-2 over-activation caused by GDM participated in the white matter injury, and affected the development and maturation of myelin.
PI3K-Akt signal pathway plays an important role in diverse cellular responses, including cell survival [30], proliferation [31, 32], differentiation [32] and apoptosis [33]. Studies in vitro and in vivo have demonstrated the importance of the Akt signal pathway in CNS myelination [26-29]. It has been shown that apoptosis can be reversed via PI3K/Akt mediated inhibition of caspase-3 activity [54-56]. In the study of high glucose-induced hippocampal neuronal apoptosis, inhibiting PI3K-Akt pathway phosphorylation increases apoptosis and causes neural degeneration [35, 36]. The findings of our study showed that the demyelination and increased expression of caspase-3 protein in the CC and CG regains of white matter at P0 stage in GDM group were associated with decreased expression of p-Akt protein, combined application of DIDS could reduce the number of apoptotic cells, increase the CNPase expression, decrease the expression of caspase-3, increase the expression of p-Akt protein, and improve the maturation of myelin. Similarly, the findings that myocardial cell damage was induced by ischemia/hypoxia suggested that DIDS could activate the PI3K-Akt pathway and thus inhibit the apoptosis of myocardial cells. Recent studies also showed that the activity of Akt was closely associated with the activities of voltage-gated chloride channels [57, 58], which supported our findings.
Overall, the results of the present study suggest that ClC-2 activation induced by GDM inhibits myelin development and cell apoptosis in white matter, which is associated with caspase-3 mediated PI3K-Akt pathway. In the early stage of white matter injury, effectively control the excessive activation of ClC-2 may play a significant protective effect. Therefore, these findings provide an important view into the molecular mechanism of GDM-induced white matter damage and demyelination of newborn rats.
Supplementary Material
Figure S1.
Acknowledgements
We thank our colleagues for critical advices in the preparation of this manuscript and for expert advice with cell culture. The research was supported in part by Grants from the National Natural Science Foundation of China (No. 31471148 by Hongli Li) and National Student's Platform for Innovation and Entrepreneurship Training Program of China (NO. 201490035027).
Author Contributions
Hongli Li and Feixiang He conceived and designed the experiments; Feixiang He, Yuchen Peng, Zilu Ge, Zhi Yang and Yanping Tian performed the experiments; Feixiang He and Teng Ma analyzed the data; Hongli Li, Feixiang He and Teng Ma wrote the manuscript.
Competing Interests
The authors have declared that no competing interest exists.
References
1. Gavin JRIII, Alberti KGMM, Davidson MB, DeFronzo RA. Report of the Expert Committee on the Diagnosis and Classification of Diabetes Mellitus. Diabetes care. 1997;20:1183-97
2. American Diabetes A. Diagnosis and classification of diabetes mellitus. Diabetes care. 2014;37(Suppl 1):S81-90
3. American Diabetes A. (2) Classification and diagnosis of diabetes. Diabetes care. 2015;38(Suppl):S8-S16
4. Sukanya S, Bay BH, Tay SS, Dheen ST. Frontiers in research on maternal diabetes-induced neural tube defects: Past, present and future. World journal of diabetes. 2012;3:196-200
5. Wu Y, Wang F, Reece EA, Yang P. Curcumin ameliorates high glucose-induced neural tube defects by suppressing cellular stress and apoptosis. American journal of obstetrics and gynecology. 2015;212:802 e1-8
6. Yaguchi M, Nagashima K, Izumi T, Okamoto K. Neuropathological study of C57BL/6Akita mouse, type 2 diabetic model: enhanced expression of alphaB-crystallin in oligodendrocytes. Neuropathology: official journal of the Japanese Society of Neuropathology. 2003;23:44-50
7. Miller RH. Regulation of oligodendrocyte development in the vertebrate CNS. Prog Neurobiol. 2002;67:451-67
8. Zuchero JB, Barres BA. Intrinsic and extrinsic control of oligodendrocyte development. Current opinion in neurobiology. 2013;23:914-20
9. Barateiro A, Brites D, Fernandes A. Oligodendrocyte Development and Myelination in Neurodevelopment: Molecular Mechanisms in Health and Disease. Current pharmaceutical design. 2015
10. Zhao B, Quan H, Ma T, Tian Y, Cai Q, Li H. 4,4'-Diisothiocyanostilbene-2,2'-disulfonic Acid (DIDS) Ameliorates Ischemia-Hypoxia-Induced White Matter Damage in Neonatal Rats through Inhibition of the Voltage-Gated Chloride Channel ClC-2. International journal of molecular sciences. 2015;16:10457-69
11. Ma T, Wu X, Cai Q, Wang Y, Xiao L, Tian Y. et al. Lead Poisoning Disturbs Oligodendrocytes Differentiation Involved in Decreased Expression of NCX3 Inducing Intracellular Calcium Overload. International journal of molecular sciences. 2015;16:19096-110
12. Do KQ, Cuenod M, Hensch TK. Targeting Oxidative Stress and Aberrant Critical Period Plasticity in the Developmental Trajectory to Schizophrenia. Schizophrenia bulletin. 2015;41:835-46
13. Back SA, Rosenberg PA. Pathophysiology of glia in perinatal white matter injury. Glia. 2014;62:1790-815
14. Greene DA, Stevens MJ, Obrosova I, Feldman EL. Glucose-induced oxidative stress and programmed cell death in diabetic neuropathy. European journal of pharmacology. 1999;375:217-23
15. Jain SK, Rains J, Jones K. Effect of curcumin on protein glycosylation, lipid peroxidation, and oxygen radical generation in human red blood cells exposed to high glucose levels. Free radical biology & medicine. 2006;41:92-6
16. Russell JW, Golovoy D, Vincent AM, Mahendru P, Olzmann JA, Mentzer A. et al. High glucose-induced oxidative stress and mitochondrial dysfunction in neurons. FASEB journal: official publication of the Federation of American Societies for Experimental Biology. 2002;16:1738-48
17. Yu J, Wu Y, Yang P. High glucose-induced oxidative stress represses sirtuin deacetylase expression and increases histone acetylation leading to neural tube defects. Journal of neurochemistry. 2016;137:371-83
18. Jentsch TJ, Stein V, Weinreich F, Zdebik AA. Molecular structure and physiological function of chloride channels. Physiological reviews. 2002;82:503-68
19. Jentsch TJ, Neagoe I, Scheel O. CLC chloride channels and transporters. Current opinion in neurobiology. 2005;15:319-25
20. Okada Y, Maeno E. Apoptosis, cell volume regulation and volume-regulatory chloride channels. Comparative biochemistry and physiology Part A, Molecular & integrative physiology. 2001;130:377-83
21. Malekova L, Tomaskova J, Novakova M, Stefanik P, Kopacek J, Lakatos B. et al. Inhibitory effect of DIDS, NPPB, and phloretin on intracellular chloride channels. Pflugers Archiv: European journal of physiology. 2007;455:349-57
22. Feng Y, Wang Q, Wang Y, Yard B, Lang F. SGK1-mediated fibronectin formation in diabetic nephropathy. Cell Physiol Biochem. 2005;16:237-44
23. Hills CE, Bland R, Bennett J, Ronco PM, Squires PE. High glucose up-regulates ENaC and SGK1 expression in HCD-cells. Cellular physiology and biochemistry: international journal of experimental cellular physiology, biochemistry, and pharmacology. 2006;18:337-46
24. Klaus F, Laufer J, Czarkowski K, Strutz-Seebohm N, Seebohm G, Lang F. PIKfyve-dependent regulation of the Cl- channel ClC-2. Biochemical and biophysical research communications. 2009;381:407-11
25. Palmada M, Dieter M, Boehmer C, Waldegger S, Lang F. Serum and glucocorticoid inducible kinases functionally regulate ClC-2 channels. Biochemical and biophysical research communications. 2004;321:1001-6
26. Flores AI, Narayanan SP, Morse EN, Shick HE, Yin X, Kidd G. et al. Constitutively active Akt induces enhanced myelination in the CNS. The Journal of neuroscience: the official journal of the Society for Neuroscience. 2008;28:7174-83
27. Flores AI, Mallon BS, Matsui T, Ogawa W, Rosenzweig A, Okamoto T. et al. Akt-mediated survival of oligodendrocytes induced by neuregulins. The Journal of neuroscience: the official journal of the Society for Neuroscience. 2000;20:7622-30
28. Rodriguez M. Effectors of demyelination and remyelination in the CNS: implications for multiple sclerosis. Brain Pathol. 2007;17:219-29
29. Gaesser JM, Fyffe-Maricich SL. Intracellular signaling pathway regulation of myelination and remyelination in the CNS. Experimental neurology. 2016
30. Dudek H, Datta SR, Franke TF, Birnbaum MJ, Yao R, Cooper GM. et al. Regulation of neuronal survival by the serine-threonine protein kinase Akt. Science. 1997;275:661-5
31. Le Belle JE, Orozco NM, Paucar AA, Saxe JP, Mottahedeh J, Pyle AD. et al. Proliferative neural stem cells have high endogenous ROS levels that regulate self-renewal and neurogenesis in a PI3K/Akt-dependant manner. Cell stem cell. 2011;8:59-71
32. Peltier J, O'Neill A, Schaffer DV. PI3K/Akt and CREB regulate adult neural hippocampal progenitor proliferation and differentiation. Developmental neurobiology. 2007;67:1348-61
33. Franke TF, Kaplan DR, Cantley LC. PI3K_ downstream AKTion blocks apoptosis. cell. 1997;88:435-7
34. Chen Y, Cao CP, Li CR, Wang W, Zhang D, Han LL. et al. Ghrelin Modulates Insulin Sensitivity and Tau Phosphorylation in High Glucose-Induced Hippocampal Neurons. Biological & pharmaceutical bulletin. 2010;33:1165-9
35. Yang RH, Lin J, Hou XH, Cao R, Yu F, Liu HQ. et al. Effect of docosahexaenoic acid on hippocampal neurons in high-glucose condition: involvement of PI3K/AKT/nuclear factor-kappaB-mediated inflammatory pathways. Neuroscience. 2014;274:218-28
36. Kobayashi T, Deak M, Morrice N, Cohen P. Characterization of the structure and regulation of two novel isoforms of serum- and glucocorticoid-induced protein kinase. The Biochemical journal. 1999;344(Pt 1):189-97
37. Liu J, Zhang D, Li Y, Chen W, Ruan Z, Deng L. et al. Discovery of bufadienolides as a novel class of ClC-3 chloride channel activators with antitumor activities. Journal of medicinal chemistry. 2013;56:5734-43
38. Junod A, Lambert AE, Stauffacher W, Renold AE. Diabetogenic action of streptozotocin: relationship of dose to metabolic response. The Journal of clinical investigation. 1969;48:2129-39
39. Manabat C, Han BH, Wendland M, Derugin N, Fox CK, Choi J. et al. Reperfusion differentially induces caspase-3 activation in ischemic core and penumbra after stroke in immature brain. Stroke; a journal of cerebral circulation. 2003;34:207-13
40. Guo R, Pan F, Tian Y, Li H, Li S, Cao C. Down-Regulation of ClC-3 Expression Reduces Epidermal Stem Cell Migration by Inhibiting Volume-Activated Chloride Currents. The Journal of membrane biology. 2016;249:281-92
41. Ye L, Wang F, Yang RH. Diabetes impairs learning performance and affects the mitochondrial function of hippocampal pyramidal neurons. Brain research. 2011;1411:57-64
42. Reece EA, Ma XD, Zhao Z, Wu YK, Dhanasekaran D. Aberrant patterns of cellular communication in diabetes-induced embryopathy in rats: II, apoptotic pathways. American journal of obstetrics and gynecology. 2005;192:967-72
43. Zhong J, Xu C, Gabbay-Benziv R, Lin X, Yang P. Superoxide dismutase 2 overexpression alleviates maternal diabetes-induced neural tube defects, restores mitochondrial function and suppresses cellular stress in diabetic embryopathy. Free radical biology & medicine. 2016;96:234-44
44. De Nuccio C, Bernardo A, Cruciani C, De Simone R, Visentin S, Minghetti L. Peroxisome proliferator activated receptor-gamma agonists protect oligodendrocyte progenitors against tumor necrosis factor-alpha-induced damage: Effects on mitochondrial functions and differentiation. Experimental neurology. 2015;271:506-14
45. Zamzami N, Marchetti P, Castedo M, Decaudin D, Macho A, Hirsch T. et al. Sequential reduction of mitochondrial transmembrane potential and generation of reactive oxygen species in early programmed cell death. The Journal of experimental medicine. 1995;182:367-77
46. Fern R, Moller T. Rapid ischemic cell death in immature oligodendrocytes: a fatal glutamate release feedback loop. The Journal of neuroscience: the official journal of the Society for Neuroscience. 2000;20:34-42
47. Flygt J, Gumucio A, Ingelsson M, Skoglund K, Holm J, Alafuzoff I. et al. Human Traumatic Brain Injury Results in Oligodendrocyte Death and Increases the Number of Oligodendrocyte Progenitor Cells. Journal of neuropathology and experimental neurology. 2016;75:503-15
48. Chiarini A, Armato U, Liu D, Dal Pra I. Calcium-Sensing Receptors of Human Neural Cells Play Crucial Roles in Alzheimer's Disease. Frontiers in physiology. 2016;7:134
49. Cai Z, Xiao M. Oligodendrocytes and Alzheimer's disease. The International journal of neuroscience. 2016;126:97-104
50. Yang P, Li H. Epigallocatechin-3-gallate ameliorates hyperglycemia-induced embryonic vasculopathy and malformation by inhibition of Foxo3a activation. American journal of obstetrics and gynecology. 2010;203:75 e1-6
51. Gabbay-Benziv R, Reece EA, Wang F, Yang P. Birth defects in pregestational diabetes: Defect range, glycemic threshold and pathogenesis. World journal of diabetes. 2015;6:481-8
52. Weng H, Li X, Reece EA, Yang P. SOD1 suppresses maternal hyperglycemia-increased iNOS expression and consequent nitrosative stress in diabetic embryopathy. American journal of obstetrics and gynecology. 2012;206:448 e1-7
53. Fu J, Tay SS, Ling EA, Dheen ST. High glucose alters the expression of genes involved in proliferation and cell-fate specification of embryonic neural stem cells. Diabetologia. 2006;49:1027-38
54. Tessier C, Prigent-Tessier A, Ferguson-Gottschall S, Gu Y, Gibori G. PRL antiapoptotic effect in the rat decidua involves the PI3K/protein kinase B-mediated inhibition of caspase-3 activity. Endocrinology. 2001;142:4086-94
55. Tang C, Lu YH, Xie JH, Wang F, Zou JN, Yang JS. et al. Downregulation of survivin and activation of caspase-3 through the PI3K/Akt pathway in ursolic acid-induced HepG2 cell apoptosis. Anti-cancer drugs. 2009;20:249-58
56. Xu YQ, Long L, Yan JQ, Wei L, Pan MQ, Gao HM. et al. Simvastatin induces neuroprotection in 6-OHDA-lesioned PC12 via the PI3K/AKT/caspase 3 pathway and anti-inflammatory responses. CNS neuroscience & therapeutics. 2013;19:170-7
57. Sun L, Dong Y, Zhao J, Yin Y, Zheng Y. The CLC-2 Chloride Channel Modulates ECM Synthesis, Differentiation, and Migration of Human Conjunctival Fibroblasts via the PI3K/Akt Signaling Pathway. International journal of molecular sciences. 2016:17
58. Su J, Xu Y, Zhou L, Yu HM, Kang JS, Liu N. et al. Suppression of chloride channel 3 expression facilitates sensitivity of human glioma U251 cells to cisplatin through concomitant inhibition of Akt and autophagy. Anatomical record. 2013;296:595-603
Author contact
![]() Corresponding author: Hongli Li, Department of Histology and Embryology, Third Military Medical University, Chongqing 400038, China. E-Mail: lihongliedu.cn; Tel. /Fax: +86-23-6875-2219.
Corresponding author: Hongli Li, Department of Histology and Embryology, Third Military Medical University, Chongqing 400038, China. E-Mail: lihongliedu.cn; Tel. /Fax: +86-23-6875-2219.