Impact Factor ISSN: 1449-2288
- Issue 11; 2026
- Issue 10; 2026
- Issue 9; 2026
- Issue 8; 2026
- Issue 7; 2026
- Volume 22; 2026
- Past Issues
- Advance Articles
- Editorial Board
- Cover Images
- Index & Coverage
- Cover Suggestion
- Special Issues
Introduction
Material and Methods
Results
Discussion
Conclusion
Abbreviations
Supplementary Material
Acknowledgements
References

 Global reach, higher impact
Int J Biol Sci 2017; 13(3):367-382. doi:10.7150/ijbs.17035 This issue Cite
Research Paper
Comparative Mitogenomic Analyses of Praying Mantises (Dictyoptera, Mantodea): Origin and Evolution of Unusual Intergenic Gaps
Hong-Li Zhang1*, Fei Ye2, 3, 4* ![]()
1. School of Life Sciences, Datong University, Datong 037009, China;
2. College of Ecology and Evolution, School of Life Sciences, Sun Yat-sen University, Guangzhou 510275, China;
3. State Key Laboratory of Biocontrol, Sun Yat-sen University, Guangzhou 510275, China;
4. College of Life Sciences, Shaanxi Normal University, Xi'an 710062, China.
* These authors contributed equally to this work.
Received 2016-7-30; Accepted 2016-11-20; Published 2017-2-25
Abstract

Praying mantises are a diverse group of predatory insects. Although some Mantodea mitogenomes have been reported, a comprehensive comparative and evolutionary genomic study is lacking for this group. In the present study, four new mitogenomes were sequenced, annotated, and compared to the previously published mitogenomes of other Mantodea species. Most Mantodea mitogenomes share a typical set of mitochondrial genes and a putative control region (CR). Additionally, and most intriguingly, another large non-coding region (LNC) was detected between trnM and ND2 in all six Paramantini mitogenomes examined. The main section in this common region of Paramantini may have initially originated from the corresponding control region for each species, whereas sequence differences between the LNCs and CRs and phylogenetic analyses indicate that LNC and CR are largely independently evolving. Namely, the LNC (the duplicated CR) may have subsequently degenerated during evolution. Furthermore, evidence suggests that special intergenic gaps have been introduced in some species through gene rearrangement and duplication. These gaps are actually the original abutting sequences of migrated or duplicated genes. Some gaps (G5 and G6) are homologous to the 5' and 3' surrounding regions of the duplicated gene in the original gene order, and another specific gap (G7) has tandem repeats. We analysed the phylogenetic relationships of fifteen Mantodea species using 37 concatenated mitochondrial genes and detected several synapomorphies unique to species in some clades.
Keywords: Mantodea, Mitochondrial genome, Control region (CR), Large non-coding region (LNC), Intergenic gap, Phylogeny.
Introduction
The Mantodea (praying mantis) contain more than 2,300 species with diverse morphologies and ecologies. These species occupy a diverse array of habitats, including tropical rainforests, temperate and arid forests and deserts, and employ different hunting strategies [1, 2]. Praying mantises have important applied value in pharmacy, agronomy, biological research and visualization, and most studies have primarily focused on their biological properties, such as taxonomy and distribution, captive breeding, and application as a foodstuff [3-5].
The mitochondrial genome (mitogenome), as a powerful molecular marker [6, 7], has recently been used in preliminary study of the phylogenetic relationships among species from Mantodea [8]. In addition to the application in phylogeny, the mitogenome can provide a number of genome-level and evolutionary features, e.g. different mitochondrial gene contents and orders in Mantodea [8]. A comprehensive and systematic study of mitogenome data, however, has not been explored for this group. When changes occur in gene content or gene order, a number of various intergenic gaps are introduced, which may hide the details of the change scenario. Thus, whether these special intergenic gaps are correlated with gene changes should be analysed and verified. Certain other specific regions in the Mantodea mitogenome also need further analysis, e.g., one large non-coding region (LNC) between trnM and ND2 has been reported in Tamolanica tamolana (Brancsik, 1897) and Hierodula formosana Giglio-Tos, 1912 [9, 10]. Two control regions (CRs) in the mitogenome have been reported in a few groups, including sea cucumbers, birds, snakes, fish, thrips, ticks, and tortoises [11-17]. The duplicated CR is extremely similar to the original CR in most cases, suggesting that both CRs are evolving in concert. However, both CRs in some species of birds and tortoises appear to be independently evolving [17, 18]. It is unknown if the specific LNC of some mantodean mitogenomes is another degenerated control region, and the evolutionary patterns of the LNC and CR are unclear.
In the present study, we described four new mitogenomes from Paramantini and conducted a comparative analysis on all available mitogenomes from fifteen species representing four families of Mantodea. These studies included comprehensive analyses on the features of protein-coding genes (PCGs), structural features in transfer RNAs (tRNAs) and ribosomal RNAs (rRNAs), structural elements in the control regions, and the phylogenetic relationships of these species based on 37 concatenated mitochondrial genes. Moreover, we examined the potential origin and evolutionary features of LNCs in Paramantini mitogenomes and the special intergenic gaps introduced by gene changes.
Material and Methods
Specimen sampling and DNA extraction
Adult specimens of Hierodula patellifera (Serville, 1839), Rhombodera brachynota (Wang & Dong, 1993), Rhombodera valida Burmeister, 1838 and Rhombodera sp. were collected from Shaanxi and Yunnan Province, China, and the voucher specimens for the four species were deposited in Shaanxi Normal University (Table S1). All collections were preserved in 95% ethanol and stored at -20°C for the preservation of nucleic acids. For each species, total genomic DNA was extracted from the leg muscle tissue using a TIANamp Micro DNA Kit (Tiangen Biotech, Beijing, China).
PCR amplification and sequencing of mitogenome
Four entire mitogenomes were amplified with overlapping PCR fragments using a series of universal primer sets [19] and species-specific primers designed according to the newly acquired sequence fragments (Table S2). The PCR reactions were essentially performed as previously described [8]. All purified PCR products were directly sequenced from both strands at the Beijing Genomics Institute (BGI) using the ABI 3730XL Genetic Analyser (PE Applied Biosystems) with a primer-walking strategy.
Mitogenome annotation and bioinformatics analyses
Raw sequences were assembled using Staden package 1.7.0 [20]. Most of the tRNAs from four species were identified using tRNAscan-SE 1.21 [21], which was also used to predict the secondary structure of tRNAs. The remaining tRNAs, 13 PCGs and two rRNAs were identified after alignment with the genes of other Mantodea species [8]. The secondary structures of the small ribosomal subunit (rrnS) and the large ribosomal subunit (rrnL) for R. brachynota were predicted according to the models for Drosophila virilis Sturtevant, 1916 and Drosophila melanogaster Meigen, 1830, respectively [22, 23]. The nucleotide composition and codon usage were analysed using Mega 5.0 [24]. DnaSP 5.1.0 [25] was used to calculate the rates of non-synonymous substitutions (Ka), the rates of synonymous substitutions (Ks), the codon bias index (CBI), the effective number of codons (ENC), the G+C content of all codons (G+C), and the G+C content of the third codon sites ((G+C)3). Tandem repeat (TDR) sequences in CRs and LNCs were identified using Tandem Repeat Finder 4.09 [26], and we predicted the potential secondary structures of the repeat unit using the Mfold 3.1.2 [27].
Phylogenetic analyses
All 37 mitochondrial genes were selected to analyse the phylogenetic relationship among fifteen Mantodea species (Table 1). Two termite species, Macrotermes natalensis (Haviland, 1898) (GenBank accession numbers: NC_025522) and Coptotermes lacteus (Froggatt, 1898) (GenBank accession numbers: NC_018125), were selected as outgroups. Each PCG was aligned based on amino acid sequence alignment using MEGA 5.0. Both rRNA and tRNA genes were aligned using Clustal X 1.83 [28]. The alignments of 37 genes were subsequently concatenated as a combined matrix (mtDNA) using Bioedit 7.0 [29]. The partitioning scheme (each codon site of PCGs; tRNA and rRNA genes) was employed for the dataset mtDNA. Furthermore, we reconstructed the phylogenetic relationship using two other datasets: the CCR, the relatively conserved region of the CR in each family; and the LNC_CR, LNCs from six Paramantini species and CRs from all Mantodea species. These two datasets (CCR and LNC_CR) were respectively aligned using Clustal X 1.83. The GTR+I+Γ was selected as the optimal model for all four partitions (mtDNA) and the other datasets (CCR and LNC_CR) according to the Akaike information criterion in MODELTEST v.3.7 [30] and MrModeltest 2.3 [31]. Bayesian inference (BI) analyses were performed using MrBayes 3.1.2 [32] with four MCMC chains running for five million generations. Each set was sampled every 1000 generations. The first 25% of steps were discarded as burn-in. Maximum Likelihood (ML) analyses were implemented in RAxML 7.0.3 [33], and the nodal support values among branches were assessed through bootstrap analysis with 1000 replicates.
List of Mantodea species included in the present study.
| Family | Species | Accession number | Reference |
|---|---|---|---|
| Hymenopodidae | Anaxarcha zhengi Ren & Wang, 1994 | KU201320 | [8] |
| Creobroter gemmatus (Stoll, 1813) | KU201319 | [8] | |
| Mantidae | Tenodera sinensis Saussure, 1871 | KU201318 | [8] |
| Tamolanica tamolana (Brancsik, 1897) | DQ241797 | [9] | |
| Hierodula formosana Giglio-Tos, 1912 | KR703238 | [10] | |
| Hierodula patellifera (Serville, 1839) | KX611803 | This study | |
| Rhombodera brachynota (Wang & Dong, 1993) | KX611802 | This study | |
| Rhombodera valida Burmeister, 1838 | KX611804 | This study | |
| Rhombodera sp. | KX619654 | This study | |
| Mantis religiosa Linnaeus, 1758 | KU201317 | [8] | |
| Statilia sp. | KU201316 | [8] | |
| Liturgusidae | Humbertiella nada Zhang, 1986 | KU201315 | [8] |
| Theopompa sp.-HN | KU201313 | [8] | |
| Theopompa sp.-YN | KU201314 | [8] | |
| Tarachodidae | Leptomantella albella (Burmeister, 1838) | KJ463364 | [34] |
Results
Mitogenome features of newly sequenced Mantodea species
The complete mitogenomes of R. brachynota, H. patellifera, R. valida and Rhombodera sp. were 16,616, 16,999, 16,308 and 15,910 bp in size, respectively (GenBank accession numbers: KX611802, KX611803, KX611804 and KX619654, respectively) (Table 2). The four mitogenomes contained a typical set of 37 mitochondrial genes (13 PCGs, 22 tRNAs, and two rRNAs) and retained identical gene order with most sequenced Mantodea mitogenomes [8]. In addition to the classic control region, the other large non-coding regions (LNCs) were detected between trnM and ND2. The four Mantodea mitogenomes were consistently biased towards A and T (~ 75.0%). Among the four major molecules (PCGs, rRNAs, tRNAs, and CR), the CR displayed the highest A+T content in three species, with R. valida as the exception, in which the CR intriguingly displayed the lowest A+T content (Table S3). All features of the nucleotide composition detected in these four mitogenomes were similar to those observed in other Mantodea species [8]. In the four newly sequenced mitogenomes, all PCGs were initiated with a canonical ATN codon (N represents any one of four nucleotides, A, T, C, G), with the exception of COI using TTG and CTG as initiation codons. The conventional TAA codon was used as a termination codon in most of the PCGs of these Mantodea mitogenomes, and the incomplete termination codons T and TA were also detected in two PCGs, COII and ND5, respectively (Table 2).
Annotation of the four praying mantis mitogenomes.
| Gene (region) | Coding Strand | Hierodula patellifera | Rhombodera brachynota | Rhombodera valida | Rhombodera sp. | ||||
|---|---|---|---|---|---|---|---|---|---|
| Position | Start/stop codon | Position | Start/stop codon | Position | Start/stop codon | Position | Start/stop codon | ||
| trnI | J | 1-66 | 1-66 | 1-66 | 1-66 | ||||
| trnQ | N | 76-144 | 72-140 | 71-139 | 71-139 | ||||
| trnM | J | 144-212 | 140-209 | 139-206 | 139-208 | ||||
| ND2 | J | 1754-2782 | ATG/TAA | 1381-2409 | ATG/TAA | 763-1791 | ATT/TAA | 669-1697 | ATG/TAA |
| trnW | J | 2781-2851 | 2408-2478 | 1791-1861 | 1696-1765 | ||||
| trnC | N | 2844-2908 | 2471-2534 | 1854-1917 | 1758-1821 | ||||
| trnY | N | 2909-2977 | 2535-2605 | 1918-1986 | 1822-1890 | ||||
| COI | J | 2982-4517 | TTG/TAA | 2610-4145 | CTG/TAA | 1993-3528 | TTG/TAA | 1896-3431 | CTG/TAA |
| trnLUUR | J | 4524-4591 | 4152-4219 | 3536-3603 | 3438-3504 | ||||
| COII | J | 4596-5280 | ATG/T | 4224-4908 | ATG/T | 3607-4291 | ATG/T | 3510-4194 | ATG/T |
| trnK | J | 5281-5352 | 4909-4980 | 4292-4363 | 4195-4266 | ||||
| trnD | J | 5354-5419 | 4983-5048 | 4367-4432 | 4269-4334 | ||||
| ATP8 | J | 5420-5578 | ATT/TAA | 5049-5207 | ATT/TAA | 4433-4591 | ATC/TAA | 4335-4493 | ATC/TAA |
| ATP6 | J | 5572-6252 | ATG/TAA | 5201-5881 | ATG/TAA | 4585-5265 | ATG/TAA | 4487-5167 | ATG/TAA |
| COIII | J | 6255-7043 | ATG/TAA | 5884-6672 | ATG/TAA | 5268-6056 | ATG/TAA | 5170-5958 | ATG/TAA |
| trnG | J | 7046-7110 | 6675-6739 | 6059-6124 | 5961-6025 | ||||
| ND3 | J | 7111-7464 | ATT/TAA | 6740-7093 | ATT/TAA | 6125-6478 | ATT/TAA | 6026-6379 | ATT/TAA |
| trnA | J | 7472-7536 | 7100-7164 | 6489-6554 | 6390-6454 | ||||
| trnR | J | 7541-7607 | 7169-7236 | 6559-6624 | 6459-6526 | ||||
| trnN | J | 7607-7671 | 7236-7300 | 6624-6689 | 6526-6591 | ||||
| trnSAGN | J | 7672-7738 | 7301-7367 | 6690-6756 | 6592-6658 | ||||
| trnE | J | 7740-7806 | 7369-7435 | 6758-6823 | 6660-6725 | ||||
| trnF | N | 7807-7871 | 7440-7504 | 6824-6890 | 6727-6791 | ||||
| ND5 | N | 7871-9591 | ATA/TA | 7504-9224 | ATA/TA | 6890-8613 | ATG/TA | 6791-8514 | ATG/TA |
| trnH | N | 9595-9658 | 9228-9291 | 8614-8677 | 8515-8578 | ||||
| ND4 | N | 9662-10999 | ATG/TAA | 9295-10632 | ATG/TAA | 8682-10019 | ATG/TAA | 8582-9919 | ATG/TAA |
| ND4L | N | 10993-11274 | ATG/TAA | 10626-10907 | ATG/TAA | 10013-10294 | ATG/TAA | 9913-10194 | ATG/TAA |
| trnT | J | 11281-11344 | 10912-10975 | 10299-10362 | 10199-10262 | ||||
| trnP | N | 11345-11407 | 10976-11038 | 10363-10425 | 10263-10326 | ||||
| ND6 | J | 11410-11913 | ATT/TAA | 11041-11544 | ATT/TAA | 10428-10931 | ATT/TAA | 10329-10832 | ATT/TAA |
| CytB | J | 11913-13049 | ATG/TAA | 11544-12680 | ATG/TAA | 10931-12067 | ATG/TAA | 10832-11968 | ATG/TAA |
| trnSUCN | J | 13049-13118 | 12681-12750 | 12067-12136 | 11969-12038 | ||||
| ND1 | N | 13143-14078 | ATG/TAA | 12769-13704 | ATG/TAA | 12164-13099 | ATG/TAA | 12058-12993 | ATG/TAG |
| trnLCUN | N | 14080-14147 | 13706-13773 | 13101-13168 | 12995-13062 | ||||
| rrnL | N | 14148-15462 | 13774-15087 | 13169-14485 | 13063-14377 | ||||
| trnV | N | 15463-15532 | 15088-15157 | 14486-14555 | 14378-14447 | ||||
| rrnS | N | 15533-16326 | 15158-15947 | 14556-15349 | 14448-15238 | ||||
| CR | — | 16327-16999 | 15948-16616 | 15350-16308 | 15239-15910 | ||||
J: the majority strand; N: the minority strand; CR: control region.
Comparative mitogenomic analyses of the fifteen Mantodea species
Protein-coding genes
Comparative analyses revealed the consistent characteristics and evolutionary patterns of 13 PCGs for praying mantis mitogenomes. All PCGs were AT biased in all fifteen Mantodea species. The PCGs encoded by the majority strand (PCGs-J) and the minority strand (PCGs-N) displayed moderate C-skews and marked G-skews (>0.200), respectively, and both strands displayed T-skews (Table S3). The low ω value (Ka/Ks<0.3) for each PCG revealed that all PCGs might have evolved under strong purifying selection. In addition, the highest ω value was observed for ATP8, implying that ATP8 evolved at a fast rate (Fig. S1).
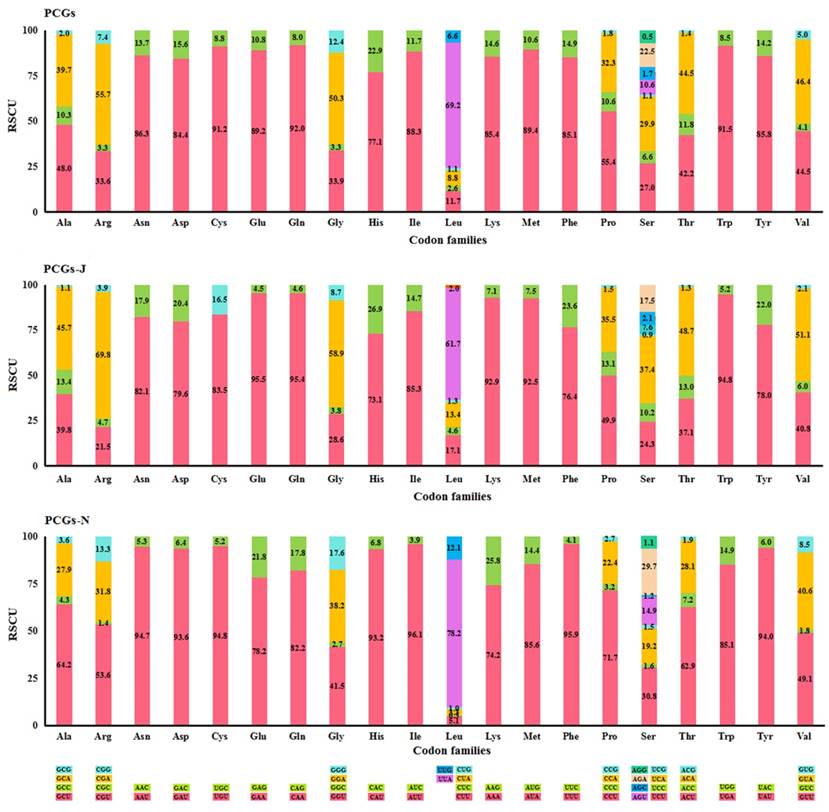
The most frequently used codon was NNU (45.0%) in all PCGs and PCGs-N, while NNA (44.0%) was the most abundant in PCGs-J (Table S4). The codons ending with A/U were favoured for both the four-fold and two-fold degenerate codons (Fig. 1). Four AT-rich codons, UUU (Phe), UUA (Leu), AUU (Ile), and AUA (Met) were the most prevalent codons in all fifteen Mantodea mitogenomes, with values ranging from 26.6% in Humbertiella nada Zhang, 1986 to 37.2% in Anaxarcha zhengi Ren & Wang, 1994 (Table S5). The usage proportion of the four AT-rich codons was positively correlated with the A+T content of PCGs (R2 = 0.973) in the fifteen Mantodea species (Fig. S2). Furthermore, the codon usage bias was associated with the G+C content of PCGs. ENC was positively correlated with G+C (R2 = 0.979) and (G+C)3 (R2 = 0.994), and conversely, CBI was negatively correlated with both G+C and (G+C)3 and also with ENC (R2 = 0.988) (Fig. S3).
Percentage of synonymous codon usage of each amino acid in the fifteen Mantodea mitogenomes. PCGs-J: PCGs encoded by the majority strand. PCGs-N: PCGs encoded by the minority strand.
Transfer RNAs
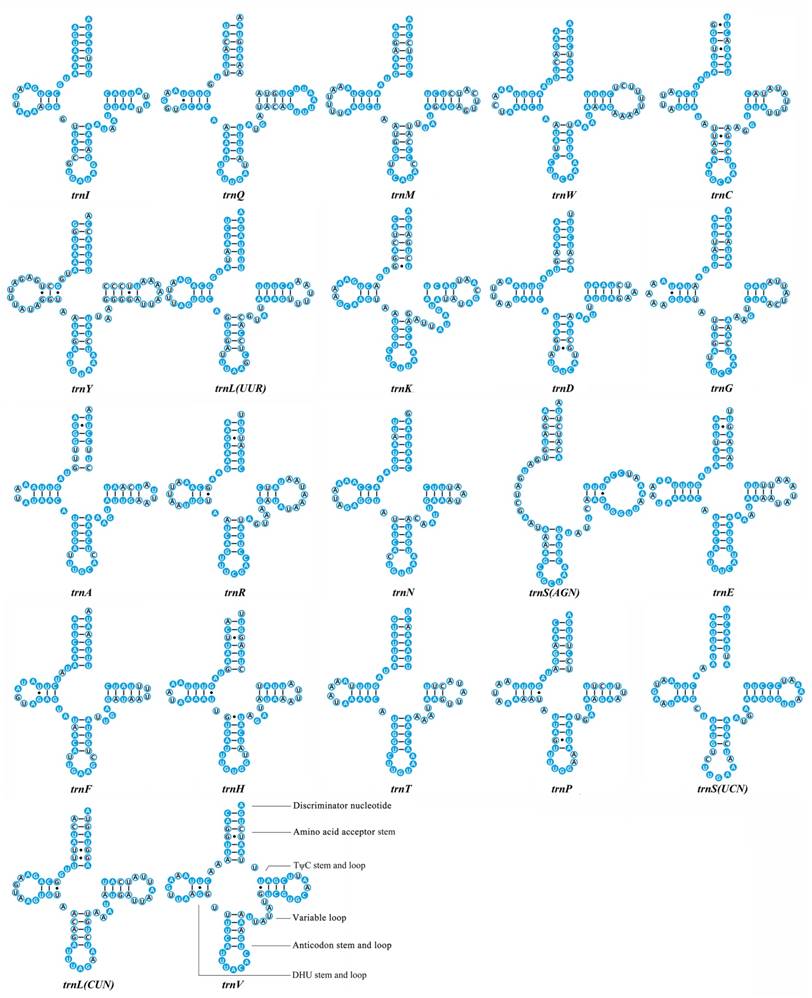
We calculated the percentage of identical nucleotides (%INUC) for each tRNA family of the fifteen Mantodea mitogenomes. Two tRNAs (trnY and trnLCUN), located on the minority strand, displayed low levels of conservation (%INUC< 50.0%). Five tRNAs (trnI, trnA, trnN, trnF and trnSUCN) showed high levels of conservation (%INUC>75.0%), and the majority strand encoded four of these tRNAs (Table S6). Thus, the conservation pattern of tRNA genes was distinct in the two coding strands. Additional analyses of the conservation of stems and loops in the secondary structure of tRNAs revealed that nucleotides in the amino acid acceptor stem (AA stem), the dihydrouridine stem (DHU stem) and the anticodon stem (AC stem) are relatively conserved (>70.0%). Among the four loops, only the anticodon loop exhibited high sequence similarity (87.0%) (Fig. 2 & Table S6).
Inferred secondary structures of 22 transfer RNAs (tRNAs) identified in Rhombodera brachynota. Conserved sites within the fifteen Mantodea species are indicated as white nucleotides within blue spheres. Variable sites are indicated as black nucleotides within blue circles. Bars: Watson-Crick base pairings. Dots: GU base pairings.
Ribosomal RNAs
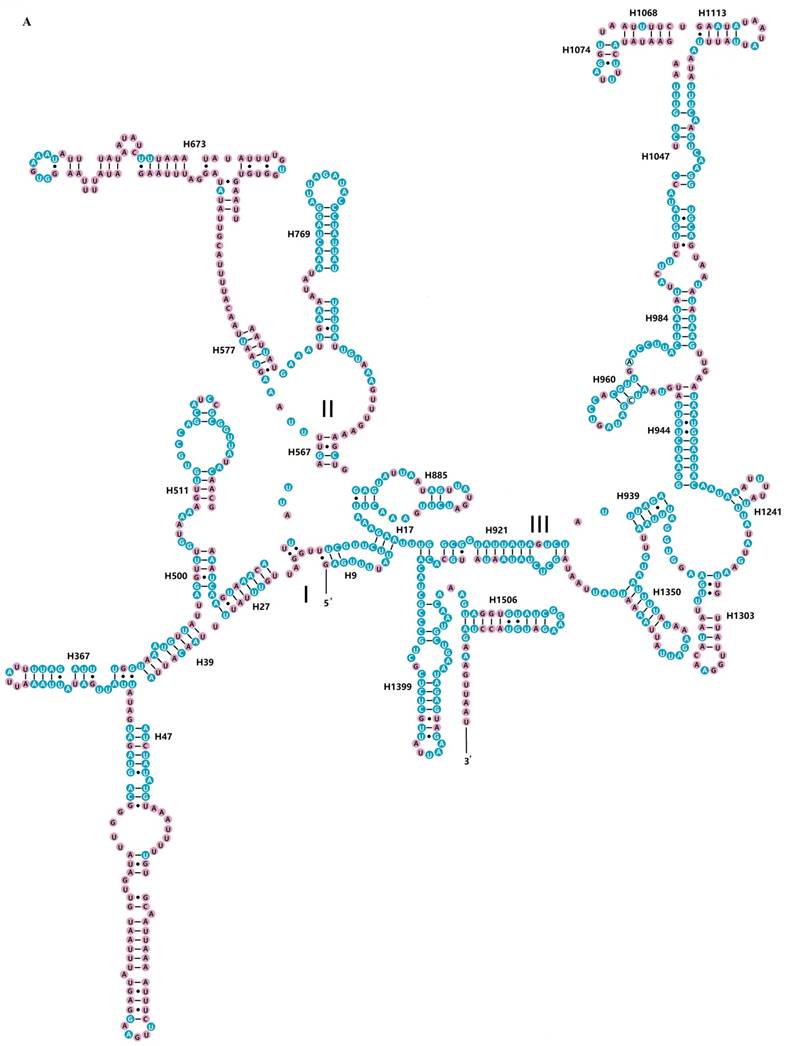
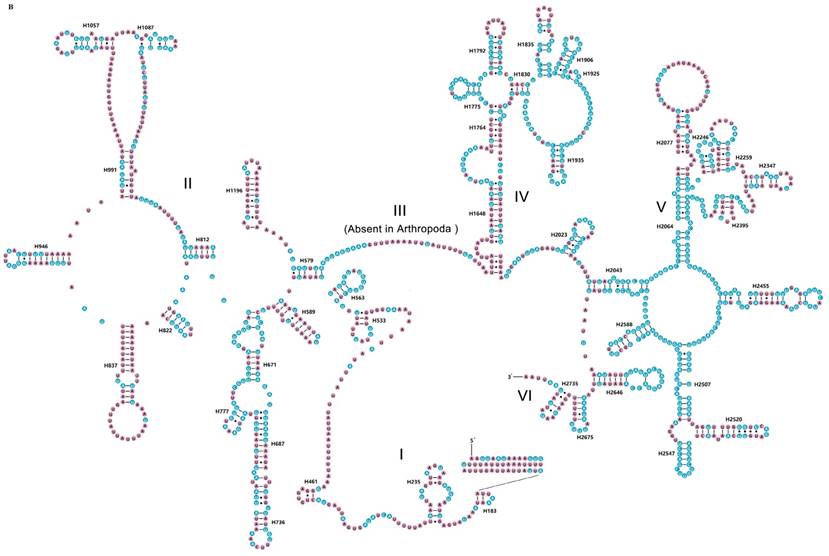
The rrnS of R. brachynota comprised three structural domains (I-III) (Fig. 3A). The conserved sites were marked and analysed within the fifteen Mantodea species. In the eight helices of domain I (H9-H511), H47 was the most unstable. Domain II, containing five helices (H567-H885), was the most highly variable domain, particularly for helices H567, H577 and H673. In domain III, most helices were relatively conserved, except for H1068-H1113 and H1303 (Table S7). The rrnL of R. brachynota harboured five canonical structural domains (I-II, IV-VI) (Fig. 3B). The conserved sites in rrnL of the fifteen Mantodea species were also analysed. Five helices were observed in Domain I, which were difficult to align. Nonetheless, H563 was correspondingly stable (75.0%). Domain II comprised 14 helices (H579-H1196), and the conservation level was high in H671, H777, and H1087 (>75.0%) (Table S7). All helices in Domains IV and V were relatively conserved, except for helices H1648, H1764, H2077, H2259, H2395, and H2520 (<40.0%) (Table S7). Furthermore, eight couplets were observed in H1792, but not as frequently as the five couplets observed in most insects [35]. Although nucleotides in the variable helices were highly divergent at the family and even subfamily levels, most of these molecules are compensatory base changes and shared some similar secondary structures among the species. In Domain VI, all three helices were changeable.
Inferred secondary structures of two ribosomal RNAs in Rhombodera brachynota. (A) rrnS. (B) rrnL. Conserved sites within fifteen Mantodea species are indicated as white nucleotides within blue spheres. Variable sites are indicated as black nucleotides within pink spheres. Bars: Watson-Crick base pairings. Dots: GU base pairings.
Control region
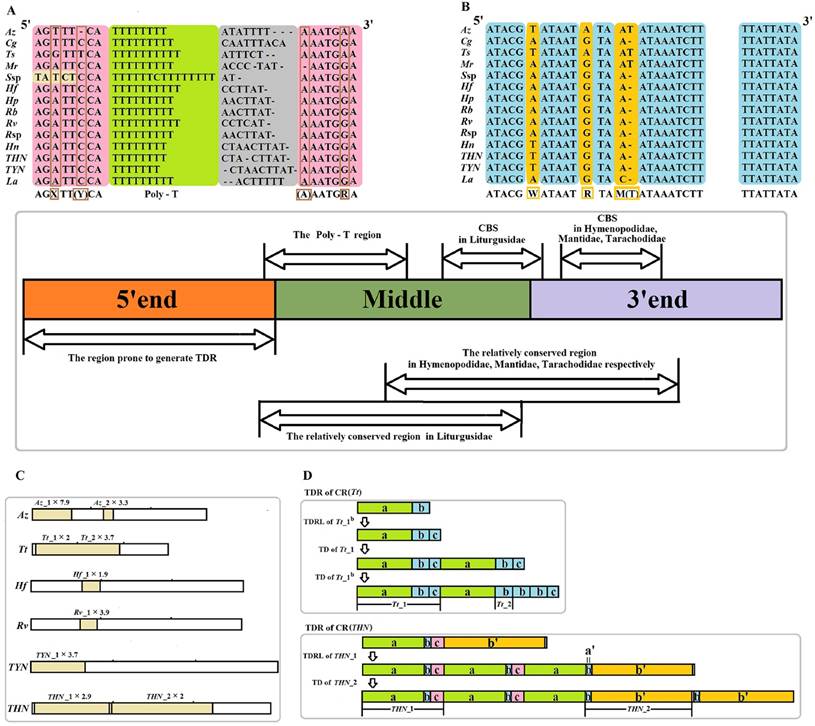
The CR is located in the conserved position at the downstream of rrnS for all sequenced Mantodea mitogenomes. The length is relatively variable in this region, ranging from 639 bp in Mantis religiosa Linnaeus, 1758 to 1,775 bp in Theopompa sp.-HN, with most of the size variation being attributed to the presence of TDRs (Table S8). The alignment of the CRs from these Mantodea mitogenomes (removing redundant TDRs) did not reveal the typical conserved element information of the insect control region. Nevertheless, excluding T. tamolana, two conserved block sequences (CBS1: ATACGWATAATRTAM(T)ATAAATCTT and CBS2: TTATTATA) and one Poly-T (>7 bp) were observed in the other fourteen Mantodea mitogenomes (the Poly-T was separated by one C in Statilia sp.) (Fig. 4A, 4B & Table S8). In addition, the flanking regions of this Poly-T were relatively conserved. The consensus motif “AGXTT(Y/-)CA” was observed at the 5' end, except for Statilia sp., and one succeeding “(A/-)AATGRA” motif was present at the 3' end of this Poly-T (Fig. 4A). Moreover, the CRs of species from the same family were aligned (without the single representative species of Tarachodidae), and one relatively conserved region of CR (CCR) was observed in three families. The size and sequence similarity of this region were different in the three families: 205 bp (78.5%) in Hymenopodidae, 257 bp (82.5%) in Liturgusidae, and 237 bp (58.2%) in Mantidae, except for T. tamolana. Further alignment of the CRs of species from the same tribe showed that the CCR had increased in size (~ 300 bp), and the identity of this region was also increased (>75.0%) (Table 3). With the brief partitioning scheme of CR without redundant TDRs: three equal sections (5' end, middle, 3' end), CCRs in the Hymenopodidae and Mantidae were located at the latter half of the middle and the first half of the 3' end in CRs, while CCRs in Liturgusidae were focused on the middle section of CRs (Fig. 4 & Table 3). Despite the alignment of the CCRs from three families, there remained only two CBSs. The corresponding conserved regions for the single representative species of Tarachodidae, Leptomantella albella (Burmeister, 1838), were also detected after alignment with CRs from three Liturgusidae species.
Organization of the control region (CR) in fifteen Mantodea mitogenomes. Redundant TDRs was removed in the partitioning of CR. (A) Poly-T region in the majority strand. Poly-T structure is indicated with a light green background; the flanking regions of poly-T in the majority strand are indicated with a pink background; the variable site in the flanking region is indicated with a brown frame. (B) Two conserved block sequences (CBS1 and CBS2) in the majority strand. Conserved sites in the CBSs are indicated with a blue background, and the variable site in the CBSs is indicated with an orange background. (C) Tandem repeats (TDRs) of CRs in six Mantodea species. (D) The possible repeat mechanism of TDRs in CR (Tt) and CR (THN). TDRL: tandem duplication-random loss. TD: tandem duplication. Az: Anaxarcha zhengi. Cg: Creobroter gemmatus. Ts:Tenodera sinensis. Tt: Tamolanica tamolana. Hf: Hierodula formosana. Hp: Hierodula patellifera. Rb: Rhombodera brachynota. Rv: Rhombodera valida. Rsp: Rhombodera sp. Mr: Mantis religiosa. Ssp: Statilia sp. Hn: Humbertiella nada. THN: Theopompa sp.-HN. TYN: Theopompa sp.-YN. La: Leptomantella albella.
The position and conservation rate of the relatively conserved region of control region (CCR) in each family and tribe.
| Family/Tribe | Speices | Position* of conserved region | Alignment size (bp) | Conserved site (nt) | Conservation rate (%) |
|---|---|---|---|---|---|
| Hymenopodidae | Anaxarcha zhengi | 330-534 | 205 | 161 | 78.5 |
| Creobroter gemmatus | 391-592 | ||||
| Mantidae | Tenodera sinensis | 365-594 | 237 | 138 | 58.2 |
| Tamolanica tamolana | - | ||||
| Hierodula formosana | 453-680 | ||||
| Hierodula patellifera | 340-566 | ||||
| Rhombodera brachynota | 345-570 | ||||
| Rhombodera valida | 436-665 | ||||
| Rhombodera sp. | 336-563 | ||||
| Mantis religiosa | 303-531 | ||||
| Statilia sp. | 311-541 | ||||
| Liturgusidae | Humbertiella nada | 268-563 | 257 | 212 | 82.5 |
| Theopompa sp.-HN | 307-602 | ||||
| Theopompa sp.-YN | 300-592 | ||||
| Tarachodidae | Leptomantella albella | 255-556 | |||
| Paramantini (Mantidae) | Hierodula formosana | 389-681 | 298 | 234 | 78.5 |
| Hierodula patellifera | 275-567 | ||||
| Rhombodera brachynota | 279-571 | ||||
| Rhombodera valida | 371-666 | ||||
| Rhombodera sp. | 272-564 | ||||
| Mantini (Mantidae) | Mantis religiosa | 205-535 | 342 | 263 | 76.9 |
| Statilia sp. | 206-545 |
Position*: position in CR without redundant TDRs.
In the CRs of fifteen Mantodea species, TDRs were only observed in six species, displaying variable sized repeat units, spanning from 40 bp in Az_2 to 396 bp in THN_2. Although TDRs primarily occurred at the 5' end, TDRs were also detected in the middle section of CRs in three species (Fig. 4C & Table 4). Most TDRs repeated less than three times, but the repetitive unit of Az_1 repeated seven times. The occurrence of TDRs was not correlated with the nucleotide composition of the repetitive unit, including the A+T content, AT-skew and GC-skew. Repeat units from the same TDRs in CRs displayed extremely high sequence homology (>95.0%) (Table 4), which may indicate that the rate of copy turnover is higher relative to the rate of nucleotide substitution because the homogenization or divergence between repeats primarily depends on the rate of copy addition and deletion (copy turnover) relative to the nucleotide mutation rate [36]. Furthermore, all repetitive unit sequences could be folded into the secondary structure with two or more stem-loops (Fig. S4). These repeat units could form stable secondary structures during strand slippage, which may facilitate the generation of tandem repeats [37], and these structures may promote replication slippage through the inhibition of the polymerase or stabilization of the slipped strand [38].
Statistics of TDRs in the CRs and LNCs of Mantodea mitogenomes.
| Region (Species abbreviation) | Size | TDRs | Positions | Consensus size (bp) | Copy number | Percent Matches (%) | AT% | AT-skew | GC-skew | Number of Hairpin | Average ΔG |
|---|---|---|---|---|---|---|---|---|---|---|---|
| CR(Az) | 1761 | Az_1 | 1-1181 | 149 | 7.9 | 100 | 75.8 | 0.080 | 0.072 | 4 | 18.3 |
| Az_2 | 1290-1419 | 40 | 3.3 | 100 | 95.0 | -0.053 | 0 | 2 | 1.8 | ||
| CR(Tt) | 954 | Tt_1 | 15-622 | 305 | 2 | 98.0 | 74.4 | 0.075 | 0.080 | 9 | 26.6 |
| Tt_2 | 521-750 | 63 | 3.7 | 98.0 | 63.5 | -0.150 | 0.025 | 2 | 5.7 | ||
| CR(TYN) | 1436 | TYN_1 | 1-732 | 200 | 3.7 | 100 | 66.5 | -0.023 | 0.221 | 6 | 7.9 |
| CR(THN) | 1775 | THN_1 | 9-785 | 271 | 2.9 | 99.0 | 64.9 | -0.114 | -0.017 | 9 | 22.6 |
| THN_2 | 776-1561 | 396 | 2 | 100 | 76.8 | -0.105 | 0.073 | 8 | 45.8 | ||
| CR(Hf) | 840 | Hf_1 | 192-317 | 65 | 1.9 | 100 | 56.9 | 0.189 | -0.055 | 2 | 7.8 |
| CR(Rv) | 959 | Rv_1 | 180-435 | 65 | 3.9 | 100 | 55.4 | 0.278 | 0.085 | 2 | 8.8 |
| LNC(Hf) | 625 | LNC(Hf)_1 | 6-463 | 199 | 2.3 | 99.0 | 71.4 | -0.056 | 0.021 | 6 | 19.2 |
| LNC(Hp) | 1541 | LNC(Hp)_1 | 20-1371 | 180 | 7.5 | 100 | 68.9 | -0.048 | 0.065 | 5 | 25.4 |
| LNC(Rb) | 1171 | LNC(Rb)_1 | 17-1021 | 183 | 5.5 | 100 | 59.0 | -0.019 | 0.028 | 7 | 20.8 |
| LNC(Rv) | 556 | LNC(Rv)_1 | 20-262 | 65 | 3.7 | 100 | 69.4 | -0.017 | 0.062 | 2 | 8.5 |
CR: control region; LNC: Large non-coding region between trnM and ND2; TDR: tandem repeat; ΔG: Gibbs free energy; Az: Anaxarcha zhengi; Tt: Tamolanica tamolana; THN: Theopompa sp.-HN; TYN: Theopompa sp.-YN; Hf: Hierodula formosana; Hp: Hierodula patellifera; Rb: Rhombodera brachynota; Rv: Rhombodera valida.
Furthermore, some TDRs shared an overlapping region, e.g., Tt_2 overlaps 102 nucleotides with Tt_1 (Fig. 4D & Table 4). Comparisons of these two repetitive units demonstrated that the Tt_2 unit is a small part of the Tt_1 unit (namely Tt_1b), and the Tt_1 unit could be divided into three parts (Tt_1a, Tt_1b and Tt_1c), among which Tt_1c is one section of Tt_1b. The potential repeat process for this region may require three steps: 1) the original sequence comprising Tt_1a and Tt_1b. Firstly, Tt_1b tandemly repeats during the slippage-strand mispairing of mtDNA replication, where only 41 bp (Tt_1c) is reserved in the repeated sequence; 2) secondly, the Tt_1 unit tandemly repeats one time; and 3) third, the Tt_1b in the duplicated Tt_1 unit is copied two more times. Additionally, in Theopompa sp.-HN CR, THN_2 overlaps ten nucleotides with THN_1 (Fig. 4D & Table 4). In reality, the THN_1 unit could be divided into three parts, THN_1a, THN_1b and THN_1c; and the THN_2 unit is actually 390 bp in size and could be divided into two parts, THN_2a' and THN_2b'. Among these subunits, THN_2a' is exactly the same as THN_1b, therefore the tandem repeat in this region could be elucidated using the following process: 1) the THN_1 unit is successively repeated twice, whereas THN_1c is lost in the second repetitive process; 2) the second repeated THN_1b and THN_2b' compose the repetitive unit of THN_2. THN_2 is repeated once, but a gap (6 bp in size) exists between the two same repeat units.
Other non-coding regions
Apart from the typical control region, another large non-coding region (LNC) was also observed in all six Paramantini species. LNCs were located between trnM and ND2, with variable lengths ranging from 296 bp in T. tamolana to 1,541 bp in H. patellifera. TDRs can also be detected in LNCs from four species of Paramantini (Table 4).
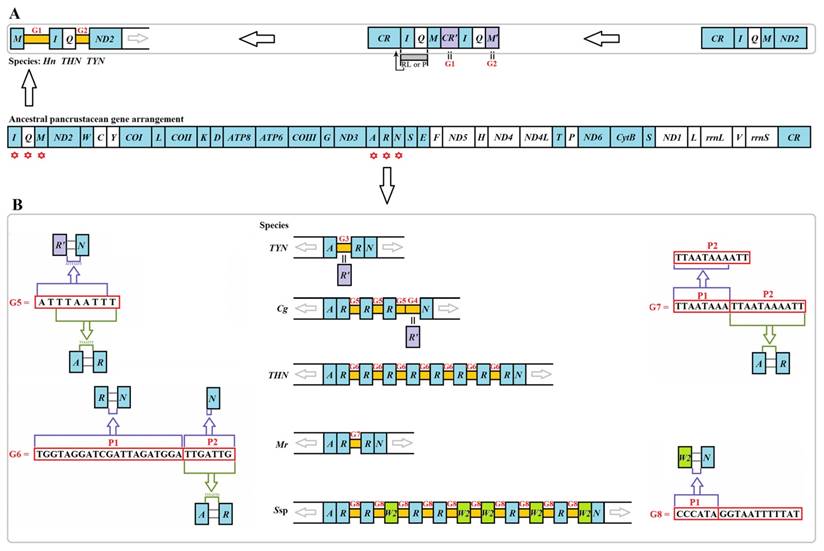
Two unusual gaps were present between trnM and trnI (G1) and between trnQ and ND2 (G2) in three Liturgusidae species (except for the undetermined junction of trnM-trnI in Theopompa sp.-HN) (Fig. 5A). Although the gene content has not changed in Theopompa sp.-YN, a 69-bp gap (G3) was detected between trnA and trnR in this species and appeared as the pseudogene trnR [8]. In addition, a 68-bp gap (G4) was detected between trnR and trnN in Creobroter gemmatus (Stoll, 1813), which could be the remnant of trnR [8]. Tandem duplications of trnR were primarily present in four species, C. gemmatus, M. religiosa, Statilia sp., and Theopompa sp.-HN. The gap sequence between duplicated trnRs was “ATTTAATTT” (G5) in C. gemmatus. Within G5, “TTAATTT” is exactly identical to the fragment comprising the extremital three nucleotides (TTA) in trnA and the junction between trnA and trnR (ATTT). In addition, the main body of G5 also comprised the extremital two nucleotides of the junction between trnR' and trnN (AT) and the six nucleotides of the 5' end in trnN (TTAATT) (Fig. 5B). A 28-bp gap (G6) was observed between duplicated trnRs in Theopompa sp.-HN. This gap encompassed two parts (P1 and P2). P1 was the same as the junction sequence between trnR and trnN, and P2 was not only consistent with the beginning sequence of trnN but was also identical to the fragment comprising the extremital three nucleotides (TTG) in trnA and the junction sequence (ATTG) between trnA and trnR (Fig. 5B). A 19-bp gap (G7) was observed between duplicated trnRs in M. religiosa. A 17-bp gap (G8) was detected between duplicated trnR/W2 in Statilia sp., and the front six nucleotides (P1) in G8 were consistent with the gap sequence between trnW2 and trnN (Fig. 5B).
Intergenic gaps introduced by gene rearrangement and duplication. The gene and genome sizes are not to scale. The minority strand encodes all genes with white blocks, and the majority strand encodes all genes with blue blocks. (A) G1 and G2 introduced by gene rearrangement in three Liturgusidae mitogenomes. RL: random loss. P: pseudogenization (B) G3-G8 introduced by gene duplication in Mantodea mitogenomes. Hn: Humbertiella nada. THN: Theopompa sp.-HN. TYN: Theopompa sp.-YN. Cg: Creobroter gemmatus. Mr: Mantis religiosa. Ssp: Statilia sp.
Phylogenetic implications on Mantodea
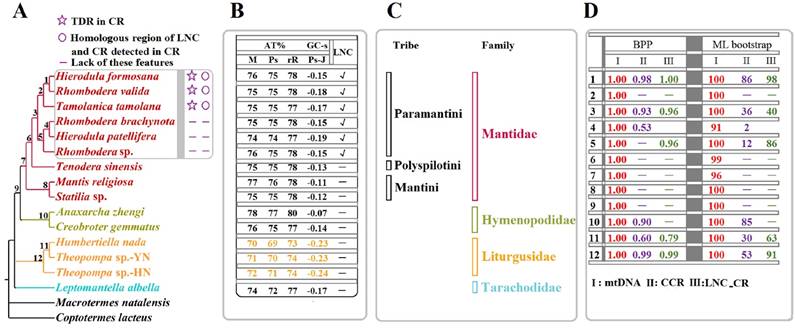
Considering the phylogenetic results [8] and partitioning strategy [39-41] of previous studies, the phylogenetic analyses in the present study were performed on the partitioned dataset mtDNA of fifteen Mantodea species using two inference methods (Fig. 6A & Fig. S5). The phylogenies deduced using ML and BI showed almost identical topologies with high support values in most branches. Only L. albella representing Tarachodidae clustered with the three species of Liturgusidae in mtDNA-ML topology but with low support value (Fig. S5).
Phylogenetic relationship among the fifteen Mantodea species. (A) Phylogeny constructed using BI analyses based on mtDNA. TDR: tandem repeat. CR: control region. LNC: Large non-coding region between trnM and ND2. (B) The A + T content (AT%) and GC - skew (GC-s) of several portions in the mitogenomes of fifteen Mantodea species. M: mitogenome. Ps: Protein-coding genes. rR: rRNAs. Ps-J: Protein-coding genes encoded by the majority strand. √: LNCs. -: no LNCs. (C) The lineage of fifteen Mantodea species. (D) The branch support values in each node. BPP: Bayesian posterior probabilities.
Discussion
The origin and evolution of degenerative control region
The LNCs from six Paramantini species showed low similarity, and only one short relatively conserved section was observed near ND2. The presence and variation in size and sequence of TDRs indicated that this unassigned region might be associated with the CR. When the redundant TDRs of LNC and CR were removed, the length of LNC was approximately half of the corresponding CR, and the identity of the aligned region was low (<60.0%), except for in H. formosana and R. valida (>70.0%). Nevertheless, one extremely conserved section (>90.0%) between LNC and CR was examined in T. tamolana, H. formosana and R. valida, respectively (Table 5). Successively, we divided the LNCs of these three species into several small sections, and each section was aligned with the remaining mitogenome sequence. The alignment results showed that most sections could be aligned to CR, while these homologous regions were scattered through the whole CR. Furthermore, a tRNA-like structure was detected at the 3' end of LNCs in two Rhombodera species (Fig. S6). Although the anticodon of the tRNA-like structure could not be identified in Rhombodera sp., these two tRNA-like sequences exhibited high homology with trnM. The alignment of the same position (the extremital sequence of LNCs) of the other four Paramantini species and the remaining sequence of mitogenome for each species showed that trnM is also the most similar region for this small section, although the identity was low (~ 60.0%) (Table 5). Overall, with the exception of the small trnM-like section, the main body of LNC may be another degenerative control region, and LNCs may be a synapomorphy for Paramantini species.
The comparison of LNC and CR from six Paramantini species.
| Species | CR-TDR size (bp) | LNC-TDR size (bp) | Region (Species abbreviation) | Alignment of LNC(-TDR) and CR(-TDR) | Alignment of trnM-Like sequence in LNC and trnM | ||||
|---|---|---|---|---|---|---|---|---|---|
| Alignment size (bp) | Conserved site (nt) | Conserved rate (%) | Total size (bp) | Conserved site (nt) | Conserved rate (%) | ||||
| Tamolanica tamolana | 498 | 296 | SR(Tt) | 299 | 169 | 56.5 | 78 | 47 | 60.3 |
| HCR(Tt) | 56 | 55 | 98.2 | ||||||
| Hierodula formosana | 779 | 366 | SR(Hf) | 384 | 271 | 70.6 | 72 | 48 | 66.7 |
| HCR(Hf) | 191 | 185 | 96.9 | ||||||
| Hierodula patellifera | 674 | 369 | SR(Hp) | 380 | 174 | 45.8 | 80 | 51 | 63.8 |
| Rhombodera brachynota | 669 | 349 | SR(Rb) | 384 | 174 | 45.3 | 71 | 41 | 57.7 |
| Rhombodera valida | 768 | 378 | SR(Rv) | 383 | 271 | 70.8 | 69 | 44 | 63.8 |
| HCR(Rv) | 202 | 188 | 93.1 | ||||||
| Rhombodera sp. | 672 | 460 | SR(Rsp) | 505 | 245 | 48.5 | 71 | 44 | 62.0 |
CR: control region; LNC: Large non-coding region between trnM and ND2; -TDR: redundant tandem repeats were removed; SR: similar reigon; HCR: highly conserved region; Tt: Tamolanica tamolana; Hf: Hierodula formosana; Hp: Hierodula patellifera; Rb: Rhombodera brachynota; Rv: Rhombodera valida; Rsp: Rhombodera sp.
The control region, the largest non-coding region in mitogenome, is involved in the regulation of replication and transcription of the mitogenome [42]. Therefore, the duplication and degeneration of this region may have important evolutionary significance. In most cases, there is only one control region in the mitogenome of insects, while two control regions have been detected in some species of thrips [15] and katydids [43]. Two mechanisms have been proposed for the occurrence of duplicate CRs in circular mitogenomes: (1) tandem duplication - the replication errors may bring two tandem-repeated sections in one mitogenome. If the errors occurred in the section including the CR, then each tandem-repeated section will contain a CR. (2) illegitimate recombination - a fragment including the CR was cleaved out from one mitogenome and subsequently introduced into another mitogenome.
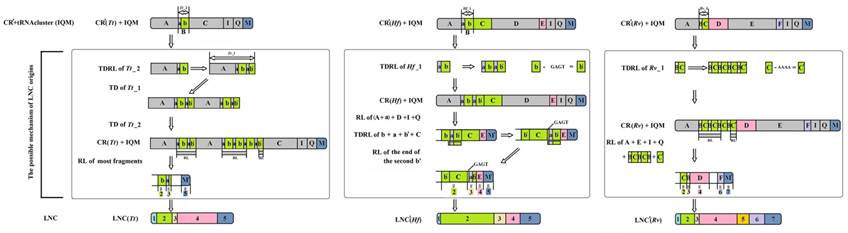
As a result, the recipient mitogenome will have two CRs. For Paramantini mitogenomes, the generated scenario of LNCs, however, might be complicated. It is plausible that the tandem duplication-random loss (TDRL) [44] accounts for the LNCs origin of T. tamolana, H. formosana and R. valida (Fig. 7). The initial repeat unit of TDR in CR or the current CR with TDR for these three species appears to have existed prior to the duplication of the whole CR to form the LNC. Based on this frame, we infer the potential generation of LNC and the present CR derived from assumed CR (without redundant TDR): the repeat unit of assumed CR was extended to form TDRs, and the whole CR (including TDRs) and tRNA cluster (trnI-trnQ-trnM) repeated together; subsequently, most spaced and tandem repeated fragments were randomly lost, and the several remaining parts in these fragment mutated and formed the heterogeneous region, viz. parts 1 and 4 in LNC(Tt), part 1 in LNC(Hf), and parts 1 and 5 in LNC(Rv) (Fig. 7). Generally, duplicate CRs evolve under two evolutionary pathways: concerted evolution and independent evolution [16]. In many cases, two CRs could easily be aligned, showing high sequence similarity, and simultaneously, the conserved functional sequence elements were completely preserved in each copy, suggesting that the two CRs are evolving in concert [45]. Although most portions of LNCs from T. tamolana, H. formosana and R. valida could be detected in the CR, both LNCs and CRs are difficult to align as a whole and the aligned portions of the LNCs are scattered in CRs (Fig. 7).
The possible mechanism for the origin of LNCs from Tamolanica tamolana, Hierodula formosana and Rhombodera valida. CR: control region. CR': CR without redundant tandem repeats. LNC: large non-coding region between trnM and ND2. LNC': LNC without redundant tandem repeats. TD: tandem duplication. RL: random loss. Tt: Tamolanica tamolana. Hf: Hierodula formosana. Rv: Rhombodera valida.
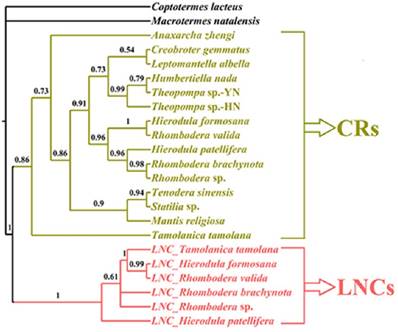
Whether these LNCs evolved in concert with CRs is open to debate. Typically, section duplication in the mitogenome is followed by the deletion or degeneracy of one of the duplicated copies, and consequently the coexistence of duplicate regions was short lived on an evolutionary timescale [46], e.g., extremely divergent size and sequence between LNCs and CRs in Rhombodera sp., H. patellifera and R. brachynota, and both appeared to evolve independently (Table 5). Much higher resolution was achieved in the phylogenetic relationships based on the LNC_CR dataset (Fig. 8) with LNCs from all six Paramantini species and all 15 CRs clustering together, respectively. The separation between LNCs and CRs was well supported by predicted phylogenetic relationships under this scenario (Fig. 8). If orthologous copies are more closely related than paralogous copies, then the two copies have evolved independently since prior to the speciation of the group [18], and indeed this was the conclusion deduced from phylogenetic results for all LNCs (Fig. 8). Therefore, these results suggest that all LNCs in these Paramantini species are independently evolving.
The phylogenetic relationship of LNCs and CRs using BI analyses. CR: control region. LNC: large non-coding region between trnM and ND2.
Intergenic gaps introduced through gene rearrangement and duplication
According to the gene rearrangement mechanism, TDRL model [44], G1 was most likely a small segment from the CR because when trnI-trnQ-trnM was tandemly duplicated, the small section abutting trnI may have duplicated along with the gene cluster (Fig. 5). G1 can also fold into many stem-loop structures (Fig. S7). However, the similarity was only approximately 45.0% in the aligned region between G1s and CRs from two Liturgusidae species, and the G1 sequences from two species also displayed low similarity (35.5%). Hence, G1 might have been derived from CR if mutations constantly accumulated in this gap along with the rearrangement process. G2 is a trnM pseudogene that has previously been reported [8]. G4 in C. gemmatus indicated that trnR duplicated three times, while the partial sequence of the AA stem was lost in the third copy, leading to the formation of the trnR pseudogene. The sequences of G5 and G6 demonstrated that the surrounding regions of the 5' and 3' of duplicated trnR harbour homologous fragments of the flanking sequences in the original order, which may be associated with the occurrence of the trnR duplication. The last 11 bp (P2) in G7 are the same as the sequence of the distal three nucleotides (TTA) in the AA stem of trnA and the intergenic gap sequence between trnA and trnR. In addition, the first 9 bp (P1) is the incomplete copy of P2, suggesting that trnR has been duplicated twice, with a subsequent loss of only the first copy of trnR and three abutting nucleotides (ATT) (Fig. 5). Analysing the intergenic gap introduced by gene rearrangement and duplication revealed that the abutting sequence could also migrate or duplicate along with the gene changes. Based on these findings, we propose that the intergenic gap sequence between the changed genes may be used to explore the mechanism of gene rearrangement and duplication.
Phylogenetic analyses among fifteen species from Mantodea
In the phylogeny obtained in the present study, species representing Hymenopodidae and Mantidae grouped together as a sister group, while Liturgusidae and Tarachodidae formed independent lineages (Fig. 6A), similar to the phylogenetic relationships constructed using combined mitochondrial and nuclear sequence data [47,48]. Furthermore, the relationship among species from the same family or tribe is also consistent with the phylogeny based on these molecular data [47,48]. Within Liturgusidae, Theopompa sp.-YN clustered with H. nada and subsequently grouped with Theopompa sp.-HN. from the same genus, which has been previously verified [8]. For three species from Liturgusidae, trnM was translocated at the upstream of trnI and formed a novel gene order (trnM-trnI-trnQ). Additionally, compared with other Mantodea species, the whole mitogenome and three important gene types (PCGs, rRNAs and tRNAs) displayed lower A+T contents, and PCGs-J also possessed different levels of GC-skew (Fig. 6B), suggesting that these common features may be a synapomorphy of the Asian bark mantis. Within the Mantidae, Tenodera sinensis Saussure, 1871 representing Mantinae first clustered with six Paramantini species from Paramantinae as a sister group, and subsequently clustered with the remaining two species from Paramantinae (Fig. 6A). Paramantini was divided into two branches: T. tamolana, H. formosana and R. valida formed one clade (clade I), and the remaining species were grouped together as another clade (clade II), showing that the genera Hierodula and Rhombodera were not recovered as a monophyletic lineage respectively (Fig. 6A). Notably, the TDRs and the homologous region between LNC and CR were observed in the CRs of all three clade I species, while these features could not be preserved in the three species from clade II. This raises a question: do apparently different features of CR and LNC from two clades represent the distinct evolutionary rates and patterns for CR and LNC in these two clades for Paramantini? This question deserves further assessment with a broader taxon sample. The phylogenetic relationship in Paramantini, with the exception of T. tamolana, was also supported by the phylogeny based on the relatively conserved region of CRs in each family (CCR dataset) (Fig. S8 & Fig. 6D).
Whether the CCR in each family possesses a phylogenetic signal for analysing the relationship of these Mantodea species is not clear. The phylogeny based on this region was reconstructed, and two species from Hymenopodidae clustered together. Three species from Liturgusidae also formed one small clade, and all their relationships were consistent with the phylogenetic results based on mtDNA. Although eight species from Mantidae were dispersed, six Paramantini species grouped together. In Paramantini, these species from Hierodula and Rhombodera promiscuously clustered together (Fig. S8), as found in the mtDNA phylogeny. These results may indicate that the relatively conserved region of CR in family may be used to analyse the phylogenetic relationship among species with close relationship.
Conclusion
In summary, four new mitogenomes of Paramantini were sequenced and annotated, and these mitogenomes shared the same gene content and gene order with most known Mantodea mitogenomes. We presented a comprehensive comparative analysis of fifteen Mantodea mitogenomes and obtained preliminary results for the mitogenome characteristics and evolutionary patterns. Most species displayed similar usage bias in nucleotides and codons. The relatively conserved and variable regions were unevenly distributed in the secondary structures of tRNAs and rRNAs. Three common elements, two CBSs and one poly-T, were found in CRs. LNCs in Paramantini may have initially originated from the CR, although the major intact homologous region is difficult to detect between CRs and LNCs generated through paralogous copies. Differing from two CRs evolving in concert in other species, the LNCs and CRs in this tribe independently evolved, which is supported by the phylogenetic relationship constructed using LNC_CR data. Some features in these intergenic gap sequences introduced by gene rearrangement and duplication may be helpful to characterize the mechanism of gene changes. Furthermore, phylogenetic analyses among fifteen Mantodea species suggest that the mitogenome is a useful marker for resolving phylogenetic relationships among Mantodea species.
Abbreviations
Mitogenome: mitochondrial genome; LNC: large non-coding region between trnM and ND2; CR: control region; PCGs: protein-coding genes; CBS: conserved block sequence; tRNAs: transfer RNAs; rRNAs: ribosomal RNAs; Ka: the rates of non-synonymous substitutions; Ks: the rates of synonymous substitutions; CBI: the codon bias index; ENC: the effective number of codons; (G+C): the G+C content of all codons; (G+C)3: the G+C content of the third codon sites; TDR: tandem repeat; CCR: the relatively conserved region of CR in each family; BI: Bayesian inference; ML: Maximum Likelihood; PCGs-J: PCGs encoded by the majority strand; PCGs-N: PCGs encoded by the minority strand; %INUC: the percentage of identical nucleotides; AA stem: the amino acid acceptor stem; DHU stem: the dihydrouridine stem; AC stem: the anticodon stem; rrnS: the small ribosomal subunit; rrnL: the large ribosomal subunit; G: intergenic gap; TDRL: tandem duplication-random loss.
Supplementary Material
Supplementary figures and tables.
Acknowledgements
This study was supported by grants from the Doctoral Scientific Research Foundation of Datong University (No. 2013-B-08) and the National Natural Science Foundation of China (31372158). The authors would like to thank Dr. David Cone (Saint Mary's University) and Dr. Ping You (Shaanxi Normal University) for providing helpful comments on a previous draft of the manuscript.
Competing Interests
The authors have declared that no competing interest exists.
References
1. Ehrmann R. Mantodea: Gottesanbeterinnen der Welt. Münster, Germany: Natur und Tier Verlag. 2002
2. Svenson GJ, Whiting MF. Phylogeny of Mantodea based on molecular data: evolution of a charismatic predator. Systematic Entomology. 2004;29:359-70
3. Ramsay GW. Mantodea (Insecta), with a review of aspects of functional morphology and biology. Fauna of New Zealand. 1990;19:1-96
4. Terra PS. Revisão sistematica dos generos de Louva-A-Deusda região Neotropical (Mantodea). Revista Brasileira de Entomologia. 1995;39:13-94
5. Vanitha K, Bhat PS, Raviprasad TN, Srikumar KK. Biology and behaviour of Ephestiasula pictipes (Wood-Mason) (Hymenopodidae: Mantodea) under captive breeding. International Journal of Pest Management. 2016;62:308-18
6. Boore JL. The use of genome-level characters for phylogenetic reconstruction. Trends in Ecology & Evolution. 2006;21:439-46
7. Hirase S, Takeshima H, Nishida M, Iwasaki W. Parallel Mitogenome sequencing alleviates random rooting effect in phylogeography. Genome Biology and Evolution. 2016;8:1267-78
8. Ye F, Lan XE, Zhu WB, You P. Mitochondrial genomes of praying mantises (Dictyoptera, Mantodea): rearrangement, duplication, and reassignment of tRNA genes. Scientific Reports. 2016;6:25634
9. Cameron SL, Barker SC, Whiting MF. Mitochondrial genomics and the new insect order Mantophasmatodea. Molecular Phylogenetics and Evolution. 2006;38:274-9
10. Tian X, Liu J, Cui Y, Dong P, Zhu Y. Mitochondrial genome of one kind of giant Asian mantis, Hierodula formosana (Mantodea: Mantidae). Mitochondrial DNA. 2015 [Epub ahead of print]
11. Arndt A, Smith MJ. Mitochondrial gene rearrangement in the sea cucumber genus Cucumaria. Molecular Biology and Evolution. 1998;15:1009-16
12. Eberhard JR, Wright TF. Bermingham E. Duplication and concerted evolution of the mitochondrial control region in the parrot genus Amazona. Molecular Biology and Evolution. 2001;18:1330-42
13. Kumazawa Y, Ota H, Nishida M, Ozawa T. Gene rearrangements in snake mitochondrial genomes: highly concerted evolution of control-region-like sequences duplicated and inserted into a tRNA gene cluster. Molecular Biology and Evolution. 1996;13:1242-54
14. Lee JS, Miya M, Lee YS, Kim CG, Park EH, Aoki Y, Nishida M. The complete DNA sequence of the mitochondrial genome of the self-fertilizing fish Rivulus marmoratus (Cyprinodontiformes, Rivulidae) and the first description of duplication of a control region in fish. Gene. 2001;280:1-7
15. Shao R, Barker SC. The highly rearranged mitochondrial genome of the plague thrips, Thrips imaginis (Insecta: Thysanoptera): convergence of two novel gene boundaries and an extraordinary arrangement of rRNA genes. Molecular Biology and Evolution. 2003;20:362-70
16. Shao R, Barker SC, Mitani H, Aoki Y, Fukunaga M. Evolution of duplicate control regions in the mitochondrial genomes of metazoa: a case study with Australasian Ixodes ticks. Molecular Biology and Evolution. 2005;22:620-9
17. Zheng CF, Nie LW, Wang J, Zhou HX, Hou HZ, Wang H, Liu JJ. Recombination and evolution of duplicate control regions in the mitochondrial genome of the Asian big-headed Turtle, Platysternon megacephalum. PLoS one. 2013;8:e82854
18. Abbott CL, Double MC, Trueman JWH, Robinson A, Cockburn A. An unusual source of apparent mitochondrial heteroplasmy: duplicate mitochondrial control regions in Thalassarche albatrosses. Molecular Ecology. 2005;14:3605-13
19. Simon C, Buckley TR, Frati F, Stewart JB, Beckenbach AT. Incorporating molecular evolution into phylogenetic analysis, and a new compilation of conserved polymerase chain reaction primers for animal mitochondrial DNA. Annual Review of Ecology Evolution and Systematics. 2006;37:545-79
20. Staden R, Beal KF, Bonfield JK. The Staden package, 1998. Methods in Molecular Biology. 2000;132:115-30
21. Lowe TM, Eddy SR. tRNAscan-SE: A program for improved detection of transfer RNA genes in genomic sequence. Nucleic Acids Research. 1997;25:955-64
22. Cannone JJ, Subramanian S, Schnare MN, Collett JR, D'Souza LM, Du Y, Feng B, Lin N, Madabusi LV, Müller KM, Pande N, Shang Z, Yu N, Gutell RR. The Comparative RNA Web (CRW) site: an online database of comparative sequence and structure information for ribosomal, intron, and other RNAs. BMC Bioinformatics. 2002;3:2
23. Clary DO, Wolstenholme DR. Drosophila mitochondrial DNA: Conserved sequences in the A + T-rich region and supporting evidence for a secondary structure model of the small ribosomal RNA. Journal of Molecular Evolution. 1987;25:116-25
24. Tamura K, Peterson D, Peterson N, Stecher G, Nei M, Kumar S. MEGA5: Molecular evolutionary genetics analysis using maximum likelihood, evolutionary distance, and maximum parsimony methods. Molecular Biology and Evolution. 2011;28:2731-9
25. Librado P, Rozas J. DnaSP v5: A software for comprehensive analysis of DNA polymorphism data. Bioinformatics. 2009;25:1451-2
26. Benson G. Tandem repeats finder: A program to analyze DNA sequences. Nucleic Acids Research. 1999;27:573-80
27. Zuker M. Mfold web server for nucleic acid folding and hybridization prediction. Nucleic Acids Research. 2003;31:3406-15
28. Thompson JD, Gibson TJ, Plewniak F, Jeanmougin F, Higgins DG. The CLUSTAL X Windows interface: Flexible strategies for multiple sequence alignment aided by quality analysis tools. Nucleic Acids Research. 1997;25:4876-82
29. Hall TA. BioEdit: A user-friendly biological sequence alignment editor and analysis program for Windows 95/98/NT. Nucleic Acids Symposium Series. 1999;41:95-8
30. Posada D, Crandall KA. MODELTEST: testing the model of DNA substitution. Bioinformatics. 1998;14:817-8
31. Nylander JAA. MrModeltest v2. Program distributed by the author. Uppsala University, Uppsala, Sweden, Evolutionary Biology Centre. 2004
32. Ronquist F, Huelsenbeck JP. MrBayes 3: Bayesian phylogenetic inference under mixed models. Bioinformatics. 2003;19:1572-4
33. Stamatakis A. RAxML-VI-HPC: maximum likelihood-based phylogenetic analyses with thousands of taxa and mixed models. Bioinformatics. 2006;22:2688-90
34. Wang T, Yu P, Ma Y, Cheng H, Zhang J. The complete mitochondrial genome of L. albella (Mantodea: Iridopterygidae). Mitochondrial DNA Part A. 2016;27:465-6
35. Buckley TR, Simon C, Flook PK, Misof B. Secondary structure and conserved motifs of the frequently sequenced domains IV and V of the insect mitochondrial large subunit rRNA gene. Insect Mol Biol. 2000;9:565-80
36. Broughton RE, Dowling TE. Length variation in mitochondrial DNA of the minnow Cyprinella spiloptera. Genetics. 1994;138:179-90
37. Buroker NE, Brown JR, Gilbert TA, O'Hara PJ, Beckenbach AT, Thomas WK, Smith MJ. Length heteroplasmy of sturgeon mitochondrial DNA: An illegitimate elongation model. Genetics. 1990;124:157-63
38. Savolainen P, Arvestad L, Lundeberg J. mtDNA tandem repeats in domestic dogs and wolves: Mutation mechanism studied by analysis of the sequence of imperfect repeats. Molecular Biology and Evolution. 2000;17:474-88
39. Cameron SL, Lambkin CL, Barker SC, Whiting MF. A mitochondrial genome phylogeny of Diptera: whole genome sequence data accurately resolve relationships over broad timescales with high precision. Systematic Entomology. 2007;32:40-59
40. Pons J, Ribera I, Bertranpetit J, Balke M. Nucleotide substitution rates for the full set of mitochondrial protein-coding genes in Coleoptera. Molecular Phylogenetics and Evolution. 2010;56:796-807
41. Zhang D, Yan LP, Zhang M, Chu HJ, Cao J, Li K, Hu DF, Pape T. Phylogenetic inference of calyptrates, with the first mitogenomes for Gasterophilinae (Diptera: Oestridae) and paramacronychiinae (Diptera: Sarcophagidae). International Journal of Biological Sciences. 2016;12:489-504
42. Ruokonen M, Kvist L. Structure and evolution of the avian mitochondrial control region. Molecular Phylogenetics and Evolution. 2002;23:422-32
43. Yang J, Ye F, Huang Y. Mitochondrial genomes of four katydids (Orthoptera: Phaneropteridae): New gene rearrangements and their phylogenetic implications. Gene. 2016;575:702-11
44. Boore JL. The duplication/random loss model for gene rearrangement exemplified by mitochondrial genomes of deuterostome animals. In: (ed.) Sankoff D, Nadeau JH. Comparative genomics. Dordrecht: Kluwer Academic Publishers. 2000:133-147
45. Tatarenkov A, Avise JC. Rapid concerted evolution in animal mitochondrial DNA. Proceedings of the Royal Society B-Biological Sciences. 2007;274:1795-8
46. Moritz C, Brown WM. Tandem duplications in animal mitochondrial DNAs: variation in incidence and gene content among lizards. Proceedings of the National Academy of Sciences, USA. 1987;84:7183-7
47. Svenson GJ, Whiting MF. Reconstructing the origins of praying mantises (Dictyoptera, Mantodea): the roles of Gondwanan vicariance and morphological convergence. Cladistics. 2009;25:468-514
48. Legendre F, Nel A, Svenson GJ, Robillard T, Pellens R, Grandcolas P. Phylogeny of Dictyoptera: Dating the Origin of Cockroaches, Praying Mantises and Termites with Molecular Data and Controlled Fossil Evidence. Plos one. 2015;10:e0130127
Author contact
![]() Corresponding author: feiyeemailcom
Corresponding author: feiyeemailcom