Impact Factor ISSN: 1449-2288
- Issue 11; 2026
- Issue 10; 2026
- Issue 9; 2026
- Issue 8; 2026
- Issue 7; 2026
- Volume 22; 2026
- Past Issues
- Advance Articles
- Editorial Board
- Cover Images
- Index & Coverage
- Cover Suggestion
- Special Issues
Introduction
Materials and Methods
Results
Discussion
Supplementary Material
Acknowledgements
References

 Global reach, higher impact
Int J Biol Sci 2017; 13(11):1438-1449. doi:10.7150/ijbs.20836 This issue Cite
Research Paper
Transcriptome integration analysis in hepatocellular carcinoma reveals discordant intronic miRNA-host gene pairs in expression
Yulin Sun1, 2, 3*, Fubo Ji1*, Mia R Kumar4*, Xin Zheng5, Yi Xiao1, Niya Liu1, Jiong Shi4, 6, Linda Wong2, 7, Marshonna Forgues4, Lun-Xiu Qin6, Zhao-You Tang6, Xiaohang Zhao3, Xin Wei Wang4 ![]() , Junfang Ji1
, Junfang Ji1 ![]()
1. Life Sciences Institute, Zhejiang University, Hangzhou, 310058, China;
2. University of Hawai'i Cancer Center, Honolulu, HI, 96813, USA;
3. State Key Laboratory of Molecular Oncology, Cancer Institute & Hospital, Chinese Academy of Medical Sciences and Peking Union Medical College, Beijing, 100021, China;
4. Liver Carcinogenesis Section, Laboratory of Human Carcinogenesis, National Cancer Institute, Bethesda, MD, 20892, USA;
5. Sinowell Beijing Tech Ltd, Beijing, 100045, China;
6. Liver Cancer Institute and Zhongshan Hospital, Fudan University, Shanghai, China, 200433;
7. Department of Surgery, John A. Burns School of Medicine, University of Hawai'i, Honolulu, HI, 96813, USA.
* The authors wish it to be known that, in their opinion, the first three authors should be regarded as joint First Authors.
Received 2017-5-2; Accepted 2017-9-21; Published 2017-11-1
Abstract

Intronic miRNAs, residing in intronic regions of host genes, are thought to be co-transcribed from their host genes and present consistent expression patterns with host genes. Recent studies reported a few intronic miRNAs with discordant expression with their host genes. We therefore aimed to understand the expression pattern of intronic miRNAs and their host genes in hepatocellular carcinoma (HCC) and reveal possible associated molecular mechanisms. Our genome wide integration analysis of miRNA and mRNA transcriptomes, in three dataset from 550 patients with HCC, found that a large amount of miRNA-host gene pairs were discordantly expressed. Consistent results were also revealed in 775 breast cancer patients. Further, most of HCC-related intronic miRNAs were predicted to have distinct upstream regulators and independent proximal promoter signals from host genes. The discordant expression of representative pairs, miR-26s/CTDSPs, was validated experimentally. We have also identified the independent transcriptional start site, promoter signal, and transcriptional factor of miR-26b from its host gene. Collectively, discordant expression of intronic miRNAs and their host genes was relatively ubiquitous and the intronic miRNA “independent transcription” may partially contribute to such a phenotype.
Keywords: microRNA, Intronic miRNA, Transcriptome, Integration analysis, Hepatocellular carcinoma.
Introduction
MicroRNAs (miRNAs), ~22nt single-strand non-coding RNAs, are functionally important in various biological processes [1, 2]. In the human genome, approximately half of miRNA genes sit between independent transcription units whereas the intragenic miRNAs (inside genes) are embedded within mainly intronic regions and oriented on the same DNA strand of host genes. Intergenic miRNAs are transcribed from their own transcript units, similar to the other protein-coding genes, by RNA polymerase II and rapidly cleaved and further processed to generate mature miRNAs [2-4]. Nevertheless, intronic miRNAs are believed to be processed from the introns of their hosting transcription units and hence share common regulatory mechanisms and expression patterns with the host gene [5-7]. However, it has been noticed in Drosophila that intronic miRNAs and their host genes, miR-7/BANCAL and miR-281/ODA, had different expression patterns [8, 9]. In human, several computational programs have predicted that ~1/3 of intronic miRNAs might contain possible independent proximal promoters from their host genes [10-13]. Consistently miR-106b-93 cluster was reported to have an independent primary transcript unit from its host gene [14]. These results indicate the complexity of the intronic miRNA transcriptional regulation.
Studies on the expression alteration of miRNAs and their host genes during biological processes such as carcinogenesis might allow us to understand whether intronic miRNA and their host genes are co-processed. Similar with mRNAs, the altered expression of miRNAs has been observed in various human cancers and miRNAs serve as oncogenes or tumor suppressor genes in carcinogenesis [4, 15, 16]. The dysregulation of miRNAs and mRNAs in tumor occur both at the DNA level such as gene loci copy number variation and abnormal methylation, and at the RNA level such as transcriptional activation or suppression. These regulatory mechanisms likely induce or reduce the levels of intronic miRNAs and their host genes in the same direction if the intronic miRNA-host gene pairs share the same transcripts. Thus examining the expression pattern of intronic miRNA-host gene pairs in tumors, non-tumors, and tumors vs. non-tumors would likely offer a practical way to reveal whether intronic miRNAs are dependently or independently transcribed from their host genes.
We have previously profiled 219 miRNAs and 13101 genes in 176 tumor and matched non-tumor specimens from patients with hepatocellular carcinoma (HCC) and found that as many as one third of them are significantly altered in HCC [7, 17-22]. There are also publically available TCGA miRNA and mRNA transcriptome dataset in human cancers such as HCC and breast cancer. All of these allowed us to perform the genome wide transcriptive integration analysis for the intronic miRNA-host gene pairs in a large scale of human samples at a systematic level.
In this vein, we globally examined the expression pattern of intronic miRNAs and their corresponding host genes in two HCC transcriptome datasets. We found a large amount of intronic miRNAs expressed discordantly with their host genes. We further explored the possible regulatory mechanisms via bioinformatics analysis and experimental assays and revealed that intronic miRNA “independent transcription” contributed to such a phenomenon.
Materials and Methods
Transcriptome datasets
A total of four corresponding miRNA and mRNA transcriptome dataset was used (Table 1).
Four datasets with available miRNA and mRNA transcriptome profiles
| Datasets | Tumor (n) | Non-tumor (n) | Paired (n) | Other information |
|---|---|---|---|---|
| LCS_HCC | 176 | 176 | 176 | GSE6857; GSE14520 |
| TCGA_LIHA | 374 | 50 | 49 | TCGA database |
| TCGA_BRCA | 775 | 87 | 85 | TCGA database |
| Cells_ARTA | / | / | / | GSE18693; n=8 (2 cell lines, 2 treatment, duplicate) |
The first one was a previously described HCC transcriptome dataset from our group, which included available miRNA microarray data and mRNA microarray data in 176 paired HCC tumor and non-tumor specimens, termed as LCS_HCC dataset [17, 23]. For these cases, miRNA profiles were performed in the single channel miRNA microarray platform (V 2.0; containing 219 non-redundant miRNAs) (GEO accession number: GSE6857) [17]. mRNA microarray profiling in both tumor and non-tumors was based on a single-channel platform (Affymatrix Genechip HG-U133A 2.0 arrays, GSE14520) [23, 24].
The second dataset was the miRNA and mRNA deep sequencing data of HCC from The Cancer Genome Atlas (TCGA), termed as TCGA_LIHA. TCGA_LIHA mRNA and miRNA sequencing data were comprised of 374 HCC tissues and 50 normal liver tissues. Among them, there were 49 cases with transcriptome data in paired cancer and normal tissues.
The third one was the miRNA and mRNA deep sequencing data of breast cancer being downloaded from TCGA, termed as TCGA_BRCA. This included miRNA and mRNA transcriptome data from 775 breast cancer specimens and 87 normal breast tissues. Among them, there were 85 cases with transcriptome data in paired breast cancer and normal tissues.
The fourth one was downloaded with GEO accession number: GSE18693. It included miRNA and mRNA microarray data of a total of 8 samples from two cell lines. They were estrogen receptor-positive breast carcinoma cell MCF-7 and estrogen receptor-negative cell MDA-MB-231 cells. Cells being treated with all-trans-retinoic acid (ATRA) for 6 hours and 48 hours were used for transcriptome profiling with biological duplicates per sample [25]. We termed it Cells_ARTA dataset.
miRNA classification
All annotated human miRNAs genomic coordinates were extracted from miRBase release 21, and mapped to genomic coordinates of RNA reference sequences RefSeq Genes (GRCh38/hg38) by the in-house Perl script. The RefSeq genomic coordinates were downloaded from University of California Santa Cruz (UCSC) genome browser. MiRNAs whose coordinates mapped to annotated genes on the same DNA strand were defined as intragenic miRNAs, otherwise intergenic miRNAs. Intragenic miRNAs were classified as exonic miRNAs when their coordinates overlapped with any conserved exon regions, otherwise intronic miRNAs [26].
Expression pattern analysis of the intronic miRNA-host gene pairs in tumor, non-tumor and the comparison of tumor vs. non-tumor
Microarray data were analyzed using R/Bioconductor software. Pearson correlation or spearman correlation was used to assess expression pattern between intronic miRNAs and their host genes in non-tumor and tumor tissues, respectively. If correlation p-value was less than 0.05 and r-value was positive, these miRNA-host gene pairs were considered as concordant pairs in the expression of tumor or non-tumor, otherwise discordant pairs.
The alteration pattern of intronic miRNAs and host genes in tumor compared to non-tumor was also examined. Paired student's t-test was used between tumor and non-tumors, and p-values were adjusted for multiple testing using the method of Benjamini to control for false discovery rate (FDR). A FDR q value cutoff of 0.05 was set to recognize genes with significant differential expression from the comparison of tumor vs. non-tumor. If the intronic miRNAs and their host genes in the pairs were both significantly up- or down- regulated, or both having no significant differential expression from the comparison of tumor vs. non-tumor, these miRNA-host gene pairs were concordant pairs in the expression of tumor vs. non-tumor, otherwise discordant pairs.
Tumor-related intronic miRNAs were filtered out for further bioinformatics analysis only if they had FDR q value <0.05 and intensity fold change ≥1.5 on either tumor vs. non-tumor or non-tumor vs. tumor.
Bioinformatics analysis on investigating upstream regulators and related biological functions for the tumor-related intronic miRNAs
Gene surrogates of tumor-related intronic miRNAs and their corresponding host genes were investigated to identify their possible upstream regulators. In detail, Spearman's rank correlation was performed for tumor-related intronic miRNAs and their corresponding host genes with whole mRNA transcriptome data using the log(2) values of tumor vs. non-tumor. Gene surrogates for certain miRNA or mRNA were defined as genes having the top 5% of significant correlation values (Supplementary Fig 1), and then used for further analysis.
The enrichment analysis of upstream regulators of tumor-related intronic miRNAs and their respective host genes was performed via Ingenuity Pathway Analysis (IPA). Hypergeometric test p-value ≤ 0.05 was considered as significant enrichment. To further evaluate the consistency of upstream regulators of each tumor-related intronic miRNA and its respective host gene, whole enrichment lists were categorized by 6 groups, including top10, top10-20, top20-50, top50-100, >100 and unenriched. Quadratic weighted inter-rater agreement (kappa) test was then performed using Medcalc software (v13.3.3, Ostend, Belgium).
The ChIP-sequencing data from Encyclopedia of DNA Elements (ENCODE) database were used to annotate the upstream promoter activity of the intronic miRNAs in the region of the upstream of precursor miRNAs and 0.5kb downstream from the transcriptional starting sites (TSSs) of host genes.
To explore the potential biological processes related to each tumor-related intronic miRNA and its respective host gene, Gene Ontology (GO) enrichment analysis was performed based on the above positively and negatively correlated gene surrogates for each miRNA or mRNA through an R package, clusterProfiler (https://bioconductor.org/packages/release/bioc/html/clusterProfiler.html) [27-29].
HCC clinical samples, Cell culture, RNA interference and plasmids
From archived tumor and non-tumor RNAs of 176 HCC cases, 18 paired HCC and non-HCC RNAs were randomly chosen for the quantitative RT-PCR validation of intronic miRNAs and their host genes.
Human HCC cell lines (HuH7, HuH4, HuH1, Hep3B, HepG2, MHCC97, SK-Hep1 and SMMC7721) and an immortalized hepatocyte (HHT4) were cultured as previously described [30]. Human P493-6 B cells carrying a conditional, tetracycline-repressed Myc gene were kindly provided by Dr. Joshua Mendel and routinely cultured as described [31]. For repression of Myc, the cells were treated by 0.1 µg/ml tetracycline (Sigma-Aldrich, St Louis, MO) for 48 hours. HL-7702, an immortalized hepatocyte cell line, was from Shanghai Cell Biology Institute, Chinese Academy of Sciences, and cultured with RPMI-1640 and 10% FBS according to the standard protocol.
Myc (SI00300902) and a negative control siRNA were purchased from Qiagen (Valencia, CA). Drosha siRNA (siDrosha-2) was purchased from Dharmacon (Lafayette, CO). Plasmids Myc-PT3EF1a and control PT3EF1a were kindly provided by Dr. Xin Chen. Transfection was performed using Lipofectamine 2000 (Invitrogen), according to the manufacturer's instructions. Total RNA was extracted at 72 hours post-transfection of siRNAs and at 48 hours post-transfection of plasmids.
RNA isolation, quantitative reverse transcription-polymerase chain reaction (qRT-PCR), protein extraction and Western blotting
Total RNAs were extracted using standard TRIZOL (Invitrogen, Carlsbad, CA) methods. The reverse transcription was performed using TaqMan® MicroRNA Reverse Transcription Kit (Applied Biosystems, Foster City, CA) for miRNAs and High-Capacity cDNA Reverse Transcription Kit (Applied Biosystems, Foster City, CA) for genes. The expression of mature miRNAs and genes was measured using Taqman MicroRNA Assays specific for miR-26a and miR-26b, and Taqman Gene Assays specific to CTDSP1 (Hs00221852_m1), CTDSP2 Hs00428461_m1), CTDSPL (Hs00195146_m1), Myc (Hs00153408_m1) and Drosha (Hs00203008_m1) after reverse transcription (Applied Biosystems, Foster City, CA). Relative gene expression of the introns of CTDSP1 was also assessed using TaqMan probes set specifics for exon1-2 (Hs00221852_m1), exon2-3 (Hs01105500_g1) and exon 4-5 (Hs01105502_m1). The Taqman MicroRNA Assay for RUN6B was used to normalize the relative abundance of miRNAs. The Taqman gene assay for 18S was used to normalize the relative abundance of mRNA. The expression of primary mir-26b and precursor mir-26b was measured using SYBR Green assays (Applied Biosystems, Foster City, CA) and U6 RNA was used to normalize their expression. The expression of primary CTDSP1 was measured using SYBR Green assays and 18S was used to normalize their expression. The primers used were listed in Table S1. The experiments were performed in triplicate.
After 72 hours of siRNA transfection or 48 hours of tetracycline treatment, total protein extraction and Western blot assay were performed as previously described[19] using anti-Myc (1:2000, Epitomics, Burlingame, CA) and anti-β-actin (1:5000, Sigma-Aldrich) antibodies.
5'-Rapid amplification of cDNA ends (5'-RACE)
5'-RACE was utilized to identify the 5' end of miRNA primary transcripts to localize the TSSs of primary mir-26b. The GeneRacer Kit with SuperScript III RT and TOPO TA Cloning Kit (Invitrogen) was used with 5μg of total RNA from HuH7 cells according to the manufactures' instructions. Reverse transcription was performed with random hexamers provided in the kit. Gene specific reverse primers of miR-26b were listed in Table S1. To enrich the primary mir-26b transcript, HuH7 cells were transfected with Myc and Drosha siRNAs 2 days before RNA isolation (Supplementary Fig 2).
Chromatin immuoprecipitation (ChIP)
ChIP analysis was performed in HuH7 cells by Chromatin Immunoprecipitation Assay Kit (Millipore, Billerica, MA) according to the manufacturer's instructions. To assay for histone lysine Methylation, specific anti-H3K4me3 (Abcam, Cambridge UK), anti-H3K36Me3 (Abcam), and anti-β-actin antibodies were used. Four real-time PCR amplicons flanking the TSS of the miR-26b transcript were designed within 220-bp windows as follows: 50-bp upstream of the identified TSS (amplicon 1); immediately downstream of the identified TSS (amplicon 2); 280-bp downstream from TSS (amplicon 3); and 1200-bp downstream from TSS (amplicon 4). The SYBR Green assay (Applied Biosystems, Foster City, CA) was used to amplify these regions, and the forward and reverse primers for each amplicon were listed in Table S1.
Other Statistics
A Student's t-test (two-tailed) was used for statistical analysis of comparative experimental data between different groups using GraphPrism V6.0 (San Diego, CA). The statistical significance was defined as a p-value of less than 0.05.
Results
Discordant expression of intronic miRNAs and their corresponding host genes is a common feature in 3 independent transcriptome dataset
We first identified the intronic miRNA-host gene pairs from LCS_HCC dataset. From the miRNA annotation in miRBase (Release 21) and mRNA annotation in UCSC genome browser (hg38), the gene coordinates mapping revealed 778 intronic miRNAs (Fig 1A). These 778 intronic miRNAs and their host genes were then integrated with miRNA array data set (including 219 miRNAs) and mRNA array data (including 13101genes) in 176 HCC cases. As shown in Table S2, 59 intronic miRNA/host gene pairs with available miRNA and mRNA expression data were identified.
The expression pattern of intronic miRNA-host gene pairs with available profiling data. (A) The pie figure for the percentage of intronic miRNAs in miRBase. (B) LCS_HCC database. The concordant pairs (light grey) and discordant intronic miRNA-host gene pairs (dark grey) were showed based on their readings in tumor, non-tumor and the ratio of tumor vs. non-tumor (Left panel). The expression pattern of 11 miR/miR clusters among 59 intronic miRs was examined as a positive control (Right panel). (C, D) In TCGA_LIHA and TCGA_BRCA databases, the concordant pairs (light grey) and discordant pairs (dark grey) were showed based on their readings in tumor, non-tumor as well as the ratio of tumor vs. non-tumor.
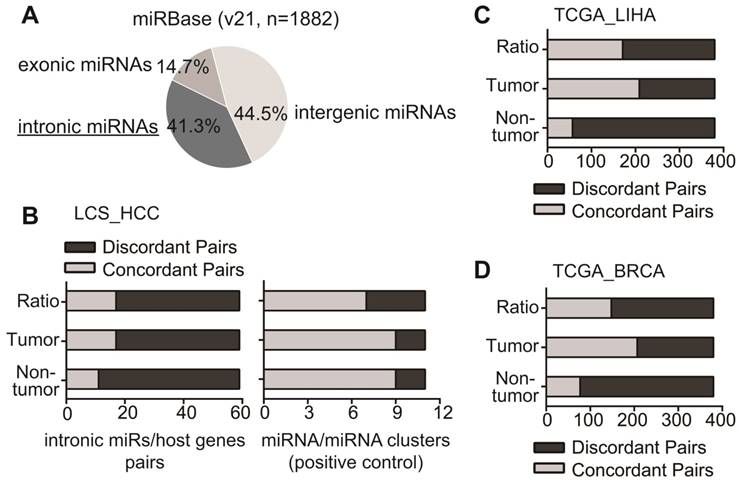
Their expression pattern was then assessed in tumor, non-tumor and the comparison of tumor vs. non-tumor. First, in non-tumor and tumor tissues, we calculated Pearson's product-moment correlation coefficient of intronic miRNA and host gene in each pair to evaluate whether these pairs were concordant or discordant pairs (detailed in Materials and Methods part). Among 59 pairs, only a small subset of pairs (11 in non-tumor tissues and 17 in tumor tissues, 18.6% and 28.8% respectively) were concordant pairs that exhibited a significantly positive correlation (p<0.05) between intronic miRNA and host gene (Fig 1B, Table S2). Next, we evaluated their expression pattern according to the reading of tumor vs. non-tumor. Consistently, majority of pairs (42 out of 59) displayed the discordant expression alteration, i.e., miRNAs and their host genes were not consistently up-regulated, or down-regulated, or have no change in the comparison of tumor vs. non-tumors (Fig 1B, Table S2). We have also used intronic miRNA-miRNA pairs in miRNA clusters as a positive control to perform the analysis, since they were co-localized and possibly co-regulated [32, 33]. Among 59 intronic miRNAs, there were 11 miRNA pairs in seven clusters (Table S3). Consistent with published data, miRNAs in clusters were mainly concordantly expressed in tumor (9 out of 11), non-tumor (9 out of 11), and the comparison of tumor vs non-tumor (7 out of 11) (Fig 1B, right panel).
We further explored the expression pattern of intronic miRNA-host gene pairs in TCGA HCC RNA sequencing dataset (Table S4). In TCGA_LIHA dataset, we have identified 380 intronic miRNA/host gene pairs with available miRNA and mRNA sequencing data. The expression analysis revealed that 85% (323 out of 380) of pairs in non-tumor tissues and 42.4% (161/380) of pairs in tumor tissues presented discordant expression between intronic miRNA and host gene (Fig 1C). Moreover, 55% of pairs (209/380) showed discordant expression pattern in tumor vs. non-tumor tissues.
Consistently, the data analysis in TCGA_BRCA dataset uncovered the similar results in identified 380 intronic miRNA/host gene pairs. 79.7% pairs in non-tumor tissues, 42.9% in tumor tissues, and 61.2% in tumor vs. non-tumor tissues showed discordant expression between intronic miRNAs and host genes (Fig 1D). Together, these data demonstrated that it was relatively common for intronic miRNAs and their host genes showing the discordant expression.
Intronic miRNAs had the distinct transcriptional regulatory factors and independent proximal promoter signals from their host genes via bioinformatics analysis
One possibility leading to the discordant expression of intronic miRNA and host gene is that transcriptional regulatory machineries for intronic miRNAs might be disparate from those for their host genes. In this vein, we studied HCC-related intronic miRNAs from LCS_HCC dataset due to their massive regulatory alteration in tumors compared to non-tumors from patients with HCC. A total of 14 miRNAs were identified as highly tumor-related miRNAs (tumor vs. non-tumor, ≥1.50 or ≤0.67; Table 2). Consistently, a major proportion of tumor-related miRNAs were discordant in expression with their host genes (11 out of 14 in tumor and non-tumor, and 9 out of 14 in tumor vs. non-tumor) (Table 2).
14 tumor-related intronic miRNA/host gene pairs in LCS_HCC dataset.
| Pairs | Tumor vs. non-tumora | Tumorb | Non-tumorb | Proximal Promoter of miRNAsc | |||||||
|---|---|---|---|---|---|---|---|---|---|---|---|
| miR_ q-value | miR_ fold | host_ q-value | host_ fold | r- value | p- value | r- value | p- value | ||||
| Let-7g/WDR82 | <0.01 | 0.49 | <0.01 | 1.82 | / | / | / | / | Yes | ||
| miR-105-2/GABRA3 | <0.01 | 0.64 | <0.01 | 1.17 | / | / | / | / | Yes | ||
| miR-10a/HOXB3 | <0.01 | 0.46 | <0.01 | 1.13 | / | / | / | / | Yes | ||
| miR-126/EGFL7 | <0.01 | 0.52 | <0.01 | 1.54 | / | / | / | / | Yes | ||
| miR-26a-1/CTDSPL | <0.01 | 0.56 | <0.01 | 1.34 | / | / | / | / | Yes | ||
| miR-26a-2/CTDSP2 | <0.01 | 0.56 | <0.01 | 1.43 | / | / | / | / | Yes | ||
| miR-188/CLCN5 | <0.01 | 0.67 | 0.22 | 1.05 | / | / | / | / | Yes | ||
| miR-148b/COPZ1 | <0.01 | 0.65 | <0.01 | 2.49 | 0.15 | 0.04 | / | / | Yes | ||
| miR-26b/CTDSP1 | <0.01 | 0.60 | <0.01 | 1.29 | / | / | 0.16 | 0.04 | Yes | ||
| miR-15b/SMC4 | <0.01 | 1.50 | <0.01 | 4.06 | 0.21 | 0.03 | / | / | Yes | ||
| miR-224/GABRE | <0.01 | 2.37 | <0.01 | 3.76 | 0.26 | 0.01 | 0.29 | <0.01 | Yes | ||
| miR-128-2/ARPP21 | <0.01 | 1.50 | <0.01 | 1.13 | / | / | / | / | No | ||
| miR-139/PDE2A | <0.01 | 0.58 | <0.01 | 0.77 | / | / | / | / | Yes | ||
| miR-27b/C9orf3 | <0.01 | 0.67 | 0.04 | 0.91 | / | / | 0.22 | <0.01 | No | ||
aFor the analysis of miRNA/host gene pairs in tumor vs. non-tumor, the paired t-test was performed. bFor the analysis of pairs in tumor and non-tumor, Pearson correlation was performed. Only significant positive correlation was listed. cSignals were annotated by H3K4me3 ChIP-seq from ENCODE database. The detailed information was in Table S6. Pairs in grey shadow were discordant pairs while pairs without shadow were concordant pairs based on analysis of tumors vs. non-tumors.
To investigate the potential regulatory factors of these 14 intronic miRNAs and their respective host genes, we identified their gene surrogates via a global correlation analysis of these miRNAs and host genes with the entire mRNA transcriptome as we did before [21, 24]. We used the readings of tumor vs. non-tumor for each gene in 176 HCC cases for analysis and detailed methods were described in Materials and Methods part. An average of 656 gene surrogates were identified and used for the prediction of potential regulatory factors of 14 intronic miRNAs and their host genes. IPA revealed that the intronic miRNA and host gene in all 14 pairs presented mainly distinct transcriptional regulatory factors. Quadratic weighted inter-rater agreement (kappa) test further showed that tumor-related intronic miRNAs had very poor consistency/agreement of upstream transcription factors with their host genes (Table S5, kappa value<0.2). As a control, we have also performed the same analysis for miRNA cluster miR106b-93 and cluster miR-30c-1-30e, since miR-106b and miR-93 were co-transcribed [14] while miR-30c-1 and miR-30e had the highest correlation (Table S3). As shown Table S5, kappa values were much higher for these two clusters, indicating the consistency of upstream transcription factors for miRNA pairs in these two clusters.
Moreover, we examined the upstream regulatory elements of these tumor-related intronic miRNAs via investigating the existence of possible promoter signals in the upstream of the precursor miRNAs and 0.5kb downstream from the TSS of host gene. ENCODE ChIP-seq data were used to annotate the H3K4me3 promoter activity in this region. The annotation revealed that all of 9 intronic miRNAs from discordant pairs and 3 out of 5 intronic miRNAs from concordant pairs had additional H3K4me3 peaks in the defined regions (Table 2, Table S6). Within the 5kb upstream region of miRNA precursor, additional H3K4me3 peaks presented in 6 out of 9 intronic miRNAs from discordant pairs (66.7%, 4 showing strong peaks and 2 showing weak peaks) and 1 out of 5 intronic miRNAs from concordant pairs (20%). These indicated that many intronic miRNAs had potential proximal promoters, which were different from host gene promoters. Collectively, these tumor-related intronic miRNAs from the discordant pairs were likely to have the separated transcriptional regulation compared with their corresponding host genes.
Experimental validation for the discordant expression of intronic miR-26s/CTDSPs pairs
Among nine tumor-related intronic miRNAs from discordant pairs, all of three miR-26 family members were listed, i.e., miR-26a-1, miR-26a-2 and miR-26b (Table 2). Interestingly, three members of miR-26 family also situate in the introns of a protein family termed CTDSPs (Fig 2A). We thus select miR-26s for experimental validation on the discordant expression of intronic miRNA-host gene pairs. It has been shown that miR-26s were significantly down-regulated in HCC and recognized as important tumor suppressor genes to profoundly impact hepatic carcinogenesis [18, 34-37]. Both miR-26a-1 and miR-26a-2 serve as precursors for mature miR-26a while precursor mir-26b is the unique precursor for mature miR-26b.
The discordant expression of miR-26s and their host genes in HCC tissues and cell lines. (A) The genomic structure of co-localization for miR-26s and their host gene CTDSPs. (B) Relative expression of CTDSPs and miR-26s families in microarray dataset from 176 patients with HCC. (C) qRT-PCR analysis of CTDSPs and mature miR-26s in paired tumor and non-tumor tissues from 18 patients with HCC. Paired t-test was used. (D) qRT-PCR analysis of CTDSPs and mature miR-26s in human HCC cells. Eight HCC cell lines were 1- Hep3B, 2- SK-Hep1, 3- MHCC97, 4- HepG2, 5- SMMC7721, 6- HuH1, 7- HuH7, and 8- HuH4. (B,C,D) The experiments were performed in triplicates and results were shown as mean ± standard deviation.
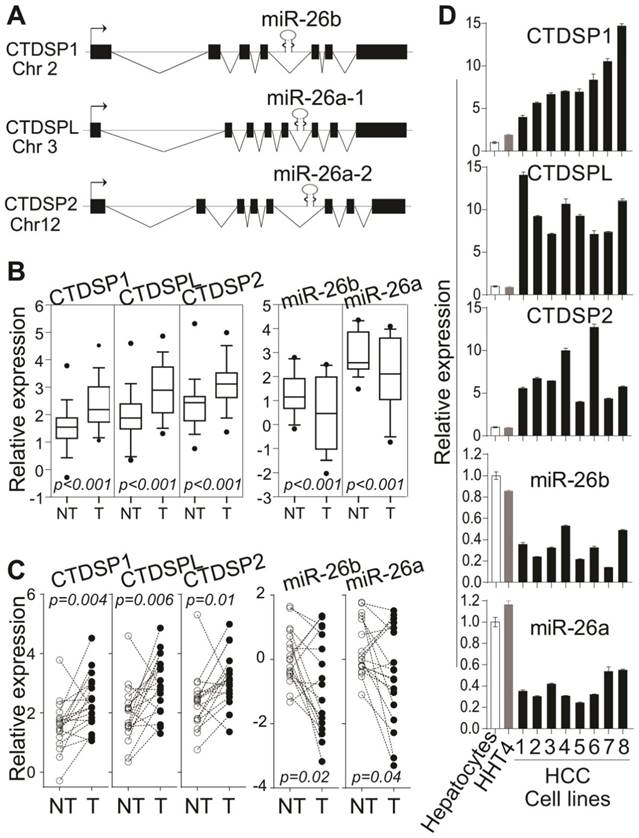
We have noticed the discordant expression of CTDSPs and miR-26s in LCS-HCC dataset (Fig 2B, Supplementary Fig 3). Quantitative RT-PCR data in 18 randomly selected HCC cases consistently demonstrated their discordant expression, which was that the expression of three CTDSPs was significantly elevated whereas the levels of miR-26s were significantly decreased in tumors (Fig 2C). Furthermore, such a discordant phenomenon was found in eight HCC cell lines, one immortalized hepatocyte cell line (HHT4) and normal human hepatocytes by qRT-PCR. As shown in Fig 2D, higher levels of CTDSPs and lower levels of miR-26s were observed in HCC cells compared to normal human hepatocytes as well as immortalized hepatocytes. Taken together, intronic miR-26s and their corresponding host genes CTDSPs were discordantly expressed in HCCs.
MiR-26b has an independent primary transcript unit from its host gene CTDSP1
We then experimentally investigated whether primary mir-26b was transcribed using the proximal promoter but not the CTDSP1 promoter. A 5'-RACE assay was applied to determine the transcription start site of miR-26b. HuH7 cells were used due to their high CTDSP1 and low miR-26b expression levels. We identified a ~1.4kb transcript from the nested reverse miR-26b gene specific primer (Fig 3A). Sequencing this transcript revealed that the TSS of miR-26 aligned at intron 1 (1032 bp next to the first exon) of CTDSP1, and was also ~1.5kb upstream of the mature miR-26b sequence (Fig 3A, right panel).
Intronic miR-26b's transcriptional start site and promoter region were independent from its host gene CTDSP1. (A) 5'-RACE assay in HuH7 cells with Myc and Drosha silencing identified the TSS of primary mir-26b transcript. Left panel was the gel image of the 5'-RACE products of miR-26b. Right panel was the schematic representation of primary mir-26b transcript and its position relative to CTDSP1. (B) ENCODE histone marker profiling data near the chromosome region of CTDSP1 and miR-26b in HepG2 cells. (C) ChIP assay of H3K4me3 and H3K36me3 in the region near the primary mir-26b TSS in HuH7 cells. Four PCR amplicons were designed. β-Actin chromatin immunoprecipitate was used as negative control.
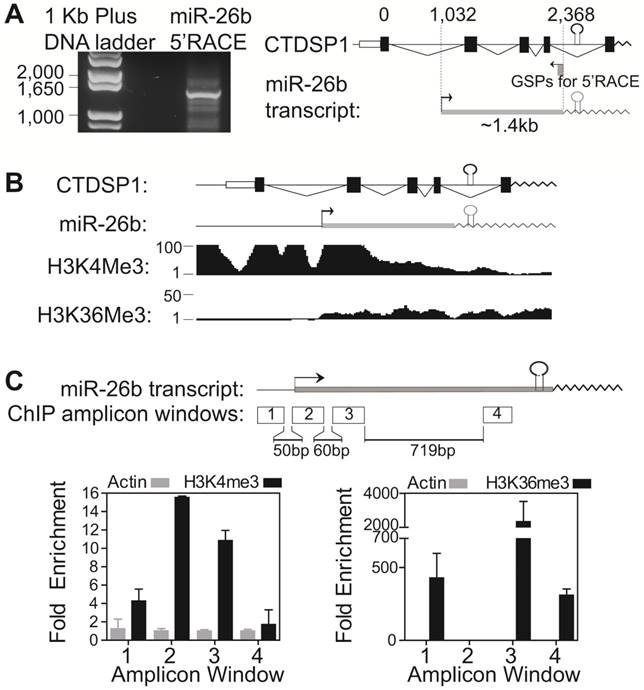
Fig 3B showed ENCODE histone marker profiling data in the upstream of miR-26b TSS and the promoter region of CTDSP1 transcript. Besides the CTDSP1 promoter, there was a strong promoter signal, strong H3K4me3 binding peak and weak H3K36me3 peak, in intron 1 of CTDSP1, near the proposed TSS of primary mir-26b in several cell lines, including HepG2 (HepG2 in Fig 3B; all other cells in Supplementary Fig 4A). The ENCODE ChIP-seq data identified abundant binding sites of transcription factors and RNA polymerase II in this region (Supplementary Fig 4B). Correspondingly, we performed the ChIP assay using anti-H3K4me3 and anti-H3K36me3 antibodies in HuH7 cells to validate the promoter activity near the TSS of primary mir-26b. Four amplicons around the miR-26b TSS were designed (Fig 3C). We found a substantially increased tri-methylation signal of H3K4 and decreased tri-methylation signal of H3K36 in the 200bp region next to the identified miR-26 TSS, stating a strong promoter signal of this identified TSS surrounding region. Together, our results demonstrate that the miR-26b primary transcript has a distinct TSS which is independent from its host gene CTDSP1.
Consistently, primary mir-26b expressed at a lower level while primary CTDSP1 presented a higher level in 8 HCC cell lines compared to these in hepatocytes (Supplementary Fig 5), further indicating the independent transcription of miR-26b from CTDSP1.
Myc specifically suppressed the expression of miR-26b but not its host gene CTDSP1
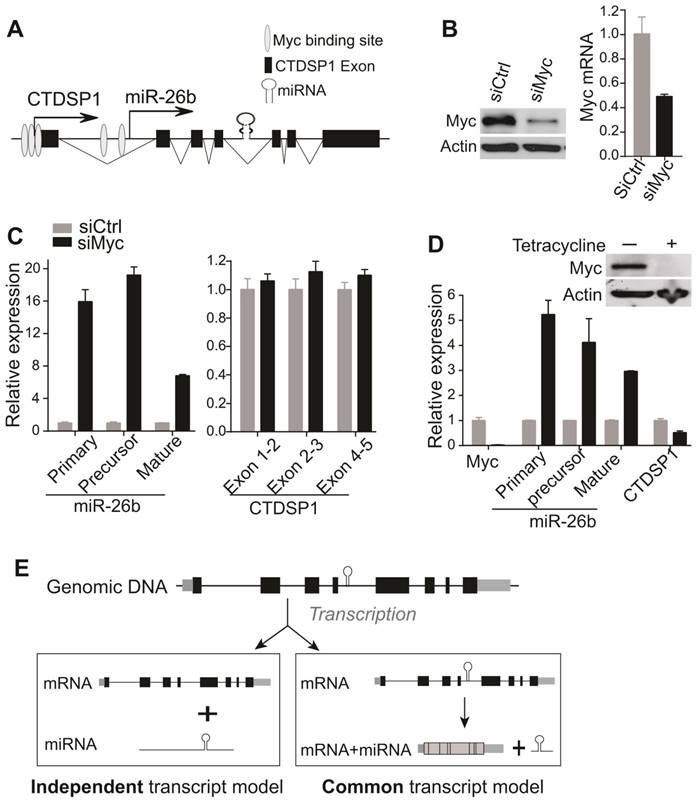
We further examined whether any regulatory factors could uniquely alter the expression of miR-26b but not CTDSP1. It has been reported that Myc repressed the expression of miR-26 family in human P493-6 B lymphoma cells, expressing tetracycline (tet)-repressible Myc [31]. Meanwhile, literature and ENCODE ChIP data have revealed several putative Myc binding sites within the 2kb region in front of the miR-26b TSS (UCSC genome browser) [31] (Fig 4A, Supplementary Fig 4B). We thus reasoned that Myc might be such a regulatory factor. To test this, Myc siRNA was transfected in HuH7 cells and resulted in reduced Myc expression (Fig 4B). As shown in Fig 4C, HuH7 cells with a reduced level of Myc had remarkably increased levels of primary mir-26b, precursor mir-26b and mature miR-26b. Consistent with our hypothesis, the CTDSP1 level represented by several primer/probe sets was not altered following Myc silencing (Fig 4C). Furthermore, such a phenomenon was also investigated in P493-6 cells. Silencing Myc in P493-6 via the addition of tetracyclin significantly induced levels of primary mir-26b, precursor mir-26b and mature miR-26b transcripts, but not CTDSP1 (Fig 4D). As a control, silencing CTDSP1 via siRNA technology significantly reduced the expression of CTDSP1, but not the level of primary mir-26b (Data not shown). Meanwhile, over-expressing Myc in HuH7 cells and HL-7702 cells also consistently reduced the level of miR-26b but did not change the expression of CTDSP1 (Supplementary Fig 6). Together, our results indicate that Myc specifically inhibited miR-26b but not CTDSP1 at the transcriptional level.
Myc inhibited miR-26b expression at the transcriptional level but not CTDSP1 expression. (A) The putative Myc binding sites evidenced by literature and ENCODE ChIP data in the 2kb region in front of miR-26b TSS site. (B) Myc was evaluated at protein (left panel) and mRNA (right panel) levels in HuH7 transfected with Myc siRNA. (C) The expression of primary, precursor and mature miR-26b transcripts was examined in HuH7 cells transfected with Myc siRNA through qRT-PCR. CTDSP1 was examined using three different sets of primers and probes covering its Exon 1-2, Exon 2-3 and Exon 4-5. (D) The expression of Myc, miR-26b, and CTDSP1 (Exon 1-2) was examined by qRT-PCR in P493-6 cells with and without the presence of tetracycline. Myc was also examined with Western blot. (E) The schematic diagram of potential transcriptive models for intronic miRNAs. At the genomic level, intronic miRNA and “host gene” are co-localized. In the common transcript model, the intronic miRNA is co-transcribed with its host gene and the precursor miRNA is then processed by mRNA spliceosome and Drosha. In the independent transcript model, the primary miRNA and host gene are transcribed in an independent manor from their own un-related TSSs. Subsequently, it is sequentially processed by Drosha and Dicer to produce mature miRNA via precursor miRNA. The independent transcript model represents a more flexible transcriptional regulatory mechanism of intronic miRNAs.
Furthermore, we examined whether any other regulatory factors could alter the expression of intronic miRNAs and their host genes differently. We have used the miRNA and mRNA transcriptome data of MCF-7 and MDA-MB-231 cells with 6 hours and 48 hours of ATAR treatment. In this Cells_ATRA dataset, there were 142 intronic miRNAs and their host genes being identified. After treatments, expression levels of 63%-80% of intronic miRNAs showed discordant alteration with their corresponding host genes among different cells and different time points (Supplementary Fig 7). These indicated that the transcriptional regulatory factors and elements for many intronic miRNAs were possibly distinct from their host genes.
Discussion
After being discovered in 1993 via studies on Caenorhabditis elegans [1], miRNAs have been recognized to have a conserved biogenesis pathway and present broad functional significance throughout the plant and animal kingdoms. Now there are about 2000 human microRNAs recorded in miRBase. Recent work has begun to clarify our understanding of the transcriptional regulation of miRNA expression.
MiRNAs are encoded in the genome in various contexts: they can be expressed from intronic or intergenic transcripts, which may encode a single miRNA hairpin precursor, or clusters of multiple precursors. At the transcriptional level, both canonical intronic miRNAs and the recently reported mirtrons (derived from short intronic hairpins and used splicing to bypass Drosha cleavage [38]) were believed to share the transcript units with their corresponding host genes, and to be under the influence of shared transcriptional regulatory mechanisms. Therefore, intronic miRNAs should have highly consistent expression with their host genes. This is called “common transcript” model of intronic miRNAs (Fig 4E).
However, intronic miRNA transcriptional regulation appears to be a very complex process, and differential expression patterns between several intronic miRNAs and their host genes in Drosophila have been observed [8, 9]. Computational methods have predicted that about one third of human intronic miRNAs occupied independent promoters from their host genes [7, 10-13]. These indicate the existence of a potential intronic miRNA “independent transcript” model (Fig 4E). Utilizing the available high throughput transcriptome data for both miRNA and mRNA in a large scale of tumor and non-tumor specimens from human patients, our work revealed that these pairs were largely discordant in expression in either tumor or non-tumors and had inconsistent alterations in tumors vs. non-tumors. These indicated that the discordant expression of intronic miRNA and their host genes was unlikely an exception for a few pairs but a common phenotype. Furthermore, the discordant expression of representative miR-26s/CTDSPs miRNA/host gene pairs was validated in both human HCC specimens and cell lines. We have also experimentally identified the distinct transcript unit of miR-26b with a separate TSS from its host gene, and found that Myc uniquely reduced the transcript of miR-26b but not CTDSP1. Meanwhile, most intronic miRNAs with significantly altered expression levels in tumors vs. non-tumors appeared to have distinct up-stream regulators and additional proximal promoter signals. Thus, our data strongly supports the existence of the intronic miRNA “independent transcript” modal.
Although it is very likely that the intronic miRNA “independent transcript” model was an important mechanism leading to discordant expression of intronic miRNAs and their host genes, other mechanisms might also contribute to such a phenomenon. For example, studies have reported that alternative splicing contributed to the uncoupled expression of intronic miRNAs and their host genes [14, 39]. Systematic studies on exon array and miRNA array data in the same sample set with and without certain treatments might reveal to what extent intronic miRNAs are transcribed via their own transcriptional machinery, or co-expressed with the host genes together then splicing, or transcribed with only certain variants of the host genes (i.e., alternative splicing mechanism). Such a study will also offer a better understanding on whether, in certain condition, the common transcript model or the independent transcript model was dominant, and on the potential relationship of these two models.
Besides the uncoupling expression levels of intronic miRNAs and their relevant host genes, we have also noticed their distinct biological roles. In LCS_HCC cohort, using the positively or negatively correlated gene surrogates of 14 tumor-related intronic miRNAs and their host genes, the GO enrichment analysis was performed. The enriched top 15 biological process of GO analysis revealed that most of intronic miRNAs participate in distinct biological functions with their host genes (Supplementary Fig 8). For the pairs of miR-26s/CTDSPs, miR-26a/b had been recognized as important tumor suppressor genes in various cancer, such as HCC, breast cancer, and prostate cancer, to inhibit cell proliferation, invasion, metastasis, and angiogenesis and induce apoptosis [18, 34, 40-42]. Conversely, CTDSPs seemed to express higher in tumors compared to non-tumors from several cancers, including pancreatic cancer, glioma and sarcomas, as well as HCCs [43-47] (Fig 2). Meanwhile, altering the level CTDSP1 in HuH7 cells did not influence cell proliferation (Data not shown). Thus, genes from the discordant pairs likely displayed distinct roles in carcinogenesis. In addition, we have also noticed that CTDSP1 and miR-26b did not alter the expression of each other, and either silencing CTPSP1 or over-expressing CTDSP1 in HuH7 cells did not alter the role of miR-26s in inhibiting cell colony formation (Data not shown). Nevertheless, to conclude whether genes from discordant pairs could interact with each other and consequently contribute to carcinogenesis, future comprehensive works will be needed via focusing on unique discordant pairs to certain tumor type and exploring the roles of their interactions in carcinogenesis.
In conclusion, our results indicate that intronic miRNAs and their respective host genes were commonly discordant in expression. The intronic miRNA “independent transcript” model might be principally responsible for such an inconsistent expression and allow intronic miRNAs to remain functional in situations where the regulatory region or factors influencing host genes were changed, or vice versa. Experimentally, we have also successfully identified the independent TSS, promoter activity, and transcriptional regulatory factor of miR-26b. Our findings deepen the existing knowledge of miRNA transcriptional regulation and help us work towards understanding the complex and variable process of intronic miRNA biogenesis.
Supplementary Material
Supplementary figures and tables.
Acknowledgements
The authors thank Dr. Joshua T Mendell from UT Southwestern Medical Center in US for offering P493-6 cells, Dr. Xin Chen from UC San Francisco for offering plasmids Myc-PT3EF1a and control PT3EF1a, and Dr. Hui-Chuan Sun from Fudan University in China for his critical reading. We also sincerely appreciated the support from the Bioinformatics core facility at University of Hawaii Cancer Center for the using of the Ingenuity pathway analysis system.
This work was supported by the Thousand Young Talents Plan of China, National Natural Science Foundation of China [No.81672905], the Fundamental Research Funds for the Central Universities [No. 2016QN81012], Chinese Key Project for the Infectious Diseases [No. 2016ZX10002020-008], and the intramural research program of the center for cancer research, the U.S. National Cancer Institute [Z01-BC 010313].
Competing Interests
The authors have declared that no competing interest exists.
References
1. Lee RC, Ambros V. An extensive class of small RNAs in Caenorhabditis elegans. Science. 2001;294:862-4
2. He L, Hannon GJ. MicroRNAs: small RNAs with a big role in gene regulation. Nature reviews Genetics. 2004;5:522-31
3. Lee Y, Kim M, Han J, Yeom KH, Lee S, Baek SH. et al. MicroRNA genes are transcribed by RNA polymerase II. The EMBO journal. 2004;23:4051-60
4. Varol N, Konac E, Gurocak OS, Sozen S. The realm of microRNAs in cancers. Molecular biology reports. 2011;38:1079-89
5. Baskerville S, Bartel DP. Microarray profiling of microRNAs reveals frequent coexpression with neighboring miRNAs and host genes. Rna. 2005;11:241-7
6. Rodriguez A, Griffiths-Jones S, Ashurst JL, Bradley A. Identification of mammalian microRNA host genes and transcription units. Genome research. 2004;14:1902-10
7. Ji J, Yamashita T, Budhu A, Forgues M, Jia HL, Li C. et al. Identification of microRNA-181 by genome-wide screening as a critical player in EpCAM-positive hepatic cancer stem cells. Hepatology. 2009;50:472-80
8. Aboobaker AA, Tomancak P, Patel N, Rubin GM, Lai EC. Drosophila microRNAs exhibit diverse spatial expression patterns during embryonic development. Proceedings of the National Academy of Sciences of the United States of America. 2005;102:18017-22
9. Xiong H, Qian J, He T, Li F. Independent transcription of miR-281 in the intron of ODA in Drosophila melanogaster. Biochemical and biophysical research communications. 2009;378:883-9
10. Ozsolak F, Poling LL, Wang Z, Liu H, Liu XS, Roeder RG. et al. Chromatin structure analyses identify miRNA promoters. Genes & development. 2008;22:3172-83
11. Corcoran DL, Pandit KV, Gordon B, Bhattacharjee A, Kaminski N, Benos PV. Features of mammalian microRNA promoters emerge from polymerase II chromatin immunoprecipitation data. PloS one. 2009;4:e5279
12. Monteys AM, Spengler RM, Wan J, Tecedor L, Lennox KA, Xing Y. et al. Structure and activity of putative intronic miRNA promoters. Rna. 2010;16:495-505
13. Marsico A, Huska MR, Lasserre J, Hu H, Vucicevic D, Musahl A. et al. PROmiRNA: a new miRNA promoter recognition method uncovers the complex regulation of intronic miRNAs. Genome biology. 2013;14:R84
14. Ramalingam P, Palanichamy JK, Singh A, Das P, Bhagat M, Kassab MA. et al. Biogenesis of intronic miRNAs located in clusters by independent transcription and alternative splicing. Rna. 2014;20:76-87
15. Croce CM. Causes and consequences of microRNA dysregulation in cancer. Nature reviews Genetics. 2009;10:704-14
16. Di Leva G, Garofalo M, Croce CM. MicroRNAs in cancer. Annual review of pathology. 2014;9:287-314
17. Budhu A, Jia HL, Forgues M, Liu CG, Goldstein D, Lam A. et al. Identification of metastasis-related microRNAs in hepatocellular carcinoma. Hepatology. 2008;47:897-907
18. Ji J, Shi J, Budhu A, Yu Z, Forgues M, Roessler S. et al. MicroRNA expression, survival, and response to interferon in liver cancer. The New England journal of medicine. 2009;361:1437-47
19. Ji J, Zhao L, Budhu A, Forgues M, Jia HL, Qin LX. et al. Let-7g targets collagen type I alpha2 and inhibits cell migration in hepatocellular carcinoma. Journal of hepatology. 2010;52:690-7
20. Ji J, Yamashita T, Wang XW. Wnt/beta-catenin signaling activates microRNA-181 expression in hepatocellular carcinoma. Cell & bioscience. 2011;1:4
21. Budhu A, Roessler S, Zhao X, Yu Z, Forgues M, Ji J. et al. Integrated metabolite and gene expression profiles identify lipid biomarkers associated with progression of hepatocellular carcinoma and patient outcomes. Gastroenterology. 2013;144:1066-75 e1
22. Parpart S, Roessler S, Dong F, Rao V, Takai A, Ji J. et al. Modulation of miR-29 expression by alpha-fetoprotein is linked to the hepatocellular carcinoma epigenome. Hepatology. 2014;60:872-83
23. Roessler S, Jia HL, Budhu A, Forgues M, Ye QH, Lee JS. et al. A unique metastasis gene signature enables prediction of tumor relapse in early-stage hepatocellular carcinoma patients. Cancer research. 2010;70:10202-12
24. Roessler S, Long EL, Budhu A, Chen Y, Zhao X, Ji J. et al. Integrative genomic identification of genes on 8p associated with hepatocellular carcinoma progression and patient survival. Gastroenterology. 2012;142:957-66 e12
25. Terao M, Fratelli M, Kurosaki M, Zanetti A, Guarnaccia V, Paroni G. et al. Induction of miR-21 by retinoic acid in estrogen receptor-positive breast carcinoma cells: biological correlates and molecular targets. J Biol Chem. 2011;286:4027-42
26. Ying SY, Lin SL. Current perspectives in intronic micro RNAs (miRNAs). Journal of biomedical science. 2006;13:5-15
27. Yu G, Wang LG, Han Y, He QY. clusterProfiler: an R package for comparing biological themes among gene clusters. Omics: a journal of integrative biology. 2012;16:284-7
28. Heintz C, Doktor TK, Lanjuin A, Escoubas C, Zhang Y, Weir HJ. et al. Splicing factor 1 modulates dietary restriction and TORC1 pathway longevity in C. elegans. Nature. 2017;541:102-6
29. Javierre BM, Burren OS, Wilder SP, Kreuzhuber R, Hill SM, Sewitz S. et al. Lineage-Specific Genome Architecture Links Enhancers and Non-coding Disease Variants to Target Gene Promoters. Cell. 2016;167:1369-84 e19
30. Ye QH, Qin LX, Forgues M, He P, Kim JW, Peng AC. et al. Predicting hepatitis B virus-positive metastatic hepatocellular carcinomas using gene expression profiling and supervised machine learning. Nature medicine. 2003;9:416-23
31. Chang TC, Yu D, Lee YS, Wentzel EA, Arking DE, West KM. et al. Widespread microRNA repression by Myc contributes to tumorigenesis. Nature genetics. 2008;40:43-50
32. Tang X, Zheng D, Hu P, Zeng Z, Li M, Tucker L. et al. Glycogen synthase kinase 3 beta inhibits microRNA-183-96-182 cluster via the beta-Catenin/TCF/LEF-1 pathway in gastric cancer cells. Nucleic acids research. 2014;42:2988-98
33. Knoll S, Furst K, Kowtharapu B, Schmitz U, Marquardt S, Wolkenhauer O. et al. E2F1 induces miR-224/452 expression to drive EMT through TXNIP downregulation. EMBO reports. 2014
34. Kota J, Chivukula RR, O'Donnell KA, Wentzel EA, Montgomery CL, Hwang HW. et al. Therapeutic microRNA delivery suppresses tumorigenesis in a murine liver cancer model. Cell. 2009;137:1005-17
35. Zhu Y, Lu Y, Zhang Q, Liu JJ, Li TJ, Yang JR. et al. MicroRNA-26a/b and their host genes cooperate to inhibit the G1/S transition by activating the pRb protein. Nucleic acids research. 2012;40:4615-25
36. Yang X, Liang L, Zhang XF, Jia HL, Qin Y, Zhu XC. et al. MicroRNA-26a suppresses tumor growth and metastasis of human hepatocellular carcinoma by targeting interleukin-6-Stat3 pathway. Hepatology. 2013;58:158-70
37. Yang X, Zhang XF, Lu X, Jia HL, Liang L, Dong QZ. et al. MicroRNA-26a suppresses angiogenesis in human hepatocellular carcinoma by targeting hepatocyte growth factor-cMet pathway. Hepatology. 2014;59:1874-85
38. Okamura K, Hagen JW, Duan H, Tyler DM, Lai EC. The mirtron pathway generates microRNA-class regulatory RNAs in Drosophila. Cell. 2007;130:89-100
39. Melamed Z, Levy A, Ashwal-Fluss R, Lev-Maor G, Mekahel K, Atias N. et al. Alternative splicing regulates biogenesis of miRNAs located across exon-intron junctions. Molecular cell. 2013;50:869-81
40. Koh CM, Iwata T, Zheng Q, Bethel C, Yegnasubramanian S, De Marzo AM. Myc enforces overexpression of EZH2 in early prostatic neoplasia via transcriptional and post-transcriptional mechanisms. Oncotarget. 2011;2:669-83
41. Liu XX, Li XJ, Zhang B, Liang YJ, Zhou CX, Cao DX. et al. MicroRNA-26b is underexpressed in human breast cancer and induces cell apoptosis by targeting SLC7A11. FEBS letters. 2011;585:1363-7
42. Zhang B, Liu XX, He JR, Zhou CX, Guo M, He M. et al. Pathologically decreased miR-26a antagonizes apoptosis and facilitates carcinogenesis by targeting MTDH and EZH2 in breast cancer. Carcinogenesis. 2011;32:2-9
43. Bracci PM, Zhou M, Young S, Wiemels J. Serum autoantibodies to pancreatic cancer antigens as biomarkers of pancreatic cancer in a San Francisco Bay Area case-control study. Cancer. 2012;118:5384-94
44. Chen X, Cheung ST, So S, Fan ST, Barry C, Higgins J. et al. Gene expression patterns in human liver cancers. Molecular biology of the cell. 2002;13:1929-39
45. Fischer U, Keller A, Leidinger P, Deutscher S, Heisel S, Urbschat S. et al. A different view on DNA amplifications indicates frequent, highly complex, and stable amplicons on 12q13-21 in glioma. Molecular cancer research: MCR. 2008;6:576-84
46. Mas VR, Maluf DG, Archer KJ, Yanek K, Kong X, Kulik L. et al. Genes involved in viral carcinogenesis and tumor initiation in hepatitis C virus-induced hepatocellular carcinoma. Molecular medicine. 2009;15:85-94
47. Su YA, Lee MM, Hutter CM, Meltzer PS. Characterization of a highly conserved gene (OS4) amplified with CDK4 in human sarcomas. Oncogene. 1997;15:1289-94
Author contact
![]() Corresponding authors: Dr. Junfang Ji, Life Sciences Institute, Zhejiang University, 866 Yuhangtang Road, Hangzhou, Zhejiang Province, China 310058, Tel: +86 571 88208956, Email: junfangjiedu.cn; Or Dr. Xin Wei Wang, National Cancer Institute, 37 Convent Drive, MSC 4258, Bethesda, MD, USA 20892, Tel: +1 240-760-6858, Email: xw3ugov
Corresponding authors: Dr. Junfang Ji, Life Sciences Institute, Zhejiang University, 866 Yuhangtang Road, Hangzhou, Zhejiang Province, China 310058, Tel: +86 571 88208956, Email: junfangjiedu.cn; Or Dr. Xin Wei Wang, National Cancer Institute, 37 Convent Drive, MSC 4258, Bethesda, MD, USA 20892, Tel: +1 240-760-6858, Email: xw3ugov