Impact Factor ISSN: 1449-2288
- Issue 11; 2026
- Issue 10; 2026
- Issue 9; 2026
- Issue 8; 2026
- Issue 7; 2026
- Volume 22; 2026
- Past Issues
- Advance Articles
- Editorial Board
- Cover Images
- Index & Coverage
- Cover Suggestion
- Special Issues
Introduction
Materials and Methods
Results
Discussion
Conclusions
Supplementary Material
Acknowledgements
References

 Global reach, higher impact
Int J Biol Sci 2018; 14(8):833-842. doi:10.7150/ijbs.24816 This issue Cite
Research Paper
Genome-wide Analyses on Single Disease Samples for Potential Biomarkers and Biological Features of Molecular Subtypes: A Case Study in Gastric Cancer
Wei Zeng1,2,3,5, Nini Rao1,2,3,4 ![]() , Qian Li1,2,3, Guangbin Wang1,2,3, Dingyun Liu1,2,3, Zhengwen Li1,2,3, Yuntao Yang1,2,3
, Qian Li1,2,3, Guangbin Wang1,2,3, Dingyun Liu1,2,3, Zhengwen Li1,2,3, Yuntao Yang1,2,3
1. Center for Informational Biology, School of Life Science and Technology, University of Electronic Science and Technology of China, Chengdu 610054, China.
2. School of Life Science and Technology, University of Electronic Science and Technology of China, Chengdu 610054, China.
3. Key Laboratory for NeuroInformation of the Ministry of Education, University of Electronic Science and Technology of China, Chengdu 610054, China.
4. Institute of Electronic and Information Engineering of UESTC in Guangdong, Dongguan, 523808, China.
5. Department of Biomedical Engineering, School of Automation and Information Engineering, Sichuan University of Science and Engineering, Zigong, 643000, China
Received 2018-1-8; Accepted 2018-3-6; Published 2018-5-22
Abstract

Purpose: Based on the previous 3 well-defined subtypes of gastric adenocarcinoma (invasive, proliferative and metabolic), we aimed to find potential biomarkers and biological features of each subtype.
Methods: The genome-wide co-expression network of each subtype of gastric cancer was firstly constructed. Then, the functional modules in each genome-wide co-expression network were divided. Next, the key genes were screened from each functional module. Finally, the enrichment analysis was performed on the key genes to mine the biological features of each subtype. Comparative analysis between each pair of subtypes was performed to find the common and unique features among different subtypes.
Results: A total of 207 key genes were identified in invasive, 215 key genes in proliferative, and 204 key genes in metabolic subtypes. Most key genes in each subtype were unique and new findings compared with that of the existing related researches. The GO and KEGG enrichment analyses for the key genes of each subtype revealed important biological features of each subtype.
Conclusions: For a subtype, most identified key genes and important biological features were unique, which means that the key genes can be used as the potential biomarker of a subtype, and each subtype of gastric cancer might have different occurrence and development mechanisms. Thus, different diagnosis and therapy methods should be applied to the invasive, proliferative and metabolic subtypes of gastric cancer.
Keywords: Genome-wide co-expression network, Molecular subtype, Key genes, Potential biomarker, Single disease samples
Introduction
Gastric cancer is a common tumor of the digestive system and is prevalent worldwide. Its morbidity and mortality are greater compared with other tumors. Gastric cancer is a highly heterogeneous tumor with discrepancies in biology and genetics, thus subtype classification of gastric cancer is essential for patients, because it can provide personalized treatment for patients and guide the selection of drugs. Substantial effort has been made to classify the molecular subtypes of gastric cancer. For example, based on histopathologic and anatomic criteria, Shah et al. 1 classified gastric cancer into three subtypes: proximal, diffuse, and distal gastric cancers using gene expression profiles of 38 gastric tumor samples and 31 normal samples taken from stomach tissues adjacent to cancerous tissue. Based on the gene expression profiles of 37 gastric cancer cell lines, Tan et al. 2 divided gastric cancer into two major intrinsic genomic subtypes: G-INT and G-DIF. These subtypes were validated in primary tumors from 521 patients in four independent cohorts. The G-INT subtypes were prognostic of survival. The G-INT cell lines were significantly more sensitive to 5-fluorouracil and oxaliplatin, but more resistant to cisplatin, than the G-DIF cell lines. Song et al. 3 used integrated analysis of microRNA and mRNA expression profiles of 90 gastric cancer cases to identify two gastric cancer microRNA subtypes: mesenchymal and epithelial. The mesenchymal subtype is significantly associated with poor overall survival in gastric cancer. In 2014, The Cancer Genome Atlas (TCGA) published a paper about gastric cancer molecular classification in the journal Nature4. They obtained gastric adenocarcinoma primary tumor tissues from 295 patients not treated with prior chemotherapy or radiotherapy, and characterized samples using six molecular platforms: array-based somatic copy number analysis, whole-exome sequencing, array-based DNA methylation profiling, messenger RNA sequencing, microRNA sequencing and reverse-phase protein array. They defined four subtypes of gastric adenocarcinoma: EBV-infected tumors, MSI tumors, genomically stable tumors, and chromosomally unstable tumors.4 When Lei et al. 5 used a robust method of unsupervised clustering and consensus hierarchical clustering with iterative feature selection to analyze gene expression profiles among 248 patients with gastric adenocarcinoma tumors, they identified three subtypes of gastric adenocarcinoma: proliferative, metabolic, and mesenchymal. Also, they validated the reproducibility and utility of the 3-subtype classification in an independent patient cohort and found that there were some differences in the clinical, pathology and molecular levels among the three subtypes.
In order to further achieve the aim guiding development of diagnosis and therapies tailored to the molecular subtypes of gastric cancer, we extended the studies of Lei et al. Based on the 3 well-defined sub-types of gastric adenocarcinoma: invasive, proliferative, and metabolic, we explored the findings of potential biomarker (also called as key genes with potential as a biomarker, short for key genes here) and biological features of each subtype. Experimentally identifying key genes in genome-wide is very time-consuming and laborious. Thus they are in general identified from gene expression data or network constituted with differentially expressed genes (DEGs) by mathematical theory. 6 However, most existing methods are based on the case-control data sets7-9, while the dataset of Lei et al. only had disease samples. In this study, we firstly constructed genome-wide co-expression networks for each gastric cancer subtype above, respectively and then divided each co-expression network into multiple functional modules. Next, we used two criterions10: degree of co-expression network and the correlation coefficient between the expression values of genes and eigengenes of module, to screen key genes of each subtype. Since the developed pipeline is able to extract the key gene set from gene expression profiles with single disease samples, it fits the data sets with single disease samples of Lei, et al. Finally, the biological features of each subtype are analyzed and compared. This extended study for the tailored molecular subtypes of gastric cancer may offer great help for improving diagnosis, treatments, and development of new drugs of gastric cancer.
Materials and Methods
Microarray data
Gene expression profile data was downloaded from the GEO database (Access No. GSE35809). It includes genome-wide mRNA expression data of 70 primary gastric cancer patients from Australia. These patients were classified into the invasive, proliferative and metabolic subtype groups developed by Lei. There were 26 samples in invasive, 29 samples in proliferative and 15 samples in metabolic subtypes. The invasive subtype was also mentioned as a mesenchymal subtype in the study published by Lei.5 After preprocessing, we obtained 21,212 gene expression data in each sample. The names of 21,212 genes in the three subtypes were the same, and their expression data was used to construct genome-wide co-expression networks.
Identifying key genes of each subtype
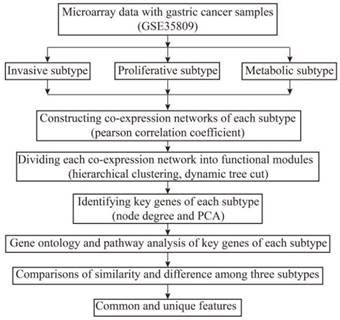
It is an overview of analysis pipeline in Fig. 1. The analysis to obtain key genes for each subtype was performed using the WGCNA (weighted gene co-expression network analysis, WGCNA) package in R. The co-expression network was firstly constructed using the WGCNA package.11 The relationship between a gene pair in the co-expression network is based on Pearson correlation coefficient (CC), thus the threshold value of the CC to construct relationship between a gene pair is very important. If the threshold is set too low, it will increase the number of potential connections between genes, including many false connections. If the threshold is set too high, many biologically relevant connections between genes would not be identified. In this study, the scale-free topology feature of the constructed network is used to determine the threshold value. Then, hierarchical clustering was used to divide the genome-wide co-expression network into the functional modules. The functional modules are clusters of highly correlated genes because the constructed genome-wide co-expression network of each subtype is an unsigned network. Finally, principal component analysis (PCA) was performed on the gene expression profile of each functional module. The eigengene of each functional module was extracted, and is defined as the first principal component of a given functional module.
Overview of analysis pipeline
The importance of a gene in a functional module can be measured by the degree of gene node, which is the number of edges between this gene node and other gene nodes. Usually, the larger the degree of a gene is, the greater the roles of this gene is in the functional module.12 On the other hand, the CC between the expression values of a gene and the eigengene of a functional module is also used to measure the importance of a gene in a functional module.13 Thus, we screened two groups of gene sets according to the degree numbers of genes in a functional module and the CCs between the expression values of genes and the eigengene of this functional module, respectively. The degree-based gene set was composed of genes whose degree was ranked in the top 10 in a functional module. The CC-based gene set consisted of genes whose CCs between the expression values of the gene and the functional module eigengene was ranked in the top 10 in this functional module. The common genes in both groups were selected as the key genes of a subtype. Furthermore, we compared the key genes of each subtype after identifying them.
Functional analysis of key genes
In order to understand the functions of key genes in each subtype, they were used to enrich the gene ontology terms and pathways by KEGG in DAVID (version 6.7). We explained the functions of key genes based on analysis of the enriched gene ontology (gene ontology, GO) terms and pathways.
Screening of differentially expressed genes among subtypes
Some key genes in each subtype were differentially expressed between two subtypes, while others were not differentially expressed because the key genes were identified from the single disease samples. Since the differentially expressed genes (DEGs) are associated with the unique pathophysiological mechanism of a subtype, we also compared the DEGs in key genes between any two subtypes. Differentially expressed genes between two subtypes were screened by t-test and fold change (P-value ≤ 0.05, fold change ≥ 2). We performed the multi-test corrections for the P-values (FDR≤ 0.01).
Results
The identified key genes of each subtype
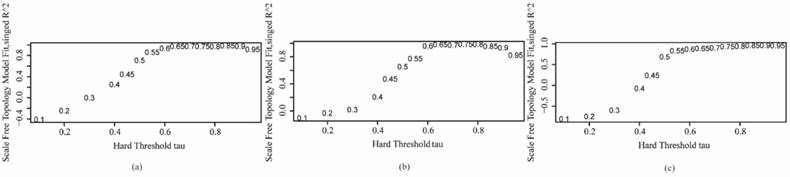
The genome-wide co-expression network of each subtype was constructed using its preprocessed microarray gene expression data. For the purpose of comparing among subtypes, the threshold values remained the same when constructing the co-expression networks of each subtype. The bionetwork is not a random network, and it displays a scale-free feature. Thus, the selected CC threshold should make all co-expression networks satisfy scale-free topology. The scale-free topology graphs of invasive, proliferative and metabolic subtype under the selected threshold are shown in Fig. 2, in which R^2 in the vertical ordinate is the scale-free topology model fitting index. It is the square of the CC between ln(p(k)) and ln(k), and it regresses ln(p(k)) on ln(k). k is the node degree, and p(k) is the probability of this node degree. R^2 is used to measure how well a network satisfies a scale-free topology. If R^2 gets close to 1, there is a straight-line relationship between ln(p(k)) and ln(k). The closer to 1 the R^2 is, the better the network under the threshold value corresponding to R^2 satisfies scale-free topology.11 The tau (the threshold value) in the horizontal ordinate is used to decide the relationship between genes. When the CC between genes is greater than the threshold tau, the genes are related. Otherwise the genes are not related. In our work, when tau is 0.6, R^2 is 0.935 in invasive subtype networks, 0.958 in the proliferative subtype, and 0.869 in the metabolic subtype. This illustrates that the network models of the three subtypes satisfy a scale-free topology well when tau is 0.6. There were 21,212 nodes and 2,970,768 edges in the genome-wide co-expression network of the invasive subtype, 21,212 nodes and 23,933,671 edges in the metabolic subtype, and 21,212 nodes and 811,583 edges in the proliferative subtype. However, only 11 nodes in the proliferative subtype were isolated, meaning that these 11 nodes are not interrelated with other nodes.
Scale-free topology graphs of three subtypes of co-expression networks. (a) invasive; (b) proliferative; (c) metabolic
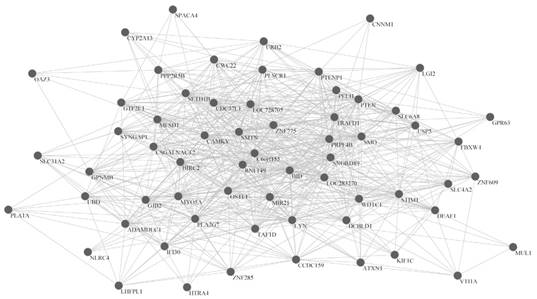
Hierarchical clustering was used to divide the genome-wide co-expression network into functional modules. There were 24 functional modules in the invasive subtype, 24 functional modules in the proliferative subtype and 26 functional modules in the metabolic subtype. Genes included in the functional modules of each subtype are shown in Table S1. Fig. 3 shows a co-expression functional module named invmodule21 in the invasive subtype, in which there are 63 genes.
Co-expression functional module named invmodule21 in invasive subtype
Finally, 207 genes were identified as the key genes of invasive, 215 genes for the proliferative and 204 genes for the metabolic subtypes (Table S2). In order to illustrate that the identified key genes were the potential biomarkers of each subtype, we used the K-mean clustering method and leave one cross validation technique to classify overall gastric cancer samples based on key genes of each subtype. When recognizing the invasive subtype by its key genes, the accuracy rate was 82.63%±9.17% (mean±standard deviation); the accuracy rate was 75.71%±0.63% in the proliferative subtype and 55.21%±3.32% in the metabolic subtype. The results showed that the key genes of the invasive and proliferative subtypes have stronger classification powers, while being weak for the key genes of the metabolic subtype (we will discuss this phenomenon in Discussion section).
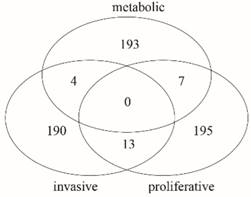
Furthermore, we made a comparative analysis among the key genes of three subtypes. The Venn diagram in Fig. 4 shows that there is no common gene among key genes of the three subtypes, but there were 13 common genes between invasive and proliferative, 7 common genes between proliferative and metabolic, and 4 common genes between invasive and metabolic. There were 190 unique genes in invasive, 195 unique genes in proliferative and 193 unique genes in metabolic. The comparison results are shown in Table S3. The proportion of unique genes is 91.79% in invasive, 90.70% in proliferative, and 94.61% in metabolic. Thus, there are few common genes between any two subtypes, but many unique genes for each subtype. It is possible that the unique genes in each subtype cause differences in the phenotype, especially those unique genes that are differentially expressed. This suggests that the three subtypes probably have different important biological features.
A comparative analysis among key genes of subtypes
The screened DEGs in key genes between two subtypes are shown in Table 1, which are classified as common and unique DEG genes. Some of these have been reported in the literature to be associated with the development of gastric cancer, and have been confirmed by biological experiments, as shown in bold in Table 1, for example, CDK122 and BUB1B29 between the invasive and proliferative subtypes, FHL124 and HMCN134 between the invasive and metabolic subtypes, and KIF1131 and KIT39 between the proliferative and metabolic subtypes. Therefore, the existing evidence supports our results, giving them high reliability.
The common and unique DEGs in the key genes between two subtypes
| Comparison type | Common genes | Subtype | unique DEGs |
|---|---|---|---|
| invasive and proliferative | ASPM14, C10orf91, C1orf173, CAPN14, G3BP215, IGKC, LOC100510044, OR7D2, PCOLCE, RAB5A16, RALYL17, SLC34A3, TPTE2P2 | invasive | ARHGAP15, CAP2, CDCA8, CDK122, CENPA, CLDN123, COL14A1, DARC, DLGAP5, FERMT2, FHL124, FLNA25, KIF1418, KIF2C, KIF4A26, LAMA2, MAGEA2, MAGEA2B, RAB2327, SMYD1, SPON1, STIP1, ZEB128 |
| proliferative | ACTA2, ACTG2, BUB1B29, C2orf40, CDCA519, CNN1,DES, HJURP,JAM330,KIF1131,KIF18B,KIF23,LMOD1,MCL1, MGP, MRGPRF, MYL9,NDN, NRAS32, NUSAP1, PDLIM3, SPOCK1, STON1, SYNM, SYNPO2, TAGLN33, ZCCHC24 | ||
| invasive and metabolic | CAPRIN1, EIF2AK3, IGLL5, KIF1418 | invasive | ARHGAP15, CAP2, COL14A1, CWH43, DARC, FERMT2, FHL124, FLNA25, HYAL1, LOC100130933, PCOLCE, PLAC8, PLEKHO1, PSAPL1, RAB2327, RAB34, SERPING1, SMYD1, SPON1, TC2N, TRIM50, ZEB128 |
| metabolic | ARMCX1, ASPN, BGN, CDH11, CFHR1, FCGR2B, GPM6A, HMCN134, ISL135, RCAN2, THY136, TIMP137, VCAN | ||
| proliferative and metabolic | BGN, CDCA519, GNA1320, KIF23, MCL121, VCAN, ZC3H11A | proliferative | ASPM14, BUB1B29, KIF1131, KIF18B, NUSAP1, SYNPO2, TFEC |
| metabolic | CCKBR38, CDHR2, CENPF, FAM54A, KIF1418, KIT39, LTF40, NEK241 |
The important biological features of each subtype based on gene ontology and pathway analysis
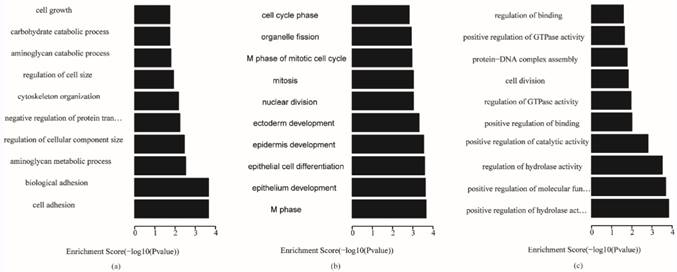
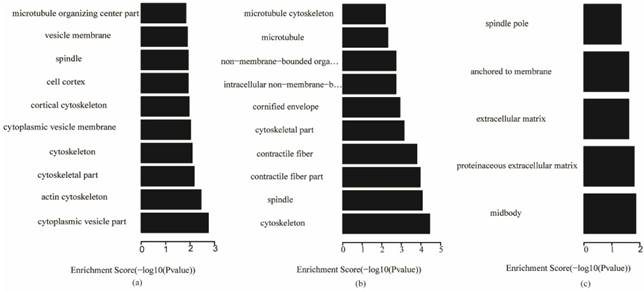
The key genes in each subtype were used to analyze gene ontology and KEGG (Kyoto Encyclopedia of Genes and Genomes, KEGG) pathways, and the P-value of enrichment terms was required to be less than 0.05. The enrichment analysis results are shown in Table S4. The most significant top 10 gene ontology terms in the biological process, cellular component and molecular function categories for the three subtypes are shown in Figs. 5-7, respectively, which reveal the important biological features of each subtype.
Biological process terms of gene ontology analysis of each subtype (a) invasive; (b) proliferative; (c) metabolic
Molecular function terms of gene ontology analysis of each subtype (a) invasive; (b) proliferative; (c) metabolic
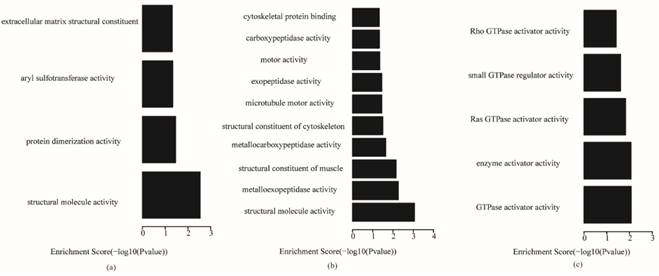
Fig. 5 shows that, for biological processes, the invasive subtype was mainly involved in cell adhesion and regulation of cell. M phase of mitotic cell cycle, epithelial cell differentiation and development and nuclear division were enriched for the proliferative subtype. Positive regulation of hydrolase activity and catalytic activity, cell division and cell cycle phase were enriched for the metabolic subtype. In Fig. 6, cytoplasmic vesicle membrane, cytoskeleton, and spindle are enriched in cellular components for the invasive subtype; cytoskeleton, spindle, and contractile fiber are enriched for the proliferative subtype; and midbody, extracellular matrix, and spindle pole are enriched for the metabolic subtype. In Fig. 7, structural molecule activity, protein dimerization activity, and extracellular matrix structural constituent are enriched in molecular function for the invasive subtype; structural molecule activity, microtubule motor activity, and exopeptidase activity are enriched for the proliferative subtype; and Ras GTPase activator activity, small GTPase regulator activity, and Rho GTPase activator activity are enriched for the metabolic subtype.
Cellular component terms of gene ontology analysis of each subtype (a) invasive; (b) proliferative; (c) metabolic
Some enriched terms in gene ontology analysis have been reported to be related with cancer in the literature. Research on gastric cancer currently focuses on identifying tumor biomarkers related to cell cycle regulation, apoptosis, tumor angiogenesis, tumor invasion, and metastasis, their roles in pathophysiology, and whether these can provide a scientific solution for early diagnosis and targeted therapy.42 The extracellular matrix is a physical barrier to tumor cells which migrate in tissue, so the degradation of the extracellular matrix is an essential step in tumor invasion and metastasis.43-44 Generally, cancer metastasis includes a series of molecules, involving growth factors, cell-adhesion molecules, matrix-degradation enzymes and motility factors. These molecules induce not only cell growth, but also the extracellular matrix degradation and angiogenesis that are important in tumor invasion and proliferation.45 Cell polarity and motility play an important role in tumor cell invasion and metastasis, and cell adhesion receptors are crucial in interactions between tumor cells and endothelial cells.46 Abnormal regulation of the cell cycle and changes in growth factor and cytokine expression levels regulate differentiation and survival of tumor cells. Mutated genes related to cell adhesion and angiogenesis are crucial in the invasion and metastasis of gastric cancer cells.47 Aberrant mitosis is the most common feature of cancer.48 Small GTPases of the Ras superfamily work as molecular switches controlling many intracellular processes, which include proliferation and differentiation, gene expression, signal transduction, vesicle trafficking, nuclear assembly, and reorganization of the cytoskeleton.49 Rho GTPase activity is related to the contraction of cells. Changes in fibroblastic morphologic of gastric cancer cells increased migration and invasion because of decreased cell-cell adhesion.50
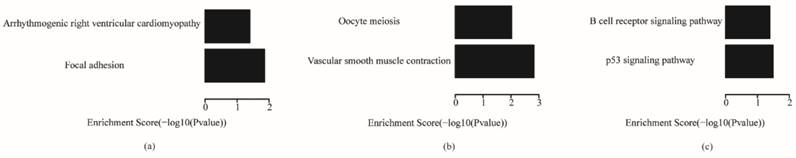
The enriched pathways for each subtype are shown in Fig. 8. Focal adhesion and arrhythmogenic right ventricular cardiomyopathy were enriched in the invasive subtype; oocyte meiosis and vascular smooth muscle contraction were enriched in the proliferative subtype; and B cell receptor signaling pathway and p53 signaling pathway were enriched in the metabolic subtype. Existing research showed that the focal adhesion molecules enriched in the invasive subtype are crucial for the establishment of the cytoskeleton and epithelial structures, so they are thought to regulate histological cell type, such as invasive activities of tumor cells.51 The p53 signaling pathway enriched in metabolic plays an important role in cancers, and mutations of genes in the p53 signaling pathway are the most common genetic changes in cancers.52
KEGG pathway analysis of each subtype (a) invasive; (b) proliferative; (c) metabolic
Comparison with the related work
Lei et al.5 used a robust method of unsupervised clustering and consensus hierarchical clustering with an iterative feature selection to analyze gene expression profiles among 248 patients with gastric tumors. They identified three subtypes of gastric adenocarcinoma: invasive, proliferative and metabolic subtypes. Also, they screened the subtype classification gene sets between any two subtypes. On this basis, we identified the key genes of each subtype and determined the important biological features of each subtype.
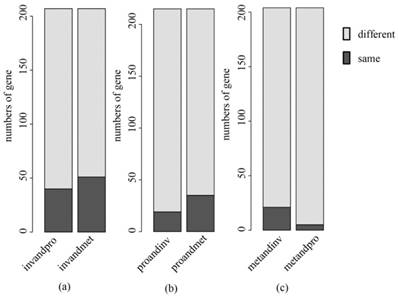
A comparative analysis was made between our key gene sets and the subtype classification gene sets selected by Lei.5 There were some of the same genes in the two sets (Table S2), but the proportion of these same genes in our key genes was low (Fig. 9). It is suggested that some new key genes of subtypes in gastric cancer have been identified. In Fig. 9, the deep color is the number of common genes contained in both gene sets, and the light color is the number of genes only contained in the key genes selected by us. As an example, the left bar in Fig. 9(a) represents the results in the comparative analysis between the key genes of invasive and subtype classification gene sets that can recognize invasive subtype from invasive and proliferative samples. The right bar represents the results between the key genes of invasive and subtype classification gene set that can recognize the invasive subtype from the invasive and the metabolic samples. The remaining figures are shown in the same manner. Moreover, we found new important biological features and pathways associated with invasive, proliferative and metabolic subtypes, which might be helpful for the personalized diagnosis and treatment of each subtype and the understanding of molecular mechanisms.
A comparative analysis between our key genes and the subtype classification gene sets (a) invasive; (b) proliferative; (c) metabolic
Discussion
We developed an integrated pipeline to identify key genes from gene expression profiles with single disease samples. Our method was different from the traditional ones: we did not identify key genes from the constructed genome-wide co-expression network directly; instead, we identified the key genes from all the functional modules of the genome-wide co-expression network. The reasons are that the key genes in a functional module may play a more important pathogenic role in disease development than key genes in the corresponding genome-wide co-expression network, and may thus be more effective as therapeutic targets.
From the comparisons of DEGs in the key genes between two subtypes, we found some interesting phenomena. In each comparison type in Table 1, there are always several genes (in bold) that have been confirmed by the literature to be associated with the development of gastric cancer. This enhances the feasibility of our results. KIF14 is a member of the kinesin family of proteins, which is localized at the central spindle and midbody. It is involved in cytokinesis and chromosome segregation, and has been found to be dysregulated in various cancer types.13 This DEG is not only a common gene between invasive and metabolic subtypes, but also a unique DEG of the invasive subtype between invasive and proliferative and a unique DEG of the metabolic subtype between proliferative and metabolic. We inferred that it plays a very important role in each subtype, but has different roles in the different subtypes. KIF14 deserves further study for understanding the mechanism of each subtype. Some DEGs were always differentially expressed between two subtypes, such as ARHGAP15, CAP2, COL14A1, DARC, FERMT2, FHL1, FLNA, RAB23, SMYD1, SPON1 and ZEB1 in the invasive subtype, which were differentially expressed between the invasive and proliferative subtypes and between the invasive and metabolic subtypes, respectively. In addition, BUB1B, KIF11, KIF18B, NUSAP1 and SYNPO2 in the proliferative subtype were differentially expressed between proliferative and invasive and between proliferative and metabolic, respectively. However, we did not find these kinds of genes in the metabolic subtype. The DEGs above in the invasive and proliferative subtypes are worthy to be investigated in further experimental studies.
In the unique DEGs, some genes from same family are scattered in different subtypes. For example, CDCA8 appeared in invasive and CDCA5 in proliferative, KIF14, KIF2C, KIF4A in invasive and KIF11, KIF18B, KIF23 in proliferative, KIF11, KIF18B in proliferative and KIF14 in metabolic, in which CDCA5, KIF14, KIF4A and KIF11 have been reported to be related with gastric cancer.18, 19, 26, 31 The kinesin family (KIF) localized at the central spindle and midbody consists of motor proteins. They are involved in the regulation of cytokinesis. Since gene family members have similar structures and functions, we conjectured that there may be some common biological features in those subtypes, which have genes from same family.
We explained the function of key genes through analyzing the enriched gene ontology terms and pathways. In the gene ontology analysis of key genes in the three subtypes, the invasive subtype was mainly involved in cell adhesion and regulation of cell size in biological processes, cytoplasmic vesicle membrane, cytoskeleton, and spindle in cellular components, and structural molecule activity, protein dimerization activity, and extracellular matrix structural constituent in molecular function. The proliferative subtype was mainly related with M phase of mitotic cell cycle, epithelial cell differentiation and development, and nuclear division in biological processes, cytoskeleton, spindle, and contractile fiber in cellular components, and structural molecule activity, microtubule motor activity, and exopeptidase activity in molecular function. The metabolic subtype was mainly associated with positive regulation of hydrolase activity and catalytic activity, cell division and cell cycle phase in biological processes, midbody, extracellular matrix, and spindle pole in cellular component, and Ras GTPase activator activity, small GTPase regulator activity, and Rho GTPase activator activity in molecular function. There were no common gene ontology terms enriched in the three subtypes, and only a few common terms were enriched in two subtypes, as shown in Table S5. Some common terms were enriched in both the invasive and proliferative subtypes, such as cytoskeleton organization and microtubule cytoskeleton organization in biological processes, cytoskeleton, microtubule cytoskeleton and spindle in cellular components, and structural molecule activity in molecular function. Only positive regulation of molecular function in biological processes was enriched in both invasive and metabolic subtypes. Cell cycle phase, cell cycle process, cell division and mitotic cell cycle in biological process were enriched in both proliferative and metabolic. There were no common terms in cellular component or molecular function between invasive and proliferative subtypes, or between proliferative and metabolic subtypes. This demonstrates that there are some similarities in the functions of key genes in the invasive and proliferative subtypes, but most are different. There were few similarities between the metabolic subtype and the other two subtypes in the function of key genes. In the pathway analysis of key genes in the three subtypes, the pathways enriched in the three subtypes were different. This suggests that the motivation mechanism of the three subtypes may be different. Both for gene ontology and the pathway analysis of the key genes of subtypes, there were many differences among the three subtypes. Namely, each subtype of gastric cancer might have different occurrence and development mechanisms. Thus, different diagnosis and therapy methods should be applied to the invasive, proliferative and metabolic subtypes of gastric cancer. There were no strong differences in survival among the 3 subtypes, but in terms of clinical treatment, there were 2 findings: patients with metabolic-subtype tumors benefited from 5-Fluorouracil treatment and drugs targeting the PI3K-AKT-mTOR pathway may be particularly effective against invasive-subtype tumors.5 Thus, different diagnosis and therapy methods should be applied to the invasive, proliferative and metabolic subtypes of gastric cancer.
The comparative analysis between our key genes and the corresponding subtype classification gene sets selected by Lei showed that there were few common genes between them, especially in the metabolic subtype. This suggests that some new key genes of subtypes in gastric cancer may be identified in a different way to the method of Lei. However, some results of the pathway and gene ontology analyses of the key genes were the same as those of Lei; for example, focal adhesion pathway in invasive subtype, cell adhesion in biological process terms of gene ontology for the invasive subtype, and inducing cells into M phase and mitosis for the proliferative subtype. Furthermore, we mined some new features of each subtype as described earlier, such as the p53 signaling pathway and oocyte meiosis in the pathway analysis, and spindle, midbody, extracellular matrix and GTPase activator activity in the gene ontology analysis. However, the number of key genes that represent the features of a subtype is much lower than that of the subtype classification gene sets.
The numbers of samples are respectively 26 in invasive, 29 in proliferative and 15 in metabolic, which are not large enough, especially for the metabolic subtype. Thus, a handful of key genes in invasive and in proliferative may be missed by our method, while the missed key genes in the metabolic subtype may be more. We thought it is the reason that there were few common genes between our key genes and the subtype classification gene sets selected by Lei. This is also the main reason for the classification power of the key genes of the metabolic subtype being weaker than that of other two subtypes.
Conclusions
An integrated pipeline was developed to identify key genes with potential as a biomarker from gene expression profiles with single disease samples. The biological features of each of invasive, proliferative and metabolic subtypes were mined. The identified key genes were considered to represent the features of subtypes at the molecular level and might be potential biomarkers. Though there were no common genes in key genes of the three subtypes, common genes and unique DEGs were found between any two subtypes. The unique DEGs were not only unique genes for one subtype, but were also differentially expressed genes between two subtypes. These specific genes may be the reason that causes the phenotypic differences between the subtypes. In the identified key genes of each subtype, some genes have previously been reported to be associated with gastric cancer, which indirectly confirms that our results are reliable. The key genes identified by us and the identified biological features may be useful for personalized diagnosis and treatment, and molecular screening for targeting drugs of gastric cancers of different subtypes.
Supplementary Material
Table S1.
Table S2.
Table S3.
Table S4.
Table S5.
Table S6.
Acknowledgements
This work was supported by National Natural Science Foundation of China (Grant No. 61720106004), Sichuan Science and Technology Support Program (Grant No. 2015SZ0191), Key project of Natural Science Foundation of Guangdong province (2016A030311040) and The Fundamental Research Funds for the Central Universities (ZYGX2016J189).
Competing Interests
The authors have declared that no competing interest exists.
References
1. Shah MA, Khanin R, Tang L. et al. Molecular classification of gastric cancer: a new paradigm. Clin Cancer Res. 2011;17(9):2693-2701
2. Tan IB, Ivanova T, Lim KH. et al. Intrinsic subtypes of gastric cancer, based on gene expression pattern, predict survival and respond differently to chemotherapy. Gastroenterology. 2011;141(2):476-485
3. Song F, Yang D, Liu B. et al. Integrated microRNA network analyses identify a poor-prognosis subtype of gastric cancer characterized by the miR-200 family. Clin Cancer Res. 2013;20(4):878-889
4. Network TCGA. Comprehensive molecular characterization of gastric adenocarcinoma. Nature. 2015;513(7517):202-209
5. Lei Z, Tan IB, Das K. et al. Identification of molecular subtypes of gastric cancer with different responses to PI3-kinase inhibitors and 5-fluorouracil. Gastroenterology. 2013;145(3):554-565
6. Murty AVSN, Srinivas MN. An outline of some of mathematical models in bionetwork. Research Journal of Pharmacy & Technology. 2016;9(10):1749
7. Huang Y, Pan J, Chen D. et al. Identification and functional analysis of differentially expressed genes in poorly differentiated hepatocellular carcinoma using RNA-seq. Oncotarget. 2017;8(22):35973-35983
8. Mao Y, Shen J, Yue L. et al. RNA sequencing analyses reveal novel differentially expressed genes and pathways in pancreatic cancer. Oncotarget. 2017;8(26):42537-42547
9. Xue F, Yin Z, Li X. et al. Multiple functional SNPs in differentially expressed genes modify risk and survival of non-small cell lung cancer in chinese female non-smokers. Oncotarget. 2017;8(12):18924-18934
10. Estrada E. Virtual identification of essential proteins within the protein interaction network of yeast. Proteomics. 2006;6(1):35-40
11. Zhang B, Horvath S. A general framework for weighted gene co-expression network analysis. Stat Appl Genet Mol. 2005;4(1):1-45
12. Poos K, Smida J, Nathrath M. et al. How microRNA and transcription factor co-regulatory networks affect osteosarcoma cell proliferation. Plos Comput Biol. 2012;9(8):262-279
13. Langfelder P, Horvath S. WGCNA: an R package for weighted correlation network analysis. BMC Bioinformatics. 2008;9(1):1-13
14. Vange P, Bruland T, Beisvag V. et al. Genome-wide analysis of the oxyntic proliferative isthmus zone reveals ASPM as a possible gastric stem/progenitor cell marker over-expressed in cancer. J Pathol. 2015;148(4):447
15. Deng YZ, Zhang CJ, Wang JJ. et al. Expression of G3BP1 and G3BP2 proteins in early gastric cancer and their clinical significances. Modern Digestion & Intervention. 2014;19(4):211-213
16. Liu SS, Chen XM, Zheng HX. et al. Knockdown of Rab5a expression decreases cancer cell motility and invasion through integrin-mediated signaling pathway. J Biomed Sci. 2011;18(1):1-9
17. Li W, Cui Z, Yang Z. The relationships between the expression of RALYL RNA binding protein-like and the gastric carcinoma. China Modern Doctor. 2012;50(30):63-65
18. Wang W, Shi Y, Li J. et al. Up-regulation of KIF14 is a predictor of poor survival and a novel prognostic biomarker of chemoresistance to paclitaxel treatment in cervical cancer. Bioscience Rep. 2016;36(2):e00315
19. Yeom YI, Lee HG, Yoon HR. et al. CDCA5 as a diagnosis marker and therapeutic agent for gastric cancer or colorectal cancer. WO. 2009. 2009 131366 A2
20. Zhang JX, Miao Y, Yi X. et al. GNA13 as a prognostic factor and mediator of gastric cancer progression. Oncotarget. 2016;7(4):4414-4427
21. Labisso WL, Wirth M, Stojanovic N. et al. MYC directs transcription of MCL1 and eIF4E genes to control sensitivity of gastric cancer cells toward HDAC inhibitors. Cell cycle. 2012;11(8):1593-1602
22. Yan W, Zhang Y, He L. et al. Expressions of CDK1 and CDK2 in gastric carcinoma and their prognostic significance. Chinese Journal of Histochemistry & Cytochemistry. 2010;19(2):165-167
23. Sathiya PN, Manimuthu M, Asha GV. et al. In silico analysis and validation of the proliferative potential of CLDN1 expression in gastric cancer. J Environ Pathol Toxicol Oncol. 2013;32(4):343-360
24. Xu Y, Liu Z, Guo K. Expression of FHL1 in gastric cancer tissue and its correlation with the invasion and metastasis of gastric cancer. Mol Cell Biochem. 2012;363(1):93-99
25. Sun GG, Sheng SH, Jing SW. et al. An antiproliferative gene FLNA regulates migration and invasion of gastric carcinoma cell in vitro and its clinical significance. Tumor Biol. 2014;35(3):2641-2648
26. Liu HY, Pei LI, Gao H. et al. Effect of chromokinesin KIF4A on gastric carcinoma migration and metastasis. Journal of Shandong University. 2013;51(12):25-28
27. Hou Q, Wu YH, Grabsch H. et al. Integrative genomics identifies RAB23 as an invasion mediator gene in diffuse-type gastric cancer. Cancer Res. 2008;68(12):4623-4630
28. Zhou X, Wang Y, Shan B. et al. The downregulation of miR-200c/141 promotes ZEB1/2 expression and gastric cancer progression. Med Oncol. 2015;32(1):1-13
29. Petra H, Kocevar BN, Frkovic GS. et al. Association between polymorphisms in segregation genes BUB1B and TTK and gastric cancer risk. Radiol Oncol. 2016;50(3):297-307
30. Hajjari M, Behmanesh M, Sadeghizadeh M. et al. Junctional adhesion molecules 2 and 3 may potentially be involved in progression of gastric adenocarcinoma tumors. Med Oncol. 2013;30(1):1-7
31. Imai T, Oue N, Nishioka M. et al. Overexpression of KIF11 in Gastric Cancer with Intestinal Mucin Phenotype. Pathobiology. 2017;84(1):16-24
32. Takahashi N, Yamada Y, Taniguchi H. et al. Clinicopathological features and prognostic roles of KRAS, BRAF, PIK3CA and NRAS mutations in advanced gastric cancer. BMC Research Notes. 2014;7(1):1-7
33. Yu B, Chen X, Li J. et al. Stromal fibroblasts in the microenvironment of gastric carcinomas promote tumor metastasis via upregulating TAGLN expression. BMC Cell Biol. 2013;14(1):1-10
34. Lee SH, Je EM, Yoo NJ. et al. HMCN1, a cell polarity-related gene, is somatically mutated in gastric and colorectal cancers. Pathol Oncol Res. 2015;21(3):847-848
35. Guo C, Wang W, Shi Q. et al. An abnormally high expression of ISL-1 represents a potential prognostic factor in gastric cancer. Hum Pathol. 2015;46(9):1282-1289
36. Sun CLJ. Cancer-associated-fibroblast induces epithelial-mesenchymal transition of gastric cancer cells via activating Thy-1. J Carcinog Mutagen. 2014;5(5):1-9
37. Chen Y, Wei X, Guo C. et al. Runx3 suppresses gastric cancer metastasis through inactivation of MMP9 by upregulation of TIMP-1. Int J Cancer. 2011;129(7):1586-1598
38. Cui Y, Li SB, Peng XC. et al. Trastuzumab inhibits growth of HER2-negative gastric cancer cells through gastrin-initialized CCKBR signaling. Digest Dis Sci. 2015;60(12):3631-3641
39. Borges BN, Santos ES, Bastos CE. et al. Promoter polymorphisms and methylation of E-cadherin (CDH1) and KIT in gastric cancer patients from northern Brazil. Anticancer Res. 2010;30(6):2225-2233
40. Zhuge XJ, Chen RP, Huang XL. et al. Exploration of the relationship between LTF gene expression and its DNA promotor region methylation in human gastric cancer cell lines BGC823. J Wenzhou Med Univ. 2014;44(6):426-430
41. Li FX, Weng HQ, He XL. et al. Expression of centrosome-related Kinases-Nek2 in gastric carcinoma and their significances. J Fourth Mil Med Univ. 2009;30(22):2643-2646
42. Xu Y, Liu Z, Guo K. Expression of FHL1 in gastric cancer tissue and its correlation with the invasion and metastasis of gastric cancer. Mol Cell Biochem. 2012;363(1):93-99
43. Seo YS, Park JJ, Ji HK. et al. Usefulness of MMP-9/TIMP-1 in Predicting tumor recurrence in patients undergoing curative surgical resection for gastric carcinoma. Digest Dis Sci. 2007;52(3):753-759
44. Mroczko B, Lukaszewiczzajac M, Groblewska M. et al. Expression of tissue inhibitors of metalloproteinase 1 (TIMP-1) in gastric cancer tissue. Folia Histochem Cyto. 2009;47(3):511-516
45. Chen Y, Wei X, Guo C. et al. Runx3 suppresses gastric cancer metastasis through inactivation of MMP9 by upregulation of TIMP-1. Int J Cancer. 2011;129(7):1586-1598
46. Hajjari M, Behmanesh M, Sadeghizadeh M. et al. Junctional adhesion molecules 2 and 3 may potentially be involved in progression of gastric adenocarcinoma tumors. Med Oncol. 2013;30(1):1-7
47. Eftang LL, Ying E, Tannæs TM. et al. Up-regulation of CLDN1 in gastric cancer is correlated with reduced survival. BMC Cancer. 2013;13(1):1-13
48. Okamoto A, Higo M, Shiiba M. et al. Down-regulation of nucleolar and spindle-associated protein 1 (NUSAP1) expression suppresses tumor and cell proliferation and enhances anti-tumor effect of paclitaxel in oral squamous cell carcinoma. Plos One. 2014;10(11):e0142252
49. Liu SS, Chen XM, Zheng HX. et al. Knockdown of Rab5a expression decreases cancer cell motility and invasion through integrin-mediated signaling pathway. J Biomed Sci. 2011;18(1):1-9
50. Kurashige J, Kamohara H, Watanabe M. et al. MicroRNA-200b regulates cell proliferation, invasion, and migration by directly targeting ZEB2 in gastric carcinoma. Ann Surg Oncol. 2012;19(3):656-664
51. Sakashita K, Mimori K, Tanaka F. et al. Clinical significance of loss of Fhl1 expression in human gastric cancer. Ann Surg Oncol. 2008;15(8):2293-2300
52. Tokino T, Idogawa M, Sasaki Y. P53 pathway and cancer: from bench to clinic. Personalized Medicine Universe. 2015;4:1-3
Author contact
![]() Corresponding author:
Corresponding author: