Impact Factor ISSN: 1449-2288
- Issue 12; 2026
- Issue 11; 2026
- Issue 10; 2026
- Issue 9; 2026
- Issue 8; 2026
- Volume 22; 2026
- Past Issues
- Advance Articles
- Editorial Board
- Cover Images
- Index & Coverage
- Cover Suggestion
- Special Issues
Introduction
Results and Discussion
Conclusion
Methods
Supplementary materials
Abbreviations
Acknowledgements
References

 Global reach, higher impact
Int J Biol Sci 2018; 14(10):1321-1332. doi:10.7150/ijbs.26605 This issue Cite
Research Paper
Genome-wide Identification and Characterization of Enhancers Across 10 Human Tissues
Lili Xiong*, Ran Kang*, Ruofan Ding, Wenyuan Kang, Yiming Zhang, Wenrong Liu, Qingqing Huang, Junhua Meng, Zhiyun Guo ![]()
School of Life Science and Engineering, Southwest Jiaotong University, Chengdu 610031, China.
* These authors contributed equally to this work.
Received 2018-4-10; Accepted 2018-6-29; Published 2018-7-27
Abstract

Background: Enhancers can act as cis-regulatory elements (CREs) to control development and cellular function by regulating gene expression in a tissue-specific and ubiquitous manner. However, the regulatory network and characteristic of different types of enhancers (e.g., transcribed/non-transcribed enhancers, tissue-specific/ubiquitous enhancers) across multiple tissues are still unclear.
Results: Here, a total of 53,924 active enhancers and 10,307 enhancer-associated RNAs (eRNAs) in 10 tissues (adrenal, brain, breast, heart, liver, lung, ovary, placenta, skeletal muscle and kidney) were identified through the integration of histone modifications (H3K4me1, H3K27ac and H3K4me3) and DNase I hypersensitive sites (DHSs) data. Moreover, 40,101 tissue-specific enhancers (TS-Enh), 1,241 ubiquitously expressed enhancers (UE-Enh) as well as transcribed enhancers (T-Enh), including 7,727 unidirectionally transcribed enhancers (1D-Enh) and 1,215 bidirectionally transcribed enhancers (2D-Enh) were defined in 10 tissues. The results show that enhancers exhibited high GC content, genomic variants and transcription factor binding sites (TFBS) enrichment in all tissues. These characteristics were significantly different between TS-Enh and UE-Enh, T-Enh and NT-Enh, 2D-Enh and 1D-Enh. Furt hermore, the results showed that enhancers obviously upregulate the expression of adjacent target genes which were remarkably correlated with the functions of corresponding tissues. Finally, a free user-friendly tissue-specific enhancer database, TiED (
Conclusion: Genome-wide analysis of the regulatory network and characteristic of various types of enhancers showed that enhancers associated with TFs, eRNAs and target genes appeared in tissue specificity and function across different tissues.
Keywords: Enhancer, eRNA, Histone modification, Tissue-specific, Transcription factor
Introduction
Understanding the tissue-specific gene expression patterns in metazoans is critical for clarifying the molecular mechanisms of transcriptional regulations, development, cell identity and function. A growing number of studies show that enhancers can act as tissue-specific cis-regulatory elements to positively regulate gene expression by recruiting DNA-binding transcription factors (TFs) and their cofactors in a distance and orientation-independent manner [1]. Genome-wide identification and characterization of functional active enhancers, especially tissue-specifically active enhancers, are necessary to realize the tissue-specific expression of genes, developmental regulation and cell identity.
Active enhancers are always associated with DNase I hypersensitive sites (DHSs), a hallmark of chromatin regions sensitive to the binding of transcription factors [2]. Previous studies show that high levels of H3K27ac and H3K4me1 as well as low levels of H3K4me3 can be considered a hallmark to identify active enhancers [3-5]. Similar to enhancers and transcription factors, histone modification patterns also have remarkable tissue specificity [6]. Thus, it is more important to identify active enhancers of various tissues and tissue-specific functions by integrating histone modification markers in corresponding tissues. Previously, Roadmap Epigenomics Consortium analyzed 111 reference human epigenomes [7] and identified a considerable number of tissue epigenetic marks, which offered much valuable data for better identification of tissue-specific enhancers.
Active enhancers can recruit RNA polymerase II (Pol II) and transcribe enhancer-associated transcripts termed eRNAs [8]. ERNA can be widely divided into two categories: unidirectional transcripts (1D-eRNA) and bidirectional transcripts (2D-eRNA) according to whether their corresponding enhancers can be transcribed bidirectionally[9]. However, how these various types of enhancers perform their regulatory functions in different tissues remains unknown. Therefore, genome-wide analysis of different types of enhancers, especially the regulatory networks among different types of enhancers, transcription factors and target genes of the enhancers, is essential for the identification of enhancer tissue-specific function.
Here, based on characteristic features of active enhancers, we identified many potential active enhancers in ten tissues (adrenal, brain, breast, heart, liver, lung, ovary, placenta, skeletal muscle and kidney). The results showed that most enhancers did not produce transcripts, rather exhibit high GC content and genomic variants in these ten tissues. Additionally, these characteristics were significantly different between TS-Enh (tissue-specific enhancers) and UE-Enh (ubiquitously expressed enhancers), T-Enh (transcribed enhancers) and NT-Enh (non-transcribed enhancers), 2D-Enh (enhancers with bidirectional transcripts) and 1D-Enh (enhancers with unidirectional transcripts). Furthermore, we found that in each tissue, the enrichment of transcription factors for T-Enh and UE-Enh was dramatically higher than that for NT-Enh and TS-Enh, respectively. We also found the identified enhancers significantly regulated the expression of adjacent target gene. The target genes of tissue-specific enhancers in each tissue observably enriched corresponding tissue function using the functional enrichment analysis. Finally, although there are several databases centered on enhancers, such as VISTA Enhancer Browser [10], a database providing experimentally verified enhancers, there is still a lot of information of enhancer needing improvement including new potential enhancers, target genes, SNPs, regulatory relationships with TFs, enhancers and genes. Herein, a free user-friendly tissue-specific enhancer database, TiED[11] (http://lcbb.swjtu.edu.cn/TiED) had been built to store all data of enhancers of 10 tissues.
Results and Discussion
Enhancers showed significant tissue specificity in 10 tissues
Previous studies have shown that active enhancers exist in the open chromatin regions of DNase I hypersensitive sites (DHSs) and appear signature of high levels of H3K4me1, H3K27ac and low levels of H3K4me3 [1, 12]. Using these patterns of active enhancers, we finally identified 53,924 active enhancers in adrenal, brain, breast, heart, liver, lung, ovary, placenta, skeletal muscle and kidney (Supplementary Table S1). As expected, all identified enhancers in ten tissues showed high H3K27ac, H3K4me1 signals and lower H3K4me3 signals (Fig. 1A, Supplementary Fig. S1).
Identification of TS-Enh, UE-Enh and Oth-Enh in 10 tissues. (A) An enhancer named enh_9535 in genome region chr11: 65,248,300-65,263,500 is visualized with the integrative genomics viewer (IGV). (B) The distribution of tissue specificity of the enhancers. With the smaller tissue specificity index, the enhancer is more specific. (C) The proportion and the number of TS-Enh, UE-Enh and Oth-Enh in 10 tissues.

Enhancers can act as tissue-specific cis-regulatory elements (CREs) to control development and cellular function by regulating gene expression [1, 13]. Therefore, in order to identify tissue-specific nature of enhancers in these ten tissues, we calculated the tissue-specificity index (TSI) [14] for each enhancer (Fig. 1B) and grouped them into tissue-specific enhancers (TS-Enh), ubiquitously expressed enhancers (UE-Enh) and other enhancers (Oth-Enh) (See Methods). Finally, we identified a total of 40,101 TS-Enh, 1,241 UE-Enh and 12,582 Oth-Enh in the ten tissues (Fig. 1C).
Notably, tissue-specific enhancers (TS-Enh) make up a larger proportion (74.4%) than other types of enhancers in all of these tissues. The proportion of TS-Enh is higher than that of UE-Enh in each tissue, especially in several tissues such as liver (72.3%), brain (69.6%) and breast (55.6%). On the contrary, UE-Enh occupies a relatively low proportion in the total number of enhancers. Even in the three tissues where its percentages are comparatively higher, the value is only 16.7% for adrenal, 15.4% for ovary, and 13.3% for kidney, respectively (Fig. 1C, Supplementary Fig. S2).
Most of the enhancers did not produce enhancer-associated transcripts and preferred to express 1D-eRNA rather than 2D-eRNA
Increasing evidences show that enhancers have the ability to recruit RNA polymerase II (RNAP II), and then transcribe a novel class of transcripts termed enhancer RNAs (eRNAs), whose expression positively correlates with the expression of proximal genes [8]. Recently, FANTOM research projects generated large amounts of CAGE tag start site (CTSS) data using the cap analysis of gene expression (CAGE) at the 5′ end of transcripts [15]. Based on these data, 10,307 eRNAs were identified in the potential enhancer regions. As expected, significant transcriptional signals were present within 200 bp surrounding the center of the enhancer in these ten tissues (Supplementary Fig. S3). Previous studies show that enhancer RNAs can be classified into unidirectional (1D-eRNAs) and bidirectional eRNAs (2D-eRNAs) according to their transcriptional direction [16]. Therefore, based on the information about bidirectional and unidirectional TSS data from CTSS, 8,051 1D-eRNA and 2,256 2D-eRNA were obtained (Supplementary Table S2). The results show that the enhancer preferred to express 1D-eRNA rather than 2D-eRNA in each tissue (Fig. 2A). Additionally, in order to figure out if there is a remarkable difference in expression level between 1D-eRNA and 2D-eRNA, the expression of eRNA in each tissue was calculated. The results showed that there was no significant difference between the expression of 1D-eRNA and 2D-eRNA in 10 tissues (Supplementary Fig. S4), indicating that transcription of eRNA had no obvious preference in both unidirectional or bidirectional transcription. To investigate the species of the eRNA transcripts, the annotations were performed on all eRNAs. It indicated that 69.8% of the eRNAs belong to lncRNAs, which are presented as lnc-eRNA and capable of regulating the hundreds of downstream genes expression in a trans-acting manner [1, 17]. The remaining includes pseudogenes (22.2%), microRNAs (2.07%) and small nuclear RNAs (snRNA, 1.18%) but their functions in enhancers are still unclear (Fig. 2B).
The statistics of eRNA and three types of enhancers in each tissue. (A) The number of 1D-eRNAs and 2D-eRNAs across 10 tissues. (B) The proportion of eRNAs assigned to known RNA categories based on the GENCODE(V19). (C) Proportions and numbers of 2D-Enh, 1D-Enh and NT-Enh in 10 tissues. The total number of enhancers in each tissue is listed to the right of each bar. (D) The number of 2D-Enh, 1D-Enh and NT-Enh across 1-10 tissues.
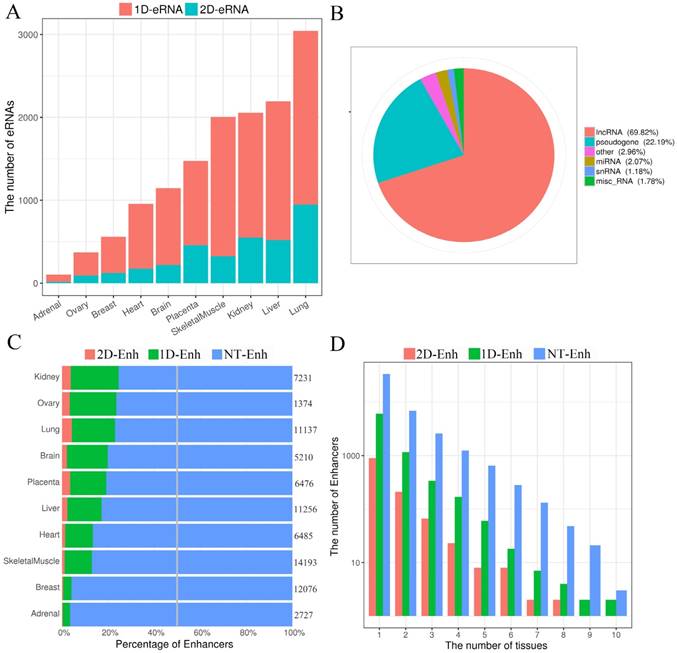
According to whether the transcript is transcribed from enhancer and the types of eRNAs, 1,215 2D-Enh (enhancers with bidirectional transcripts), 7,727 1D-Enh (enhancers with unidirectional transcripts) and 44,982 NT-Enh (enhancers with no transcripts) were identified (Data is available in TiED). Consistent with previous studies, it is obvious that most of the enhancers (83.4%) do not produce enhancer-associated transcripts, and the unidirectional eRNAs hold a higher percentage than the bidirectional ones (Fig. 2C) [16, 18]. The proportion of 1D-Enh in each tissue is greater than that of 2D-Enh. Furthermore, the kidney possesses the highest percentage of T-Enh (1D-Enh and 2D-Enh) (24.5%) , whereas the adrenal contains the lowest (3.6%) (Fig. 2C, Supplementary Fig. S5). In addition, the number of enhancers is negatively correlated with the number of tissues in which the enhancer exists, regardless of whether the enhancers are able to produce eRNA or not (Fig. 2D, Supplementary Fig. S6). This suggests that the three types of enhancers all present high tissue-specificity signatures.
Enhancer exhibited significantly high proportion of the GC content and CpG islands
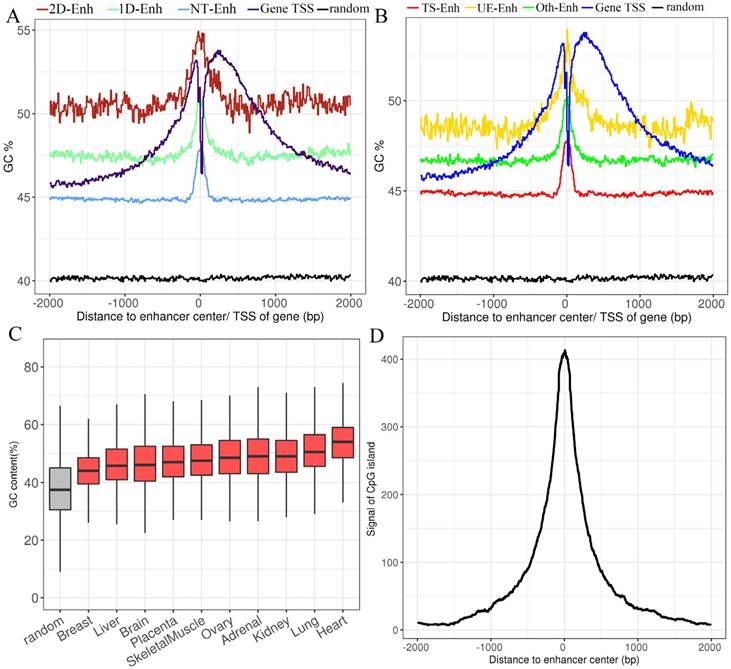
In the human genome, ~70% to 80% of CpG cytosines are methylated [19]. Data emerging from recent genome-wide analyses suggests that active enhancers and eRNA-producing enhancers are typically hypomethylated at CpG dinucleotides [20, 21]. To explore the GC content of enhancers, the UCSC GC percent track data was downloaded and the GC content of each enhancer was calculated. The results show that compared to the random sequences, enhancers exhibited significantly higher proportions of the GC content (47.0%, P-value<2.2e-16) (Fig. 3A, Fig. 3B), and there was higher GC content surrounding the center of the enhancer than the TSSs of genes. In each tissue, the highest and lowest percentage of the enhancer GC content was distributed in breast (44.6%) and heart (53.8%) tissue, respectively (Fig. 3C), and the GC values of the T-Enh were much higher than the NT-Enh's (P-value =6.3e-253). Previously, Attema et al. [22] reported that the average GC content of eRNA that transcribed from the enhancer 5.1 kb regions upstream of the miR-200 cluster was up to 63%, which was significantly higher than the average human GC content (41.6%) in mammary epithelial cells. It is speculated that the CpG methylation level is important for the expressive regulation of eRNAs. In the view of tissue-specific enhancers, the tendency of that GC content is UE-Enh > Oth-Enh > TS-Enh (Fig. 3B). It was previously reported that the CpG methylation of UE-Enh and gene plays an important regulatory role in a cell-specific manner, and cancer-specific differentially methylated region enriches in cell-specific super-enhancers [23-25]. GC sites are significantly enriched on CpG islands [26]. Therefore, it could be that the CpG islands were enriched in the enhancer regions. Finally, 982 known CpG islands located in enhancers were identified (403 CpG islands located in the center of enhancers) in ten tissues by comparing them with known CpG islands (Fig. 3D, Supplementary Table S3). Remarkably, opposite to the GC content results, the number of CpG islands on TS-Enh was significantly higher than that of those on UE-Enh (688 and 30, respectively). This suggests that the enrichment of CpG islands on enhancers plays potentially essential roles in the regulation of enhancer tissue-specificity.
The GC content of enhancers in ±2 kb from enhancer center. (A) The mean GC content for 2D-Enh, 1D-Enh, NT-Enh, gene TSS and the random region within a 2-kb window around the center of enhancer. (B) The mean GC content for TS-Enh, UE-Enh, Oth-Enh, gene TSS and the random region within ±2 kb around the enhancer center. (C) The GC content of the enhancers in 10 tissues. (D) Distribution of CpG island located on enhancers. Y-axis represents the coverage of the CpG island of each enhancer.
TFs significantly bound in ±500 bp from enhancer center and preferentially targeted to T-Enh and UE-Enh
TFs are master regulators of gene expression. They bind to the open chromatin regions of active enhancers to perform an essential role in the regulation of tissue and cell-type-specific expression of genes [12, 27-29]. To explore the regulation relationship of TFs and enhancers in each tissue, first the 4,380,444 TFBSs of 161 TFs were downloaded. Then, the distribution of TFs binding to the enhancer was analyzed and it was found that TFBS was significantly enriched in ±500 bp from enhancer center (Fig. 4A). Previous studies show that eRNA-producing enhancers can bind with more TFs than non-transcribed ones [1]. These results show that the enrichment of TFs for T-Enh is much more significant than that of NT-Enh in each tissue (P-value<3.1e-7). And it suggests that the expression of eRNAs needs much more TFs to participate in. It was also found that TFs were much more significantly enriched in 2D-Enh than 1D-Enh in each tissue, except adrenal (too little 2D-Enh in adrenal) (P-value<5.7e-3) (Supplementary Fig. S7). As expected, the enrichment of TFs binding to UE-Enh in all tissues was significantly higher than that of TS-Enh (P-value<8e-19, Fig. 4B), which is consistent with the results that the GC content of UE-Enh was higher than TS-Enh. The enrichment of TFBS in DNA sequences was related to the sequence conservation, suggesting that UE-Enh performed a universal function in the regulation of gene expression.
The regulatory relationships between transcription factors (TFs) and enhancers. (A) The distribution of the distance between the transcription factor binding site (TFBS) and enhancer center. (B) The box plots present the enrichment of TFs binding to TS-Enh, UE-Enh, Oth-Enh and random region. TF enrichment is obviously higher than that of random region (P-value<2.7e-7). (C) Distribution of the tissue-specific value (TSPV) of 126 TFs. (D) The tissue specificity and enrichment of 32 tissue-specific TFs (according to TSPV<-40.2) on the enhancer across 10 tissues. The larger dot size indicates the higher enrichment of the TF for enhancers in a tissue. (E) The histogram of 6 out of 126 TFs with the highest tissue specificity (TSPV<-66.7).
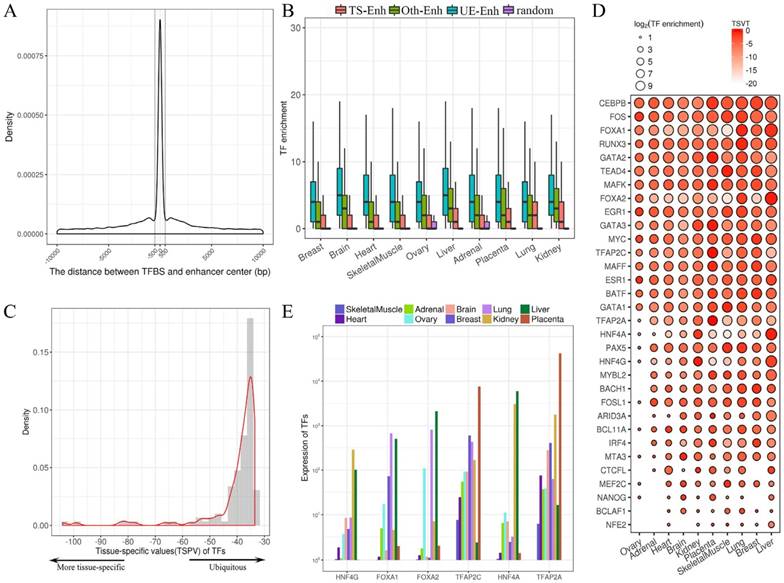
TFs evidently exhibit tissue specificity and play a crucial role in tissue-specific gene regulation [30]. However, the regulatory relationships between tissue-specific TFs and those of enhancers in corresponding tissue are still unclear. To investigate this, the tissue-specific value (TSPV) of 126 TFs binding to the enhancers was calculated (Fig. 4C). TSPV value is defined as representing whether a TF is tissue-specific versus ubiquitously expressed. A lower TSPV indicates TF is more tissue-specific across tissues. The tissue-specific value in a tissue (TSVT) determines the specific expression level of a TF in a particular tissue; a greater TSVT suggests a TF is more specific to a tissue. Finally, 32 tissue-specific TFs were obtained (Fig. 4D, Supplementary Fig. S8), some of which show significant tissue specificity, such as HNF4A in liver (TSPV=-103.9, TSVT=-0.6, expression=5,924.9), FOXA2 in liver (TSPV=-99.0, TSVT=-0.5, expression=2,102.1), TFAP2A in placenta (TSPV=-82.6, TSVT=-0.1, expression=41,860.6), FOXA1 in lung (TSPV=-80.7, TSVT=-0.9, expression=663.7), HNF4G in kidney (TSPV=-77.6, TSVT=-0.5, expression=285.1), TFAP2C in placenta (TSPV=-66.7, TSVT=-0.3, expression=7,551.5) (Fig. 4E). Additionally, 94 ubiquitously expressed TFs were identified (Supplementary Fig. S8). Notably, binding sites of highly liver-specific TF HNF4A and kidney-specific HNF4G mainly enriched in liver enhancers and kidney enhancers, respectively, were identified (Fig. 4D). It was indicated that HNF4A and HNF4G both play an essential role in tissue-specific regulation for enhancers in the liver and kidney. Similarly, placenta-specific TF TFAP2A and TFAP2C, members of AP-2 (TFAP2) family of TFs, primarily bind to the placental enhancers (Fig. 4D). It has been reported that TFAP2C regulates a large number of enhancers to repress Nanog and Oct4 and is specifically highly expressed in the placenta[31].
Enhancers were significantly related to expression level of target genes in each tissue and their target genes were significantly correlated with their tissues' function
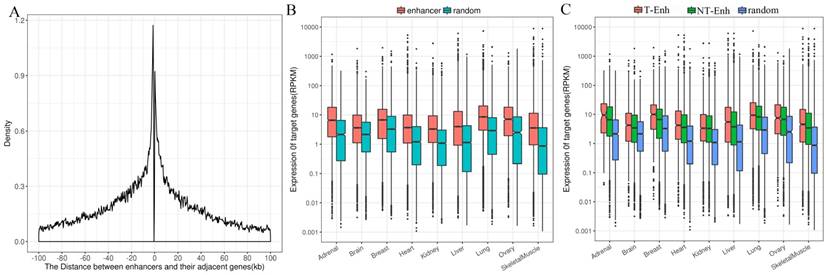
Enhancers tend to loop to and associate with proximal genes to elevate their expression level [17]. Consequently, it is still most widely accepted to identify enhancers' most proximal genes as their target genes [14]. In order to investigate the positional relationship between enhancers and the adjacent protein-coding genes, first the distribution of adjacent coding genes around enhancers was calculated. The results show that the distance between enhancers and their adjacent genes was mainly distributed in 100-kb windows around enhancer centers, which agrees with previous studies [17, 32]. Therefore, the protein-coding genes within 100-kb windows distance from nearest neighbor enhancers were identified as target genes of enhancers (Fig. 5A). Since enhancers globally upregulated the expression of their target genes, it was imperative to figure out whether enhancers obtained were significantly positively related to the expression of their target genes. The expression of target genes of enhancers obtained from Genotype-Tissue Expression (GTEx) project was analyzed in nine tissues (placenta data were lacking in GTEx). The expression levels of target genes of enhancers were significantly higher than that of random regions (P-value<1.6e-7) in each tissue (Fig. 5B). Additionally, target genes of T-Enh have significantly higher expression levels than those of NT-Enh in brain, breast, heart, lung, ovary, skeletal muscle and kidney (P-value<0.05, Fig. 5C). It has been reported that in neurons, the expression level of eRNA is related to the synthesis of adjacent mRNA [8]. However, the expression level of target genes of T-Enh is not significantly higher than that of NT-Enh (P-value>0.05) in adrenal, liver and placenta. It was speculated that eRNAs were involved in the target genes' regulation process for enhancers in a tissue-specific or cell type-specific manner, rather than the universal way. In a similar way, there were no significant differences between the target genes' expression for 2D-Enh and 1D-Enh or for TS-Enh and UE-Enh in each tissue (P-value>0.05) (Supplementary Fig. S9, Supplementary Fig. S10). These results suggest that neither the direction of eRNA transcription nor the specificity of enhancers will significantly influence the expression of target genes.
Distribution of adjacent coding genes around enhancers center and the expression levels of target genes. (A) Distance between enhancers and adjacent protein-coding target genes. (B) Comparative expression levels of the target genes of the enhancers and random regions. (C) Comparative expression levels of the target genes among the T-Enh, NT-Enh and random regions.
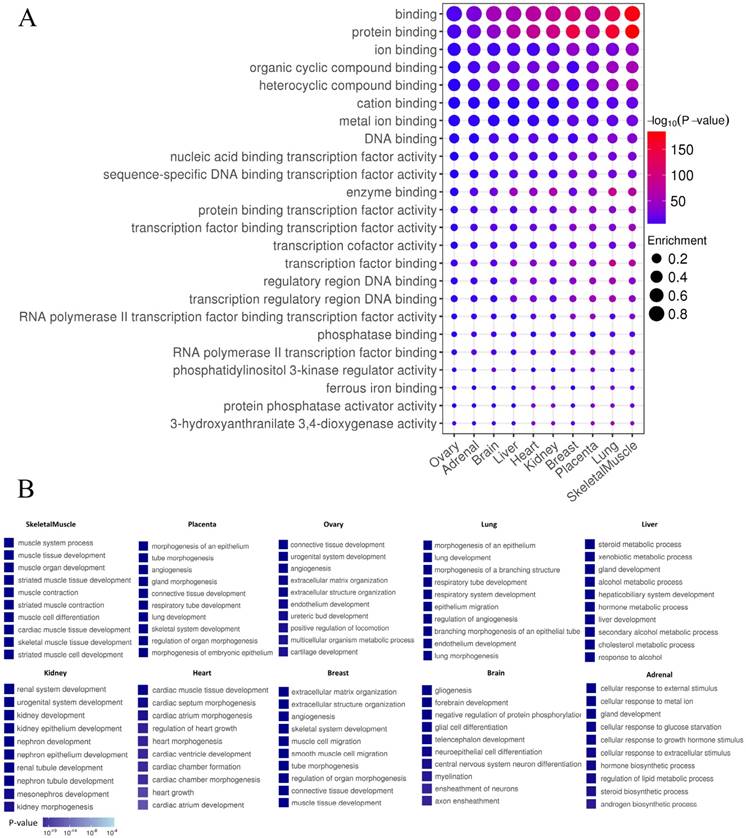
In order to distinguish whether the identified enhancers have the general function of cis-regulatory elements, the functions of enhancers using GREAT was predicted [33]. As expected, enhancers in each tissue exhibited general features of enhancers, such as “protein binding”, “enzyme binding”, “transcription factors” and “RNA polymerase II binding” (P-value<0.01) (Fig. 6A). Tissue-specific enhancers may perform specific functions in the corresponding tissue. To test this hypothesis, Gene Ontology (GO) analysis on target genes of TS-Enh was performed in ten tissues to figure out whether TS-Enh was involved in related tissue-specific function. Dramatically, the target genes of tissue-specific enhancers significantly enriched corresponding tissue function (Fig. 6B). These results suggest that tissue-specific enhancers may achieve tissue-specific functions in a particular tissue by regulating a large number of target genes which are involved in corresponding tissue function.
Enhancer features and Gene Ontology (GO) analysis of target genes of TS-Enh in 10 tissues. (A) The greater dot size indicates the higher enrichment of enhancers in a functional term. (B) Gene Ontology (GO) analysis of TS-Enh target genes in each tissue. The top ten GO terms of the genes associated with TS-Enh function in each tissue are displayed.
Regulatory networks of tissue-specific TFs-enhancers-target genes, genomic variants in various types of enhancers and TiED database
Tissue formation and developmental patterns are regulated by complex tissue-specific regulatory networks. However, the gene regulatory networks comprising interactions between TFs and tissue-specific enhancers are poorly understood. To explore the tissue-specific enhancer network, 3,871 tissue-specific genes of 10 tissues from PaGenBase [34], 26 protein-protein interactions, 40,101 TS-Enh and 126 TFs were integrated to construct a TF-enhancer-gene regulatory networks across ten tissues (Supplementary Fig. S11).
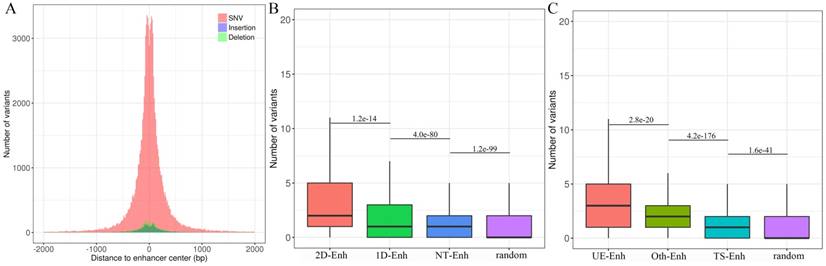
Mutations in enhancers may affect the transcriptional activity of target genes, which may further cause a phenotypic change [24]. To explore the distribution of genomic variants in different types of enhancers in 10 tissues, genomic variants data from UCSC was downloaded (https://genome.ucsc.edu/) and a total of 105,584 enhancer variants, with 2 variants per enhancer on average, and enhancer variants data can be downloaded from TiED were detected (http://lcbb.swjtu.edu.cn/TiED) [11]. It is noted that genome variants mainly lay in 1 kb regions around the center of enhancers (Fig. 7A). Obviously, the number of variants in all types of enhancers is dramatically larger than that in random regions (Fig. 7B, Fig. 7C). Furthermore, the number of variants located in T-Enh and 2D-Enh was significantly greater than that in NT-Enh (P-value=2.9e-133) and 1D-Enh (P-value=1.2e-14), respectively (Fig. 7B). Likewise, the number of variants in UE-Enh was higher than that in TS-Enh (P-value=2.8e-20) (Fig. 7C).
Genome variants analysis of enhancers in ten tissues. (A) The distribution of single nucleotide variant (SNV), insertion, deletion on the enhancers. X-axis indicates the distance between the variants and the center of enhancers. The variants are mainly distributed in ±1 kb from enhancer center. Most enhancer variants belong to single nucleotide variant (SNV) (91.3%); less enhancer variants are assigned to insertion (3.7%) and deletion (5.0%). (B) The box plots show the number of variants located in 2D-Enh, 1D-Enh, NT-Enh and random region. The number of enhancer variants presents the following tendency: 2D--Enh > 1D-Enh > NT-Enh. (C) The number of variants located in UE-Enh, Oth-Enh, TS-Enh and random region. It presents the following tendency: UE-Enh> Oth-Enh> TS-Enh.
Finally, here TiED (http://lcbb.swjtu.edu.cn/TiED), a free user-friendly tissue-specific enhancer database for humans, was built to store all the obtained data. For now, it is made up of data consisting of 53,924 enhancers in 10 tissues, the expression levels of 126 TFs, 105,584 variants sites of enhancer, as well as the expression values of 9,145 enhance target genes. Main functions of the database include “search by genomic region”, “search by TF”, “search by tissue”, “search by gene”, “search by specificity of enhancer” and “browse by tissues”.
Conclusion
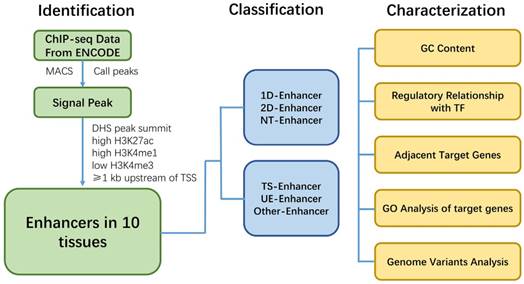
Here we show a work flowchart to illustrate our procedure of enhancer identification, classification and analyzation (Fig. 8). In conclusion, genome-wide analysis of the regulatory network and characteristics for various types of enhancers showed that enhancers associated with TFs, eRNAs and target genes, and have tissue specificity and function across different tissues. T-Enh and UE-Enh exhibited dramatically higher GC content, TF enrichment and target gene expression levels compared to NT-Enh and TS-Enh, respectively. The characteristic of enhancers indicates that transcriptional enhancers, especially 2D-Enh, play a more important role in gene regulation than non-transcriptional enhancers. It was also indicated that enhancers regulated the expression of adjacent target genes and these genes correlated remarkably with the corresponding tissue function, suggesting that TS-Enh was essential to realize tissue-specific expression of genes, developmental regulation and cell identity. Owing to the absence of data on histone modification and DHS in some tissues, there still exist limitations for regulatory networks of enhancers across corresponding tissues. Accordingly, the continually emerging related data as well as identification of currently unknown enhancers will benefit the comprehensive elucidation of enhancer regulatory networks of different tissues. In addition, several characteristics of active enhancers we identified in this study can be used for a follow-up machine learning to predict active enhancers. We hope that these characters we obtained is helpful for machine learning for other researchers.
Work flowchart illustrating the procedure of identification, classification and characterization of enhancers.
Methods
Identification of active enhancers in 10 tissues
Commonly used criteria for identification of enhancers include the DNase hypersensitivity site, a higher ratio of histone H3 lysine 4 monomethylation (H3K4me1) compared with trimethylation (H3K4me3) and the presence of histone acetylation (for example, H3 acetylated at lysine 27 (H3K27ac)) and so on [1]. And it is confirmed that it is feasible to identify enhancers according to histone modification H3K27ac [17], or H3K4me1 as well as H3Kme3 [35]. Herein, we integrated characteristics mentioned above and got a novel procedure of enhancer identification. The ChIP-seq data of H3K27ac, H3K4me1, H3K4me3 and DHS in 10 tissues were downloaded from roadmap [36] and ENCODE [37] (Table S1), and histone modification peaks were obtained using MACS (Model-based Analysis for ChIP-Seq) (P-value<0.0001). The signals of histone modification were normalized by bwtool[38] and deeptools[39]. The screening criterias for candidate active enhancers are as follows: 1) The summit of DHS peak were defined as the enhancer center; 2) There are high H3K27ac and H3K4me1 signals, low H3K4me3 signal in ±2 kb from enhancer center; 3) The enhancer regions overlapping with the protein-coding gene region and 1 kb upstream of each TSS were further filtered.
Identification of 2D-Enh, 1D-Enh and NT-Enh
CAGE tag start site (ctss) data of 10 tissues was downloaded from FANTOM5 [15] (Table S1). Then, bidirectionally and unidirectionally transcribed CAGE tag clusters in each tissue were obtained via Enhancer-master [15]. In ±2 kb region from enhancer center, enhancers were defined as 2D-Enh and 1D-Enh with bidirectional and unidirectional CAGE tag clusters, respectively. NT-Enh was defined as no overlapping any CAGE tag clusters.
Identification of TS-Enh, Oth-Enh and UE-Enh
The tissue-specific index (TSI) was calculated using the Shannon Entropy method by following formula:
(1)
 represents the proportion of an enhancer in all tissues, N represents the number of tissues. The smaller TSI value is, the more significant tissue-specificity the enhancer has. The TSI value close to 0 means the enhancer is specific, and conversely, the enhancer is universal when TSI close to log2 (N). Enhancers are manually divided into three groups by the TSI value: TS-Enh (TSI =0, the enhancers involved in just one tissue), UE-Enh (TSI>1.75, the enhancers present in five or more tissues, making up more than 40% of all tissues) and Oth-Enh (0<TSI≤1.75, the enhancers appear in 2 to 4 tissues, taking proportion of 20% to 40% of all tissues).
Expression analysis and annotation of eRNA
Taking it into consideration that it is reported that RNAPII initiation at enhancer and mRNA TSSs is similar and the minimum length of promoter is 400 bp [15]. Herein, the most conservative result that TPM-normalized counts of ctss in 400 bp downstream from TSS of each eRNA was defined as the expression of an eRNA. The type of eRNAs was identified using non-coding RNA annotation from GENCODE.v19 database.
GC content analysis for enhancers
GC content of genome was obtained from GC Percent track at the UCSC and calculated by bwtool. CpG islands data was downloaded from the UCSC CpG islands tracks. Enhancers overlapping with CpG islands were considered as CpG islands Enhancers.
Identification of tissue-specific TFs
RT-PCR data of human TFs was downloaded from Ravasi et al study [40], and the transcription factor tissue-specific values (TSPV) were calculated according to following equation:
(2)
 represents the ratio of the expression level for TF a in tissue b to sum total expression value across 10 tissues. Lower TSPV score means that TF is more specifically expressed in particular tissues.
For a particular tissue, the TSVT (tissue-specific value in a tissue, shown as equation below) was used to indicate which TF is specifically expressed in this tissue.
(3)
The greater the value of TSVT (maximal TSVT close to 0) suggests that TF is more specifically expressed in this tissue.
Identification of TFBS in enhancers
TFBS were downloaded from ENCODE Txn Factor ChIP track (V3). The ones scoring higher than 800 were chosen as highly-conserved TFBSs. TFs binding within 2 kb from enhancer center were considered the enhancer-regulated TFs. Moreover, the enrichment of TF for an enhancer is defined as the counts of TFBS on it.
Identification of the specificity and expression level of enhancer target genes
An adjacent protein-coding gene has an overlap with ±100 kb from enhancer is defined as the target gene of the enhancer. The gene expression data (RPKM) obtained from GTEx (Table S1). Moreover, their tissue-specific level was obtained from PaGenBase[34], where the dispersion measure (DPM), representing genes' tissue-specificity, was calculated by the expression level of them in different tissues. The smaller difference value between DPM and 1, the higher tissue-specificity genes have, and target genes of enhancers with DPM value larger than 0.9 were taken as tissue-specific genes.
Regulatory networks of tissue-specific enhancers
We downloaded 1,034,157 protein-protein interaction data from BIOGRID (version 3.4.141) [41]. Tissue-specific enhancers-target genes-transcription factors regulatory networks were constructed using Cytoscape (version 3.40) [42].
Identification of genomic variants in enhancer
We downloaded 14,449,886 genomic variants from UCSC dbSNP build 147, which with minor allele frequency (MAF) value larger than or equal to 1% were considered. Additionally, variants in enhancer regions were regarded as those with regulatory function.
Statistical method
One-tailed two independent samples student's t test was used to measure the differences of the results excluded from MACS and GREAT, whose P-values were automatically given after running.
Supplementary materials
All data generated or analyzed during this study are included in this published article and its Supplementary files, or is available upon request. The raw data source can be found in Supplementary Table S4. All data we obtained is freely available for download at TiED (http://lcbb.swjtu.edu.cn/TiED).
Abbreviations
Bp: Base pair; kb: kilo base pairs; H3K4: Histone H3 lysine 4; RPKM: reads per kilobase per million; TF: transcription factor; TFBS: transcription factor binding site; TPM: tags per million; CTSS: CAGE tag start site; eRNA: enhancer RNA; 1D-eRNA: unidirectionally transcribed enhancer RNA; 2D-eRNA: bidirectionally transcribed enhancer RNA; TS-Enh: tissue-specific enhancers; UE-Enh: ubiquitously expressed enhancers; Oth-Enh: Neither tissue-specific nor ubiquitous enhancers; T-Enh: transcribed enhancers; NT-Enh: non-transcribed enhancers; 1D-Enh: unidirectional transcriptional enhancers; 2D-Enh: bidirectional transcriptional enhancers.
Acknowledgements
This work was financially supported by the Sichuan Provincial Science and Technology Department (18YYJC0551); Program of the Fundamental Research Funds for the Central Universities of China (2682016YXZT04) and National Natural Science Foundation of China (No.31200999).
We thank Yong Li for data processing. We thank Dun Ding for valuable discussion, and Qitao Chen for website design advice. We also thank Shuquan Rao for comments on the manuscript.
Authors' contributions
LL, LX and RD performed identification and analysis of enhancer and enhancer RNA. RK and QH contributed to the database design and development. LX, WK and WL helped to draft the manuscript. YZ, JM and LY contributed to the tissue-specific regulation network of enhancers. ZG conceived the study and project design interpreted results. All authors read and approved the final manuscript.
Competing Interests
The authors have declared that no competing interest exists.
References
1. Li W, Notani D, Rosenfeld MG. Enhancers as non-coding RNA transcription units: recent insights and future perspectives. Nature reviews Genetics. 2016;17:207-23
2. Wang YM, Zhou P, Wang LY, Li ZH, Zhang YN, Zhang YX. Correlation between DNase I hypersensitive site distribution and gene expression in HeLa S3 cells. PloS one. 2012;7:e42414
3. Long HK, Prescott SL, Wysocka J. Ever-Changing Landscapes: Transcriptional Enhancers in Development and Evolution. Cell. 2016;167:1170-87
4. Elkon R, Agami R. Characterization of noncoding regulatory DNA in the human genome. Nature biotechnology. 2017;35:732-46
5. Zhu Y, Sun L, Chen Z, Whitaker JW, Wang T, Wang W. Predicting enhancer transcription and activity from chromatin modifications. Nucleic acids research. 2013;41:10032-43
6. Dong XM, Li Y, Chao Q, Shen J, Gong XJ, Zhao BG. et al. Analysis of gene expression and histone modification between C4 and non-C4 homologous genes of PPDK and PCK in maize. Photosynthesis research. 2016;129:71-83
7. Roadmap Epigenomics C, Kundaje A, Meuleman W, Ernst J, Bilenky M, Yen A. et al. Integrative analysis of 111 reference human epigenomes. Nature. 2015;518:317-30
8. Kim TK, Hemberg M, Gray JM, Costa AM, Bear DM, Wu J. et al. Widespread transcription at neuronal activity-regulated enhancers. Nature. 2010;465:182-7
9. Lam MT, Li W, Rosenfeld MG, Glass CK. Enhancer RNAs and regulated transcriptional programs. Trends in biochemical sciences. 2014;39:170-82
10. Visel A, Minovitsky S, Dubchak I, Pennacchio LA. VISTA Enhancer Browser - a database of tissue-specific human enhancers. Nucleic Acids Res. 2007;35:D88-D92
11. The human Tissue-specific Enhancer Database. http://lcbb.swjtu.edu.cn/TiED. Accessed 20 Jan. 2017
12. Calo E, Wysocka J. Modification of enhancer chromatin: what, how, and why? Molecular cell. 2013;49:825-37
13. Pennacchio LA, Loots GG, Nobrega MA, Ovcharenko I. Predicting tissue-specific enhancers in the human genome. Genome research. 2007;17:201-11
14. Shen Y, Yue F, McCleary DF, Ye Z, Edsall L, Kuan S. et al. A map of the cis-regulatory sequences in the mouse genome. Nature. 2012;488:116-20
15. Andersson R, Gebhard C, Miguel-Escalada I, Hoof I, Bornholdt J, Boyd M. et al. An atlas of active enhancers across human cell types and tissues. Nature. 2014;507:455-61
16. Natoli G, Andrau JC. Noncoding transcription at enhancers: general principles and functional models. Annual review of genetics. 2012;46:1-19
17. Whyte WA, Orlando DA, Hnisz D, Abraham BJ, Lin CY, Kagey MH. et al. Master Transcription Factors and Mediator Establish Super-Enhancers at Key Cell Identity Genes. Cell. 2013;153:307-19
18. De Santa F, Barozzi I, Mietton F, Ghisletti S, Polletti S, Tusi BK. et al. A large fraction of extragenic RNA pol II transcription sites overlap enhancers. PLoS Biology. 2010;8:e1000384
19. Ehrlich M, Gama-Sosa MA, Huang LH, Midgett RM, Kuo KC, McCune RA. et al. Amount and distribution of 5-methylcytosine in human DNA from different types of tissues of cells. Nucleic acids research. 1982;10:2709-21
20. Pulakanti K, Pinello L, Stelloh C, Blinka S, Allred J, Milanovich S. et al. Enhancer transcribed RNAs arise from hypomethylated, Tet-occupied genomic regions. Epigenetics. 2013;8:1303-20
21. Schlesinger F, Smith AD, Gingeras TR, Hannon GJ, Hodges E. De novo DNA demethylation and noncoding transcription define active intergenic regulatory elements. Genome research. 2013;23:1601-14
22. Attema JL, Bert AG, Lim YY, Kolesnikoff N, Lawrence DM, Pillman KA. et al. Identification of an enhancer that increases miR-200b~200a~429 gene expression in breast cancer cells. PloS one. 2013;8:e75517
23. Yang X, Gao L, Zhang S. Comparative pan-cancer DNA methylation analysis reveals cancer common and specific patterns. Briefings in bioinformatics. 2016
24. Chong A, Teo JX, Ban KH. Distinct epigenetic signatures elucidate enhancer-gene relationships that delineate CIMP and non-CIMP colorectal cancers. Oncotarget. 2016;7:28027-39
25. Stadler MB, Murr R, Burger L, Ivanek R, Lienert F, Scholer A. et al. DNA-binding factors shape the mouse methylome at distal regulatory regions. Nature. 2011;480:490-5
26. Gardiner-Garden M, Frommer M. CpG islands in vertebrate genomes. Journal of molecular biology. 1987;196:261-82
27. Ong CT, Corces VG. Enhancer function: new insights into the regulation of tissue-specific gene expression. Nature reviews Genetics. 2011;12:283-93
28. Bulger M, Groudine M. Functional and mechanistic diversity of distal transcription enhancers. Cell. 2011;144:327-39
29. Levine M, Tjian R. Transcription regulation and animal diversity. Nature. 2003;424:147-51
30. Vaquerizas JM, Kummerfeld SK, Teichmann SA, Luscombe NM. A census of human transcription factors: function, expression and evolution. Nature reviews Genetics. 2009;10:252-63
31. Kuckenberg P, Kubaczka C, Schorle H. The role of transcription factor Tcfap2c/TFAP2C in trophectoderm development. Reproductive biomedicine online. 2012;25:12-20
32. Corradin O, Scacheri PC. Enhancer variants: evaluating functions in common disease. Genome medicine. 2014;6:85
33. McLean CY, Bristor D, Hiller M, Clarke SL, Schaar BT, Lowe CB. et al. GREAT improves functional interpretation of cis-regulatory regions. Nature biotechnology. 2010;28:495-501
34. Pan JB, Hu SC, Shi D, Cai MC, Li YB, Zou Q. et al. PaGenBase: a pattern gene database for the global and dynamic understanding of gene function. PloS one. 2013;8:e80747
35. Fishilevich S, Nudel R, Rappaport N, Hadar R, Plaschkes I, Iny Stein T. et al. GeneHancer: genome-wide integration of enhancers and target genes in GeneCards. Database (Oxford). 2017. 2017
36. Zhou X, Li D, Zhang B, Lowdon RF, Rockweiler NB, Sears RL. et al. Epigenomic annotation of genetic variants using the Roadmap Epigenome Browser. Nature biotechnology. 2015;33:345-6
37. Consortium EP. A user's guide to the encyclopedia of DNA elements (ENCODE). PLoS Biology. 2011;9:e1001046
38. Pohl A, Beato M. bwtool: a tool for bigWig files. Bioinformatics. 2014;30:1618-9
39. Ramirez F, Dundar F, Diehl S, Gruning BA, Manke T. deepTools: a flexible platform for exploring deep-sequencing data. Nucleic acids research. 2014;42:W187-91
40. Ravasi T, Suzuki H, Cannistraci CV, Katayama S, Bajic VB, Tan K. et al. An atlas of combinatorial transcriptional regulation in mouse and man. Cell. 2010;140:744-52
41. Stark C, Breitkreutz BJ, Reguly T, Boucher L, Breitkreutz A, Tyers M. BioGRID: a general repository for interaction datasets. Nucleic acids research. 2006;34:D535-9
42. Shannon P, Markiel A, Ozier O, Baliga NS, Wang JT, Ramage D. et al. Cytoscape: a software environment for integrated models of biomolecular interaction networks. Genome research. 2003;13:2498-504
Author contact
![]() Corresponding author: zhiyunguoedu.cn
Corresponding author: zhiyunguoedu.cn