Impact Factor ISSN: 1449-2288
- Issue 12; 2026
- Issue 11; 2026
- Issue 10; 2026
- Issue 9; 2026
- Issue 8; 2026
- Volume 22; 2026
- Past Issues
- Advance Articles
- Editorial Board
- Cover Images
- Index & Coverage
- Cover Suggestion
- Special Issues
1. Introduction
2. Material and Methods
3. Results
4. Discussion
Supplementary Material
Acknowledgements
References

 Global reach, higher impact
Int J Biol Sci 2018; 14(11):1445-1456. doi:10.7150/ijbs.26335 This issue Cite
Research Paper
MicroRNA485-3p negatively regulates the transcriptional co-repressor CtBP1 to control the oncogenic process in osteosarcoma cells
Kaili Du1, Xinliang Zhang2, Zhenkai Lou1, Peiyu Guo1, Fan Zhang1, Bing Wang1, Lingqiang Chen1, Chunqiang Zhang1, ![]()
1. Department of Orthopedics, the First Affiliated Hospital of Kunming Medical University, Kunming, Yunnan 650032, China.
2. Department of Spine Surgery, Honghui Hospital, Xi'an Jiaotong University Health Science Center, Xi'an, Shaanxi 710054, China.
Received 2018-3-27; Accepted 2018-7-8; Published 2018-8-6
Abstract

Carboxyl-terminal binding protein 1 (CtBP1), a well-known transcriptional co-repressor, is highly expressed in a number of cancer types. However, it is still absent in osteosarcoma cells. Here, we found that CtBP1, but not CtBP2, is overexpressed in invasive osteosarcoma tissues and cells. The overexpressed CtBP1 in turn represses its downstream targets, such as the pro-apoptotic regulators Bax, Bim and p53 upregulated modulator of apoptosis (PUMA), cell adhesion molecule E-cadherin, and the cell cycle regulators p16, p21 and phosphatase and tensin homolog (PTEN). To explore the molecular mechanism of CtBP1 overexpression, we subjected three independent clinical samples to miRNA microarray analysis and found that miR-485-3p could specifically bind to the 3'-untranslated region (3'-UTR) of CtBP1, thereby negatively controlling CtBP1 expression. The overexpression of miR-485-3p in osteosarcoma cells significantly repressed CtBP1 levels and inhibited cell proliferation, colony formation, cell migration and sphere formation. Further analysis indicated that DNA hypermethylation in the promoter region of miR-485-3p caused the downregulation of miR-485-3p. Treatment with the DNA methylation inhibitor 5-aza-2'-deoxycytidine (AZA) resulted in the upregulation of miR-485-3p and the downregulation of CtBP1 as well as inhibited osteosarcoma cell growth. This study provides evidence that CtBP1 is also overexpressed in osteosarcoma cells and demonstrates the underlying mechanism regarding its overexpression. Thus, therapeutically targeting CtBP1 may represent an effective strategy for osteosarcoma therapy.
Keywords: miR-485-3p, CtBP1, CtBP2, DNA methylation, osteosarcoma
1. Introduction
Osteosarcoma is the most common bone cancer in children and young adults, comprising 2.4% of all malignancies in pediatric patients [1-3]. For localized osteosarcoma without metastasis, the tumor can be resected by surgery, and the 5-year survival rate ranges from 60% to 80% [1-3]. For metastatic osteosarcomas, according to the extent, grade and location of the osteosarcoma, treatment typically involves surgery, chemotherapy and radiation, and the 5-year survival rate is approximately 15% to 30% [1-3]. Therefore, it is urgently necessary to understand the molecular carcinogenesis of osteosarcomas and develop disease-specific and targeted therapy.
The mammalian genome encodes two carboxyl-terminal binding proteins (CtBPs), that is, CtBP1 and CtBP2 [4]. Both of these proteins function as transcriptional co-repressors and can be recruited by various transcription factors (TFs) (e.g., BKLF, ZEB and NF-κB) [5-8]. The formed CtBPs-TFs complex further recruits several epigenetic modifying enzymes (e.g., LSD1, HDAC1 and 2) to regulate the downstream target genes and play roles in different biological processes [5-8]. CtBP1 and 2 share a high identity of protein sequences (80%); however, they only show redundant transcriptional regulatory roles during mouse development [9]. This may be because they have different expression patterns, that is, CtBP1 is broadly expressed in different tissues, while CtBP2 has a strict expression pattern (mainly in embryogenesis) [9]. In recent years, CtBPs, especially CtBP1, were found to be overexpressed in different cancers, such as breast [10], prostate [11], ovarian [12], and colon cancers, by repressing tumor suppressor gene expression (e.g., Bax, Bim, PUMA, p16, p21, E-cadherin, PTEN) or upregulating oncogene levels (e.g., Tiam1 and TCF-4) [10-15].
MicroRNAs (miRNAs) are a class of highly conserved non-coding RNAs (∼18-25 nucleotides) that play important roles in multiple biological processes, such as cell proliferation, apoptosis and metastasis [16-18]. The main mode of miRNA function is through binding to the 3'-UTR region of specific mRNA, resulting in its degradation or translation inhibition [16-18]. A large number of studies have shown that the abnormal expression of miRNAs can result in dysregulated gene expression, leading to various diseases, including cancer [19-21]. So far, little is known about miRNAs that target CtBP1. Only miR-137 and miR-212 were identified to target CtBP1 in endometrial epithelial cells and melanoma cells, respectively [22, 23].
Although CtBPs have been reported to function as tumor suppressors in many cancer types, it is still unknown whether they play roles in osteosarcoma cells. In this study, we found that CtBP1, but not CtBP2, was overexpressed in 30 invasive osteosarcoma tissues. The upregulation of CtBP1 further inhibited the expression of its downstream targets. In addition, we found that CtBP1 can be targeted by miR-485-3p, which has previously been shown to target different genes (e.g., Frizzled7, NTRK3 and PGC-1α) involved in carcinogenesis [24-26]. Further studies demonstrated that DNA hypermethylation in the miR-485-3p promoter region was a major cause of miR-485-3p downregulation in osteosarcoma cells. Our results revealed how CtBP1 was regulated and how it regulated the downstream targets in osteosarcoma cells, which may help to develop a therapeutic strategy by targeting CtBP1.
2. Material and Methods
Cell culture and transfection
All human cell lines, including one osteoblast cell line hFOB1.19, and four osteosarcoma cell lines U2OS, MG63, Saos-2 and HOS, were purchased from the American Type Culture Collection (ATCC, USA). Cells were cultured in RPMI 1640 medium (Corning, USA), incubated at 37°C with 5% CO2 and split every two days. Transfection of plasmids, miR-NC, miR-485-3p-mimic and anti-miR-485-3p was carried out using HiPerFect Transfection Reagent (QIAGEN, USA) according to the manufacturer's instructions.
Tissue samples and histology
Twenty-four noncancerous tissues from patients who had fractured knees and 30 cancerous tissues from osteosarcoma patients whose tumors occurred at the knees were collected from patients with written informed consent following protocols approved by the ethical board of Kunming Medical University. The basic characteristics of patients were summarized in Supplementary Table 1. The experimental procedures were strictly carried out following protocols approved by the ethical board of Kunming Medical University. Tissue histology was examined by immunohistochemistry (IHC) staining following a previous protocol [27]. Antibodies used in IHC staining included anti-CtBP1 (Santa Cruz Biotechnology, USA, Catalog No. sc398945) and anti-CtBP2 (Santa Cruz Biotechnology, Catalog No. sc5967).
Quantitative real-time PCR (qRT-PCR)
To determine the mRNA levels of genes, total RNA was isolated from cells and clinical tissues using TRIZOL (Life Technologies, USA) following the manufacturer's guidelines. The obtained RNA (10 μg) was then treated with 20 units of RNase-free DNase I (Takara, Japan) for 45 min at 37 °C to remove DNA following the manufacturer's guidelines. A total of 0.5 μg of RNA in each sample was subjected to cDNA synthesis using a kit (Takara, Japan). The resulting cDNAs were diluted 400-fold and then subjected to qRT-PCR analyses using primers listed in Supplementary Table 2. The PCR procedure in this analysis included: 95°C for 30 sec, followed by 55 cycles of 95°C for 10 sec and 68°C for 20 sec. β-Actin was chosen as an internal control to normalize individual gene expression.
For miRNA expression, the mirVana isolation kit (Thermo Fisher Scientific, USA) was used to extract miRNAs from cultured cells. Then, a total of 0.5 μg of RNA in each sample was subjected to cDNA synthesis using a TaqMan® MicroRNA Reverse Transcription Kit (Applied Biosystems, USA). The miR-485-3p level was then examined by qRT-PCR using TaqMan Assay (ID: 478125, Applied Biosystems, USA). RNU6B (ID: 001093) was chosen as an internal control. All reactions were conducted in triplicate in at least two independent experiments.
Construction of CtBP1 vectors
For the construction of pCDNA3-CtBP1-3′-UTRWT vector, a fragment including the coding sequence (CDS) of CtBP1 (1323 bp) and its 3'-UTR (792 bp length after the CtBP1 stop code) was amplified with the following primers: 5'-CGGGGTACCATGGGCAGCTCGCACTTGCTC-3' (forward) and 5'-CCGCTCGAGCTCTTTCCAGGATTTTTATTTC-3' (reverse). The resulted fragment was cloned into the KpnI and XhoI sites of pCDNA3 vector. For the construction of pGL3-CtBP1-3′-UTRWT vector, the WT 3′-UTR of CtBP1 (792 bp) was amplified using the following specific primers: 5'-CGGGGTACCCCCGGGAGGAGCTCTCCAGCC-3' (forward) and 5'-CCGCTCGAGCTCTTTCCAGGATTTTTATTTC-3' (reverse). The resulted fragment was cloned into the KpnI and XhoI sites of pGL3 promoter vector (Promega, USA). After the generation of pCDNA3-CtBP1-3′-UTRWT and pGL3-CtBP1-3′-UTRWT vectors, the following primers including 5'-CTGTAACCATTCAGCGTCATTATTTTAAAG-3' and 5'-CTTTAAAATAATGACGCTGAATGGTTACAG-3' were subjected to construct their mutant vectors using a Q5 site-directed mutagenesis kit (New England Biolabs, USA) following the manufacturer's guidelines.
Western blot analysis
Equal amount of proteins from cultured cells and clinical tissues were separated by SDS-PAGE and then transferred to a nitrocellulose membrane (Bio-Rad Laboratories, USA). The membrane was then probed with a primary antibody including anti-CtBP1 (mouse, sc398945), anti-CtBP2 (goat, sc5967), anti-Bax (mouse, sc20067), anti-Bim (mouse, sc374358), anti-E-cadherin (mouse, sc21791), anti-PUMA (mouse, sc377015), anti-p16 (mouse, sc166760), anti-p21 (mouse, sc6246) or anti-PTEN (mouse, sc7974), followed by probing with a peroxidase-conjugated secondary antibody. All of the primary antibodies were purchased from Santa Cruz Biotechnology. The signals were detected with the ChemiDoc MP instrument (Bio-Rad Laboratories, USA).
Microarray analysis
The aberrant expression of miRNAs in osteosarcoma patients was carried out as previously described [28]. Briefly, miRNAs were isolated from three paired noncancerous and cancerous tissues using a mirVana isolation kit (Thermo Fisher Scientific, USA). In each sample, 0.5 μg RNA was labeled using a miRCURY™ Hy3/Hy5 Power kit (Exiqon, Denmark) according to the manufacturer's instructions. Then, the labeled miRNAs were used for hybridization on the miRCURY™ LNA Array (miRBase.14.0, Exiqon, Denmark) slides. The signals were obtained with an Axon GenePix 4000B microarray scanning machine (Axon Instruments, USA). The average intensities over 50 were selected as normalization factors after background correction. The individual miRNA expression data was then normalized using the median value.
Cell proliferation, colony formation, cell migration and sphere formation assays
For cell proliferation assay, the same numbers of cells were seeded in 96-well plates and then transfected with miR-NC, miR-485-3p and anti-miR-485-3p, respectively. After transfection for 0, 1, 2, 3, 4, and 5 days, cell viability was determined at 590 nm using an MTT kit (Sigma, USA) following the manufacturer's guidelines. For colony formation assay, cells transfected with miR-NC, miR-485-3p or anti-miR-485-3p were diluted and seeded in 6-well plates with a density of approximately 100 cells per well. After incubation at 37°C for 14 days, cell colonies in each well were determined by crystal violet staining. For cell migration assay, cells were cultured in RPMI1640 medium to ~80% confluency, and then treated with 5 µg/mL of mitomycin C (Sigma, USA) for 2 h. After scratching, cells were washed with PBS and incubated in fresh RPMI1640 medium. Cell migration was detected by taking images at 0 and 16 h after scratching. For sphere formation assay, cells transfected with miR-NC, miR-485-3p or anti-miR-485-3p were incubated in RPMI1640 medium for 18 h, followed by diluting and seeding into 24-well plates with a density of approximately 100 cells per well. Cells were then treated with 0.25% trypsin-EDTA and the resuspended cells were grown in fetal bovine serum (FBS) free DMEM-F12 medium supplemented with 1% B27, 20 ng/mL epidermal growth factor (EGF), 20 ng/mL basic fibroblast growth factor (bFGF), and 4 µg/mL heparin [29]. Images were taken after incubation at 37°C for 10 days.
Luciferase reporter assay
The luciferase assay was performed as previously described [30]. Briefly, The pGL3-CtBP1-3′-UTRWT and its mutant vectors were co-transfected with pRL-TK-Renilla, miR-NC, miR-485-3p-mimic and anti-miR-485-3p with the combinations shown in the figures. After incubation at 37°C for 48 h, cells were subjected to measurements of luciferase activity using a Dual-Luciferase Reporter Assay System (Promega, USA) following the manufacturer's guidelines.
DNA methylation inhibitor treatment
The same numbers of cells were seeded in 6-well plates and cultured at 37°C for 18 h. Cells were then treated with DMSO, 1 μM 5-aza-2'-deoxycytidine (AZA) (Sigma, USA), or 300 nM Trichostain A (TSA) (Sigma, USA). After 24 h treatment, cells were collected and subjected to the required experiments.
Quantitative methylation-specific PCR (qMSP)
The qMSP was carried out as previously described [31]. Briefly, genomic DNA was isolated with a Wizard® Genomic DNA Purification Kit (Promega, USA) following the manufacturer's instructions. A total of 1 µg of genomic DNA from each sample was treated with sodium bisulfite using the EZ DNA Methylation-GOLD Kit (ZYMO Research, USA) following the manufacturer's guidelines. The sodium bisulfite modified genomic DNA was then used for PCR analysis using an iQTM SYBR Green Supermix kit (Bio-Rad Laboratories, USA). The MSP primers were designed in the website (http://www.urogene.org/cgi-bin/methprimer/methprimer.cgi) by directly pasting the promoter sequences (-1500 bp) of miR-485-3p. The primers were listed in Supplementary Table 3. β-Actin was chosen as an internal control to normalize individual gene expression.
Statistical analysis
All experiments in this study were independently carried out at least three times. Statistical analyses of the experimental data were performed using a two-sided Student t-test. A P-value < 0.05 was deemed statistically significant. Data were represented as the mean ± standard deviation (SD).
3. Results
CtBP1 is overexpressed in osteosarcoma tissue samples
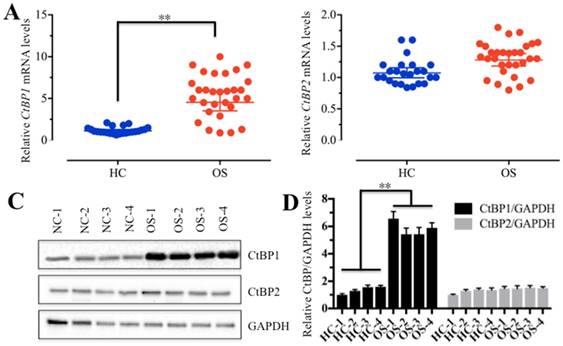
To determine if CtBPs function in the carcinogenesis of osteosarcomas, we detected CtBP mRNA levels in 30 cancerous tissues (named OS-1 to OS-30) from osteosarcoma patients whose tumors occurred at the knees and in 24 noncancerous tissues (named HC-1 to HC-24) from patients who had fractured knees. Our results indicated that 87% of cancerous tissues showed higher CtBP1 levels (≥2-fold) than noncancerous tissues (Figure 1A and Supplementary Figure 1A), suggesting that CtBP1 overexpression is a common phenomenon in osteosarcomas. However, the mRNA level of CtBP2 had not significantly changed between cancerous and noncancerous tissues (Figure 1B and Supplementary Figure 1B). To further examine if the CtBP1 protein level was also upregulated in cancerous tissues, we randomly selected 4 paired noncancerous and cancerous tissues, and then detected both CtBP1 and CtBP2 protein levels in total protein extracts by Western blot and in tissue sections by IHC staining. As shown in Figure 1C, 1D, and Supplementary Figure 2, CtBP1, but not CtBP2, was significantly upregulated in cancerous tissues.
CtBP1 is overexpressed in osteosarcoma tissues. (A and B) The relative mRNA levels of CtBP1/2 in noncancerous (HC, n=24) and cancerous (OS, n=30) tissues determined by qRT-PCR. **P<0.001. (C) The protein levels of CtBP1/2 in noncancerous (HC, n=4) and cancerous (OS, n=4) tissues. GAPDH was used as a control. (D) Statistical analysis of the protein levels in (C). **P<0.001.
CtBP1 is also overexpressed in osteosarcoma cells and represses the expression of several downstream targets
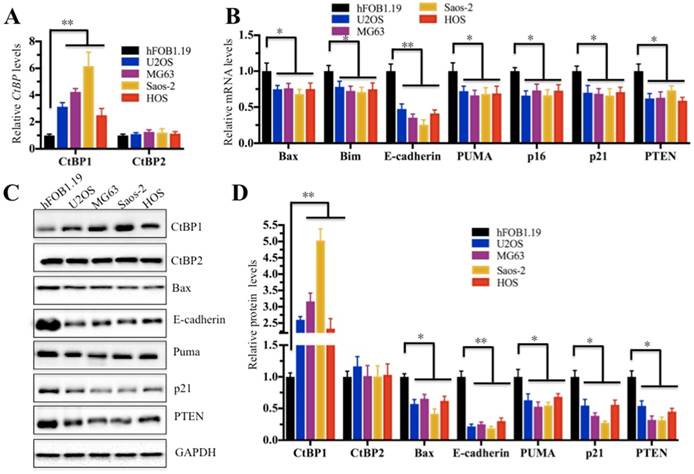
In the above study, we confirmed that CtBP1 was overexpressed in cancerous tissues. Next, we sought to investigate if it is also highly expressed in osteosarcoma cells. Thus, we examined CtBP1 mRNA levels in four human osteosarcoma cell lines, including U2OS, MG63, Saos-2 and HOS cells. Compared to hFOB1.19 cells, CtBP1 expression in all four osteosarcoma cells was significantly increased; Saos-2 cells had the most significant increase (∼6-fold) (Figure 2A). Given that a number of downstream targets of CtBP1 have been identified, we sought to detect if CtBP1 overexpression is able to downregulate its targets. Accordingly, we examined the expression of several famous tumor suppressors, including Bax, Bim, PUMA, p16, p21, E-cadherin and PTEN, which have been reported to be negatively regulated by CtBP1. As shown in Figure 2B, in contrast to the overexpression of CtBP1, the expression of these genes showed varying degrees of reduction in all four osteosarcoma cell lines, with the most pronounced decrease in E-cadherin in approximately 40% of hFOB1.19 cells, while the others 6 genes represented approximately 70% of hFOB1.19. In addition, we also detected the protein levels of CtBP1 and CtBP2, as well as their downstream targets. Similar to their mRNA levels, CtBP1 protein levels were significantly elevated in four osteosarcoma cell lines compared to hFOB1.19 cells, while the protein levels of these downstream targets were significantly reduced (Figures 2C and 2D).
CtBP1 is overexpressed in osteosarcoma cells. (A) The relative mRNA levels of CtBP1/2 in hFOB1.19, U2OS, MG63, Saos-2 and HOS cells determined by qRT-PCR. **P<0.001. (B) The relative mRNA levels of CtBP1 downstream target genes (Bax, Bim, PUMA, p16, p21, E-cadherin and PTEN) in hFOB1.19, U2OS, MG63, Saos-2 and HOS cells determined by qRT-PCR. *P<0.05, **P<0.001. (C) The protein levels of CtBP1 downstream targets (Bax, Bim, PUMA, p16, p21, E-cadherin and PTEN) in hFOB1.19, U2OS, MG63, Saos-2 and HOS cells. (D) Statistical analysis of the protein levels in (C). *P<0.05, **P<0.001.
MicroRNA-485-3p is significantly downregulated in osteosarcoma tissues
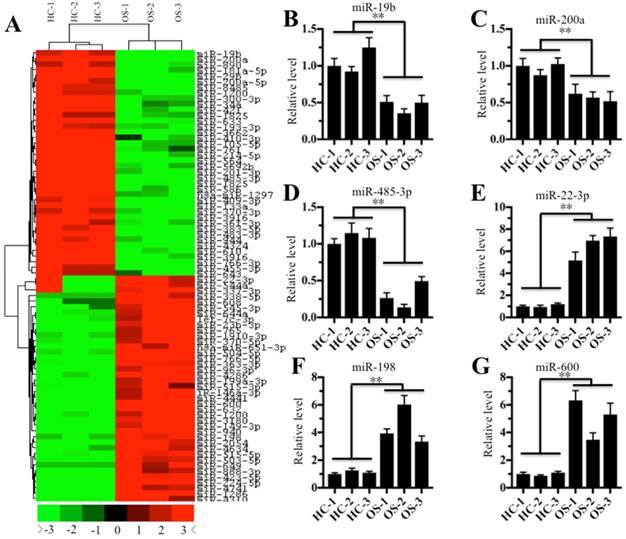
Given that miRNAs are critical factors that control gene expression, we next sought to investigate whether miRNAs are involved in the regulation of CtBP1 overexpression in osteosarcoma cells. Accordingly, we randomly selected three noncancerous tissues (HC-1, -2, and -3) and three cancerous tissues (OS-1, -2, and -3), followed by isolating their miRNAs and subjecting to a miRNA microarray analysis. In total, 128 downregulated miRNAs and 94 upregulated miRNAs were found in all three cancerous tissues compared to the control groups. As shown in Figure 3A, the hierarchical clustering analysis showed that 40 miRNAs had the most significant upregulation and downregulation, respectively. To verify the accuracy of the microarray results, we randomly selected three downregulated miRNAs (miR-19b, miR-200a and miR-485-3p) and three upregulated miRNAs (miR-22-3p, miR-198 and miR-600) for qRT-PCR verification. As shown in Figures 3B-3D, the expression miR-19b, miR-200a and miR-485-3p was significantly downregulated in all three cancerous tissues compared to the control groups, while the expression of miR-22-3p, miR-198 and miR-600 was significantly upregulated (Figures 3E-3G). To investigate whether these downregulated miRNAs can target CtBP1, we input these miRNAs into the database (http://www.mirdb.org/miRDB) to predict all their possible targets. Fortunately, we found that one miRNA known as miR-485-3p can target CtBP1. Combined with the reverse expression levels of CtBP1 and miR-485-3p in cancerous tissues (Figures 1A and 3D), we speculated that CtBP1 is likely to be a target of miR-485.
The miRNA expression profile in osteosarcoma tissues. The heat maps of the consistently downregulated and upregulated miRNAs in osteosarcoma tissues. MicroRNAs from three noncancerous tissues (HC-1, -2 and -3) and three cancerous tissues (OS-1, -2 and -3) were subjected to microarray analysis. The heat maps indicated high (red) or low (green) levels of miRNA expression. (B-G) Verification of miRNA levels in osteosarcoma tissues by qRT-PCR. The qRT-PCR was performed to verify the expression of three downregulated miRNAs, including miR-19b (B), miR-200a (C), and miR-485-3p (D), and three upregulated miRNAs, including miR-22-3p (E), miR-198 (F), and miR-600 (G). ** P < 0.001.
CtBP1 is a target of miRNA-485-3p in osteosarcoma cells
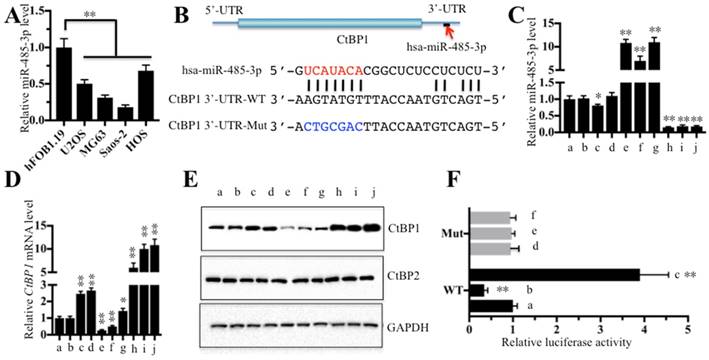
Next, we continued to examine whether miR-485-3p was also downregulated in all four osteosarcoma cell lines. As shown in Figure 4A, miR-485-3p was significantly downregulated in all four osteosarcoma cell lines compared to hFOB1.19 (∼50%-75% reduction), with the most obvious decrease being in Saos-2 (∼75% reduction). Through sequence analysis, we found that the seed sequences of miR-485-3p can target the 752-759 positions in the 3'-UTR of CtBP1 (Figure 4B). Since miR-485-3p is likely to target CtBP1 and inhibit its expression, changing the expression of miR-485-3p will inevitably lead to the change of CtBP1 expression. Based on this, we constructed vectors that included both of the CDS of CtBP1 (1323 bp) and its WT or mutated 3′-UTR (792 bp). Then, we transfected the following combinations of vectors: (a) no transfection, (b) miR-NC (negative control), (c) miR-NC + pCDNA3-CtBP1-3′-UTRWT, (d) miR-NC + pCDNA3-CtBP1-3′-UTRMut, (e) miR-485-3p-mimic, (f) miR-485-3p-mimic + pCDNA3-CtBP1-3′-UTRWT, (g) miR-485-3p-mimic + pCDNA3-CtBP1-3′-UTRMut, (h) anti-miR-485-3p, (i) anti-miR-485-3p + pCDNA3-CtBP1-3′-UTRWT, and (j) anti-miR-485-3p + pCDNA3-CtBP1-3′-UTRMut into U2OS cells, respectively, and verified the expression of miR-485-3p and CtBP1 by qRT-PCR (Figures 4C and 4D). Our results showed that the expression level of CtBP1 was completely opposite to that of miR-485-3p, that is, the expression of CtBP1 was decreased when miR-485-3p was upregulated, and CtBP1 was overexpressed when miR-485-3p was downregulated (Figures 4C-4E). We also found that miR-485-3p-mimic significantly inhibited CtBP1 in f in comparison to g (Figure 4D), which indicted that miR-485-3p bond to the 3′-UTR of CtBP1 through the UCAUACA seed sequences. However, there was no difference for CtBP1 level between i and j groups (Figures 4D and 4E), which may be caused by the inhibitory role of anti-miR-485-3p and limited the native miR-485-3p role in these cells. In addition, we also carried out a luciferase reporter assay to further verify that CtBP1 was a target of miR-485-3p. Briefly, we constructed the luciferase vectors containing the WT or mutated 3'-UTR of CtBP1, which were transferred to U2OS cells in combination with miR-NC, miR-485-3p-mimic or anti-miR-485-3p, respectively. The luciferase activity assay results indicated that miR-485-3p-mimic can inhibit while anti-miR-485-3p can enhance the activity of WT 3'-UTR compared to miR-NC (Figure 4F). All of the miR-NC, miR-485-3p-mimic and anti-miR-485-3p could not activate or inhibit the activity of the mutated 3'-UTR (Figure 4F), indicating that miR-485-3p indeed bonded to the 3'-UTR of CtBP1 through its seed sequences.
CtBP1 is a direct target of miR-485-3p. The relative miR-485-3p level in hFOB1.19, U2OS, MG63, Saos-2 and HOS cells determined by qRT-PCR. **P<0.001. (B) Schematic representation of CtBP1 3′-UTR contained a putative miR-485-3p binding site. The binding position of miR-485-3p in the 3'-UTR of CtBP1 is shown by the red arrow. The seed location of miR-485-3 is indicated with the red font. The wild-type (WT) and mutant (Mut) 3′-UTRs of CtBP1 were shown. The following combinations of vectors: (a) no transfection, (b) miR-NC (negative control), (c) miR-NC + pCDNA3-CtBP1-3′-UTRWT, (d) miR-NC + pCDNA3-CtBP1-3′-UTRMut, (e) miR-485-3p-mimic, (f) miR-485-3p-mimic + pCDNA3-CtBP1-3′-UTRWT, (g) miR-485-3p-mimic + pCDNA3-CtBP1-3′-UTRMut, (h) anti-miR-485-3p, (i) anti-miR-485-3p + pCDNA3-CtBP1-3′-UTRWT, and (j) anti-miR-485-3p + pCDNA3-CtBP1-3′-UTRMut, were transfected into U2OS cells, respectively. Then, qRT-PCR was performed to examine the miR-485-3p level (C) and CtBP1 mRNA level (D). **P<0.001. (E) Western blot was performed to detect the protein levels of CtBP1 and CtBP2 in cells used in (C). GAPDH was used as a loading control. (F) The miR-485-3p failed to bind the mutated 3′-UTR of CtBP1. The following combinations of plasmids were transfected into U2OS cells, respectively. (a) pGL3-CtBP1-3′-UTRWT + pRL-TK-Renilla + miR-NC; (b) pGL3-CtBP1-3′-UTRWT + pRL-TK-Renilla + miR-485-3p-mimic; (c) pGL3-CtBP1-3′-UTRWT + pRL-TK-Renilla + anti-miR-485-3p; (d) pGL3-CtBP1-3′-UTRMut + pRL-TK-Renilla + miR-NC; (e) pGL3-CtBP1-3′-UTRMut + pRL-TK-Renilla + miR-485-3p-mimic; and (f) pGL3-CtBP1-3′-UTRMut + pRL-TK-Renilla + anti-miR-485-3p. The luciferase activity was measured using a Dual-Luciferase Reporter Assay System. ** P < 0.001.
MicroRNA-485-3p positively regulates the expression of CtBP1 downstream targets
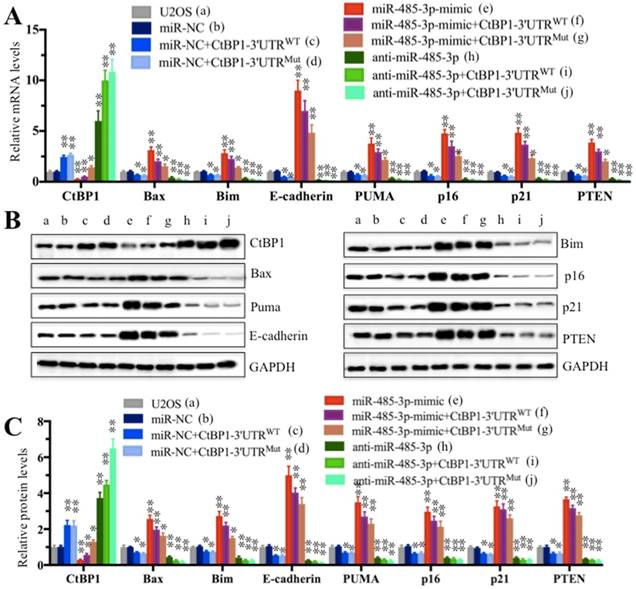
Since miR-485-3p negatively regulated the expression of CtBP1 and because CtBP1 negatively regulated the expression of its downstream targets, we speculated that miR-485-3p could positively regulate the expression of CtBP1 downstream targets. To test this hypothesis, we detected the mRNA and protein levels of Bax, Bim, E-cadherin, PUMA, p16, p21 and PTEN in cells used in Figure 4C. The qRT-PCR results showed that the expression of these targets was completely opposite to that of CtBP1 (Figure 5A). By comparing the expression of individual gene in the b and e group cells, we found that the expression of these CtBP1 target genes was increased to varying degrees in cells transfected with miR-485-3p-mimic compared to cells transfected with miR-NC, and the E-cadherin level increased most significantly (∼9-fold) (Figure 5A). In contrast, the expression of the CtBP1 target genes was decreased to varying degrees in cells transfected with anti-miR-485-3p (h), with E-cadherin being the most significant (∼ 75% reduction) (Figure 5A). In addition, we also compared the expression of these targets in f and g, as well as i and j groups (Figure 5A). In contrast to CtBP1 level, the expression of these targets in f was significantly higher than g (Figure 5A). There was also no significant difference for the expression of these targets between i and j groups (Figure 5A). Similar to mRNA levels, the protein levels of these CtBP1 targets were also upregulated and downregulated in cells transfected with miR-485-3p-mimic and anti-miR-485-3p, respectively (Figures 5B and 5C).
The miR-485-3p-mimic upregulated the expression of CtBP1 target genes. Cells used in Figure 4C were subjected to examine the mRNA levels (A) and protein levels (B and C) of CtBP1 downstream targets, including Bax, Bim, PUMA, p16, p21, E-cadherin and PTEN were measured by qRT-PCR and Western blot, respectively. ** P < 0.001.
Overexpression of miR-485-3p in U2OS cells inhibits oncogenic phenotypes
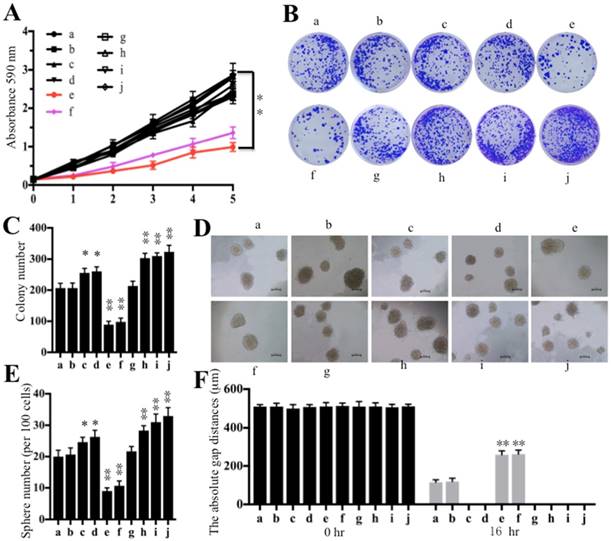
Some studies have shown that the increased expression of CtBP1 promotes cell proliferation, cell migration, colony formation and sphere formation abilities [32-35]. Thus, we next wanted to evaluate these oncogenic phenotypes through the overexpression or downregulation of miR-485-3p. Similarly, we also subjected cells used in Figure 4C to cell proliferation, cell migration, colony formation and sphere formation assays. Our results indicated that cells transfected with miR-485-3p-mimic (e) decreased osteosarcoma cell viability in comparison to cells transfected with miR-NC (b) and anti-miR-485-3p (h) (Figure 6A). By comparing cell viability in the f and g group cells, we found that the mutated 3′-UTR of CtBP1 significantly increased cell viability (Figure 6A). Similarly, decreased colony formation, sphere formation and cell migration abilities, were also found in cells transfected with miR-485-3p-mimic (Figures 6B-6F and Supplementary Figure 3A). Consistently, we also found that miR-485-3p-mimic cannot bind to the mutated 3′-UTR of CtBP1, and eventually causing the increased colony formation, sphere formation and cell migration abilities in g than f group cells (Figures 6B-6F and Supplementary Figure 3A). However, we did not find that cells expressing lower miR-485-3p through transfection with anti-miR-485-3p (h, i and j) had obvious differences regarding their oncogenic phenotypes (Figures 6A-6F and Supplementary Figure 3A). Given that the sphere formation assay is widely used to investigate cancer stem cells (CSCs), thus, we also detected the expression of CD44 and CD133, two biomarkers of CSC, in the cells used for sphere formation assay. Our results indicated that overexpression of miR-485-3p dramatically inhibited the expression of CD44 and CD133, while repression of miR-485-3p significantly upregulated the expression of these two genes (Supplementary Figures 3B and 3C), which further verified miR-485-3p was a negative regulator of CSC.
Overexpression of miR-485-3p inhibited oncogenic phenotypes. Cells used in Figure 4C were subjected to a series of studies to evaluate oncogenic phenotypes. (A) Cell proliferation assay assessed by MTT assay for 5 days. ** P < 0.001. (B) Colony formation assay was performed in RPMI1640 medium with a density of 100 cells per well. After incubation for 14 days, colonies were stained by crystal violet. (C) Colony numbers in (B) were quantified. **P < 0.001. (D) Sphere formation assay was carried out in FBS free DMEM-F12 medium supplemented with B27, EGF, bFGF and heparin for 10 days. Bars=50 μm. (E) Sphere numbers in (D) were quantified. **P < 0.001. (F) Cell migration assessed by scratch assay after treatment with mitomycin C for 2 h. The quantification results of the cell migration gap distance represented three biological replications. ** P < 0.001.
DNA hypermethylation plays predominant roles in the downregulation of miR-485-3p in osteosarcoma cells
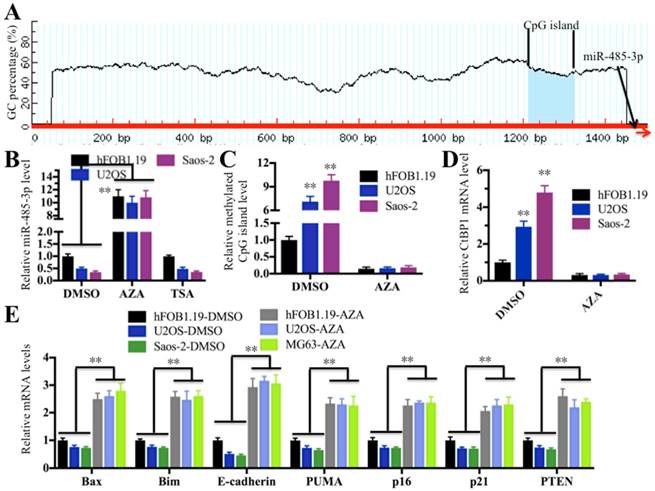
DNA hypermethylation and hyperacetylation in the vicinity of the genome where miRNAs locate are the two major causes of aberrant miRNA expression [36, 37]. To elucidate the molecular mechanism underlying the downregulation of miR-485-3p in osteosarcoma cells, we next sought to investigate whether DNA hypermethylation and hyperacetylation are involved in miR-485-3p downregulation. Initially, we analyzed the promoter sequences (-1500 bp) of miR-485-3p in a database (http://www.urogene.org) to determine if it contains a CpG island because DNA methylation often occurs at CpG islands. Fortunately, we found a CpG island located in upstream (-175-287) of miR-485-3p (Figure 7A), which suggested that DNA hypermethylation in this CpG island might play a critical role in regulating miR-485-3p expression. To test this hypothesis, we used the DNA methylation inhibitor AZA to treat hFOB1.19, U2OS and MG63 cells in order to reduce or completely remove DNA methylation and then examine miR-485-3p expression. At the same time, we also treated cells with DMSO and the acetylation inhibitor TSA as controls. As shown in Figure 7B, the expression of miR-485-3p was significantly increased after AZA treatment compared to DMSO treatment, but its expression had not changed with the treatment of TSA in comparison to DMSO treatment. These results clearly indicated that DNA methylation was very important for the downregulation of miR-485-3p in osteosarcoma cells. To further confirm this notion, we examined the DNA methylation level of this CpG island in hFOB1.19, U2OS and MG63 cells treated with or without AZA by the qMSP method. Our results showed that CpG islands in U2OS and MG63 cells are highly methylated compared to hFOB.19 cells in the absence of AZA treatment (Figure 7C). Interestingly, the DNA methylation of this CpG island in U2OS and MG63 cells was significantly reduced when we treated cells with AZA, and no obvious differences were identified among these cell lines after AZA treatment (Figure 7C). In addition, we also examined the expression of CtBP1 and its target genes in cells treated with AZA. As expected, the expression of CtBP1 in U2OS and MG63 cells was dramatically decreased after AZA treatment, whereas the expression of its target genes was significantly increased (Figures 7D and 7E). In order to verify that miR-485-3p was also downregulated in osteosarcoma cancerous tissues and to detect DNA methylation level in its promoter region, we examined their levles in the cancerous and noncancerous tissues used in miRNA microarray assay. Consistent with the results in osteosarcoma cells, our results indicated that the expression of miR-485-3p was dramatically reduced in cancerous tissues (Supplementary Figure 4A), whereas the DNA methylation level in its promoter region was significantly increased (Supplementary Figure 4B).These results suggested that DNA hypermethylation in the miR-485-3p promoter region is the underlying cause of the aberrant expression of miR-485-3p, CtBP1, and its target genes in osteosarcoma cells.
Downregulation of miR-485-3p in osteosarcoma cells was caused by the DNA hypermethylation of CpG islands. (A) The adjacent upstream of miR-485-3p had a CpG island. The genomic locus of the CpG island and miR-485-3p were shown. (B) AZA treatment significantly upregulated miR-485-3p levels. The hFOB1.19, U2OS and MG63 cells were treated with DMSO, 1 μM of AZA and 300 nM of TSA, respectively. The qRT-PCR was performed to measure miR-485-3p levels. **P < 0.001. (C) AZA treatment dramatically decreased DNA methylation of CpG island in U2OS and MG63 cells. The qMSP was performed to determine DNA methylation of CpG island in hFOB1.19, U2OS and MG63 cells. **P < 0.001. (D) AZA treatment dramatically decreased the CtBP1 level in U2OS and MG63 cells. The qRT-PCR was performed to determine CtBP1 levels in hFOB1.19, U2OS and MG63 cells. **P < 0.001. (E) AZA treatment significantly upregulated the CtBP1 target gene in U2OS and MG63 cells. The qRT-PCR was performed to determine CtBP1 targets, including Bax, Bim, PUMA, p16, p21, E-cadherin and PTEN in hFOB1.19, U2OS and MG63 cells. **P < 0.001.
4. Discussion
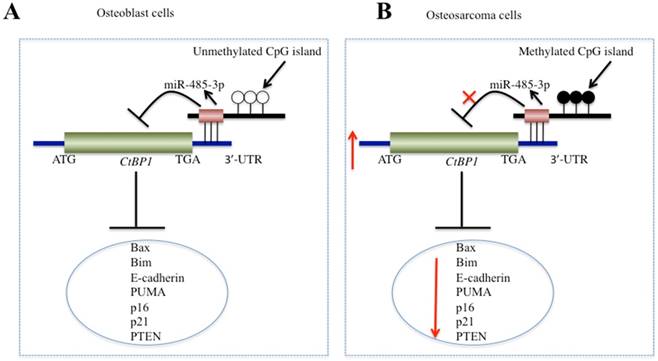
In recent years, increasing numbers of studies have shown that CtBPs, especially CtBP1, are overexpressed as oncogenes in many cancer types [10-15]. However, to the best of our knowledge, CtBPs have not been identified to play roles in osteosarcoma cells. In this study, we found the overexpression of CtBP1, but not CtBP2, in a large number of osteosarcoma clinical specimens and in four osteosarcoma cells. Since the amino acid sequences of CtBP1 and CtBP2 are highly homologous, this allowed us to start looking for the reason why only CtBP1 is overexpressed. By performing microarray assays in clinical samples of osteosarcoma, we found that miR-485-3p binds to the 3'-UTR of CtBPl, but not target CtBP2. Subsequently, by increasing or decreasing the expression of miR-485-3p in osteosarcoma cells, we found that the expression of CtBP1 and its target genes also changed. In addition, we discovered the DNA hypermethylation of the miR-485-3p promoter region in osteosarcoma cells and found the underlying cause of miR-485-3p downregulation. In this study, we solved a complete signaling pathway regulation pattern, in which the hypermethylation of DNA at the CpG island resulted in the downregulation of miR-485-3p in osteosarcoma cells, dismissing its inhibition of CtBP1 and causing CtBP1 overexpression. The overexpression of CtBP1 represses the expression of a series of downstream genes and eventually causes carcinogenesis (Figure 8).
Schematic model of miR-485-3p in osteosarcoma cells. (A) The working model of miR-485-3p in normal cells. In normal cells, the CpG methylation level in the miR-485-3p promoter region is very low, which cannot effectively inhibit the expression of miR-485-3p, resulting in the upregulation of miR-485-3p, downregulation of CtBP1 expression, and upregulation of CtBP1 downstream targets. (B) The working model of miR-485-3p in osteosarcoma cells. In osteosarcoma cells, the CpG methylation level in the miR-485-3p promoter region is very high, which significantly inhibits the expression of miR-485-3p, resulting in the downregulation of miR-485-3p, upregulation of CtBP1 expression, and downregulation of CtBP1 downstream targets, which eventually leads to carcinogenesis.
Although CtBPs have been found to be abnormally expressed in many biological processes, as of now, few articles have studied the causes of their aberrant expression in depth. Like many other types of cancer, we also found that CtBP1 is overexpressed in osteosarcoma. To investigate the underlying cause of its overexpression, we focused on miRNAs and sought to find miRNAs that can specifically regulate CtBP1 in osteosarcoma cells. Fortunately, we found that miR-485-3p specifically regulates the expression of CtBP1. Through a series of experimental validation and functional assays, we found that miR-485-3p-mimic can inhibit the growth of osteosarcoma cells. This finding will help us to treat osteosarcoma by developing miRNA replacements. However, in the current study, we did not examine the tumor growth inhibition assay of miR-485-3p-mimic in mouse osteosarcoma models. We will focus on the in vivo effects miR-485-3p-mimic in future studies.
Another important finding in this study was that CtBP1 regulates the expression of a number of downstream target genes, including Bax, Bim, PUMA, p16, p21, E-cadherin and PTEN (Figures 2B-2D). Previous studies have found that CtBP1 can regulate the expression of different target genes in different biological processes [10-15]. For example, CtBP1 overexpression can promote cancer cell survival by inhibiting the expression of pro-apoptotic genes such as Bax, Bim and PUMA [10-15]. CtBP1 overexpression can promote cell proliferation and tumor progression by inhibiting cell cycle-related genes such as p16, p21 and PTEN [10-15]. CtBP1 overexpression can promote cell migration by inhibiting the expression of the cell adhesion molecule E-cadherin [10-15]. Our results revealed that the mRNA and protein levels of these target genes were suppressed in osteosarcoma, with E-cadherin being the most prominent. We did not detect the apoptosis rates, cell cycle progression statues and cell migration ability in osteosarcoma cells compared to hFOB1.19 cells. However, many previous studies have reported that osteosarcoma cells have decreased apoptosis rates, arrested cell cycles, and increased cell migration ability. At the same time, we transfected miR-485-3p into osteosarcoma cells and found that it can inhibit cell proliferation, migration, colony formation, and sphere formation, which further demonstrates that the aberrant expression of CtBP1 affects a series of biological processes, resulting in many oncogenic phenotypes.
In summary, we demonstrated that the DNA methylation-mediated downregulation of miR-485-3p specifically regulates CtBP1 and its downstream targets in osteosarcoma cells. The miR-485-3p-mimic exhibits a remarkable inhibitory effect on CtBP1 and thereby potently inhibits osteosarcoma cell proliferation, migration, colony formation and sphere formation abilities in vitro. Our data suggested that the miR-485-3p-mimic is an effective therapeutic agent that inhibits CtBP1, and miR-485-3p-replacement therapy should significantly enhance the antitumor activity.
Supplementary Material
Supplementary figures and tables.
Acknowledgements
We thank Dr. Tongzhou Wang for his carefully reading this article and presenting valuable amendments. This work was supported by the following fundings: The Scientific Research Fund Project of the Yunnan Provincial Education Department (Grant Number 2018JS199), The Joint Project of Yunnan Science and Technology Department and Kunming Medical University Foundation (Grant Number 2013FZ269, 2014FB025) and Doctoral Initial Foundation of the First Affiliated Hospital, Kunming Medical University (Grant Number 2016BS023).
Authors' contributions
C. Z. designed the research. K. D. performed the major parts of the experiments. X. Z., Z. L., P. G., F. Z., B. W., and L. C. performed parts of the research. K. D. and C. Z. analysed the data, tested statistics, and coordinated the figures. C. Z. wrote the article. K. D. revised the article.
Competing Interests
The authors have declared that no competing interest exists.
References
1. Zhou Q, Chen F, Fei Z, Zhao J, Liang Y. et al. Genetic variants of lncRNA HOTAIR contribute to the risk of osteosarcoma. Oncotarget. 2016;7:19928-34
2. Duchman KR, Gao Y, Miller BJ. Prognostic factors for survival in patients with high-grade osteosarcoma using the Surveillance, Epidemiology, and End Results (SEER) Program database. Cancer Epidemiol. 2015;39:593-9
3. Duong LM, Richardson LC. Descriptive epidemiology of malignant primary osteosarcoma using population-based registries, United States, 1999-2008. J Registry Manag. 2013;40:59-64
4. Stankiewicz TR, Gray JJ, Winter AN, Linseman DA. C-terminal binding proteins: central players in development and disease. Biomol Concepts. 2014;5:489-511
5. Postigo AA, Dean DC. ZEB represses transcription through interaction with the corepressor CtBP. Proc Natl Acad Sci U S A. 1999;96:6683-8
6. Turner J, Crossley M. Cloning and characterization of mCtBP2, a co-repressor that associates with basic Kruppel-like factor and other mammalian transcriptional regulators. EMBO J. 1998;17:5129-40
7. Shen Y, Kapfhamer D, Minnella AM, Kim JE, Won SJ. et al. Bioenergetic state regulates innate inflammatory responses through the transcriptional co-repressor CtBP. Nat Commun. 2017;8:624
8. Blevins MA, Huang M, Zhao R. The Role of CtBP1 in Oncogenic Processes and Its Potential as a Therapeutic Target. Mol Cancer Ther. 2017;16:981-90
9. Hildebrand JD, Soriano P. Overlapping and unique roles for C-terminal binding protein 1 (CtBP1) and CtBP2 during mouse development. Mol Cell Biol. 2002;22:5296-307
10. Deng Y, Deng H, Liu J, Han G, Malkoski S. et al. Transcriptional down-regulation of Brca1 and E-cadherin by CtBP1 in breast cancer. Mol Carcinog. 2012;51:500-7
11. Wang R, Asangani IA, Chakravarthi BV, Ateeq B, Lonigro RJ. et al. Role of transcriptional corepressor CtBP1 in prostate cancer progression. Neoplasia. 2012;14:905-14
12. May T, Yang J, Shoni M, Liu S, He H. et al. BRCA1 expression is epigenetically repressed in sporadic ovarian cancer cells by overexpression of C-terminal binding protein 2. Neoplasia. 2013;15:600-8
13. Pena C, Garcia JM, Garcia V, Silva J, Dominguez G. et al. The expression levels of the transcriptional regulators p300 and CtBP modulate the correlations between SNAIL, ZEB1, E-cadherin and vitamin D receptor in human colon carcinomas. Int J Cancer. 2006;119:2098-104
14. Paliwal S, Ho N, Parker D, Grossman SR. CtBP2 Promotes Human Cancer Cell Migration by Transcriptional Activation of Tiam1. Genes Cancer. 2012;3:481-90
15. Valenta T, Lukas J, Korinek V. HMG box transcription factor TCF-4's interaction with CtBP1 controls the expression of the Wnt target Axin2/Conductin in human embryonic kidney cells. Nucleic Acids Res. 2003;31:2369-80
16. Chen Z, Zhang W, Jiang K, Chen B, Wang K. et al. MicroRNA-300 Regulates the Ubiquitination of PTEN through the CRL4B(DCAF13) E3 Ligase in Osteosarcoma Cells. Mol Ther Nucleic Acids. 2018;10:254-68
17. Reddy KB. MicroRNA (miRNA) in cancer. Cancer Cell Int. 2015;15:38
18. Oliveto S, Mancino M, Manfrini N, Biffo S. Role of microRNAs in translation regulation and cancer. World J Biol Chem. 2017;8:45-56
19. Macfarlane LA, Murphy PR. MicroRNA: Biogenesis, Function and Role in Cancer. Curr Genomics. 2010;11:537-561
20. Jansson MD, Lund AH. MicroRNA and cancer. Mol Oncol. 2012;6:590-610
21. Peng Y, Croce CM. The role of MicroRNAs in human cancer. Signal Transduct Target Ther. 2016;1:15004
22. Deng Y, Deng H, Bi F, Liu J, Bemis LT. et al. MicroRNA-137 targets carboxyl-terminal binding protein 1 in melanoma cell lines. Int J Biol Sci. 2011;7:133-7
23. Kottawatta KS, So KH, Kodithuwakku SP, Ng EH, Yeung WS, Lee KF. MicroRNA-212 Regulates the Expression of Olfactomedin 1 and C-Terminal Binding Protein 1 in Human Endometrial Epithelial Cells to Enhance Spheroid Attachment In Vitro. Biol Reprod. 2015;93:109
24. Wu J, Li J, Ren J, Zhang D. MicroRNA-485-5p represses melanoma cell invasion and proliferation by suppressing Frizzled7. Biomed Pharmacother. 2017;90:303-10
25. Xiong D, Sheng Y, Ding S, Chen J, Tan X, Zeng T, Qin D, Zhu L, Huang A, Tang H. LINC00052 regulates the expression of NTRK3 by miR-128 and miR-485-3p to strengthen HCC cells invasion and migration. Oncotarget. 2016;7:47593-608
26. Lou C, Xiao M, Cheng S, Lu X, Jia S, Ren Y, Li Z. MiR-485-3p and miR-485-5p suppress breast cancer cell metastasis by inhibiting PGC-1alpha expression. Cell Death Dis. 2016;7:e2159
27. Duraiyan J, Govindarajan R, Kaliyappan K, Palanisamy M. Applications of immunohistochemistry. J Pharm Bioallied Sci. 2012;4:S307-9
28. Li Q, Li H, Zhao X, Wang B, Zhang L. et al. DNA Methylation Mediated Downregulation of miR-449c Controls Osteosarcoma Cell Cycle Progression by Directly Targeting Oncogene c-Myc. Int J Biol Sci. 2017;13:1038-50
29. Wang YJ, Bailey JM, Rovira M, Leach SD. Sphere-forming assays for assessment of benign and malignant pancreatic stem cells. Methods Mol Biol. 2013;980:281-90
30. Clement T, Salone V, Rederstorff M. Dual luciferase gene reporter assays to study miRNA function. Methods Mol Biol. 2015;1296:187-98
31. Botezatu A, Goia-Rusanu CD, Iancu IV, Huica I, Plesa A. et al. Quantitative analysis of the relationship between microRNA124a, -34b and -203 gene methylation and cervical oncogenesis. Mol Med Rep. 2011;4:121-8
32. Bergman LM, Birts CN, Darley M, Gabrielli B, Blaydes JP. CtBPs promote cell survival through the maintenance of mitotic fidelity. Mol Cell Biol. 2009;29:4539-51
33. Dorman K, Shen Z, Yang C, Ezzat S, Asa SL. CtBP1 interacts with Ikaros and modulates pituitary tumor cell survival and response to hypoxia. Mol Endocrinol. 2012;26:447-47
34. Zhao C, Shen Y, Tao X, Xu J, Lu J, Liu C. et al. Silencing of CtBP1 suppresses the migration in human glioma cells. J Mol Histol. 2016;47:297-304
35. De Luca P, Dalton GN, Scalise GD, Moiola CP, Porretti J, Massillo C. et al. CtBP1 associates metabolic syndrome and breast carcinogenesis targeting multiple miRNAs. Oncotarget. 2016;7:18798-811
36. Baser C, Claus R, Plass C. Genome-wide epigenetic regulation of miRNAs in cancer. Cancer Res. 2013;73:473-7
37. Baer C, Claus R, Frenzel LP, Zucknick M, Park YJ, Gu L. et al. Extensive promoter DNA hypermethylation and hypomethylation is associated with aberrant microRNA expression in chronic lymphocytic leukemia. Cancer Res. 2012;72:3775-85
Author contact
![]() Corresponding author: zhangchunqiangcom
Corresponding author: zhangchunqiangcom