Impact Factor ISSN: 1449-2288
- Issue 12; 2026
- Issue 11; 2026
- Issue 10; 2026
- Issue 9; 2026
- Issue 8; 2026
- Volume 22; 2026
- Past Issues
- Advance Articles
- Editorial Board
- Cover Images
- Index & Coverage
- Cover Suggestion
- Special Issues
Introduction
Material and Methods
Results
Discussion
Abbreviations
Supplementary Material
Acknowledgements
References

 Global reach, higher impact
Int J Biol Sci 2018; 14(11):1466-1471. doi:10.7150/ijbs.26987 This issue Cite
Research Paper
Demonstrating the Potential of Using Transcutaneous Oxygen and Carbon Dioxide Tensions to Assess the Risk of Pressure Injuries
Mei Xue1#, Dandan Wang2#, Zhaozhi Zhang3, Zhixin Cao1 ![]() , Zujin Luo1, Yingying Zheng1, Jingjing Lu1, Qi Zhao2, Xiaohua Douglas Zhang2
, Zujin Luo1, Yingying Zheng1, Jingjing Lu1, Qi Zhao2, Xiaohua Douglas Zhang2 ![]()
1. Department of Respiratory and Critical Care Medicine, Beijing Chao-Yang Hospital, Capital Medical University; Beijing Institute of Respiratory Medicine, Beijing Engineering Research Center of Respiratory and Critical Care Medicine, Engineering Research Center of Diagnosis and Treatment of Respiratory and Critical Care Medicine, Beijing Chaoyang Hospital, Beijing 100043, China
2. Faculty of Health Sciences, University of Macau, Taipa 999078, Macau
3. Department of Statistical Science, Duke University, Durham, NC 27708, USA
#: These authors contributed equally.
Received 2018-5-1; Accepted 2018-6-22; Published 2018-8-6
Abstract

Pressure injuries have a high incidence in elderly and critically ill patients, and can endanger lives in severe cases. The key to reducing the incidence of pressure injuries is to find an objective, noninvasive, automatic and consistent scientific method for assessing pressure injuries. To serve this need, we conducted a clinical study to investigate the potential of using transcutaneous oxygen tension (TcPO2) and transcutaneous carbon dioxide tension (TcPCO2) for assessing pressure injuries. From the results of the study we found that first, the values of TcPO2 and TcPCO2 are sensitive to the change of pressure imposed on the measured region and to the risk status of a pressure injury when a pressure is imposed. Second, the magnitude of change in TcPO2 and TcPCO2 is higher in patients with a high risk of a pressure injury compared with those who have a low risk. Third, TcPO2 and TcPCO2 are both significantly correlated with the Braden score, the widely used score for assessing the risk of a pressure injury. Therefore, TcPO2 and TcPCO2 have a potential to be an effective and convenient scientific tool for assessing the risk of pressure injuries.
Keywords: Pressure injury, transcutaneous oxygen tension, transcutaneous carbon dioxide tension, Braden score
Introduction
A pressure injury is the local lesion of skin and/or soft tissue at the bone prominence or the contact with a medical instrument [1]. It is a common complication with the skin and soft tissue in patients with limited autonomous use of their bodies. It has a higher incidence in susceptible populations such as the elderly and critically ill individuals. It can endanger lives in severe cases, resulting in a heavy burden being placed on patients [2]. Early assessment of the risk of pressure injuries is crucial in reducing its incidence [3, 4].
The Braden scale is currently the most widely used tool for assessing the risk of developing a pressure injury [5, 6]. However, clinical practice reveals two major issues when nurses apply the Braden scale in their clinical work [7-9]. First, it lacks authoritative scientific assessment standards and quantitative criteria for grading all risk factors. This leads to a wide deviation of scores and causes low sensitivity and specificity in predicting the risk of a pressure injury. Second, there are certain limitations when it is used in the ICU because almost all ICU patients are in the high-risk population and there are only slight differences between the scores of high risk and extremely high risk patients. A Cochrane review showed that the use of a structural questionnaire to assess pressure injury risk is not directly related to the reduction of pressure injuries [10].
It is generally agreed upon that the key to reducing the incidence of pressure injuries for patients is to find an objective, noninvasive, automatic and consistent scientific method for assessing pressure injuries [11]. Safe, simple and reliable monitoring indices have great value in modern disease management [12]. Likewise, this type of indices can play a key role in predicting the occurrence, guiding the treatment and judging the prognosis of pressure injuries. At present, there are mainly 4 means of noninvasive monitoring that can be used for pressure injury monitoring: Laser Doppler blood flow monitoring, Laser Doppler imaging, TcPO2 and TcPCO2, and the surface temperature of skin. Laser Doppler blood flow monitoring and laser Doppler imaging equipment are expensive, complex and difficult to use extensively during care. Monitoring skin surface temperature is simple, but it can only indirectly reflect the hypoxia condition of local pressed tissues. Only TcPO2 and TcPCO2 can directly monitor the capillary gas content in the local tissues noninvasively and they are readily measured with objective readouts.
Studies have been conducted to explore the relationship between TcPO2 (and TcPCO2) and pressure injuries [13-15]. For example, Baldwin [15] demonstrated that the post-pressure TcPCO2 mean levels were lower at all time-points and TcPCO2 mean levels were higher at most time-points in the subjects who were able to move compared to those who could not.
Although the Braden scale has much controversy, it is still the standard method for assessing the risk of a pressure injury. To explore the potential of TcPO2 and TcPCO2 as a tool to evaluate the risk of a pressure injury, it is necessary to investigate the relationship between TcPO2 (or TcPCO2) and the Braden score. However, a literature review shows a lack of studies in this area [16-18]. To fill this gap, we conducted a study to investigate the correlation between TcPO2 (and TcPCO2) and the Braden score.
It has been shown that the predictive value of using the Braden scale to predict the risk of pressure injuries is low, only 8%-13% [19], which hints that correlation analysis alone is not enough. To investigate the use of TcPO2 (and TcPCO2) to assess the risk of pressure injuries, we need to further explore whether TcPO2 (and TcPCO2) has the following properties that an effective metric for assessing the risk of a pressure injury should have: 1) its value is sensitive to not only the risk status of pressure injuries but also to the change of pressure imposed on the measured region, and 2) the magnitude of its change is higher in the patients with a high risk of pressure injuries compared to those with a low risk. Our study was accordingly designed to test whether TcPO2 (and TcPCO2) has the aforementioned properties as well as investigate its correlation with the Braden score.
Material and Methods
Study Subjects
Convenience sampling was adopted to select 80 inpatients in Beijing Chaoyang Hospital from February 1, 2017 to May 31, 2017. Selected subjects must have no pressure injuries. The research was reviewed and approved by the Ethics Committee of Beijing Chaoyang Hospital, an affiliated hospital of Capital Medical University, Beijing, China and the item number was 2017-KE-86. All the subjects have signed a written informed consent form.
To investigate whether TcPO2 (and TcPCO2) has the properties of an effective metric for assessing the risk of pressure injuries described in the Introduction Section, we need to first define the status of the risk for a pressure injury. Due to inaccuracies in the Braden Score, we do not use the defined categories of pressure injury as defined by Braden score. On the other hand, considering that the Braden score is still the gold-standard for assessing the risk of pressure injury, we adopt a balanced approach to define the risk status of a pressure injury, namely defining the status of risk into only two groups, a high-risk group (i.e., patients with a Braden score of no more than 12 points) and a low-risk group (i.e., patients with a Braden score of 15 to 22 points). Considering the inaccuracies in the Braden score, we do not classify the patients with a Braden score of 12 to 15 into the low-risk or high-risk groups. General data were collected using a self-designed questionnaire. It included age, gender, disease diagnosis, arterial blood gas and other related conditions of the patients in the study.
This study contains 31 cases (25 male, 6 female, aged 41~88 years old and average age of 71.56±12.30 years) in the high-risk group and 49 cases (32 male and 17 female, aged 40~87 years old and average age of 66.94±15.23 years) in the low-risk group. The age difference of the two groups was statistically analyzed using a t-test, and the gender difference was checked by a chi-square test. The results showed no statistically significant differences in age (t=1.439, P=0.155) and gender (chi-square=1.496, P=0.221) between the two groups.
Methods
The patients were scored by nurses using the Braden scale after admission, and were divided into the high-risk and low-risk groups. The researchers conducted a unified training for the members of the study group on TcPO2 and TcPCO2 measurement. The members of the study group repeated the Braden scoring for the patients before the test, confirmed the division of the high-risk and low-risk groups, and measured TcPO2 and TcPCO2 within 48 hours after admission.
TcPO2 and TcPCO2 directly monitor the capillary gas content in the local tissue of any part of the body non-invasively. We used Radiometer TCM CombiM and followed instructions provided in the equipment manual. All methods were performed in accordance with the relevant guidelines and regulations. This study measured TcPO2 and TcPCO2 values at the sacrococcygeal regions in lateral and supine positions and the anterior chest in a lateral position in the same way for both groups with the following procedure.
(A) After starting the machine, the temperature of the probe was set to 44℃ to ensure the maximum relaxation of the blood vessel. The probe was preheated for 20 minutes. Starting with lateral position, to ensure the sacrococcygeal regions were not pressed, the researchers placed the monitoring probe on patients' sacrococcygeal regions. TcPO2 and TcPCO2 were measured for ~20 minutes after they stabilized (i.e., variation range≤2mmHg, and the retention time ≥5min).
(B) Patients changed from lateral to supine position. Then TcPO2 and TcPCO2 were measured for ~20 minutes after they stabilized.
(C) The electrode was removed from the patients' sacrococcygeal regions. The researcher placed a monitor probe on the patient's anterior chest (the second intercostal space, left midclavicular line) while the patient was in lateral position and TcPO2 and TcPCO2 were measured for ~20 minutes after they stabilized.
The statistical software R version 3.4.1 was used for statistical analysis. Mean± standard deviation/ median was used to describe measurement data, such as age and gender. The distributions of TcPCO2 and TcPCO2 values are essentially normally distributed after the normality is checked. Thus t-test was adopted to compare the value of TcPO2 (and TcPCO2) before and after the position change. The correlations between the change of TcPO2 and the Braden Scale and between the change of TcPCO2 and the Braden Scale were investigated using correlation analysis.
Results
Comparison of TcPO2 and TcPCO2 between the sacrococcygeal and chest regions in lateral position
We calculated the difference between TcPO2 and TcPCO2 in the sacrococcygeal region and that in the chest in the lateral position and tested its statistical significance using a t-test. The results are displayed in Table 1 which shows no statistically significant difference in the TcPO2 (and TcPCO2) values between the sacrococcygeal and chest regions of patients in a lateral position in either the low- or high- risk group. That is, there is no statistically significant difference in tissue perfusion between sacrococcygeal regions and anterior chest when the sacrococcygeal regions bear little pressure.
Comparison results for TcPO2 and TcPCO2 values between the sacrococcygeal region and the chest of patients in lateral position
| Patient group | Pressure Measurement | Value in the sacrococcygeal region | Value in the Chest | P value |
|---|---|---|---|---|
| high-risk | TcPO2 | 73.97 ± 25.52 | 73.03 ± 22.84 | 0.879 |
| TcPCO2 | 41.63 ± 10.88 | 41.78 ± 10.91 | 1.000 | |
| Low-risk | TcPO2 | 64.92 ± 20.73 | 69.80 ± 22.36 | 0.308 |
| TcPCO2 | 39.14 ± 7.93 | 40.84 ± 9.82 | 0.502 |
The values of TcPO2 and TcPCO2 in supine position are sensitive to the risk status of pressure injury
We calculated the differences in TcPO2 (and TcPCO2) values between the high-risk and low-risk groups in pressure injury in either lateral or supine position and tested their statistical significance using a t-test. The results are displayed in Table 2, which shows that, for both TcPO2 and TcPCO2 in the sacrococcygeal region, there is no significant difference between the high-risk and low-risk groups in lateral position. This indicates that there is no significant difference of TcPO2 and TcPCO2 in sacrococcygeal regions between the high- and low- risk groups when their sacrococcygeal regions bear no pressure. By contrast, in supine position, the TcPO2 values in the high-risk group are significantly lower than those in the low-risk group; the TcPCO2 values in the high-risk group are significantly higher than those in low-risk group. These results indicate that TcPO2 and TcPCO2 are both sensitive to the risk status of pressure injury when measured in supine position (namely when a pressure is imposed in the measure region), but not sensitive when measured in the lateral position (namely when no pressure is imposed in the measured region).
Comparison results of TcPO2 and TcPCO2 values for the sacrococcygeal region of patients in lateral or supine position
| Patient group | TcPO2 in lateral position | TcPCO2 in lateral position | TcPO2 in supine position | TcPCO2 in supine position |
|---|---|---|---|---|
| High-risk | 73.97±25.52 | 41.63±10.88 | 15.66±5.17 | 72.81±28.23 |
| Low-risk | 64.92±20.73 | 39.14±7.93 | 28.18±7.65 | 48.47±17.61 |
| P value | 0.059 | 0.403 | 0.028 | 0.000 |
The values of TcPO2 and TcPCO2 are sensitive to the change of pressure imposed on the measured region
We calculated the difference in TcPO2 (and TcPCO2) values in the sacrococcygeal region of a patient when changing from lateral position to supine position for both high- and low- risk groups and tested whether the difference was zero. The results are shown in Table 3 which indicates that, for a patient in either the high- or low- risk group in pressure injury, there is a significant difference in both TcPO2 and TcPCO2 when the patient changes from lateral position to supine position. The TcPO2 decreases and the TcPCO2 increases during the position change. This result indicates that the values of TcPO2 and TcPCO2 are sensitive to the change of pressure imposed on the measured region.
Comparison results of TcPO2 and TcPCO2 values in the high-risk and low-risk groups for pressure injury in both lateral position and supine position
| Patient group | Pressure Measurement | Value in lateral position | Value in supine position | P value |
|---|---|---|---|---|
| High-risk | TcPO2 | 73.97 ± 25.52 | 15.66 ± 5.17 | 0.000 |
| TcPCO2 | 41.63 ± 10.88 | 72.81 ± 28.23 | 0.000 | |
| Low-risk | TcPO2 | 64.92 ± 20.73 | 28.18 ± 7.65 | 0.000 |
| TcPCO2 | 39.14 ± 7.93 | 48.47 ± 17.61 | 0.000 |
The magnitudes of changes in TcPO2 and TcPCO2 are sensitive to the risk status of a pressure injury
We calculated the change of TcPO2 (i.e., △TcPO2) and the change of TcPCO2 (i.e., △TcPCO2) from a lateral position to a supine position in both the high-risk and low-risk group and tested the mean difference using a t-test. The results are displayed in Table 4 which indicates that the magnitude of TcPO2 reduction and TcPCO2 increase in the high-risk group is significantly more than in the low-risk group. This result suggests that the changes in magnitude for TcPO2 and TcPCO2 are sensitive to the risk status for pressure injuries.
Comparison results of the change of TcPO2 (△TcPO2) and the change of TcPCO2 (△TcPCO2) from a lateral position to a supine position in the high- and low- risk groups
| Patient group | △TcPO2 | △TcPCO2 |
|---|---|---|
| High-risk Group | -58.31 ± 20.80 | 31.19 ± 9.92 |
| Low-risk Group | -36.73 ± 9.21 | 9.33 ± 2.66 |
| P value | 0.003 | 0.000 |
The correlation between TcPO2 (and TcPCO2) change and the Braden Scale when the patients changed from lateral position to supine position
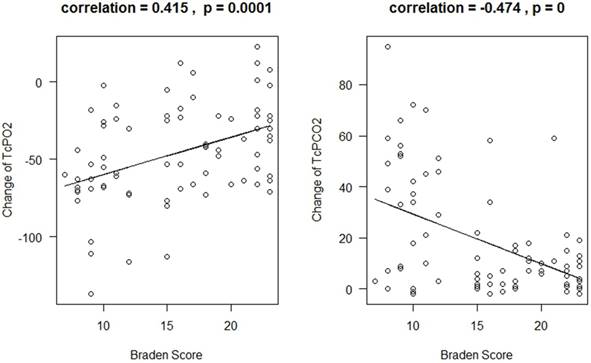
We calculated the Pearson's correlation coefficient between △TcPO2 and the Braden Scale and between △TcPCO2 and the Braden Scale, and tested whether the correlation coefficients are greater than 0. The results are displayed in Figure 1, which indicates that there is a significant positive correlation between △TcPO2 and the Braden Scale (p=0.0001) and significant negative correlation between △TcPCO2 and the Braden Scale (p < 0.0001). The correlation coefficient is 0.415 for △TcPO2 and 0.474 for △TcPCO2. We further conduct regression analysis for using the Braden score to predict the change of TcPO2 and TcPCO2. The adjusted R-squared is 16.2% for △TcPO2 and 21.4% for △TcPCO2 which indicates that the Braden score can explain 16.2% of △TcPO2 variation and 21.4% of △TcPCO2 variation.
The relationship between the change in TcPO2 and the Braden Scale (Left Panel) and between the change in TcPCO2 and the Braden Scale (Right Panel)
Discussion
Pressure injuries not only bring physical and mental distress to patients, but also increase medical expenses and nurse workload [20, 21]. Early assessment, detection and prevention are keys to reducing the incidence of pressure injuries [3, 4]. The Braden scale is currently the most widely used scale in clinical care of pressure injuries [5, 6]. However, clinical practice reveals numerous issues when nurses apply the Braden scale to their clinical work [7-9].
Researchers have developed numerous methods to evaluate the activity of soft tissue after being pressed. These methods included Laser Doppler, Blood Flow Monitoring, Laser Doppler Imaging, skin surface temperature, reflectance spectroscopy and TcPO2 and TcPCO2 et al. TcPO2 and TcPCO2 have been proven to be an accurate and repeatable method for measuring the activity of tissues after being pressed [22]. Although the Braden score has numerous issues when assessing the risk of pressure injury, it is still widely used in clinics. Thus, it is necessary to explore the correlation between Braden score and TcPO2 (and TcPCO2) when determine whether TcPO2 (and TcPCO2) can serve as an effective metric in assessing the risk of pressure injuries. The results of this study show that there is a statistically significant positive correlation between △TcPO2 and the Braden Scale and a statistically significant negative correlation between △TcPCO2 and the Braden Scale. That is, when the values of △TcPO2 were smaller, the scores of Braden scale were lower, and the risk of pressure injury was higher; when the values of △TcPCO2 were smaller, the scores of Braden scale were higher, and the risk of pressure injury was lower.
Our study further demonstrates two beneficial properties of using TcPO2 and TcPCO2 for assessing the risk of a pressure injury. First, their values are sensitive to not only the change of pressure imposed on the measured region but also the risk status of a pressure injury when the patient is measured in supine position.
Second, the magnitude of their changes is higher in the patients with a high risk than in those with a low risk. The comparison of TcPO2 and TcPCO2 in patients with high and low risks of pressure injuries should also provide a valuable reference for future research in TcPO2 and TcPCO2 studies. See “Supplementary Digital Content - Comparative Discussion” for detailed discussion.
Based on previous studies, the Braden scale can predict 8%-13% of the variation of the risk of pressure injury [19]. The results of this study indicate that the Braden score can explain 16.2% of TcPCO2 change variation and 21.4% of TcPCO2 change variation. The three percentages are similar. We are curious how much of the change of TcPO2 (and TcPCO2) can be used to explain the variation in the occurrence or status of pressure injuries. Further research should be conducted to investigate the relationship between TcPO2 (and TcPCO2) and the direct occurrence or status of pressure injuries. There is difficulty in collecting the information on the occurrence or status of pressure injuries of patients in a study but researchers must overcome this difficulty and conduct studies to address this question before TcPO2 and TcPCO2 can be practically used as a method for assessing the risk of pressure injuries in clinics.
Since the results in this study demonstrate the large potential of using TcPO2 and TcPCO2 to assess the risk of pressure injuries, it is valuable to conduct continuous research in exploring the use of TcPO2 and TcPCO2 as a method for assessing the risk of pressure injuries. Currently, continuous monitoring of physiological signals is under fast development [23-28]. Similarly, further work can be conducted to explore the continuous monitoring of TcPO2 and TcPCO2 to increase the specificity and sensitivity of using TcPO2 and TcPCO2 to assess the risk of pressure injuries.
In summary, the research in our study has the following significance. First, this is the first time a statistically significant correlation between the change of TcPO2 (and TcPCO2) and Braden score, the current gold-standard for assessing the risk of pressure injury, has been shown. Second, we used a clinical study to demonstrate the large benefits of using TcPO2 and/or TcPCO2 as a tool for assessing the risk of pressure injuries. This brings evidence and scientific support for developing a TcPO2- and TcPCO2-based tool for assessing the risk of pressure injury. Third, the comparative results related to TcPO2 and TcPCO2 obtained in this clinical study should give reference for future research on pressure injuries.
Abbreviations
TcPO2: transcutaneous oxygen tension; TcPCO2: transcutaneous carbon dioxide tension.
Supplementary Material
Supplementary comparative discussion.
Acknowledgements
This work was supported by University of Macau through Research Grants SRG2016-00083-FHS, FHS-CRDA-029-002-2017 and MYRG2018-00071-FHS.
Competing Interests
The authors have declared that no competing interest exists.
References
1. DiPlacido AJ, Cox-Vance L. New Terminology from the National Pressure Ulcer Advisory Panel. American family physician. 2017;95:757
2. Idowu OK, Yinusa W, Gbadegesin SA, Adebule GT. Risk factors for pressure ulceration in a resource constrained spinal injury service. Spinal cord. 2011;49:643-7
3. Martin D, Albensi L, Van Haute S, Froese M, Montgomery M, Lam M. et al. Healthy Skin Wins: A Glowing Pressure Ulcer Prevention Program That Can Guide Evidence-Based Practice. Worldviews on evidence-based nursing. 2017;14:473-83
4. Yafi A, Muakkassa FK, Pasupneti T, Fulton J, Cuccia DJ, Mazhar A. et al. Quantitative skin assessment using spatial frequency domain imaging (SFDI) in patients with or at high risk for pressure ulcers. Lasers in surgery and medicine. 2017;49:827-34
5. Bergstrom N, Braden BJ, Laguzza A, Holman V. The Braden Scale for Predicting Pressure Sore Risk. Nursing research. 1987;36:205-10
6. Yang C, Li G, Zhang L. Research progress and prospect of using Braden scale to assess the pressure ulcer risk. Journal of Nursing. 2014;21:25-7
7. Liao L, Chen P, Zeng J, Wei S, Chen S. The investigation and analysis of the predictive ability of nurses at all levels on the risk factors of pressure ulcer. Guangxi Medical Journal. 2009;31:1376-8
8. Yu Y, Ding X, Zeng X, Xu H, Gao N. Development of pressure ulcer risk warning network management system and its effect evaluation. Chinese Nursing research. 2014;28:1896-7
9. Gu Q, Zhao H, Zhou P, Yu R. Investigation on the Application of Braden Pressure Ulcer Risk-factor Assessment Scale in the Nursing Staff. West China Medical Journal. 2016;31:927-30
10. Moore ZE, Cowman S. Risk assessment tools for the prevention of pressure ulcers. The Cochrane database of systematic reviews. 2008 Cd006471
11. McInnes E, Jammali-Blasi A, Bell-Syer S, Dumville J, Cullum N. Preventing pressure ulcers-Are pressure-redistributing support surfaces effective? A Cochrane systematic review and meta-analysis. International journal of nursing studies. 2012;49:345-59
12. Niu J, Shi Y, Cai M, Cao Z, Wang D, Zhang Z. et al. Detection of sputum by interpreting the time-frequency distribution of respiratory sound signal using image processing techniques. Bioinformatics. 2018;34:820-7
13. Colin D, Abraham P, Preault L, Bregeon C, Saumet JL. Comparison of 90 degrees and 30 degrees laterally inclined positions in the prevention of pressure ulcers using transcutaneous oxygen and carbon dioxide pressures. Advances in wound care: the journal for prevention and healing. 1996;9:35-8
14. Rochat MC, Pope ER, Payne JT, Pace LW, Wagner-Mann CC. Transcutaneous oxygen monitoring for predicting skin viability in dogs. American journal of veterinary research. 1993;54:468-75
15. Baldwin KM. Transcutaneous oximetry and skin surface temperature as objective measures of pressure ulcer risk. Advances in skin & wound care. 2001;14:26-31
16. Tu Q, Sun Y, Zhang C. The effect of blood gas analysis and ventilation—perfusion ratio on the occurrence of pressure ulcer in ICU patients. Chinese journal of nursing. 2011;46:285-7
17. Crespo-Ruiz B, del-Ama AJ, Jimenez-Diaz FJ, Morgan J, de la Pena-Gonzalez A, Gil-Agudo AM. Physical activity and transcutaneous oxygen pressure in men with spinal cord injury. Journal of rehabilitation research and development. 2012;49:913-24
18. Groah SL, Schladen M, Pineda CG, Hsieh CH. Prevention of Pressure Ulcers Among People With Spinal Cord Injury: A Systematic Review. PM & R: the journal of injury, function, and rehabilitation. 2015;7:613-36
19. Xue X, Liu H, Jing X. Predicting pressure sore risk with Braden,Norton and WCUMS Scales. Chin J Nurs. 2004;39:241-3
20. Unver S, Findik UY, Ozkan ZK, Surucu C. Attitudes of surgical nurses towards pressure ulcer prevention. Journal of tissue viability. 2017;26:277-81
21. Whitty JA, McInnes E, Bucknall T, Webster J, Gillespie BM, Banks M. et al. The cost-effectiveness of a patient centred pressure ulcer prevention care bundle: Findings from the INTACT cluster randomised trial. International journal of nursing studies. 2017;75:35-42
22. Knight SL, Taylor RP, Polliack AA, Bader DL. Establishing predictive indicators for the status of loaded soft tissues. Journal of applied physiology (Bethesda, Md: 1985). 2001;90:2231-7
23. Jin Y, Chen C, Cao Z, Sun B, Lo IL, Liu TM. et al. Entropy change of biological dynamics in COPD. International journal of chronic obstructive pulmonary disease. 2017;12:2997-3005
24. Zhang XD, Santini F, Lacson R, Marine SD, Wu Q, Benetti L. et al. cSSMD: assessing collective activity for addressing off-target effects in genome-scale RNA interference screens. Bioinformatics. 2011;27:2775-81
25. Ren S, Shi Y, Cai M, Xu W. Influence of secretion on airflow dynamics of mechanical ventilated respiratory system. IEEE/ACM transactions on computational biology and bioinformatics. 2017 doi: 10.1109/TCBB.2017.2737621
26. Shi Y, Zhang B, Cai M, Zhang XD. Numerical simulation of volume-controlled mechanical ventilated respiratory system with 2 different lungs. International Journal for Numerical Methods in Biomedical Engineering. 2017;33:e2852-n /a
27. Zhang XD, Pechter D, Yang L, Ping X, Yao Z, Zhang R. et al. Decreased complexity of glucose dynamics preceding the onset of diabetes in mice and rats. PloS one. 2017;12:e0182810
28. Chen C, Jin Y, Lo IL, Zhao H, Sun B, Zhao Q. et al. Complexity Change in Cardiovascular Disease. Int J Biol Sci. 2017;13:1320-8
Author contact
![]() Corresponding authors: Xiaohua Douglas Zhang, Email: douglaszhangmo; Zhixin Cao, Email: 18301564184com
Corresponding authors: Xiaohua Douglas Zhang, Email: douglaszhangmo; Zhixin Cao, Email: 18301564184com