Impact Factor ISSN: 1449-2288
- Issue 12; 2026
- Issue 11; 2026
- Issue 10; 2026
- Issue 9; 2026
- Issue 8; 2026
- Volume 22; 2026
- Past Issues
- Advance Articles
- Editorial Board
- Cover Images
- Index & Coverage
- Cover Suggestion
- Special Issues
Introduction
Material and methods
Results
Discussion
Conclusion
Supplementary Material
Acknowledgements
References

 Global reach, higher impact
Int J Biol Sci 2018; 14(11):1558-1570. doi:10.7150/ijbs.24151 This issue Cite
Research Paper
Molecular Alteration Analysis of Human Gut Microbial Composition in Graves' disease Patients
Hafiz Muhammad Ishaq1,7, Imran Shair Mohammad2, Muhammad Shahzad3, Chaofeng Ma4, Muhammad Asif Raza1, Xiaokang Wu5, Hui Guo6, Peijie Shi6, Jiru Xu7 ![]()
1. Department of Veterinary and Animal Sciences, Muhammad Nawaz Sharif University of Agriculture, Multan, Pakistan.
2. Department of Pharmaceutics, School of Pharmacy, China Pharmaceutical University, Nanjing, China.
3. Department of Pharmacology, University of Health Sciences, Khyaban-e-Jamia Punjab, Lahore, Pakistan.
4. Xi'an center for disease control and prevention, China
5. The second Affiliated Hospital of Xi'an Jiaotong University, 157 Xiwu Street, Xi'an China.
6. Department of Endocrinology and metabolic diseases, 1st affiliated Hospital Xi'an Jiotong University, China.
7. Department of Microbiology and Immunology, Key Laboratory of Environment and Genes Related to Diseases of Chinese Ministry of Education, School of Medicine, Xi'an Jiaotong University, Xi'an, China.
Received 2017-12-3; Accepted 2018-5-14; Published 2018-9-7
Abstract

The gut microbial association with host co-existence is critical for body homeostasis and pathogenicity. Graves' disease (GD) is an autoimmune disease manifested with hyperthyroidism and ophthalmopathy. However, we hypothesized that gut bacteria could affect an important role in GD pathogenicity. The current study aim was to characterize and investigate the intestinal bacterial composition of GD qualitatively and quantitatively. 27 GD and 11 healthy controls were enrolled for fecal sample collection. The PCR-DGGE of 16S rRNA gene by targeting V3 region and Real-time PCR for Lactobacillus, Bifidobacterium, Bacteroides vulgatus and Clostridium leptum, were performed. High-throughput sequencing of 16S rRNA gene with the V3+V4 site was perormed on Hiseq2500 platform on randomly 20 selected samples. The relative analysis of richness indices and diversity illustrated lesser diversification of intestinal bacteria in GD patients in contrast to controls. The data statistics shows the alteration in phyla of GD as compared to control. At the family taxonomic level, the relative abundance of Prevotellaceae and Pasteurellaceae were significantly higher in patients, while Enterobacteriaceae, Veillonellaceae, and Rikenellaceae were significantly lower in the diseased group as compared to control. At the genus level, a significant raised in genera count of the diseased group were Prevotella_9 and Haemophilus, while significantly decreased in the genera of the GD group were Alistipes and Faecalibacterium. The modulation in intestinal bacterial composition was checked at species level particularly H. parainfluenza abundance was raised in GD. The outcomes of the current study are aligned with the proposed hypothesis of gut microbial dysbiosis in GD. Statistically, alpha indices and differential abundance analyses of each intestinal bacterial community were significantly changed in GD. Therefore, the current study may provide a new insight into the GD pathogenesis and, in turn, explore its contribution in possible treatments.
Keywords: GD, Gut microbiota, Ophthalmopathy, Hyperthyroidism, DGGE, High-throughput sequencing
Introduction
Human intestinal bacteria are described as a critical element in determining the standard body mechanism and host health standing. Power et al, described that gut microbial composition and function are stable over time but could be altered by different factors age, disease and diet [1].
The intestinal microbes constitute about 100 trillion gut microbial cells and play a key function in metabolism, absorption, immune functioning [2] along with defense mechanism against pathogen [3]. The regulation of gut microbiota configuration has been compromised in a variety of disorders like inflammatory bowel disease, Crohn's disease, smoking, obesity, colitis, type II diabetes, Hashimoto's thyroiditis and asthma [4-7]. This gut microbiota contribution is considered as indispensable in host immune homeostasis, and its normal mechanism can be altered by the release of metabolites developing in diseased condition [8].
GD has an indicative signature as an organ-specific autoimmune disease caused due to faulty self-tolerance. Dysfunctional immune system may result in autoimmune diseases. Autoimmune disease like GD is caused by interpreting self-antigens as foreign or harmful antigens. In this situation, the immune system in GD patients cannot differentiate between foreign antigens and thyroid tissue and, resulting in destruction of the thyroid gland by body immune response [9].
Autoantibodies are produced to mimic the TSH against TSHR which is the autoantigen [10]. The epidemiological data demonstrate that GD has a female prevalence with 3% vs 0.5% in male during their lifespan [11]. Thyroid-dependent is redundant since GD is an organ-specific (thyroid) autoimmunity ranging from clinical to genetic variations along with environmental factors which are involved in dysragulate of immune tolerance [12].
The clinical evidence was manifested by an enlarged thyroid, hyperthyroidism, ophthalmopathy, pretibial myxedema muscle fatigue, Irritability, fast heartbeat, heat intolerance, and occasionally diarrhea [13]. Ophthalmopathy is considered an extra-thyroidal symptom and sign of eye disease are present in about 20% [14]. The gut microbiota (Yersinia enterocolitica, Gram-positive, Gram-negative, pathogenic and commensal organisms) exhibiting different bacteria have the capability of binding TSH receptor which signifies the production of antibodies from these bacteria with specific TSH receptor. TSH-receptor autoantibodies strongly able to displace 125I-labelled TSH from the mammalian TSH receptor differed in their ability to displace the tracer from binding to bacterial extracts from E. coli and Y. enterocolitica [15]. SNP predisposing the GD were found associated to the TSHR genetic loci, other loci are indeed involved and appeared to be in common with other autoimmune disease [16].
Moreover, recent studies validated environmental factor with less vitamin D in the diet that trigger the autoimmune GD that in turn contribute to the disease progression. Recently, a meta-analysis illustrated that GD patients were more likely to have deficient in vitamin D. [17]. Interestingly, the environmental predisposing factors and genetic triggers, dysregulation of the immune system results in an immune attack on the thyroid [18]. The gut interdependence of lymphoid tissue and microbiota in the early development of life is essential for growth of mucosal and systemic immunity. In the human fecal analysis, the majority of gut bacteria are overlain with immunoglobulin IgA that are specifically confronting any abnormality thus indicating bacterial contribution in a diseased condition like GD [8].
In this study, by applying PCR-DGGE along with accurate and sensitive High-throughput Illumina-based sequencing, it has been monitored to characterize the intestinal bacterial diversity and similarity in GD patients. Our findings highlighted a gut microbiota profile proper of GD patients that have never been published before, and can serve to pose new insights into the disease pathogenesis.
The aim of current study is to evaluate the diversity and similarity of intestinal microbiota qualitatively and quantitatively in GD as compared to their healthy counterparts.
Material and methods
Ethics statement
The informed written consent was obtained from all the participants of the study including GD patients as well as healthy volunteers. Moreover, the study was approved by an institutional ethical review committee of Xi'an Jiaotong University and performed under the guidelines of the World Medical Association and Declaration of Helsinki.
Sample collection
Stool samples were collected from 27 GD patients (10 males and 17 females) aged 35-50 years and healthy subjects, matched by age, and 11 healthy subjects (4 males and 7 females). A questionnaire was filled up regarding, dietary habits, age, gender, body weight, and health condition of healthy subjects and patients. The GD patients were diagnosed in 1st affiliated hospital (according to the guide line of Chinese Society of Endocrinology) department of endocrinology and metabolic diseases, school of medicine Xi'an Jiaotong University. The symptoms include diffused goiter, thyroid-associated ophthalmopathy, and pretibial myxedema. All the patients enrolled in this study having the disease duration of 1.5 year. Also, the patients selected for this study were taken no medicine for Grave's disease treatment from last 6 month. TSH (Thyroid stimulating hormone) was lesser than 0.25 μIU/ml, T3 was higher than 2.20 ng/ml, T4 was higher than 13.5 μg/dl, FT3 was higher than 9.08 pmol/L, FT4 was higher than 25.5 pmol/L, TSH receptor antibodies (TRAb) was higher than 9.31 U/L, anti-thyroglobulin Abs level was more than 30%. level of anti-thyroid peroxidase Abs was higher than 15 IU/ml, and Normal range of serum antibodies and thyroid hormones are Anti-TGAb (< 30%), Anti-TPOAb (<15 IU/ml), and Thyroid receptor antibodies (TRAb > 9.31). TSH (0.25-5 μIU/ml), T3 (0.78-2.20 ng/ml), T4 (4.2-13.5μg/dl), FT3 (2.91-9.08) and FT4 (9.05-25.5). All the fecal samples were collected in the icebox, in 1 h. of defecation and stored at -80°C for one month. None of the GD patients and normal healthy subjects had any record of gastrointestinal sickness; also there is no history of using prebiotics, probiotics, and antibiotics, two months prior to sampling.
DNA extraction from fecal sample
After thawing of all the fecal samples, DNA was extracted with the help of Qiagen stool Mini Kit (Germany) as per instructions of the manufacturer, with an initial bead-beating step along with 5000 rpm for the duration of 30 sec. [19].
PCR-DGGE
PCR-DGGE was performed by using total genomic DNA and universal primers (shown in table 1) were used to amplify the 16S rRNA gene targeting V3 region by applying touchdown PCR as previously illustrated by Muyzer et al. [20]. The amplified PCR samples were allowed to run on an agarose gel (1.5%) for electrophoresis, and finally, PCR product mixture was dipped in the solution of Ethidium bromide to illuminate and visualize under the UV light.
The linker Primer sequence for PCR-DGGE and Real-time PCR
| Target bacteria | Primer Sequence (5¹-3¹) | |
|---|---|---|
| PCR-DGGE Primer | ||
| 341-F | CCTACGGGAGGCAGCAG | |
| 534-R | ATT ACCGCGGCTGCTGG | |
| 341FG | CGCCCGCCGCGCGCGGCGGCGCGGGGCGGGGGCACGGGGGGCCTACGGGAGG CAG CAG | |
| Real Time PCR Primer | ||
| Bifidobacterium (550 bp) | Bifid F | CTC CTGGAAACGGGTGG |
| Bifi-R | GGTGTTCTTCCCGATATCTACA | |
| Lactobacillus (250 bp) | Lact F | CTC AAA ACT AAACAAAGTTTC |
| Lact R | CTC AAA ACT AAACAAAGTTTC | |
| Bacteroides vulgatus (287bp) | BV- F | GCATCATGAGTCCGCATGTTC |
| BV-R | TCC ATA CCC GACTTT ATT CCTT | |
| Clostridium leptum (239bp) | C.lep-F | GCACAAGCAGTG GAG T |
| C.lep-R | CTTCCTCCGTTTTGTCAA | |
Denaturing gradient gel electrophoresis
DGGE experimental analysis was performed by using Universal Mutation Detection (Bio-Rad, USA) System. The bacterial amplified PCR product was loaded to acrylamide-bis, 37.5:1, 8% (w/v), gels in a tank of 1×TAE buffer solution, having 30~65 % denaturant linear gradient with the steady temperature after 60 ºC DGGE gel profile was permitted to work at 90 V for the duration of 13 h. The calculation of gut bacterial diversification in each sample was computed by the total numbers and the DGGE bands intensity, with the help of Syngene (USA) software. A similarity index was studied through Dice's similarity coefficient [21]. Moreover, Unweighted Pair Group Method with Arithmetic Mean (UPGMA), was used to establish a dendrogram [22].
Shannon-weaver (H¹) diversity index was determined by applying nonparametric unpaired t-test with the aid of Microsoft Excel 20110 and GraphPad Prism 7.
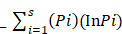
Shannon Weaver diversity was calculated with help of following formula:
Shannon Weaver index (H¹) =
Excision of bands and sequencing
The excision of the band with the gene of interest from the DGGE gel was cut with the help of a sterilized scalpel. The excised gel band was centrifuged at 37 ºC in 50 μl tube of sterilized water, and 8 μl of this water was used to re-amplify the V3 region of 16S rRNA gene by using the same primer (with no GC-clamps) which was initially applied for PCR-DGGE experiment [23]. The re-amplified PCR products were sequenced and analyzed by ABI 3500xL and by applying BLAST and Seqmatch software, Sequences were studied and analyzed for detection and identification of genera or species [24].
Real-time PCR
Real-time PCR quantification was performed in a CFX96 Bio-Rad (USA). Primers of Real- time PCR are shown in table 1. The copy number determination of Bacteroides vulgatus, Clostridium leptum, Lactobacillus and Bifidobacterium genus in each DNA samples, Bifidobacteriaum (CICC.6186), NWS Lactobacillus, (from our lab) Bacteroides vulgatus (CICC.22938), and Clostridium leptum (YIT.6169) were applied as standard strains. Real-time PCR was carried in triplicates and average was considered in results analysis. For estimation of copy number of Bacteroides vulgatus, Clostridium leptum sub-group Bifidobacterium and Lactobacillus genera present in each sample, fluorescent signals detected from six serial dilutions in the linear range of the assay were averaged and compared to a standard curve generated with standard DNA in the same experiment. Data were presented to bacterial copy numbers in 1 g fecal material of GD and healthy control.
High-throughput Illumina-based sequencing and data analysis
High-throughput was performed on twenty randomly selected stool samples in Hiseq 2500 platform (10 samples from healthy control and 10 samples from GD). In a previous study of gut microbial characterization, the same sample size was used by Ishaq et al. [25]. As mentioned before the 16S rRNA gene with V3-V4 regions was amplified with primer: 341F (CCTAYGGGRBGCASCAG) 806R (GGACTACNNGGGTATCTAAT) TruSeq® DNA PCR-Free Sample Preparation Kit was used to construct the amplicons libraries. Sequencing was based on the Illumina HiSeq platform, and used Paired-End sequencing method to construct small fragment library [26]. The data retrieved was assembled and screened by using FLASH [27] and QIIME (V1.7.0) [28] software package. The UCLUST procedure [28] was used to cluster the sequencing into Operational Taxonomic Units (OTUs) at 97% identity threshold. In the process, the RDP Classifier was applied to assign the OTU at taxa level [29]. Diversity analysis of retrieved data, such as Simpson and Shannon index, ACE, Chao1, and Good's coverage, was performed by using QIIME. However, the OTU table was generated by applying QIIME which imported into MEGAN 4 and analyze on the taxonomy database of NCBI [30]. The Shannon measure of evenness was calculated with the formula E = H/ln(S), where “H” is the Shannon diversity index and S is the total number of sequences in that group.
The statistically gut microbial community composition differences and diversity indices between the samples of GD patients and healthy volunteers were computed nonparametric unpaired t-test (P<0.05) by using Microsoft Excel 2010 along with the aid of GraphPad Prism 7.
Results
DGGE Statistical analysis of gut microbial composition
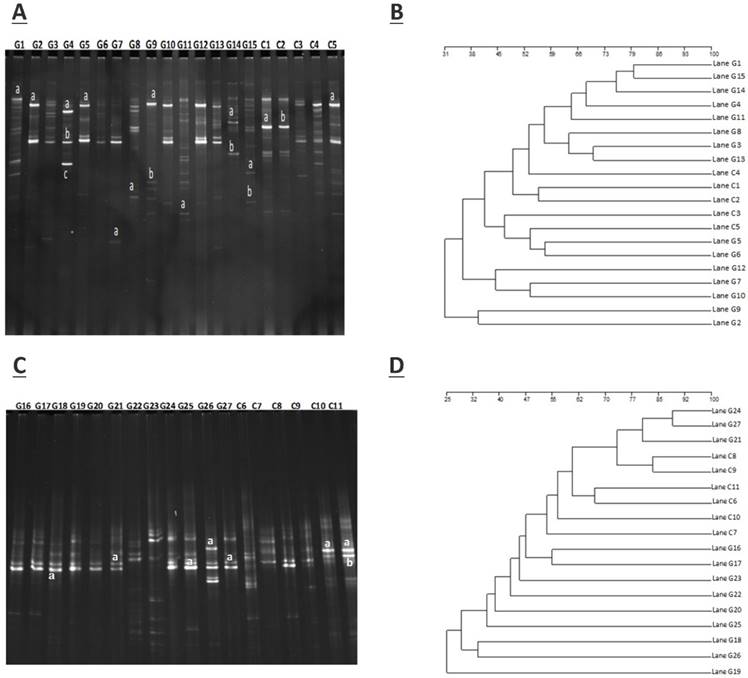
The amplification of PCR with DGGE assay used to locate the specific primers sequence of the V3 region of 16S rRNA gene in GD patients and controls. The detailed results are shown in figure 1.A (G1- G15) demonstrate the GD samples, and (C1-C5) to healthy controls, while figure 1.C (G16 - G27) represents GD samples, and (C6-C11) control subjects. The gene fragment location, strength, and variation in the lanes for various samples exemplify the complex fingerprints of intestinal microbiota. The total aggregate of 213 bands was detected by Syngene software in 27 tracks of GD with an average band of (7.67 ± 2.79), other sums of 87 bands were identified in 11 lanes of the control group with a mean of (8.57 ± 2.11). Differences in the diversity of the fecal microbiota of GD patients and healthy controls were assessed by using the Shannon/Weaver index. The diversity (H¹) findings stipulated the (2.34 ± 0.44 vs. 2.47 ± 0.42) No significant differences were observed in the (H¹) index between GD and healthy controls (P<0.2). The resultant distinguishable findings elucidate that gut microbial composition varies with their healthy counterparts. Furthermore, Dice similarity coefficient and UPGMA were applied on (figure 1.B, figure 1.D) to determine the extent of the resemblance of all the DGGE profiles. Non-significant (P<0.159) assessed values of the similarity coefficient of GD and control with average index values (0.481 ± 0.166) and (0.419 ± 0.183), respectively shown in table 2. The compiled data of statistical samples for GD and the healthy control analogized by Dice coefficient depicted with mean indexed values were (0.339 ± 0.129), thus showing lesser values among the groups that in turn affirm that intestinal microbes of GD patients varies from the normal control group.
A. DGGE gel profile constructed by linker primer of 16S rRNA gene with V3 region, B. Cluster analysis of GD (G1-G15) and healthy control group (C1-C5) by computing a Dice's coefficient and the UPGMA, C. DGGE gel profile constructed by linker primer of 16S rRNA gene with V3 region, D. Cluster analysis of GD (G16-G27) and control group (C7-C11) by applying the UPGMA and Dice's coefficient.
Gut microbiota diversity and similarity in GD and control
| Groups | Diversity | Similarity | ||
|---|---|---|---|---|
| The number of Bandsa | Shannon idexb | Intra-similarityc | Inter-similarityd | |
| Disease group | 7.67±2.79 | 2.34±0.44 | 0.481±0.166 | 0.339±0.129 |
| Control group | 8.57±2.11 | 2.47±0.42 | 0.419±0.183 | |
| P | 0.251 | 0.211 | 0.159 | / |
Results which are significantly different (nonparametric unpaired t test), with (P<0.05)
a. Number of denaturing gel electrophoresis (DGGE) bands produced by each sample.
b. Shannon diversity index (H¹) was calculated using the relative intensities of all DGGE bands in each sample.
c. Dice similarity coefficients comparing DGGE band profiles within individual of a given group.
d. Dice similarity coefficients comparing DGGE band profiles between members of Graves' disease and healthy group.
Sequence analysis
The sum of 26 bands was cut from two DGGE gels, the figure 1 A, from DGGE profile, 18 bands were cut for quantitative analytical study. The DGGE gel resolution was verified by the excision of bands at the same positions but in different lanes, the bands C1a and C2b, G2a, G5a, and G9a were cut for sequence analysis. The excised gel bands C1a and C2b were sequenced as Bacteroides uniformis with 97% homology while, bands G2a, G5a, and G9a were sequenced as Prevotella copri with 96% homology. Likewise, from figure 1.C, 8 DGGE gel bands were excised and monitor the DGGE gel resolution capacity, bands G25a, G27a and C10a and C11a were sequenced. The bands at G25a, G27a were identified with Enterobacter aerogenes 92% similarity while C10a and C11a were Bacteroides plebeius with 91 % homology. Taxonomic identification of other DGGE gel bands has been depicted in table 3. Phyla Firmicutes, Bacteroidetes, and Proteobacteria were dominant. The results findings of two DGGE gel illustrated the more prevalence of opportunistic intestinal bacteria (Bacteroides intstinalis, Shigella dysenteriae, Parabacteroides distasonis, Alistipes putredinis, Bacteroides coprocola, Prevotella copri, Sporomusa ovata, Bacteroides nordii, Bacteroides helcogenes, Bacteroides paurosaccharolyticus, Faecalibacterium prausnitzii, Enterobacter aerogenes, Klebsiella sp) in GD patients.
Excision of PCR Amplicons from DGGE gel and retrieved sequence from BLAST database
| Selected Exised bands | Bacteria with highest % homology | Sequence Accession number | Bacterial phyla | Gene bank number |
|---|---|---|---|---|
| C1a | Bacteroides uniformis(97) | CL03T00C23 | Bacteroidetes | NZ_JH724260 |
| C2b | Bacteroides uniformis(97) | CL03T00C23 | Bacteroidetes | NZ_JH724260 |
| C5a | Bacteroides vulgates(97) | ATCC 8482 | Bacteroidetes | NC_009614.1 |
| G1a | Shigella dysenteriae(98) | Sd197 | Protobacteria | NC_007606.1 |
| G2a | Prevotella copri (96) | DSM 18205 | Bacteroidetes | NZGG703855.1 |
| G4a | Parabacteroides distasonis | ATCC 8503 | Bacteroidetes | NC_009615.1 |
| G4b | Clostridium botulinum (88) | ATCC 3502 | Fermicutis | NC_009495.1 |
| G4c | Bacteroides intestinalis (95) | DSM 17393 | Bacteroidetes | NZ_ABJL02000006. |
| G5a | Prevotella copri (96) | DSM 18205 | Bacteroidetes | NZGG703855.1 |
| G7a | Alistipes putredinis(97) | DSM 17216 | Bacteroidetes | NZ_DS499580.1 |
| G8a | Bacteroides coprocola (96) | DSM 17136 | Bacteroidetes | NZ_DS981502.1 |
| G9a | Prevotella copri (96) | DSM 18205 | Bacteroidetes | NZGG703855.1 |
| G9b | Sporomusa ovata (87) | DSM 2662 | Fermicutis | NZ_ASXP01000005.1 |
| G11a | Bacteroides nordii (86) | CL02T12C05 | Bacteroidetes | NZ_JH724319.1 |
| G14a | Bacteroides fragilis(86) | YCH46 | Bacteroidetes | NC_006347.1 |
| G14b | Prevotella dentasini (91) | JCM 15908 | Bacteroidetes | NZ_BAKG01000039.1 |
| G15a | Bacteroides helcogenes (91) | P 36-108 | Bacteroidetes | NC_014933.1 |
| G15b | Bacteroides paurosaccharolyticus(88) | JCM 15092 | Bacteroidetes | NZ_BAJR01000054.1 |
| G18a | Faecalibacterium prausnitzii (96). | TDY5834930. | Firmicutes | NZ_CZBH01000014.1 |
| G21a | Bacillus sp. (94). | FJAT-25496. | Firmicutes | NZ_LMBY01000086.1 |
| G25a | Enterobacter aerogenes (92) | KCTC 2190 | Proteobacteria | NC_015663.1 |
| G26a | Klebsiella sp.(94). | NODE14. | Proteobacteria | NZ_LGIT01000014.1 |
| G27a | Enterobacter aerogenes (92) | KCTC 2190 | Proteobacteria | NC_015663.1 |
| C10a | Bacteroides plebeius (91) | DSM 17135 | Bacteroidetes | NZ_DS990123.1 |
| C11a | Bacteroides plebeius (91) | DSM 17135 | Bacteroidetes | NZ_DS990123.1 |
| C11b | Faecalibacterium prausnitzii (96). | TDY5834930. | Firmicutes | NZ_CZBH01000014.1 |
Real-time PCR assay
The real-time PCR was conducted mean value evaluation index demonstrates that Lactobacillus and Bifidobacterium copy number were reduced in GD compared to controls. Copy number of Clostridium leptum and Bacteroides vulgatus were reduced and increase, respectively, in GD compared to healthy controls, however with P < 0.05 (Table 4). Unpaired t-test was used for statistical analysis.
Targeted bacterial load (copy number) quantification by Real-time PCR
| Bacteria | Healthy Subjects | GD | P* |
|---|---|---|---|
| Bifidobacterium (103) | 4.05 ± 0.83 | 3.48 ± 0.53 | 0.008* |
| Bacteroides vulgatus(107) | 4.32 ± 0.93 | 4.59 ±0.66 | 0.159 |
| Clostridium leptum (106) | 4.68 ± 1.21 | 4.40± 0.74 | 0.194 |
| Lactobacillus (104) | 7.44 ±1.08 | 6.78 ± 0.64 | 0.012* |
Data were presented as the average estimate of fecal PCR target genetic amplicon copy numbers present in 1 g of feces. Where (*P < 0.05).
High-throughput gene sequencing data
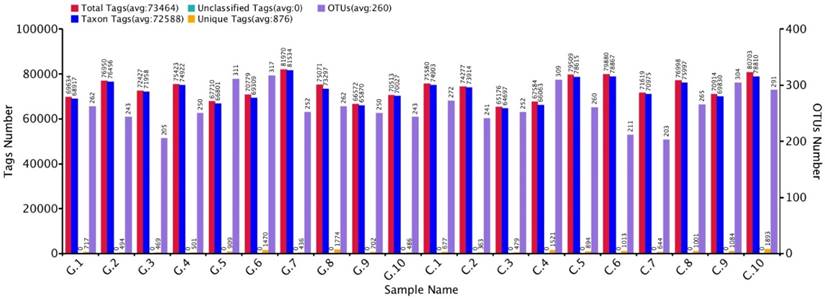
The approximate numbers of amplicon 1,810,600 at V3+V4 location in16S rRNA gene were sequenced from 10 GD patients and 10 healthy control subjects. A total of combined sequencing reads 1,684,712 (control 851,988 and disease 832,724, Ave. per sample 84,236) were proceeded for quality check thus confining in our analysis. The Taxon tag in both GD and control samples was (Ave.72588). The aggregate number of unique tag revealed in GD and healthy control groups was 7958 and 9569, respectively (Ave. 876) in all experimental samples. The average count of 260 OUTs was attributed in both GD and control group described in figure 2. The gross figures of unique sequence for the two groups were 17527 that exhibit all the phylotypes in this analysis. The current experimental analysis focused on the gut microbial taxa that were predominantly affluence of more than (0.5-1%) over all. After deletion of the primer, the average sequence length remained 418 bp.
GD observations for OTUs and Tag number versus in contrast to control OTUs and Tag number with 97 % similarity level.
Gut microbial diversity and configuration analysis
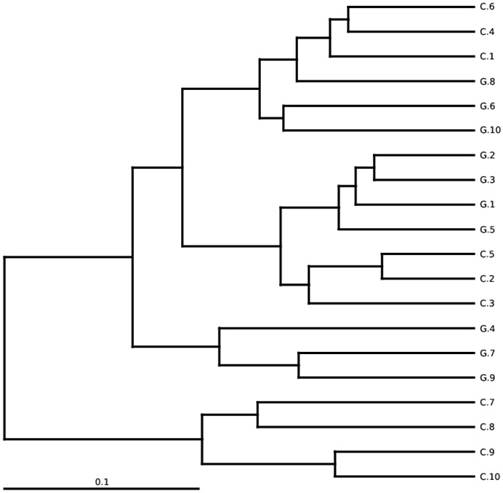
The total gut microbial community was explained by diversity and richness as computed at the level of 97% resemblance. The Alpha diversity estimated by the equation of ACE (P < 0.012) and Chao1 (P<0.016) observed species (P<0.041) and Good's coverage (P<0.037) that was notably elevated in the controls while contrasting the GD patients, respectively. Alpha diversity indices are within-samples estimation of diversity used to compare two different groups. The level of diversity in each group was described in table 5. The samples were categorized in two batches relying on weighted UniFrac metrics depicted in figure 3. Broadly speaking the gut microbial population was estimated and monitored from phylum to further narrowing down to family, genus and finally at the species level.
High-throughput analysis of Gut microbial richness and diversity having 97% similarity index
| Group | Observed Species | Shannon | Simpson | Chao1 | ACE | Good's coverage | Evenness |
|---|---|---|---|---|---|---|---|
| Patients | 221.80 | 4.42 | 0.870 | 254.66 | 257.20 | 0.9994 | 0.340 |
| Control | 244.20 | 4.63 | 0.910 | 282.87 | 302.42 | 0.9998 | 0.356 |
| P* | 0.041 | 0.267 | 0.092 | 0.016 | 0.012 | 0.037 | 0.271 |
The values denoted in the table are the mean values of each group, significant findings were testified with (unpaired t-test) and (P<0.05). The evenness (Shannon) estimation was conducted by applying formula
E = H/ln(S), where H is the Shannon diversity index and S is the total number of sequences in that group.
Between-sample diversity, sample G1-G10 from GD patients and C1-C10 controls. UPGMA based on weighted UniFrac distances.
Gut microbial composition at phyla level
15 phyla were identified; among 10 topmost phyla in GD was Firmicutes (32.89), Bacteroidetes (57.55%), Proteobacteria (8.47 %), Actinobacteria (0.90 %) Fusobacteria (0.08 %). while Verrucomicrobia, Tenericutes, Cyanobacteria, Synergistetes, and Gemmatimonadetes were sequenced less than (0.5%) and others (around 0.03% of total sequences) in disease group. Likewise in control group, Firmicutes (40.61 %), Bacteroidetes (51.47 %), Proteobacteria (7.26 %), Actinobacteria (0.31 %), Verrucomicrobia, (0.10 %) Tenericutes (0.15%), Fusobacteria (0.06%), while Cyanobacteria, Synergistetes and Gemmatimonadetes found is less than (0.5%) and others (around 0.01 % of total sequences) shown in figure 4. There was more phyla prevalence of Bacteroidetes (P<0.153), Actinobacteria (P<0.066), and Proteobacteria (P< 0.346) and less Firmicutes (P< 0.152) in the GD patients than in the healthy group. The statistics data estimation of top 10 phyla in table 6 demonstrates the differential abundant phyla.
Gut microbial composition differences between GD and C at the phylum level.
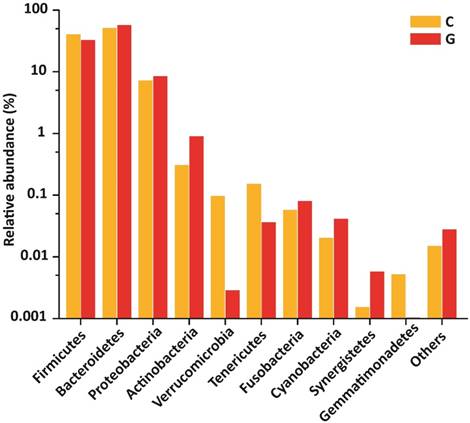
Top 10 differentially abundant taxonomy from High-throughput sequencing results.
| Taxa | Mean GD | GD. SD | Mean C | C. SD | P* |
|---|---|---|---|---|---|
| Phylum | |||||
| Firmicutes | 0.33546 | 0.10514 | 0.40609 | 0.18348 | 0.15240 |
| Bacteroidetes | 0.58701 | 0.09408 | 0.51472 | 0.19572 | 0.15320 |
| Proteobacteria | 0.08635 | 0.08921 | 0.07264 | 0.06138 | 0.34680 |
| Actinobacteria | 0.00919 | 0.01203 | 0.00309 | 0.00219 | 0.06610 |
| Verrucomicrobia | 0.00003 | 0.00005 | 0.00097 | 0.00285 | 0.15540 |
| Tenericutes | 0.00037 | 0.00053 | 0.00153 | 0.00242 | 0.07790 |
| Fusobacteria | 0.00082 | 0.00102 | 0.00058 | 0.00151 | 0.33960 |
| Cyanobacteria | 0.00042 | 0.00095 | 0.00020 | 0.00030 | 0.24550 |
| Synergistetes | 0.00006 | 0.00016 | 0.00002 | 0.00003 | 0.21240 |
| Gemmatimonadetes | 0.00004 | 0.00006 | 0.00005 | 0.00008 | 0.36230 |
| Family | |||||
| Prevotellaceae | 0.48201 | 0.32681 | 0.20695 | 0.24702 | 0.02390 |
| Ruminococcaceae | 0.11944 | 0.08117 | 0.19952 | 0.18935 | 0.11740 |
| Bacteroidaceae | 0.15478 | 0.05910 | 0.21579 | 0.15717 | 0.13280 |
| Lachnospiraceae | 0.11998 | 0.09688 | 0.10341 | 0.05886 | 0.32470 |
| Pasteurellaceae | 0.10899 | 0.18433 | 0.00557 | 0.00549 | 0.04650 |
| Veillonellaceae | 0.01919 | 0.00646 | 0.05256 | 0.05670 | 0.04050 |
| Succinivibrionaceae | 0.01416 | 0.04423 | 0.01013 | 0.03159 | 0.40860 |
| Enterobacteriaceae | 0.01346 | 0.01892 | 0.04285 | 0.04352 | 0.03310 |
| Alcaligenaceae | 0.02087 | 0.01370 | 0.02649 | 0.04033 | 0.34070 |
| Rikenellaceae | 0.02710 | 0.02760 | 0.05936 | 0.03430 | 0.00940 |
| Genus | |||||
| Prevotella_9 | 0.49699 | 0.42196 | 0.19522 | 0.25092 | 0.03390 |
| Bacteroides | 0.14335 | 0.10711 | 0.21579 | 0.15717 | 0.12200 |
| Haemophilus | 0.13580 | 0.22717 | 0.00991 | 0.01218 | 0.04860 |
| Ruminococcus_2 | 0.01044 | 0.01933 | 0.03379 | 0.05251 | 0.10180 |
| Dialister | 0.01101 | 0.01943 | 0.04448 | 0.05659 | 0.04690 |
| Eubacterium | 0.02042 | 0.02789 | 0.02255 | 0.04997 | 0.45370 |
| Succinivibrio | 0.01416 | 0.04423 | 0.01132 | 0.03468 | 0.43740 |
| Alistipes | 0.01795 | 0.01485 | 0.04736 | 0.04185 | 0.02530 |
| Parabacteroides | 0.02523 | 0.01371 | 0.03082 | 0.03580 | 0.32510 |
| Faecalibacterium | 0.02891 | 0.01750 | 0.05622 | 0.03177 | 0.01430 |
Nonparametric unpaired t test was applied. Outcomes which are significantly different, where P<0.05
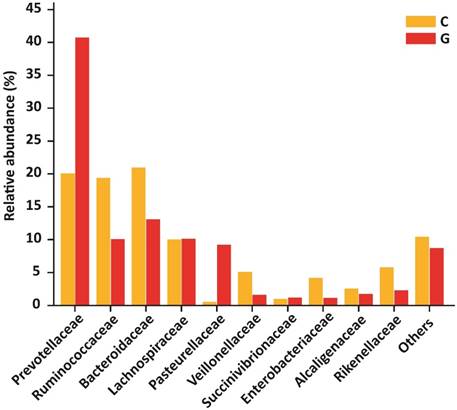
Gut microbiota distribution at family level
At the level of family, 84 different families were detectd in High-throughput sequencing experiment. Among10 top most family in diseased group were Prevotellaceae (40.74 %), Ruminococcaceae (10.09 %), Bacteroidaceae (13.08 %), Lachnospiraceae (10.14 %), Pasteurellaceae (9.21 %), Veillonellaceae (1.62 %), Succinivibrionaceae (1.20 %), Enterobacteriaceae (1.14 %), Alcaligenaceae (1.76 %) , Rikenellaceae (2.29 %) that constitute approximately (91.27 %) of the entire bacterial community along with (8.73%) others. In addition to the control group, Prevotellaceae (20.09 %), Ruminococcaceae (19.37 %), Bacteroidaceae (20.95 %), Lachnospiraceae (10.04 %), Pasteurellaceae (0.54 %), Veillonellaceae (5.10 %), Succinivibrionaceae (0.98 %), Enterobacteriaceae (4.16 %), Alcaligenaceae (2.57 %), Rikenellaceae (5.76 %) that form the (89.58% ) of the whole bacterial community along with (10.42%) others. Prevotellaceae, Ruminococcaceae, and Bacteroidaceae were enriched values in diseased and controls depicted in figure 5. Nevertheless, the counts of Prevotellaceae (P<0.023) and Pasteurellaceae (P<0.046) were significantly higher in disease group. On the other hand, Enterobacteriaceae (P<0.033), Veillonellaceae (P<0.040), and Rikenellaceae (P<0.0094) were significantly lowered in the GD group as compared to healthy subjects. The top 10 family level data statistics depicts in table 6.
10 most prevalent families with relative abundance in GD and healthy controls. The relative abundance of Prevotellaceae and Pasteurellaceae were significantly higher in patients, While Enterobacteriaceae, Veillonellaceae, and Rikenellaceae were significantly lower in the diseased group as compared to control. Where (* P<0.05).
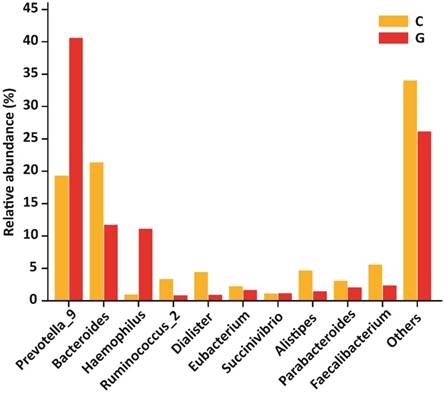
Gut microbial composition at genera level
At the level of genera, 194 different genera were sequenced in the same experiment. Among 10 top most genera in GD patients were Prevotella_9 (40.60 %), Bacteroides (11.71 %), Haemophilus (11.09 %), Ruminococcus_2 (0.85 %), Dialister (0.90 %), Eubacterium (1.67 %), Succinivibrio (1.16 %), Alistipes (1.47 %), Parabacteroides (2.06 %), Faecalibacterium (2.36 %) that composed of (73.87 %) whole gut bacterial community along with (26.13 % ) others. Furthermore, in control group Prevotella_9 (19.30 %), Bacteroides (21.34 %), Haemophilus (0.98 %), Ruminococcus (3.34 %), Dialister (4.40 %), Eubacterium (2.23 %), Succinivibrio (1.12 %), Alistipes (4.68 %), Parabacteroides (3.05 %), Faecalibacterium (5.56 %) that formed the (66.00%) of gut bacterial population along with (34.00%) others. The OUT counts of Prevotella_9 (P<0.033) and Haemophilus (P<0.048) genera were significantly raised in GD patients as compared to healthy subjects depicted in the figure 6. While the abundance of Alistipes (P<0.025) and Faecalibacterium (P<0.014) genera were significantly reduced in GD patient as compared to control.The 10 topmost genera statistics differential abundance analysis has shown in table 6.
10 most existed genera with relative abundance observed in GD and healthy controls. Significant increased genera in GD were Prevotella_9 and Haemophilus, while significantly decreased genera of diseased group were Alistipes and Faecalibacterium. Where (* P<0.05).
Gut microbiota distribution at species level
We have also examined the organization of gut microbial taxa at species level represented in table 7. The results also determine the alterations at species level between GD patients and healthy control subjects. However, H. parainfluenzae species showed a raised level in GD patient as compared to healthy subjects.
Differential abundant species in GD v/s C by High-throughput sequencing analysis.
| Taxa | mean( GD) | mean( C) | p value | q* |
|---|---|---|---|---|
| Haemophilus parainfluenzae | 0.0322704 | 0.0099031 | 0.09254 | 0.32442 |
| Bacteroides vulgatus | 0.0808569 | 0.0753513 | 0.86014 | 0.92973 |
| Bacteroides plebeius | 0.0071657 | 0.0240073 | 0.15385 | 0.48126 |
| Bacteroides uniformis | 0.0266581 | 0.0334637 | 0.61139 | 0.80204 |
| Bacteroides_stercoris | 0.0229439 | 0.0225265 | 0.97103 | 1 |
| Parabacteroides distasonis | 0.0072955 | 0.0138739 | 0.65135 | 0.84537 |
| Escherichia coli | 0.0075784 | 0.011543 | 0.80919 | 0.9057 |
| Coprobacillus cateniformis | 0.0084162 | 0.00017 | 0.42557 | 0.70232 |
| Bacteroides fragilis | 0.0123962 | 0.0040837 | 0.27672 | 0.62745 |
| Clostridium leptum | 0.0002952 | 0.006532 | 0.12587 | 0.42657 |
| Clostridiales oral-taxon | 0.0057081 | 0.0003972 | 0.1978 | 0.56335 |
| Bacteroides ovatus | 0.0191771 | 0.0165495 | 0.68232 | 0.86711 |
| Parabacteroides merdae | 0.0171971 | 0.0135416 | 0.51449 | 0.72146 |
| Bacteroides massiliensis | 0.0101689 | 0.0059956 | 0.39361 | 0.70232 |
| Bacteroides coprophilus | 0.0027312 | 0.0062198 | 0.45854 | 0.70232 |
| Campylobacter concisus | 0.0007929 | 1.70E-05 | 0.005 | 0.08706 |
| Campylobacter showae | 0.0001206 | 0 | 0.001 | 0.02438 |
| Lactobacillus gasseri | 0 | 0.000102 | 0.001 | 0.02438 |
| Alistipes sp. | 0 | 8.81E-05 | 0.001 | 0.02438 |
| Veillonella sp . | 3.86E-05 | 0 | 0.001 | 0.02438 |
| Bifidobacterium_longum | 6.18E-06 | 8.19E-05 | 0.03397 | 0.27626 |
| Morganella morganii | 2.47E-05 | 0 | 0.001 | 0.02438 |
| Clostridium sp. | 1.24E-05 | 1.55E-06 | 0.03906 | 0.29785 |
| Bacteroides coagulans | 0 | 1.24E-05 | 0.00781 | 0.1059 |
| Methanobrevibacter smithii | 9.27E-06 | 0 | 0.03125 | 0.27232 |
| Lactobacillus iners | 0.00E+00 | 1.39E-05 | 0.00391 | 0.07942 |
| Firmicutes bacterium | 0 | 9.27E-06 | 0.03125 | 0.27232 |
| Leuconostoc lactis | 1.24E-05 | 0 | 0.00781 | 0.1059 |
| Campylobacter ureolyticus | 0 | 9.27E-06 | 0.03125 | 0.2723 |
Where P<0.05
Correlation of molecular protocols
The research findings by applying molecular methods like DGGE and High-throughput sequencing analysis unveiled the most prevalence of bacterial phyla were Bacteroidets, Firmicutes Proteobacteria, and Actinobacteria. However, the sensitive and more reliable High-throughput Illumina-based sequencing at the platform of Hiseq 2500 confirm the authenticity of the diverse gut microbial population. The PCR-DGGE technique could be applied as a basic routine test to observe the massive changes of intestinal bacterial ecology as less time consuming and economical. In the current study, the data generated from experimental techniques like DGGE, Real-time PCR, and high-throughput sequencing were also aligned. Furthermore, the sensitivity and suitability of high-throughput sequencing are proven in the proceeding methods to analyze and investigate the intestinal bacterial ecology [31].
Discussion
Human intestinal microbes play a vital role in host body defense in response to pathogenesis mediated by protective, trophic, and metabolic functions [8]. The GD patient shows the alterations of intestinal bacterial composition as compared healthy controls as evident by profiling DGGE, High-throughput sequencing analysis, and Real-time PCR data. So, GD patient's bacterial taxa count testifies the alterations in comparison to healthy controls, with certain gut bacteria corresponds to variable levels.
Indices of richness such as such as observing species, ACE, Chao1 and Good's coverage significantly elevated in control as compared to GD. Notwithstanding the statistics do not signify the alterations in Shannon index and Simpson index that coordinate with preceding analysis [32]. The intestinal microbial community similarity and diversity estimations by DGGE gel profiles and High-throughput sequencing analysis illustrate that the gut microbiota: compared to healthy control was less varied that was corroborating the previous investigations on gastrointestinal tract, skin, and vagina [33-35]. The similarity index results in DGGE profile showed the lowering values in inter-group distinguishing from intra-group [36].
GD patients showed a notable alteration in gut bacterial composition as compared to healthy control; four phyla (Firmicutes, Bacteroidetes, Proteobacteria, Actinobacteria) were the most represented from those identified in both groups. There was more phyla abundance of Bacteroidetes, Proteobacteria and low level of Firmicutes that differentiating diseased and healthy group [31, 37, 38]. Further consistency was attributed with plentifulness of families Prevotellaceae and Pasteurellaceae that were a notably greater in GD with comparison of control volunteers which is aligned with previous work of radiotherapy effect on gut microbiota of gynecological cancer patients [31].The relative abundance of Enterobacteriaceae Veillonellaceae and Rikenellaceae were significantly decreased in GD with comparison to normal control which is aligned with previous literature of gut microbiota in multiple sclerosis patients [39].
At the level of genera, significantly raised genera in the GD patients were Prevotella_9 and Haemophilus, while significantly decreased genera were Alistipes and Faecalibacterium which is compatible with previous work [40, 41]. The intestinal bacterial taxa comparison along with species-level community showed a distinct segregation of intestinal bacterial organization between the GD patients and normal healthy volunteers which support the previous investigation on a possible role of the microbiota in the susceptibility or protection against diarrhoea after radiotherapy [42]. Interestingly present findings of gut microbial alterations of diseased and control demonstrated no direct relationship between GD and intestinal microbiota [14, 43, 44]. Thus, our results of diverse intestinal bacterial composition between the GD and healthy groups may responsible for amending the health status of an individual which is compatible with previous work of gut microbiota of gynecological cancer patients despite that disease development are not related to intestinal tract [31]. Thyroid disease like GD mostly affects the hollow organs with Hyperthyroidism with low gastric acid production. It increases the intestinal motility along with autoimmune gastritis resulting in diarrhea. It endorse that GD may involve in the intestine physiological alterations that further reshape the gut microbial composition [45].
The intestinal microbiota quantitative alterations can be observed by Real-time PCR [46], and the retrieved data signifies the reduction of Bifidobacterium and Lactobacillus [47]. The Bacteroides vulgatus and Clostridium leptum copy numbers were raised and lowered in GD patients respectively as compared to healthy control which is also reported in previous literature on metabolic endotoxemia initiates obesity and insulin resistance, early-life exposure to Clostridium leptum causes pulmonary immunosuppression [48, 49]. The use of probiotics frequency is increasing due to their health benefits especially the Lactobacillus and Bifidobacterium genera [50] involved in reducing colorectal cancer and has proven therapeutic role against obesity and inflammation and also exhibit poor probability in the development colon cancer in the existence of lactobacillus [8, 51].
As previously reported, low level of Clostridium leptum serves as a major predisposing factor for asthma progression. Conversely, Clostridium leptum exposure contributes to modulate the adaptive immunity that prevent from asthma development [49]. Our study findings depicted the slightly lower level of Clostridium leptum in the diseased group that specifies its role as contributing factor in GD. It has been documented that Bacteroides vulgatus is most frequently found in human intestinal microflora that co-exists with the mutual relationship of the host through prevention of intestinal colonization through competing with pathogens [52]. Bacteroides vulgatus is associated with a high-risk of colon cancer development while presence of lactobacillus constitutes a low-risk [8]. The current study represents the slightly raised level of Bacteroides vulgatus in GD patients.
Firmicutes to Bacteroidetes ratio has been previously used to describe the gut microbiota which may alter the host health status [53]. Our findings demonstrated slightly increase/decrease Bacteroidetes, Proteobacteria and Firmicutes thus in fact P>0.05. Future studies with more GD patients and healthy controls might be helpful to increase the statistical power.
There is a remarkable decrease of Veillonellaceae in GD patients which has a useful commensal function which is belonging to class Clostridia. It plays an important role in the body to induct the T regulatory immune cells [54]. Our results showed that significantly raised levels of Prevotella genus in the diseased group. However, Prevotella fluctuations play a vital in digesting of plant diet. It has also been documented that it may contribute to urinary tract infection, arthritis brain abscesses and osteomyelitis conditions [55, 56]. Enterobacteriaceae has rarely shown contributing proof in the infective endocarditis [57], and our finding showed an increase level of Enterobacteriaceae in control group as compared to diseased group. Haemophilus sub-type contributes in fatal chronic diseases in human especially cancer [41], H. parainfluenzae co-existence with host contribute to the infectious diseases involving respiratory, urinary, genital, meningitis, pneumonia along with endocarditis and arthritis [58]. The current experimental findings render rise in genus Haemophilus particularly in H. parainfluenzae species of GD patients that might be the high possible candidate as a disease-causing microbe.
The gut microbiota and disease inter-linkage have long been under investigation, current experimental data on 16S meta taxonomics approach can highlight association of potential disease-associated bacteria. The GD clinical symptoms like hyperthyroidism, ophthalmopathy, and pretibial myxedema along with circulating antibodies have a crucial role in reshaping the gut microbial configuration that may contemplate being the causative agent. The results findings of blood circulating antibodies anti-thyroglobulin, TRAb and anti-thyroid peroxidase and the level of serum thyroid hormones in GD patients and normal control, depicted in table S1, and table S2, respectively. The table S2 results reveal the remarkably raised level of aforementioned antibodies in the GD patients as compared to healthy control group. The higher level of antibodies in GD might alter the composition of intestinal microbes, in particular, the Phyla, Bacteroidetes, Actinobacteria and Firmicutes family Prevotellaceae Pasteurellaceae, Enterobacteriaceae, Veillonellaceae, and Rikenellaceae, genera Prevotella_9 Haemophilus, Alistipes and Faecalibacterium and species H. parainfluenza, and also largely influence the intestinal flora. Therefore in case of GD, it can be hypothesized that alteration in gut microbiota has a vital connection with the development of clinical features and further intensifying the disease. The limitations of human clinical work and lack of substantial data on GD obstruct to establish the possible high connection of understanding the disease pathway and its specific etiology. Therefore, future multi-faceted prospect to unravel the critical question of direct gut microbiota role in GD progression still needs to be elucidated.
Conclusion
Concisely the current study denotes the alteration in intestinal microbial taxa composition in GD patients as compared to controls, with certain gut microbes modulation. The diversity of bacterial community estimation stipulates that the gut flora of GD patients was less diverse in term of richness than in healthy control. These findings provide the basis to elaborate the disease pathway of multifaceted prospective study to illustrate the mechanism of gut microbial dysbiosis in Graves' disease.
Supplementary Material
Supplementary tables.
Acknowledgements
This study was supported by National Natural Science Foundation of China (NSFC 81730056).
The author would like to thank Dr. Hui Guo (Department of Endocrinology 1st affiliated Hospital Xi'an Jiotong University, China) for providing support in sample collection for this study.
Competing Interests
The authors have declared that no competing interest exists.
References
1. Power SE, O'Toole PW, Stanton C, Ross RP, Fitzgerald GF. Intestinal microbiota, diet and health. British Journal of Nutrition. 2013:1-16
2. Walsh CJ, Guinane CM, O'Toole PW, Cotter PD. Beneficial modulation of the gut microbiota. FEBS Letters. 2014
3. Kamada N, Chen GY, Inohara N, Núñez G. Control of pathogens and pathobionts by the gut microbiota. Nature immunology. 2013;14:685-90
4. Khoruts A, Dicksved J, Jansson JK, Sadowsky MJ. Changes in the composition of the human fecal microbiome after bacteriotherapy for recurrent Clostridium difficile-associated diarrhea. Journal of clinical gastroenterology. 2010;44:354-60
5. Shin NR, Lee JC, Lee HY, Kim MS, Whon TW, Lee MS. et al. An increase in the Akkermansia spp. population induced by metformin treatment improves glucose homeostasis in diet-induced obese mice. Gut. 2014;63:727
6. Ishaq HM, Shahzad M, Wu X, Ma C, Xu J. Molecular Characterization Of Fecal Microbiota Of Healthy Chinese Tobacco Smoker Subjects In Shaanxi Province, Xi'an China. Journal of Ayub Medical College Abbottabad Jamc. 2017;29:3
7. Ishaq HM, Shahzad M, Wu X, Ma C, Xu J. Gut Microbe Analysis between Asthma Patients and Healthy Volunteers in Shaanxi Province, Xi'an, China. Pakistan Journal of Zoology. 2018;50:165 -
8. Guarner F, Malagelada J-R. Gut flora in health and disease. The Lancet. 2003;361:512-9
9. Zhong J, Xu JF, Yang P, Liang Y, Wang CY. Innate Immunity in the Recognition of ?-Cell Antigens in Type 1 Diabetes. Intech. 2011
10. Kristensen B. Regulatory B and T cell responses in patients with autoimmune thyroid disease and healthy controls. Danish medical journal. 2016:63
11. Burch HB, Cooper DS. Management of Graves Disease: A Review. Jama. 2015;314:2544-54
12. Antonelli A, Ferrari SM, Corrado A, Di Domenicantonio A, Fallahi P. Autoimmune thyroid disorders. Autoimmunity reviews. 2015;14:174-80
13. Evsyutina Y, Trukhmanov A, Ivashkin V, Storonova O, Godjello E. Case report of Graves' disease manifesting with odynophagia and heartburn. World journal of gastroenterology. 2015;21:13582
14. Draman MS, Ludgate M. Thyroid eye disease- an update. Expert Review of Ophthalmology. 2016;11:1-12
15. Byfield P, Davies S, Copping S, Barclay F, Borriello S. Thyrotrophin (TSH)-binding proteins in bacteria and their cross-reaction with autoantibodies against the human TSH receptor. Journal of endocrinology. 1989;121:571-7
16. Brand OJ, Barrett JC, Simmonds MJ, Newby PR, Mccabe CJ, Bruce CK. et al. Association of the thyroid stimulating hormone receptor gene (TSHR) with Graves' disease. Human Molecular Genetics. 2009;18:1704-13
17. Xu MY, Cao B, Yin J, Wang DF, Chen KL, Lu QB. Vitamin D and Graves' Disease: A Meta-Analysis Update. Nutrients. 2015;7:3813-27
18. Sang YW, Kyung CH. Recent Advances in Autoimmune Thyroid Diseases. Endocrinology & Metabolism. 2016;31:379-85
19. Scanlan PD, Shanahan F, O'Mahony C, Marchesi JR. Culture-independent analyses of temporal variation of the dominant fecal microbiota and targeted bacterial subgroups in Crohn's disease. Journal of clinical microbiology. 2006;44:3980-8
20. Muyzer G, De Waal EC, Uitterlinden AG. Profiling of complex microbial populations by denaturing gradient gel electrophoresis analysis of polymerase chain reaction-amplified genes coding for 16S rRNA. Applied and environmental microbiology. 1993;59:695-700
21. Van Der Gucht K, Sabbe K, De Meester L, Vloemans N, Zwart G, Gillis M. et al. Contrasting bacterioplankton community composition and seasonal dynamics in two neighbouring hypertrophic freshwater lakes. Environmental Microbiology. 2001;3:680-90
22. Ling Z, Kong J, Liu F, Zhu H, Chen X, Wang Y. et al. Molecular analysis of the diversity of vaginal microbiota associated with bacterial vaginosis. BMC genomics. 2010;11:488
23. Green SJ, Leigh MB, Neufeld JD. Denaturing gradient gel electrophoresis (DGGE) for microbial community analysis. Handbook of hydrocarbon and lipid microbiology: Springer. 2010:4137-58
24. McBain AJ, Bartolo RG, Catrenich CE, Charbonneau D, Ledder RG, Rickard AH. et al. Microbial characterization of biofilms in domestic drains and the establishment of stable biofilm microcosms. Applied and Environmental Microbiology. 2003;69:177-85
25. Ishaq HM, Mohammad IS, Guo H, Shahzad M, Hou YJ, Ma C. et al. Molecular estimation of alteration in intestinal microbial composition in Hashimoto's thyroiditis patients. Biomedicine & Pharmacotherapy. 2017;95:865-74
26. Peiffer JA, Spor A, Koren O, Jin Z, Tringe SG, Dangl JL. et al. Diversity and heritability of the maize rhizosphere microbiome under field conditions. Proceedings of the National Academy of Sciences of the United States of America. 2013;110:6548-53
27. Magoč T, Salzberg SL. FLASH: fast length adjustment of short reads to improve genome assemblies. Bioinformatics. 2011;27:2957-63
28. Caporaso JG, Kuczynski J, Stombaugh J, Bittinger K, Bushman FD, Costello EK. et al. QIIME allows analysis of high-throughput community sequencing data. Nat Methods. 2010;7:335-6
29. Wang Q, Garrity GM, Tiedje JM, Cole JR. Naïve Bayesian Classifier for Rapid Assignment of rRNA Sequences into the New Bacterial Taxonomy. Applied and Environmental Microbiology. 2007;73:5261-7
30. Huson DH, Mitra S, Ruscheweyh HJ, Weber N, Schuster SC. Integrative analysis of environmental sequences using MEGAN4. Genome Research. 2011;21:1552
31. Nam YD, Kim HJ, Seo JG, Kang SW, Bae JW. Impact of Pelvic Radiotherapy on Gut Microbiota of Gynecological Cancer Patients Revealed by Massive Pyrosequencing. PLOSE ONE. 2013;8:e82659
32. Li W, Han L, Yu P, Ma C, Wu X, Moore JE. et al. Molecular Characterization of Skin Microbiota Between Cancer Cachexia Patients and Healthy Volunteers. Microbial Ecology. 2014;67:679-89
33. Hummelen R, Fernandes AD, Macklaim JM, Dickson RJ, Changalucha J, Gloor GB. et al. Deep Sequencing of the Vaginal Microbiota of Women with HIV. PloS one. 2010;5:e12078
34. Costello EK, Lauber CL, Hamady M, Fierer N, Gordon JI, Knight R. Bacterial community variation in human body habitats across space and time. Science. 2009;326:1694-7
35. Ling Z, Kong J, Jia P, Wei C, Wang Y, Pan Z. et al. Analysis of oral microbiota in children with dental caries by PCR-DGGE and barcoded pyrosequencing. Microbial Ecology. 2010;60:677-90
36. Wu X, Ma C, Han L, Nawaz M, Gao F, Zhang X. et al. Molecular characterisation of the faecal microbiota in patients with type II diabetes. Current microbiology. 2010;61:69-78
37. Gill SR, Pop M, DeBoy RT, Eckburg PB, Turnbaugh PJ, Samuel BS. et al. Metagenomic analysis of the human distal gut microbiome. science. 2006;312:1355-9
38. Ley RE, Bäckhed F, Turnbaugh P, Lozupone CA, Knight RD, Gordon JI. Obesity alters gut microbial ecology. Proceedings of the National Academy of Sciences of the United States of America. 2005;102:11070-5
39. Chen J, Chia N, Kalari KR, Yao JZ, Novotna M, Soldan MMP. et al. Multiple sclerosis patients have a distinct gut microbiota compared to healthy controls. Scientific Reports. 2016;6:28484
40. He Z, Shao T, Li H, Xie Z, Wen C. Alterations of the gut microbiome in Chinese patients with systemic lupus erythematosus. Gut Pathogens. 2016;8:64
41. Singh V, Nanjappa S, Pabbathi S, Greene JN. Invasive Haemophilus influenzae Infection in Patients With Cancer. Cancer control: journal of the Moffitt Cancer Center. 2017;24:66-71
42. Manichanh C, Varela E, Martinez C, Antolin M, Llopis M, Doré J. et al. The gut microbiota predispose to the pathophysiology of acute postradiotherapy diarrhea. American Journal of Gastroenterology. 2008;103:1754-61
43. Covelli D, Ludgate M. The thyroid, the eyes and the gut: a possible connection. Journal of Endocrinological Investigation. 2017:1-10
44. Köhling HL, Plummer SF, Marchesi JR, Davidge KS, Ludgate M. The microbiota and autoimmunity: Their role in thyroid autoimmune diseases. Clinical Immunology. 2017
45. EC E. The thyroid and the gut. Journal of clinical gastroenterology. 2010;44:402-6
46. Lyons SR, Griffen AL, Leys EJ. Quantitative real-time PCR forPorphyromonas gingivalis and total bacteria. Journal of clinical microbiology. 2000;38:2362-5
47. Zhou L, Li X, Ahmed A, Wu D, Liu L, Qiu J. et al. Gut microbe analysis between hyperthyroid and healthy individuals. Current microbiology. 2014;69:675-80
48. Cani PD, Amar J, Iglesias MA, Poggi M, Knauf C, Bastelica D. et al. Metabolic endotoxemia initiates obesity and insulin resistance. Diabetes. 2007;56:1761-72
49. Huang F, Qiao HM, Yin JN, Gao Y, Ju YH, Li YN. Early-Life Exposure to Clostridium leptum Causes Pulmonary Immunosuppression. PloS one. 2015;10:e0141717
50. Butel MJ. Probiotics, gut microbiota and health. Medecine et maladies infectieuses. 2014;44:1-8
51. Nova E, Perez de Heredia F, Gomez-Martinez S, Marcos A. The Role of Probiotics on the Microbiota: Effect on Obesity. Nutrition in clinical practice: official publication of the American Society for Parenteral and Enteral Nutrition. 2016
52. Wexler HM. Bacteroides: the good, the bad, and the nitty-gritty. Clinical microbiology reviews. 2007;20:593-621
53. Johnson EL, Heaver SL, Walters WA, Ley RE. Microbiome and metabolic disease: revisiting the bacterial phylum Bacteroidetes. Journal of Molecular Medicine. 2017;95:1-8
54. Atarashi K, Tanoue T, Shima T, Imaoka A, Kuwahara T, Momose Y. et al. Induction of Colonic Regulatory T Cells by Indigenous Clostridium Species. Science. 2011;331:337
55. Scher J. [Original String]: Scher, J.U. et al. Expansion of intestinal Prevotella copri correlates with enhanced susceptibility to arthritis. eLife 2, e01202 (2013). Elife Sciences. 2010;2:e01202
56. Dillon SM, Lee EJ, Kotter CV, Austin GL, Gianella S, Siewe B. et al. Gut Dendritic Cell Activation Links an Altered Colonic Microbiome to Mucosal and Systemic T Cell Activation in Untreated HIV-1 infection. Mucosal Immunology. 2015;9:24-37
57. Brouqui P, Raoult D. Endocarditis due to rare and fastidious bacteria. Clinical Microbiology Reviews. 2001;14:177
58. Darrasjoly C, Lortholary O, Mainardi JL, Etienne J, Guillevin L, Acar J. et al. Haemophilus endocarditis: Report of 42 cases in adults and review. Interscience Conference on Antimicrobial Agents and Chemotherapy. 1997:1087-94
59. Matsuki T, Watanabe K, Fujimoto J, Takada T, Tanaka R. Use of 16S rRNA gene-targeted group-specific primers for real-time PCR analysis of predominant bacteria in human feces. Applied and Environmental Microbiology. 2004;70:7220-8
60. Matsuki T, Watanabe K, Fujimoto J, Miyamoto Y, Takada T, Matsumoto K. et al. Development of 16S rRNA-gene-targeted group-specific primers for the detection and identification of predominant bacteria in human feces. Applied and environmental microbiology. 2002;68:5445-51
61. Dubernet S, Desmasures N, Guéguen M. A PCR-based method for identification of lactobacilli at the genus level. FEMS Microbiology Letters. 2002;214:271-5
62. Wang R-F, Cao W-W, Cerniglia CE. PCR detection and quantitation of predominant anaerobic bacteria in human and animal fecal samples. Applied and Environmental Microbiology. 1996;62:1242-7
Author contact
![]() Corresponding author: Prof. Dr. Jiru Xu, Department of Microbiology and Immunology, Key Laboratory of Environment and Genes Related to Diseases of Chinese Ministry of Education, School of Medicine, Xi'an Jiaotong University, Xi'an, China. Email: xujiruxjtu.edu.cn
Corresponding author: Prof. Dr. Jiru Xu, Department of Microbiology and Immunology, Key Laboratory of Environment and Genes Related to Diseases of Chinese Ministry of Education, School of Medicine, Xi'an Jiaotong University, Xi'an, China. Email: xujiruxjtu.edu.cn