Impact Factor ISSN: 1449-2288
- Issue 12; 2026
- Issue 11; 2026
- Issue 10; 2026
- Issue 9; 2026
- Issue 8; 2026
- Volume 22; 2026
- Past Issues
- Advance Articles
- Editorial Board
- Cover Images
- Index & Coverage
- Cover Suggestion
- Special Issues
Introduction
Materials and methods
Results
Discussion
Supplementary Material
Abbreviations
Acknowledgements
References

 Global reach, higher impact
Int J Biol Sci 2019; 15(5):984-998. doi:10.7150/ijbs.29836 This issue Cite
Research Paper
Elevated CD163+/CD68+ Ratio at Tumor Invasive Front is Closely Associated with Aggressive Phenotype and Poor Prognosis in Colorectal Cancer
Chaogang Yang1,2,3*, Chen Wei1,2,3*, Shuyi Wang1,2,3*, Dongdong Shi1,2,3, Chunxiao Zhang1,2,3, Xiaobin Lin1,2,3, Rongzhang Dou1,2,3, Bin Xiong1,2,3 ![]()
1. Department of Gastrointestinal Surgery & Department of Gastric and Colorectal Surgical Oncology, Zhongnan Hospital of Wuhan University, Wuhan 430071, China;
2. Hubei Key Laboratory of Tumor Biological Behaviors, Wuhan 430071, China;
3. Hubei Cancer Clinical Study Center, Wuhan 430071, China.
*These authors contributed equally to this work.
Received 2018-9-10; Accepted 2019-2-18; Published 2019-3-10
Abstract

Background: The interaction and crosstalk between tumor-associated macrophages (TAMs) and epithelial-mesenchymal transition (EMT) has been demonstrated to play a critical role in the progression and metastasis of multiple cancers. However, the roles of the M2-polarized TAMs in different tumor location in EMT and prognosis of colorectal cancer (CRC) have not been elucidated. Therefore, the present study was designed to set up a reliable ratio of CD163+/CD68+ to assess M2-polarized TAMs infiltration in the tumor center (TC) and tumor invasive front (TF) and to further evaluate their prognostic value and biological effects on tumor cells in CRC.
Methods: TAMs markers (CD68 and CD163) and EMT markers (E-cadherin and Vimentin) expression were evaluated by immunohistochemistry in 81 patients with CRC. Circulating tumor cells (CTCs) of peripheral blood from above patients was also isolated. The correlation of CD163+/CD68+ ratio in different locations, EMT and CTCs counts were further analyses. Kaplan-Meier and the model analyses of univariate Cox proportional hazards were utilized to compare the survival of patients with high CD163+/CD68+ ratio with those with low CD163+/CD68+ ratio. Furthermore, the effects of the M2-polarized TAMs on growth, migration and invasion of CRC cells were explored in vivo and in vitro co-culture system.
Results: The results showed that the level of CD163+/CD68+ ratio in TF was significant higher than that in TC, and higher CD163+/CD68+TF ratio were closely correlated with enhanced lymphovascular invasion, tumor invasion and TNM stage. Interestingly, higher CD163+/CD68+TF ratio were also significantly associated with EMT program and CTCs counts. Meanwhile, Kaplan-Meier analysis showed that CD163+/CD68+TF was associated with both recurrence-free survival (RFS) and overall survival (OS) of patients with CRC. Multivariate Cox regression analyses demonstrated that CD163+/CD68+TF remained an independent prognostic factor for RFS and OS. Further receiver operating characteristic (ROC) curve analysis found that CD163+/CD68+TF was a better prognosticator compared with CD68+TF and CD163+TF for CRC patients. What's more, M2-polarized TAMs secreted TGF-β to facilitate the EMT, growth, proliferation and invasion of CRC cells by in vivo and in vitro experiments.
Conclusions: Our studies preliminarily elucidated the prognostic value of CD163+/CD68+ ratio in different tumor locations and the biological functions of M2-polarized TAMs in CRC progression via TGF-β.
Keywords: colorectal cancer, tumor-associated macrophage, CD163+/CD68+ ratio, epithelial-mesenchymal transition, prognosis
Introduction
Colorectal cancer (CRC) is estimated to be the third most common malignancy worldwide [1]. Despite the great advancement in diagnosis and treatment modalities, the prognosis of patients with CRC remains poor due to tumor recurrence and metastasis [2]. Emerging evidence demonstrated that a dynamic interaction exists between CRC cells and the surrounding tumor microenvironment(TME), which can stimulate the development, progression and metastasis of CRC [3]. The precise prediction of the prognosis is helpful in choosing the most appropriate and timely treatment for patients with CRC. The tumor-node-metastasis (TNM) staging, used as a prognostic model by clinicians at present, could not provide full prognostic information, as the TME in CRC was a “complex society” of many cell types and their extracellular matrix [4]. Therefore, there is an urgent need for an accurate classification of CRC that can be applied to better predict the prognostic significance of patients.
One candidate method for determining the prognosis of resected CRC is the evaluation of infiltrating macrophages, which are generally known as tumor-associated macrophages (TAMs) [5]. Generally, TAMs can be divided into two distinct polarized states: classically (M1) or alternatively (M2) activated cells depending on environmental cues, and their presence can be correlated with both poor and favorable prognoses [6]. M1 macrophages characterized by the expression of the co-stimulatory molecules (CD80) are pro-inflammatory and immunostimulation, whereas M2 macrophages express high level of hemoglobin scavenger receptor (CD163) and anti-inflammatory cytokines (IL-10) to favor tumor cell progression [7]. An immunohistochemical analysis of human solid tumors based on macrophage markers revealed that a high density of TAMs was positively correlated with metastasis and reduced survival in a majority of malignancies, including breast cancer, liver cancer and bladder cancer [8-10]. For CRC, conflicting results have been reported regarding the prognostic significance of TAMs [11-13]. These contradicting data might be attributed to the diverse forms of TAMs activation and polarization that are largely determined by the TME in different types of tumors or even in the different locations of tumor tissues [14]. Therefore, selection of macrophage subtypes markers and tissue distribution of interest would affect the prognostic value of TAMs in CRC. To date, the clinical value of the distribution and polarization of TAMs in different tissue locations of CRC, especially for the M2-polarized TAMs, still remains unclear.
Epithelial-mesenchymal transition (EMT), a process of transdifferentiation of epithelial cells into motile mesenchymal cells, has been proved to play a critical role in tumor invasion and metastasis [15]. The functional hallmark of the EMT program is to transform polarized epithelial cancer cells into a mesenchymal cell phenotype, thereby enhancing the ability of migration and invasion and facilitating cancer cells to break through basement membranes into the blood circulation [16]. These tumor cells that enter the blood from the primary site of tumor are termed as circulating tumor cells (CTCs), which are considered to be the precursors of tumor metastasis [17]. Recently, emerging experimental and clinical evidences have revealed that activation of the EMT program typically requires crosstalk between cancer cells and the local tumor microenvironment, includeing TAMs [18]. And, the interaction and crosstalk between TAMs and EMT undoubtedly promotes tumor progression and metastasis, at least in some cancers [19]. However, the links between TAMs, EMT and CTCs in CRC have not been elucidated.
Considering all the above mentioned, the present study was designed to set up a reliable ratio of CD163+/CD68+ to assess M2-polarized TAMs infiltration in the tumor center (TC) and tumor invasive front (TF) and to evaluate their prognostic value in CRC. Meanwhile, we also focused on the correlation of CD163+/CD68+ ratio in different locations with EMT of tumor cells and CTCs count from peripheral blood (PB) in CRC. Moreover, we further investigated the role of the M2-polarized TAMs in promoting the EMT, growth, migration and invasion of CRC cells through in vivo and in vitro co-culture system.
Materials and methods
Ethics approval and consent to participate
This study was approved by the Institutional Review Boards of Zhongnan Hospital of Wuhan University, and undertaken in accordance with the ethical standards of the World Medical Association Declaration of Helsinki. The written informed consents were obtained from all included patients. Animal assays were performed according to Wuhan Medical Experimental Animal Care Guidelines.
Patients and specimens
A total of 81 CRC patients who underwent curative resection at Zhongnan Hospital of Wuhan University were retrospectively analyzed in this study. All included patients were identified as adenocarcinoma of colorectal by histopathology and had available preoperative CTCs and survival data. Moreover, all patients were devoid of neoadjuvant chemotherapy or radiotherapy before surgical resection and did not be diagnosed with autoimmune diseases. PB samples with a volume of 2.5 ml from all patients were collected in EDTA-containing tubes (BD, USA) at the time of one day before surgery. Formalin-fixed, paraffin-embedded (FFPE) cancer tissue specimens were obtained from these patients after surgery. Major demographic and clinicopathological characteristics, including age, gender, tumor site, tumor size, tumor grade, lymphovascular invasion (LVI), perineural invasion (PNI), tumor invasion (TI), lymph node metastasis (LNM), TNM stage (according to the 7th edition of the AJCC Cancer Staging Manual), serum carbohydrate antigen 19-9 (CA19-9) and carcinoembryonic antigen (CEA) level, were retrieved from the electronic medical records. The general practice for postoperative follow-up included physical examination, interval history, and serum CEA testing at 3- to 6-month intervals for the first 2 to 3 years and at 6-month intervals thereafter for 5 years. Imaging, most frequently CT of the thorax, abdomen, and pelvis, was performed at a minimum of every 12 months for at least 3 years. Colonoscopy was typically performed within the first year after surgery and then repeated every 3 to 5 years until advanced tumors were identified or patient death. In this study, recurrence-free survival (RFS) and overall survival (OS) were used for prognosis evaluation. RFS was defined as the months from receiving surgery to the time of tumor relapse or metastasis, and OS was defined as the months from operation to death or last follow-up.
The demographic and clinicopathological characteristics of included patients were summarized in Table 1. According to the patient's records, there were 48 males and 33 females among all included patients. The median age was 60 years, ranged from 33 to 84 years. 42 cases were from colon and 39 cases were from rectum. 6 patients were classified as stage I, 47 as stage II, and 28 as stage III. Based on the pathological report of surgical specimens, 53 patients received regular chemotherapy based on 5-Fu after radical surgery and 28 did not receive chemotherapy. At the end of follow-up, 43 were recurrence and 28 were dead.
Correlation between CD163+/CD68+ ratio in TC and TF and clinicopathologic parameters
| Parameters | No. (%) | CD163+/CD68+TC No. | CD163+/CD68+TF No. | ||||||
|---|---|---|---|---|---|---|---|---|---|
| Low | High | P value | Low | High | P value | ||||
| Age, year | 0.825 | 0.824 | |||||||
| <60 | 39(48.1) | 21 | 18 | 17 | 22 | ||||
| ≥60 | 42(51.9) | 21 | 21 | 20 | 22 | ||||
| Gender | 0.373 | 0.821 | |||||||
| Male | 48(59.3) | 27 | 21 | 21 | 27 | ||||
| Female | 33(40.7) | 15 | 18 | 16 | 17 | ||||
| Tumor site | 0.377 | 0.659 | |||||||
| Colon | 42(51.9) | 24 | 18 | 18 | 24 | ||||
| Rectal | 39(48.1) | 18 | 21 | 19 | 20 | ||||
| Tumor size, cm | 0.647 | 0.815 | |||||||
| <5 | 54(66.7) | 29 | 25 | 24 | 30 | ||||
| ≥5 | 27(33.3) | 13 | 14 | 13 | 14 | ||||
| Tumor grade | 0.079 | 0.755 | |||||||
| Poor | 32(39.5) | 12 | 20 | 13 | 19 | ||||
| Moderate | 27(33.3) | 18 | 9 | 13 | 14 | ||||
| Well | 22(27.2) | 12 | 10 | 11 | 11 | ||||
| LVI | 0.046* | 0.024* | |||||||
| Absence | 45(55.6) | 28 | 17 | 26 | 19 | ||||
| Presence | 36(44.4) | 14 | 22 | 11 | 25 | ||||
| PNI | 0.820 | 0.642 | |||||||
| Absence | 53(65.4) | 28 | 25 | 23 | 30 | ||||
| Presence | 28(34.6) | 14 | 14 | 14 | 14 | ||||
| TI | 0.772 | 0.042* | |||||||
| T1-2 | 14(17.3) | 8 | 6 | 10 | 4 | ||||
| T3-4 | 67(82.7) | 34 | 33 | 27 | 40 | ||||
| LNM | 0.330 | 0.464 | |||||||
| N0-1 | 57(70.4) | 32 | 25 | 28 | 29 | ||||
| N2-3 | 24(29.6) | 10 | 14 | 9 | 15 | ||||
| TNM stagea | 0.820 | 0.035* | |||||||
| I-II | 53(65.4) | 28 | 25 | 29 | 24 | ||||
| III | 28(34.6) | 14 | 14 | 8 | 20 | ||||
| CA19-9, U/mL | 0.476 | 0.807 | |||||||
| <37 | 57(70.4) | 28 | 29 | 27 | 30 | ||||
| ≥37 | 24(29.6) | 14 | 10 | 10 | 14 | ||||
| CEA, ng/ml | 0.246 | 0.233 | |||||||
| <5 | 55(67.9) | 26 | 29 | 28 | 27 | ||||
| ≥5 | 26(32.1) | 16 | 10 | 9 | 17 | ||||
| Overall | 81(100.0) | 42 | 39 | - | 37 | 44 | - | ||
Notes: aThe 7th edition of the AJCC Cancer Staging Manual; *Significant variables: P<0.05. Abbreviations: No., number; LVI, lymphovascular invasion; PNI, perineural invasion; TI, tumor invasion; LNM, lymph node metastasis; TNM, tumor-node-metastasis; CA19-9, carbohydrate antigen 19-9; CEA, carcinoembryonic antigen; CD68, cluster of differentiation 68; CD163, cluster of differentiation 163; TC, tumor center; TF, tumor invasive front.
Immunohistochemistry
To examine the level of heterogeneous macrophages and EMT markers (E-cadherin and Vimentin) in TC and TF region, paraffin-embedded cancer samples were serially sectioned at 4 μm thickness. Antigen retrieval was performed by a pressure cooker for 30min in 0.01M citrate buffer (pH 6.0), followed by treatment with 3% hydrogen peroxide for 5min. Specimens were incubated with monoclonal antibodies against human CD68 (1:500; Abcam, USA), CD163 (1:50; Abcam, USA), E-cadherin (1:200; CST, USA), and Vimentin (1:200; CST, USA) overnight at 4 degree. For negative control, isotype-matched antibodies were applied. The slides were then scanned by the ScanScope system (Aperio), and the percentage of positive stained cells to total cell population was determined and quantified by the ImageScope positive pixel count algorithm (Aperio). All of the immunohistochemical results in this study were presented as the percentage of the positive stained cells to the total number of visible cells. The CD163+/CD68+TC and CD163+/CD68+TF ratio were defined as the ratio between CD163-positive stained cells and CD68-positive stained cells in TC and TF region.
CTCs isolation and identification
CTCs of PB were enriched using the CTCBIOPSY® device as described in our previous study [20]. The samples were processed according to the manufacturer's instructions. In brief, 2.5 mL blood sample of included patient was diluted up to 8 ml with 0.9% physiological saline containing 0.2% paraformaldehyde and left for 10 minutes at room temperature, then transferred to ISET tubes with an 8 μm diameter aperture membrane. After filtered by positive pressure from 12 mmHg to 20 mmHg, candidate CTCs were adhered to the membrane and were identified by three-color immunofluorescence staining. Immunofluorescence staining was performed as described in our previous study [20]. In brief, membranes with CTCs were transferred to glass slides, which were fixed with 4% PFA for 5 minutes. Wash the membrane by BD wash buffer (BD, USA) for three times. Then, add 100 ul Cytofix/ Permeabilization Kit (BD, USA) on the membrane for 20 minutes in order to allow for intracellular staining. After that, add 10% Goat serum to block for one hour. Then, discard the serum and add the primary mouse antibody to FITC-CK (1:100; Abcam, USA) and rat antibody to PE-CD45 (1:100; Santa, USA) for incubation overnight at 4 °C. On the next day, wash the membrane by BD wash buffer and add the secondary Alexa Fluor 488-conjugated goat anti-mouse IgG (Invitrogen, USA) and Alexa Fluor 594-conjugated goat anti-rat IgG (1:200; Invitrogen, USA). Nuclei was stained with Hoechst 33342 (1:500; Sigma, USA) and incubated for one hour, then wash the membrane three times with BD wash buffer. Finally, we imaged and enumerated CTCs using a fluorescence microscopy (IX81; Olympus, Tokyo, Japan). CTCs captured on membranes were photographed using IPP software (Media Cybernetics Inc., Silver Spring, MD, USA). CK+/CD45-/Hoechst+ cell was defined as CTC and CK-/CD45+/Hoechst+ cell as white blood cell (WBC).
Cell culture
The human monocyte leukemia cell line THP-1 and two additional CRC cell lines, HCT116 and HT29 cells were purchased from the Chinese of Sciences in Shanghai. Cells were cultured in RPMI 1640 medium (Gibco, USA) with 10% fetal bovine serum (FBS) (Gibco, USA) at 37°C in a humidified atmosphere with 5% CO2. Macrophages and CRC cell lines co-cultivation was conducted using the non-contact co-culture transwell system (Corning, USA). For cell growth, 3 x 10⁵ THP-1 cells were seeded in 0.4 μm sized pores inserts and polarized into M2 macrophages. Inserts containing M1/M2 polarized THP-1 macrophages were transferred to 6-well plate seeded with HCT116 or HT29 cells (1x10⁵ cells per well) in advance and co-cultured. After 48 h of co-culture, CRC cells were harvested for further analyses. The TGF-β neutralizing antibody (5 μg/mL, R&D Systems) were added to cultures as indicated.
Macrophage generation and differentiation
The protocols of M2 macrophages polarization from THP-1 were performed according to previously established method [21]. Briefly, to obtain M2 polarized phenotype, THP-1 cells were first treated with 100 nM PMA (Sigma-Aldrich, USA) for 24 h, followed cultured by the addition of IL-4 (Invitrogen, USA) and IL-13 (R&D, USA) (20 ng/ml) for another 24h. To generate M1-polarized phenotype, THP-1 cells were treated with 100 nM PMA (Sigma-Aldrich, USA) for 24 h, and then cultured with 100 ng/ml LPS (R&D, USA) and 20 ng/ml IFN-γ (R&D, USA) for another 18h.
RNA isolation and quantitative real-time PCR (qRT-PCR)
The total RNA was isolated using the Trizol Reagent (Invitrogen, USA) according to the manufacturer's instructions. After detection of RNA concentration, 1μg of total RNA was reversely transcribed with random primers, using the PrimeScript™ RT reagent kit (Toyobo, Japan). qRT-PCR was performed using the SYBR-Green PCR Master Mix(Takara, Japan). Relative expression was calculated using the 2-ΔΔCt method. Primers used for the amplification of human genes were as follows: E-cadherin: forward: 5′-ACA ACA AGC CCG AAT TCA CCC A-3′, reverse: 5′-TCA CAG CTG TTG CTG TTG TGC T-3'; Vimentin: forward: 5′-AAA GTG TGG CTG CCA AGA ACC T-3′; reverse: 5′-ATT TCA CGC ATC TGG CGT TCC A-3'; TNF-α: forward: 5′-TCT CGA ACC CCG AGT GAC AA-3′, reverse: 5′-TGA AGA GGA CCT GGG AGT AG-3'; EGF: forward: 5′-TCT GAA TGT CCC CTG TCC CAC G-3′; reverse: 5′-CTG CGA CTC CTC ACA TCT CTG C-3'; IL-8: forward: 5′- AAA CCA CCG GAA GGA ACC AT-3′, reverse: 5′-CCT TCA CAC AGA GCT GCA GAA A-3'; TGF-β: forward:5′- AAG GAC CTC GGC TGG AAG TGC-3′; reverse: 5′-CCG GGT TAT GCT GGT TGT A-3'; CCL2: forward: 5′- AAG ATC TCA GTG CAG AGG CTC G-3′; reverse: 5′-CAC AGA TCT CCT TGG CCA CAA-3'; IL-6: forward:5′- AAT AAC CAC CCC TGA CCC AAC -3′; reverse: 5′-ACA TTT GCC GAA GAG CCC T-3'; IL-1β: forward:5′- TGA ACT GAA AGC TCT CCA CC-3′; reverse: 5′-CTG ATG TAC CAG TTG GGG AA-3';GAPDH: forward: 5′-GCA CCA CCA ACT GCT TAG CA-3′; reverse: 5′- GTC TTC TGG GTG GCA GTG ATG-3′.
Colony formation and Wound healing assay
For colony formation detection, 500 cells were planted in 6-well plates and cultured for 2 weeks. Cells were then fixed with 4% paraformaldehyde and stained with 0.5% crystal violet. The assay was performed three times for each treatment. A wound-healing assay was used to evaluate the ability of CRC cells to migrate following culture with M2 macrophages. Cells were grown to 80-90% confluence in 24-well plates, and a wound was made by dragging a plastic pipette tip across the cell surface. The remaining cells were washed three times in PBS to remove cellular debris and incubated at 37˚C with serum-free medium. Migrating cells at the wound front were photographed after 24h. All experiments were performed in triplicate. The area of the wound was measured with Image J software.
Transwell assay
Cell invasion assays were performed using 24-well Transwells (8µm pore size; Corning, USA) pre-coated with Matrigel (Falcon 354480; BD Biosciences, USA). In total, 1x10⁵ cells were suspended in 500 µl RPMI 1640 containing 1% FBS and added to the upper chamber, while 750 µl RPMI 1640 containing 10% FBS was placed in the lower chamber. After 48h of incubation, Matrigel and the cells remaining in the upper chamber were removed using cotton swabs. Cells on the lower surface of the membrane were fixed in 4% paraformaldehyde and stained with 0.5% crystal violet. Cells in 5 microscopic fields (at ×200 magnification) were counted and photographed. All experiments were performed in triplicate.
Western blot
Cells were lysed using a RIPA buffer, including a protease inhibitor cocktail (Thermo Scientific, USA). The proteins were separated by SDS-PAGE gels and transferred to PVDF membranes (Millipore, USA). After blocking with 5% non-fat milk, the membranes were incubated with primary antibodies at 4°C overnight. The HRP-conjugated secondary antibodies were used to incubate the membranes for 1h at room temperature. The antibodies used were the anti-E-cadherin(1:1000, Cell Signaling, USA), the anti-Vimentin(1:1000, Cell Signaling, USA), and anti-β-actin antibody (1:5000, Santa cruz, USA). The membranes were washed and incubated for 1 h at room temperature with HRP-conjugated secondary antibodies. Proteins were detected using a Bio-Rad ChemiDoc XRS+ System. Bio-Rad Image Lab software was used for densitometric analysis.
Tumor xenograft study
For the tumor growth assay, the 6-8 weeks old nude mice were divided into two randomized groups (n=6 per group), and 5×10⁵ HCT116 cells, HCT116 cells (5×10⁵) and M1 macrophages (5×10⁵), or HCT116 cells (5×10⁵) and M2 macrophages (5×10⁵) in 200μl were subcutaneously injected into the flank of each mouse. After 10 days, we began measuring the tumor size every 5 days using digital vernier calipers, and calculated the tumor volume according to the following formula: volume=1/2×(width2×length). The mice were sacrificed after 30 days, and the tumors were collected and visually examined. The tumors tissues were further examined by H&E, IHC staining, Western blot, and RT-PCR assay.
Statistical analysis
Summary statistics for normally distributed quantitative variables were expressed as median with ranges (minimum, maximum) or mean ± standard deviation (mean ± SD). For non-normally distributed variables, median and IQR was used. Categorical data were summarized by ratios and percentages. Differences in means for continuous variables were compared using Student's t test or Mann-Whitney U test (two groups), or analysis of variance (multiple groups). The Pearson χ2 test or Fisher's exact test was used to compare qualitative variables. Correlations were analyzed by Pearson correlation analysis. Kaplan-Meier method was used for survival analysis and drawing the survival curves, and difference among patients' subgroups was calculated by log-rank test. Univariate and multivariate Cox-regression analyses were applied to identify the independent factors of prognosis. Only the significant variables in the univariate analysis (P<0.05) were entered into the multivariate Cox-regression analysis with a backward stepwise selection (Wald). Receiver operating characteristic (ROC) curve analysis with maximal Youden index values was used to identify optimal cut-off values and determine the prognostic predictive value of the parameters. All statistical analyses were performed with SPSS statistical software (version 22.0, IBM SPSS) and GraphPad Prism software (version 6.0, GraphPad Software) for Windows. Two-sided P<0.05 was considered as statistically significant.
Results
The level of CD163+/CD68+ ratio in TC and TF of CRC
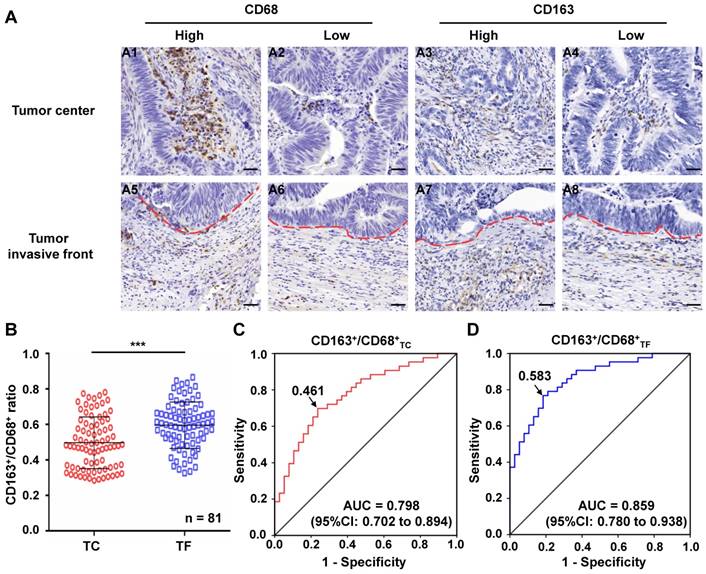
A series of 81 CRC specimens were examined for CD68 and CD163 in TC and TF (Figure 1A). Based on the numbers of CD163+ and CD68+ TAMs in TC and TF, we calculated the CD163+/CD68+ ratio in each location, respectively. Further analysis found that the CD163+/CD68+TF ratio was significantly higher than CD163+/CD68+TC ratio (0.595±0.015 vs 0.497±0.016, P<0.001, Figure 1B), but the CD163-/CD68+ ratio exhibited the opposite result in TF and TC(0.405 ± 0.015 vs 0.503 ± 0.016, P<0.001, Figure S1A). Furthermore, ROC curve analysis was applied to identify optimal cut-off values for CD163+/CD68+ ratio and CD163-/CD68+ ratio in TC and TF, and the results showed that the optimal cut-off was 0.461 for both CD163+/CD68+ and CD163-/CD68+ ratio in TC [sensitivity=69.8%, specificity=76.3%, AUC=0.798 (95%CI: 0.702-0.894), P<0.001, Figure 1C], 0.583 for both CD163+/CD68+ and CD163-/CD68+ ratio in TF [sensitivity=76.7%, specificity=81.6%, AUC=0.859 (95%CI: 0.780-0.938), P<0.001, Figure 1D and S1B], 0.583 for CD163-/CD68+ ratio in TC [sensitivity= 76.7%, specificity=81.6%, AUC=0.859 (95%CI: 0.780- 0.938), P<0.001, Figure 1D and S1C] according to maximization of the Younden index.
Immunohistochemical analyses of macrophages in clinical CRC samples. A. Immunostaining of CRC with CD68 and CD163 antibody for TAMs: A1-2. Cases with a high and low number of CD68+ TAMs in TC, respectively; A3-4. Cases with a high and low number of CD163+ TAMs in TC, respectively; A5-6. Cases with a a high and low number of CD68+ TAMs in TF, respectively; A7-8. Cases with a a high and low number of CD163+ TAMs TF, respectively. B. Differential expression of CD163+/CD68+ ratio in TC and TF. C-D. ROC analysis of the expression of CD163/CD68 ratio in TC and TF, respectively. Notes: Red dotted line represents the tumor invasive front; Scale bar: 400×; ***represents P<0.001. Abbreviation: CRC, colorectal cancer; TC, tumor center; TF, tumor invasive front; ROC, receiver operating characteristic; AUC, area under curve.
Correlation of CD163+/CD68+ ratio with clinicopathological parameters
All of the included patients were dichotomized into two groups according to the above-mentioned optimal cut-off values of CD163+/CD68+ ratio in TC and TF. The correlations of CD163+/CD68+ ratio in TC and TF with clinicopathological parameters of CRC patients were illustrated in Table 1. In TF, high ratio of CD163+/CD68+TF were significantly associated with LVI, TI and TNM stage (P<0.05, respectively). In contrast to the strong clinical associations of the TF populations, only LVI was found to be correlated with the high ratio of CD163+/CD68+TC in TC. In this study, we did not find any significant relationship between CD163+/CD68+ ratio in TC and TF and other clinicopathological factors in CRC (P>0.05 for all).
Correlation of CD163+/CD68+ ratio with EMT markers
EMT markers, including epithelial marker-E-cadherin and mesenchymal marker-Vimentin, were detected in CRC tissues. As shown in Figure 2A, the expression of E-cadherin and Vimentin presented a relatively high trend in TC, regardless of the level of CD163+/CD68+TC ratio. In TF, the expression of E-cadherin was decreased while the expression of vimentin was increased in CRC tissue with high level of CD163+/CD68+TF ratio compared with the CRC tissue with low level of CD163+/CD68+TF ratio. Furthermore, the relations of different CD163+/CD68+ ratio in different locations and EMT markers were analyzed. In TC, compared with the cancer samples with low level of CD163+/CD68+TC ratio, the expression level of E-cadherin and Vimentin in the cancer samples with high level of CD163+/CD68+TC ratio were not significantly change (P>0.05 for both). By contrast, the cancer samples with high level of CD163+/CD68+TF ratio nearby expressed significantly less E-cadherin and more Vimentin than the cancer samples with low level of CD163+/CD68+TF ratio in TF (P<0.001 for both, Figure 2C), an indication of EMT.
Immunohistochemical analyses of E-cadherin and Vimentin expression in clinical CRC samples. A. Immunostaining of CRC with E-cadherin and Vimentin antibody: A1-2. Cases with E-cadherin expression in TC and TF with low level of CD163+/CD68+ ratio, respectively; A3-4. Cases with E-cadherin expression in TC and TF with high level of CD163+/CD68+ ratio, respectively; A5-6. Cases with Vimentin expression in TC and TF with low level of CD163+/CD68+ ratio, respectively; A7-8. Cases with Vimentin expression in TC and TF with high level of CD163+/CD68+ ratio, respectively. B. Differential expression of Vimentin in TC with low and high level of CD163+/CD68+ ratio. C. Differential expression of E-cadherin and Vimentin in TF with low and high level of CD163+/CD68+ ratio. Notes: Red dotted line represents the tumor invasive front; Scale bar: 400×; NS, not significant, P>0.05; ***represents P<0.001. Abbreviation: CRC, colorectal cancer; TC, tumor center; TF, tumor invasive front.

Correlation of CD163+/CD68+ ratio with CTCs count
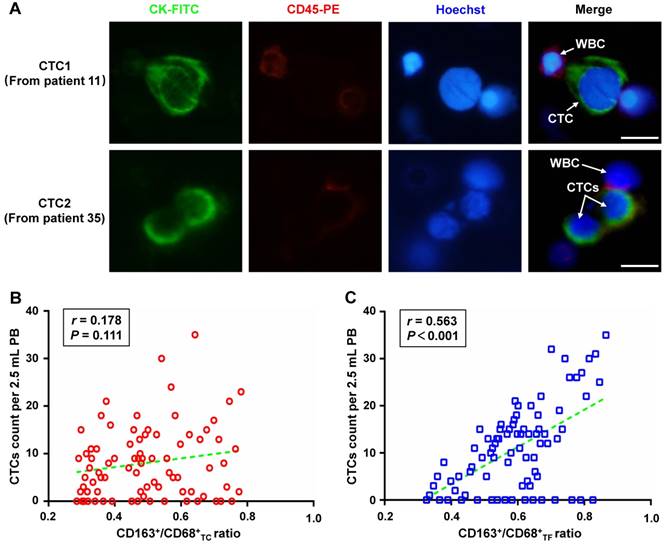
CTCs from PB of included patients were also detected to explore the correlation of CD163+/CD68+ ratio with CTCs count. Representative CTCs images from patient 11 and 35 were shown in Figure 3A. Overall, the CTCs counts that detected from of 81 included patients ranged from 0 to 35 per 2.5 mL, with an average of 11.09±9.16 and a positive rate of 80.25%(65/81). Interestingly, further analyses found that CTCs count was not correlated with CD163+/ CD68+TC ratio (r=0.178, P=0.111, Figure 3B), but was significantly correlated with CD163+/CD68+TF ratio (r=0.563, P<0.001, Figure 3C).
Relationship between the different CD163+ /CD68+ ratio in CRC tissues and the number of CTCs in peripheral blood of patients. A. Representative CTCs images from included patient 11 and 35, respectively. Three-color immunofluorescence staining based on FITC-labeled anti-CK, PE-labeled anti-CD45, and Hoechst nuclear staining was applied to identify and enumerate CTCs from non-specifically trapped WBCs. B. Correlation analysis between CD163+/CD68+TC ratio and CTCs count. C. Correlation analysis between CD163+/CD68+TF ratio and CTCs count. Note: Scale bar: 20μm. Abbreviation: CRC, colorectal cancer; CTCs, circulating tumor cells; FITC, fluorescein isothiocyanate; PE, phycoerythrin; WBCs, white blood cells; TC, tumor center; TF, tumor invasive front.
Prognostic significance of CD163+/CD68+ ratio in CRC
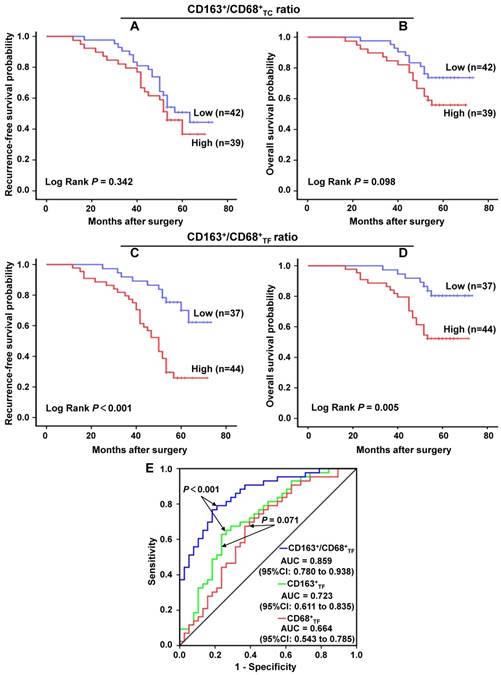
Further, we applied the Kaplan-Meier curve with a log-rank test to explore the correlation of clinicopathologic parameters with RFS and OS. The results revealed that, in CRC, high CD163+/CD68+TC ratio was not associated with a significantly worse RFS (P=0.342, Figure 4A ) and OS (P=0.098, Figure 4B). On the contrary, high CD163+/CD68+TF ratio was significant correlation with poor RFS (P<0.001, Figure 4C ) and OS (P=0.005, Figure 4D). For CD163-/CD68+ ratio, we found that low CD163-/CD68+TC ratio was not associated with a significantly worse RFS (P=0.342, Figure S1D) and OS (P=0.098, Figure S1E), but low CD163-/CD68+TF ratio was significant correlation with poor RFS (P<0.001, Figure S1F) and OS (P=0.005, Figure S1G). We also analyzed the prognostic significance of other clinicopathological parameters to identify the factors significantly influencing the survival. As expected, those traditional factors, including LVI, LNM and TNM stage, were confirmed as factors significantly correlated with both RFS and OS of CRC patients (P<0.05 for all). Moreover, PNI was significantly associated with CRC patients' RFS (P<0.05), but not with OS (P>0.05); while TI was significantly associated with CRC patients' OS (P<0.05), but not with RFS (P>0.05) in our study. Additionally, although the difference between poor and well tumor grade was not statistically significant, poor tumor grade seem to have unfavorable RFS and OS (P=0.052 and P=0.075, respectively).
The prognostic significance of different CD163+/CD68+ ratio in CRC. A-B. CD163+/CD68+TC ratio and the patients' recurrence-free survival and overall survival in CRC, respectively. C-D. CD163+/CD68+TF ratio and the patients' recurrence-free survival and overall survival in CRC, respectively. E. ROC curve analysis of the prognostic predictive value of CD68+TF, CD163+TF and CD163+/CD68+TF in CRC. Abbreviation: CRC, colorectal cancer; TC, tumor center; TF, tumor invasive front; ROC, receiver operating characteristic; AUC, area under curve; CI, confidence interval.
In order to further evaluate the prognostic potential of CD163+/CD68+ ratio in CRC, univariate and multivariate analyses using a COX proportional hazard model were performed. In univariate analyses, tumor grade, LVI, TI, LNM, AJCC stage and CD163+/ CD68+TF ratio were identified as the prognosticators for both RFS and OS (P<0.05 for all). PNI was considered as the factor for RFS (P=0.033), but not for OS (P=0.186) (Table 2). All factors found to have statistically significant correlations with RFS or OS in univariate analyses were included in final multivariate analyses. In this study, PNI (HR=2.623, 95%CI= 1.331-5.170, P=0.005) and CD163+/CD68+TF ratio (HR= 3.476, 95%CI=1.698-7.117, P=0.001) were the statistically significant independent predictors for RFS, and CD163+/CD68+TF ratio (HR=2.545, 95%CI=1.061-6.105, P=0.036) was confirmed to be the only significant independent predictor for OS in CRC (Table 3).
Univariate analyses of clinicopathologic parameters associated with recurrence-free survival and overall survival
| Parameters | Recurrence-free survival | Overall survival | |||||
|---|---|---|---|---|---|---|---|
| HR | 95% CI | P value | HR | 95% CI | P value | ||
| Age (<60 years vs. ≥60 years) | 1.168 | 0.642-2.126 | 0.612 | 1.579 | 0.739-3.372 | 0.238 | |
| Gender (male vs. female) | 0.960 | 0.517-1.783 | 0.897 | 1.025 | 0.480-2.189 | 0.949 | |
| Tumor site ( rectal vs. colon) | 0.753 | 0.412-1.375 | 0.355 | 0.644 | 0.302-1.376 | 0.256 | |
| Tumor size (<5 cm vs. ≥5 cm) | 1.320 | 0.767-2.214 | 0.328 | 1.792 | 0.831-3.861 | 0.137 | |
| Tumor grade (poor vs. moderate vs. well) | 0.627 | 0.424-0.927 | 0.019* | 0.586 | 0.354-0.967 | 0.037* | |
| LVI (absence vs. presence) | 2.165 | 1.172-4.001 | 0.014* | 2.145 | 1.004-4.582 | 0.049* | |
| PNI (absence vs. presence) | 1.931 | 1.053-3.541 | 0.033* | 1.657 | 0.783-3.506 | 0.186 | |
| TI (T1-2 vs. T3-4) | 1.596 | 1.031-2.470 | 0.036* | 1.991 | 1.121-3.536 | 0.019* | |
| LNM (N0-1 vs. N2-3) | 1.474 | 1.073-2.024 | 0.017* | 1.675 | 1.143-2.455 | 0.008* | |
| TNM stagea (I-II vs. III) | 1.776 | 1.053-2.996 | 0.031* | 2.521 | 1.278-4.973 | 0.008* | |
| CEA (<5 ng/ml vs. ≥5 ng/ml) | 1.384 | 0.765-2.502 | 0.283 | 1.507 | 0.724-3.134 | 0.273 | |
| CA19-9 (<37 U/mL vs. ≥ 37 U/ml) | 1.609 | 0.866-2.988 | 0.132 | 1.214 | 0.549-2.684 | 0.631 | |
| CD163+/CD68+TC (low vs. high) | 1.330 | 0.729-2.423 | 0.352 | 1.867 | 0.874-3.988 | 0.107 | |
| CD163+/CD68+TF (low vs. high) | 3.734 | 1.864-7.474 | < 0.001* | 3.159 | 1.341-7.441 | 0.009* | |
Notes: aThe 7th edition of the AJCC Cancer Staging Manual; *Significant predictive variables: P<0.05. Abbreviations: HR, hazard ratio; CI, confidence interval; LVI, lymphovascular invasion; PNI, perineural invasion; TI, tumor invasion; LNM, lymph node metastasis; TNM, tumor-node-metastasis; CA19-9, carbohydrate antigen 19-9; CEA, carcinoembryonic antigen; CD68, cluster of differentiation 68; CD163, cluster of differentiation 163; TC, tumor center; TF, tumor invasive front.
Multivariate analyses of clinicopathologic parameters associated with recurrence-free survival and overall survival
| Parameters | Recurrence-free survival | Overall survival | |||||
|---|---|---|---|---|---|---|---|
| HR | 95% CI | P value | HR | 95% CI | P value | ||
| Tumor grade (poor vs. moderate vs. well) | 0.869 | 0.572-1.321 | 0.510 | 0.754 | 0.451-1.261 | 0.281 | |
| LVI (absence vs. presence) | 1.758 | 0.914-3.382 | 0.091 | 1.464 | 0.676-3.169 | 0.334 | |
| PNI (absence vs. presence) | 2.623 | 1.331-5.170 | 0.005* | - | - | - | |
| TI (T1-2 vs. T3-4) | 1.793 | 0.945-3.403 | 0.074 | 1.993 | 0.901-4.408 | 0.089 | |
| LNM (N0-1 vs. N2-3) | 1.708 | 0.981-2.974 | 0.058 | 1.566 | 0.818-2.998 | 0.175 | |
| TNM stagea (I-II vs. III) | 0.526 | 0.175-1.578 | 0.252 | 0.639 | 0.161-2.539 | 0.525 | |
| CD163+/CD68+TF (low vs. high) | 3.476 | 1.698-7.117 | 0.001* | 2.545 | 1.061-6.105 | 0.036* | |
Notes: aThe 7th edition of the AJCC Cancer Staging Manual; *Significant predictive variables: P<0.05. Abbreviations: HR, hazard ratio; CI, confidence interval; LVI, lymphovascular invasion; PNI, perineural invasion; TI, tumor invasion; LNM, lymph node metastasis; TNM, tumor-node-metastasis; CD68, cluster of differentiation 68; CD163, cluster of differentiation 163; TF, tumor invasive front.
In the previous work, we have explored the prognostic value of CD68+TF and CD163+TF in CRC, and the results showed that CD163+TF was more prognostic than CD68+TF (unpublished data). In the present study, we further compared the prognostic predictive value of CD68+TF, CD163+TF and CD163+ /CD68+TF in CRC by the ROC curve analysis (Figure 4E). The results showed that CD68+TF was the weakest risk factor (AUC=0.664, 95%CI=0.543-0.785, P<0.01), whereas CD163+/CD68+TF (AUC=0.859, 95%CI=0.780-0.938, P<0.001) was better to predict the clinical outcomes of CRC patients compared to CD163+TF (AUC=0.723, 95%CI=0.611-0.835, P<0.001).
M2 macrophages promote the EMT, migration, and invasion of colorectal cancer cells
To assess the above results from human colon cancer tissue and address how M2 macrophages affects tumor outcomes, we utilized an in vitro model of M2 macrophages. As a model for studying these processes, we differentiated human monocyte THP-1 cells into M1- and M2-like TAMs [22, 23]. We compared the expression of key EMT-related markers in HCT116 and HT29 cells co-cultured with M1 or M2 macrophages using the in vitro indirect coculture system. We found that HCT116 and HT29 cells cultivated with M2 macrophages expressed reduced levels of E-cadherin, the epithelial marker, but increased levels of vimentin, the mesenchymal marker (Figure 5A). To confirm these findings at the mRNA level, EMT-related markers with RT-PCR assays were conducted on HCT116 and HT29 cells co-cultured with M2 macrophages and similar results were also observed (Figure 5B).
M2 macrophages promote CRC cell EMT program, proliferation, migration and invasion in vitro. A-B. Differences in the expression of epithelial and mesenchymal markers were compared between CRC cells cultivated with M1 or M2 macrophages using western blot and assay, respectively. C. Effects of co-culture with M1 or M2 macrophages on clonogenic ability of CRC cells was measured by colony formation assay. D. Effects of co-culture with M1 or M2 macrophages on migration ability of CRC cells was measured by wound healing assay. E. Effects of co-culture with M1 or M2 macrophages on invasion ability of CRC cells was measured by Transwell assay. F. RT-PCR for analyzing the mRNA expression of cytokines in M2 macrophages or M1 macrophages. G. ELISA assay of TGF-β protein secretion from M2 macrophages or M1 macrophages. H, I and J. HCT116 cells were cocultured with M2 macrophages with or without anti-TGF-β antibody. Then, colony formation, wound healing and Transwell assay were used to analyze proliferation, migration, and invasion of colorectal cancer cells. Note: ***represents P<0.001. Abbreviation: CRC, colorectal cancer; EMT, epithelial-mesenchymal transition.
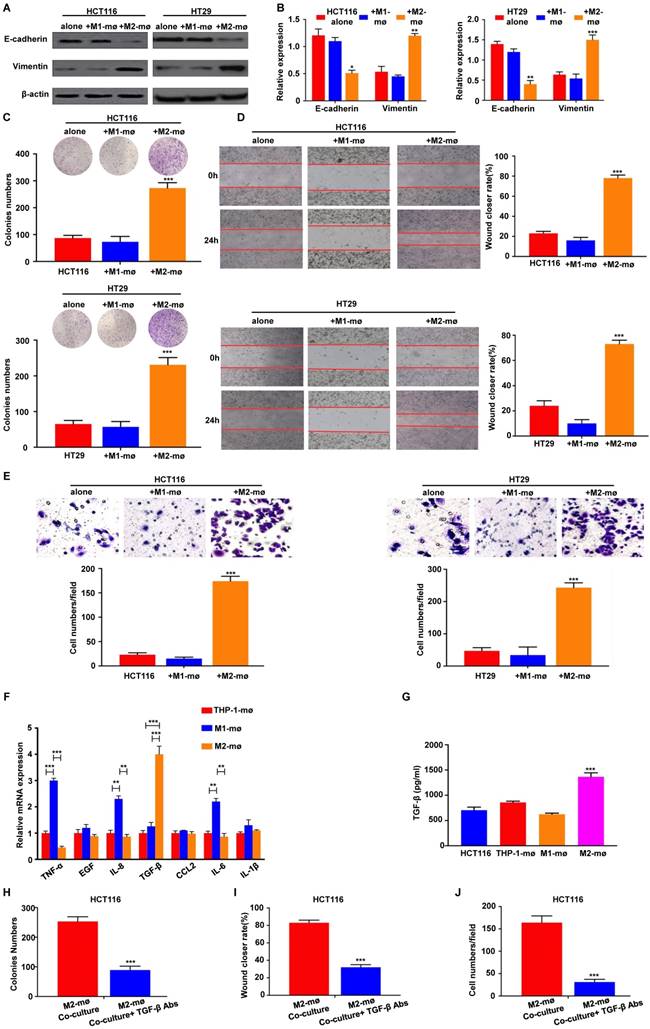
We next studied the role of M2 macrophages in the proliferation, migration, and invasion of CRC cells. After 48h of M2 macrophages co-culture, HCT116 and HT29 cells were subjected to clonogenic assay. As shown in Figure 5C, M2 macrophages co-culture significantly increased the clonogenic survivals compared with controls. To evaluate the role of M2 macrophages on the migration in HCT116 and HT29 cells, a wound-healing assay was performed and the results revealed that M2 macrophages enhanced migration in the HCT116 and HT29 cells to a significantly greater degree than in the controls (Figure 5D). Similarly, to determine whether M2 macrophages enhanced the invasion of colorectal cancer cells, we examined the invasive ability of HCT116 and HT29 in the presence or absence of M2 macrophages. We found that M2 macrophages greatly promoted the invasion of HCT116 and HT29 through the Matrigel-coated membrane (Figure 5E).
Previous studies have demonstrated that cytokine secretion represents the major functional response of macrophages, it was speculated that a signaling mechanism between M2 macrophages and CRC cells exists that accounts for the previously described tumor progression. We then applied RT-PCR-based cytokine array analysis to globally identify inflammatory mediators, and found that the most abundant chemokine was TGF-β in M2 macrophages compared with control (Figure 5F). ELISA further showed that TGF-β levels were significantly increased in the media from M2 macrophages compared with control (Figure 5G). Furthermore, an TGF-β neutralizing antibody was used to confirm M2 macrophages-induced progression of CRC through TGF-β. Treatment of TGF-β neutralizing antibody significantly inhibited the colony formation ability of HCT116 cells co-cultured with M2 macrophages (Figure 5H). Consistently, the depletion of TGF-β decreased migratory (Figure 5I) and invasive capacities (Figure 5J) of HCT116 cells in vitro. These results demonstrate that M2 macrophages-derived TGF-β is one of the major cytokines that may mediate the interplay between M2 macrophages and CRC cells.
M2 macrophages enhanced colorectal cancer cell growth in vivo
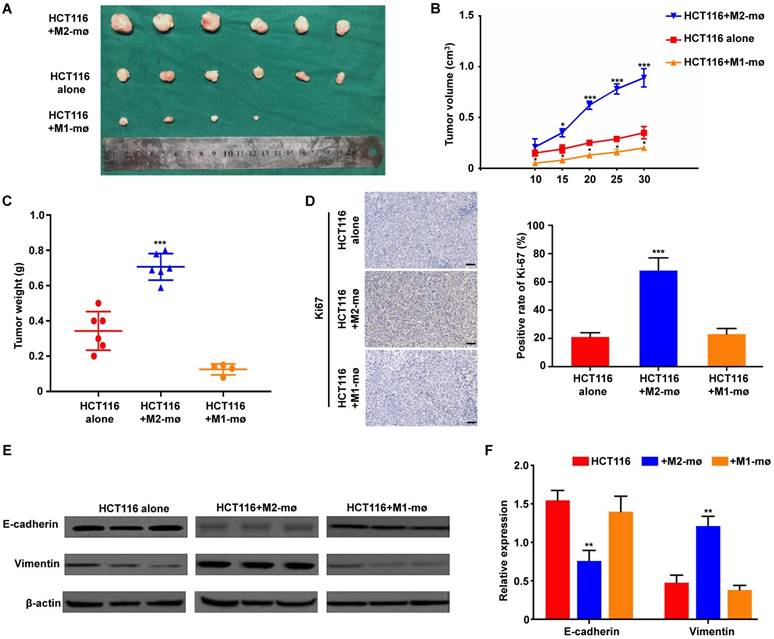
We used an in vivo animal model to examine the role of M2 macrophages in colorectal cancer. HCT116 cells alone, HCT116 mixed with M1 macrophages or HCT116 mixed with M2 macrophages were injected into the flanks of female nude mice. The morphological characteristics of tumor xenograft were presented in Figure 6A. And further analyses showed that the volumes and weights of tumor produced by co-injection of HCT116 cells and M2 macrophages group were significantly larger and heavier than those produced by HCT116 cells alone or HCT116 mixed with M1 macrophages, respectively (Figure 6B and 6C). To determine if co-implantation of tumor cells plus M2 macrophages enhanced tumor growth by promoting tumor cell proliferation in vivo, we performed IHC staining of Ki-67, a proliferative cell marker. Ki-67 staining was increased in tumors derived from implantation of tumor cells plus M2 macrophages compared with tumors derived from implantation of tumor cells alone or mixed with M1 macrophages (Figure 6D). Furthermore, western blot analysis of protein extracted from the tumor tissues confirmed the in vitro results that M2 macrophages could enhance EMT-related protein Vimentin expression and decrease E-cadherin expression (Figure 6E). Moreover, the in vivo RT-PCR data also confirmed the similar results (Figure 6F). Together, the above results indicated that M2 macrophages are involved in the tumorigenesis of CRC.
M2 macrophages promote CRC cell growth, proliferation and EMT program in vivo. A. The morphological characteristics of tumor xenograft in the HCT116+M2 macrophages and HCT116 alone groups. B. The differences of tumor volumes between the HCT116+M1 macrophages, HCT116+M2 macrophages and HCT116 alone groups. C. The differences of tumor weights between the HCT116+M1 macrophages, HCT116+M2 macrophages and HCT116 alone groups. D. The differences of Ki67 expression in tumor xenograft between the HCT116+M1 macrophages, HCT116+M2 macrophages and HCT116 alone groups. E-F. The differences of epithelial and mesenchymal markers expression were compared between the tumors produced by CRC cells cultivated with M1 or M2 macrophages and CRC cells alone using western blot and assay, respectively. Note: ***represents P<0.001. Abbreviation: CRC, colorectal cancer; EMT, epithelial-mesenchymal transition.
Discussion
Macrophages are versatile cells that respond to TME signals with diverse functional programs [24]. Several reasons may underlie these discrepant effects of the TAM subtypes on the biologic regulation of CRC. First, different markers were used to identify TAMs in CRC. Previous studies have shown that the CD68+ macrophage infiltration at TF was positively correlated with a favorable outcome in CRC [25]. However, CD68 has been widely recommended as a pan-macrophage marker including both M1 and M2 macrophages, making this protein unspecific to the M2 macrophages correlated with tumor growth [26]. Based on these previous reports, the different TAM subtypes were detected by IHC with two macrophage markers: CD68 for general TAMs without distinguishing M1 and M2, and CD163 for M2 macrophage identification. Second, macrophages are distributed in the different microanatomical locations of CRC tissues, such as TC and TF, and TAMs in different locations could involve variations in the balance between M1 and M2 phenotypes with different biological and prognostic properties [27, 28]. For the interpretation of our data, it kept in mind that we not only investigated the total number of TAMs but also counted areas in the different locations that were infiltrated by macrophages to assess M2-polarized TAMs.
Clinical data indicated that the initial macrophages entering the tumor site were defined as TAMs, and M2 preferential polarization could be induced by absence of M1-directing signals such as lipopolysaccharides (LPS), as well as by presence of M2-stimuli depending on certain environment signals [29]. As for M2 macrophages, multiple surface markers are utilized, including CD163, CD204 and CD206 [22, 30]. Among these, the mechanistic role of CD163 in macrophage M2 polarization is best understood. Cellular expression of CD163 is restricted to monocytes and macrophages, and CD163 is known to be involved in the activation of TLR2 or TLR5 in combination with TLR4, which plays a role in M2 polarization [31, 32]. Ding et al. showed that CD163+ M2 macrophages expression in CRC tissues was related to the degree of lymphatic metastasis and shorter survival time [33]. In contrast, Edin et al. demonstrated that a concomitant increase in M1(NOS2+) and M2(CD163+) TAM densities at the TF of CRC predicts a positive outcome [27]. Algars et al. reported similar results, showing that infiltration of CD163+ M2 macrophages was correlated to a significantly improved survival in CRC [28]. We therefore considered that these conflicting conclusions could be the result of M2 macrophages heterogeneity, given that the way to evaluate the prognosis of M2-polarized TAMs is lack of variety. Our study was designed to set up a reliable ratio of CD163+/CD68+ to assess M2-polarized TAMs infiltration in CRC and to evaluate their clinical significance. With regard to the long-term prognostic value of TAMs in CRC patients, there have been three major immune-microenvironment theories: the total TAM density (CD68) theory [25], the M1-dominant (NOS2) theory [27], and the M2-dominant (CD206 or CD163) theory [22, 34]. A number of early studies indicated that a high density of CD68+ TAMs correlates with anti-tumor immune responses and better CRC patient survival, regardless of the TAM phenotypes [25, 35]. However, in recent years, increasing evidence indicates a conflict effect of TAMs on patient prognosis. Our current study analyzed the prognostic value of TAM density based on three TAM-related parameters, namely, the densities of the overall CD68+ macrophages, CD163+ M2 macrophage, and CD163+/CD68+ ratio to expand the scope of the assessment of M2-polarized TAM. Moreover, the anti- or pro-tumor effects of the macrophage population varies according to different TME in distinct microanatomical locations. Forssell et al. demonstrated that CD68+ macrophages infiltration along the TF was associated with better prognosis of CRC [25]. In contrast, Kang et al. found that intraepithelial CD68+ macrophage infiltrations were associated inversely with the prognosis of CRC patients [36]. In this study, we observed the prognostic value of above three TAM-related parameters in TC and TF, and found that the CD163+/CD68+TF ratio was significantly higher than CD163+/CD68+TC ratio.
It was previously reported that M2-polarized TAMs are closely associated with advanced stage, LNM, moderate or poor tumor differentiation, and LVI in CRC patients [5]. However, few previous reports have focused correlation of the ratio of M2-polarized TAMs with clinicopathological parameters solely on different microanatomical localizations. After clarifying optimal cut-off values for CD163+/ CD68+ ratio in TC and TF, we demonstrated that high ratio of CD163+/CD68+TF were significantly associated with LVI, TI and TNM stage. In contrast, only LVI was found to be correlated with the high ratio of CD163+/ CD68+TC. These results revealed that the clinicopathological implications of M2-polarized TAMs differed depending on their infiltration sites. Both univariate and multivariate survival analyses showed that high ratio of CD163+/CD68+ in TF but not TC were significantly associated with a shorter RFS and OS in CRC. These results clearly showed that TF is the most suitable microanatomical area for the evaluation of M2-polarized TAMs in the setting of prognostic prediction of CRC. Furthermore, CD163+/CD68+TF were better to predict the clinical outcomes of CRC patients compared to CD163+TF and CD68+TF through ROC curve analysis. Collectively, these results showed that CD163+/CD68+TF is the preferable marker for the prognostic prediction of CRC.
EMT are dynamical transformations programs that epithelial cells gain more mesenchymal traits, facilitating cancer cells to invasion and metastasis with high-grade motility, stem cell proprieties and resistance to apoptosis [16]. Recently, growing evidences in vitro have suggested TAMs and EMT are related, that TAMs could both initiate EMT programs and induce immune suppressive conditions in CRC [11]. To investigate whether the TAMs are involved in EMT, we detected the expression of E-cadherin and Vimentin in CRC patient samples. Our results showed that high level of CD163+/CD68+ ratio were positively correlated with Vimentin, and reversely correlated with E-cadherin in TF, rather than in TC. Such novel results were in accordance with previous studies [37, 38], which comprehensively demonstrated that CD163 expressing TAMs might establish an aggressive TME and could regulate tumor cells an EMT shift to increase metastatic ability. Furthermore, the EMT programs in primary tumor site exhibits comparatively high numbers of CTCs in PB, as the key process of tumor metastasis. In our study, we also found that an increased level of CD163+/CD68+ ratio in TC was correlated to a significantly high CTCs counts. However, no relevance was existed between CTCs counts and CD163+/CD68+TC ratio. Possible explanations for the beneficial effect of CD163+/ CD68+TF ratio on the two metastasis-related factors (EMT and CTCs), could be either that the M2 macrophage phenotype is more prominent at CRC invasive front or that the M2 phenotypes at TF is a more hazardous factor for tumor progression. This is the first study, to our knowledge, where assessments of M2-polarized TAMs are used in purpose to compare the sublocalization of different M2 macrophage and their relation to CTCs in CRC. Moreover, as illustrated by our in vitro co-culture experiments and in vivo animal model, pro-tumorigenic properties could be unmasked. In these experiments, tumor cell migration, invasion and growth accompanied by EMT phenotype, was instead stimulated by the presence of M2 macrophages. Vinnakota et al. have reported similar results and have shown that M2 macrophages induces invasion via matrix metalloproteinases in the colon cancer cell line SW480 [11]. Liu et al. obtained similar observations in pancreatic cancer, and they speculated that M2-polarized TAMs might exert the same effect partially through TLR4/IL-10 signaling pathway [39].
There are several limitations to the study. First, the markers used are not very specific. There are many markers for evaluating M2 macrophages. Although we have investigated the polarization state of M2 macrophages from various perspectives. CD163 as a M2-polarized marker cannot cover all M2 macrophage subtypes. Second, the sample size was relative small, which partly affected the persuasiveness of the results of this study. In the future, more studies on larger sample sizes and TAMs by labeling other M2 macrophage markers such as CD206, CD204 and ARG1 are needed to more comprehensively evaluate the clinical value of M2 polarization statement in CRC.
In conclusion, CD163+/CD68+ ratio at invasive front is associated with poor prognosis and various clinicopathologic variables of CRC. The pro-metastatic factors of EMT and CTCs, and CD163+/CD68+ ratio at invasive front is interrelated. Therefore, the CD163+/CD68+ ratio at invasive front is an ideal prognostic marker for CRC treatment. Furthermore, our findings suggest that M2-polarized TAMs secrete TGF-β to induce EMT and the progression of CRC cells. Further studies are warranted to explore the specific molecular mechanisms of the crosstalk between M2-polarized TAMs and EMT in CRC.
Supplementary Material
Supplementary figure S1.
Abbreviations
CRC, colorectal cancer; TAMs, tumor-associated macrophages; EMT, epithelial-mesenchymal transition; TC, tumor center; TF, tumor invasive front; TME, tumor microenvironment; TNM, tumor-node-metastasis; PB, peripheral blood; CD68, cluster of differentiation 68; CD163, cluster of differentiation 163; LVI, lymphovascular invasion; PNI, perineural invasion; TI, tumor invasion; LNM, lymph node metastasis; ROC, receiver operating characteristic; AUC, area under curve; RFS, recurrence-free survival; OS, overall survival; HR, hazard ratio; CI, confidence interval.
Acknowledgements
This work was supported in part by grants from Zhongnan Hospital of Wuhan University, Technology and Innovation Seed Found (No. znpy2016058). The authors also appreciate Wuhan YZY Medical Science and Technology Co., Ltd. for providing equipment and excellent technical support in CTCs detection.
Competing Interests
The authors have declared that no competing interest exists.
References
1. Siegel RL, Miller KD, Jemal A. Cancer statistics, 2015. CA: a cancer journal for clinicians. 2015;65:5-29
2. Carlomagno C, De Stefano A, Rosanova M, De Falco S, Attademo L, Fiore G. et al. Multiple treatment lines and prognosis in metastatic colorectal cancer patients. Cancer and Metastasis Reviews. 2018:1-7
3. Becker LM, LeBleu VS. Endoglin targeting in colorectal tumor microenvironment. Clinical Cancer Research. 2018: clincanres. 2023:18
4. Puppa G, Sonzogni A, Colombari R, Pelosi G. TNM staging system of colorectal carcinoma: a critical appraisal of challenging issues. Archives of pathology & laboratory medicine. 2010;134:837-52
5. Erreni M, Mantovani A, Allavena P. Tumor-associated macrophages (TAM) and inflammation in colorectal cancer. Cancer microenvironment. 2011;4:141-54
6. Wang N, Liang H, Zen K. Molecular mechanisms that influence the macrophage M1-M2 polarization balance. Frontiers in immunology. 2014;5:614
7. Mills C. M1 and M2 macrophages: oracles of health and disease. Critical Reviews™ in Immunology. 2012:32
8. Yang M, Li Z, Ren M, Li S, Zhang L, Zhang X. et al. Stromal Infiltration of Tumor-Associated Macrophages Conferring Poor Prognosis of Patients with Basal-Like Breast Carcinoma. Journal of Cancer. 2018;9:2308-16
9. Yang Y, Ye Y-C, Chen Y, Zhao J-L, Gao C-C, Han H. et al. Crosstalk between hepatic tumor cells and macrophages via Wnt/β-catenin signaling promotes M2-like macrophage polarization and reinforces tumor malignant behaviors. Cell death & disease. 2018;9:793
10. Martínez VG, Rubio C, Martínez-Fernández M, Segovia C, López-Calderón F, Garín M. et al. BMP4 induces M2 macrophage polarization and favors tumor progression in bladder cancer. Clinical Cancer Research. 2017 clincanres. 1004.2017
11. Vinnakota K, Zhang Y, Selvanesan BC, Topi G, Salim T, Sand-Dejmek J. et al. M2-like macrophages induce colon cancer cell invasion via matrix metalloproteinases. Journal of cellular physiology. 2017;232:3468-80
12. Tan X, Zhang Z, Yao H, Shen L. Tim-4 promotes the growth of colorectal cancer by activating angiogenesis and recruiting tumor-associated macrophages via the PI3K/AKT/mTOR signaling pathway. Cancer letters. 2018
13. Li S, Xu F, Zhang J, Wang L, Zheng Y, Wu X. et al. Tumor-associated macrophages remodeling EMT and predicting survival in colorectal carcinoma. Oncoimmunology. 2018;7:e1380765
14. Lewis CE, Pollard JW. Distinct role of macrophages in different tumor microenvironments. Cancer research. 2006;66:605-12
15. Chaffer CL, Weinberg RA. A perspective on cancer cell metastasis. Science. 2011;331:1559-64
16. Nieto MA, Huang RY, Jackson RA, Thiery JP. EMT: 2016. Cell. 2016;166:21-45
17. Plaks V, Koopman CD, Werb Z. Circulating tumor cells. Science. 2013;341:1186-8
18. Song W, Mazzieri R, Yang T, Gobe GC. Translational Significance for Tumor Metastasis of Tumor-Associated Macrophages and epithelial-Mesenchymal Transition. Frontiers in Immunology. 2017;8:1106
19. Yeung OW, Lo C-M, Ling C-C, Qi X, Geng W, Li C-X. et al. Alternatively activated (M2) macrophages promote tumour growth and invasiveness in hepatocellular carcinoma. Journal of hepatology. 2015;62:607-16
20. Chen F, Wang S, Fang Y, Zheng L, Zhi X, Cheng B. et al. Feasibility of a novel one-stop ISET device to capture CTCs and its clinical application. Oncotarget. 2017;8:3029
21. Tjiu J-W, Chen J-S, Shun C-T, Lin S-J, Liao Y-H, Chu C-Y. et al. Tumor-associated macrophage-induced invasion and angiogenesis of human basal cell carcinoma cells by cyclooxygenase-2 induction. Journal of Investigative Dermatology. 2009;129:1016-25
22. Zhang Y, Sime W, Juhas M, Sjölander A. Crosstalk between colon cancer cells and macrophages via inflammatory mediators and CD47 promotes tumour cell migration. European Journal of Cancer. 2013;49:3320-34
23. Kaler P, Augenlicht L, Klampfer L. Macrophage-derived IL-1β stimulates Wnt signaling and growth of colon cancer cells: a crosstalk interrupted by vitamin D 3. Oncogene. 2009;28:3892
24. Qian B-Z, Pollard JW. Macrophage diversity enhances tumor progression and metastasis. Cell. 2010;141:39-51
25. Forssell J, Öberg Å, Henriksson ML, Stenling R, Jung A, Palmqvist R. High Macrophage Infiltration along the Tumor Front Correlates with Improved Survival in Colon Cancer. Clinical Cancer Research. 2007;13:1472-9
26. Shabo I, Svanvik J. Expression of macrophage antigens by tumor cells. Cell Fusion in Health and Disease: Springer. 2011 p. 141-50
27. Edin S, Wikberg ML, Dahlin AM, Rutegård J, Öberg Å, Oldenborg P-A. et al. The distribution of macrophages with a M1 or M2 phenotype in relation to prognosis and the molecular characteristics of colorectal cancer. PloS one. 2012;7:e47045
28. Nagorsen D, Voigt S, Berg E, Stein H, Thiel E, Loddenkemper C. Tumor-infiltrating macrophages and dendritic cells in human colorectal cancer: relation to local regulatory T cells, systemic T-cell response against tumor-associated antigens and survival. Journal of translational medicine. 2007;5:62
29. Murray PJ, Allen JE, Biswas SK, Fisher EA, Gilroy DW, Goerdt S. et al. Macrophage activation and polarization: nomenclature and experimental guidelines. Immunity. 2014;41:14-20
30. Hou YC, Chao YJ, Tung HL, Wang HC, Shan YS. Coexpression of CD44-positive/CD133-positive cancer stem cells and CD204-positive tumor-associated macrophages is a predictor of survival in pancreatic ductal adenocarcinoma. Cancer. 2014;120:2766-77
31. Law SA, Micklem KJ, Shaw JM, Zhang XP, Dong Y, Willis AC. et al. A new macrophage differentiation antigen which is a member of the scavenger receptor superfamily. European journal of immunology. 1993;23:2320-5
32. Møller HJ, Peterslund NA, Graversen JH, Moestrup SK. Identification of the hemoglobin scavenger receptor/CD163 as a natural soluble protein in plasma. Blood. 2002;99:378-80
33. Ding D, Yao Y, Yang C, Zhang S. Identification of mannose receptor and CD163 as novel biomarkers for colorectal cancer. Cancer Biomarkers. 2018:1-12
34. Koelzer VH, Canonica K, Dawson H, Sokol L, Karamitopoulou-Diamantis E, Lugli A. et al. Phenotyping of tumor-associated macrophages in colorectal cancer: Impact on single cell invasion (tumor budding) and clinicopathological outcome. Oncoimmunology. 2016;5:e1106677
35. Ong SM, Tan YC, Beretta O, Jiang D, Yeap WH, Tai JJ. et al. Macrophages in human colorectal cancer are pro-inflammatory and prime T cells towards an anti-tumour type-1 inflammatory response. European journal of immunology. 2012;42:89-100
36. Kim Y, Wen X, Bae JM, Kim JH, Cho NY, Kang GH. The Distribution of Intratumoral Macrophages Correlates with Molecular Phenotypes and Impacts Prognosis in Colorectal Carcinoma. Histopathology. 2018
37. Yang M, Ma B, Shao H, Clark AM, Wells A. Macrophage phenotypic subtypes diametrically regulate epithelial-mesenchymal plasticity in breast cancer cells. BMC cancer. 2016;16:419
38. Penny HL, Sieow JL, Adriani G, Yeap WH, See Chi Ee P, San Luis B. et al. Warburg metabolism in tumor-conditioned macrophages promotes metastasis in human pancreatic ductal adenocarcinoma. Oncoimmunology. 2016;5:e1191731
39. Liu C-Y, Xu J-Y, Shi X-Y, Huang W, Ruan T-Y, Xie P. et al. M2-polarized tumor-associated macrophages promoted epithelial-mesenchymal transition in pancreatic cancer cells, partially through TLR4/IL-10 signaling pathway. Laboratory investigation. 2013;93:844
Author contact
![]() Corresponding author: Bin Xiong, MD. Email: binxiong1961edu.cn, Tel.:+862767813152
Corresponding author: Bin Xiong, MD. Email: binxiong1961edu.cn, Tel.:+862767813152