Impact Factor ISSN: 1449-2288
- Issue 9; 2026
- Issue 8; 2026
- Issue 7; 2026
- Issue 6; 2026
- Issue 5; 2026
- Volume 22; 2026
- Past Issues
- Advance Articles
- Editorial Board
- Cover Images
- Index & Coverage
- Cover Suggestion
- Special Issues
Introduction
Materials and methods
Results
Discussion
Conclusion
Abbreviations
Supplementary Material
Acknowledgements
References

 Global reach, higher impact
Int J Biol Sci 2019; 15(5):1030-1041. doi:10.7150/ijbs.31009 This issue Cite
Research Paper
FOXA1 is Prognostic of Triple Negative Breast Cancers by Transcriptionally Suppressing SOD2 and IL6
Xiaofeng Dai2 ![]() , Hongye Cheng1, Xiao Chen1, Ting Li1, Jia Zhang2,3, Guoyin Jin2,3, Dongyan Cai2,3, Zhaohui Huang2,3
, Hongye Cheng1, Xiao Chen1, Ting Li1, Jia Zhang2,3, Guoyin Jin2,3, Dongyan Cai2,3, Zhaohui Huang2,3 ![]()
1. School of Biotechnology, Jiangnan University, Wuxi, China
2. Wuxi School of Medicine, Jiangnan University, Wuxi, China
3. Wuxi Cancer Institute, Affiliated Hospital of Jiangnan University, Wuxi, China
Received 2018-10-27; Accepted 2019-2-8; Published 2019-4-21
Abstract

Having markers feasible for breast cancer subtyping, especially for triple negative breast cancer identification is crucial for improving the treatment outcome of such cancers. Here we explore the role of FOXA1 in characterizing triple negative breast cancers and the driving mechanisms. Through in vitro examination of the expression pattern at both transcriptional and translational levels, patient relapse-free survival analysis, immunohistochemistry staining and prediction power assessment using clinical samples, as well as functional studies, we systematically compared the role of FOXA1 in identifying triple negative and luminal type of breast cancers and explored the mechanisms driving such functionalities. We report that FOXA1 under-expression can lead to increased malignancy and cancer stemness, and is a subtyping marker identifying triple negative breast cancers rather than the luminal subtype by transcriptionally suppressing the expression of SOD2 and IL6. We are the first to systematically address the significance of FOXA1 in triple negative breast cancer identification as a biomarker and elucidate the mechanism at the molecular level, through a sequential bioinformatics analysis and experimental validations both in vitro and in clinics. Our discoveries compliment the current biomarker modalities once verified using larger clinical cohorts and improve the precision on characterizing breast cancer heterogeneity.
Keywords: FOXA1, SOD2, IL6, breast cancer, molecular subtyping, triple negative subtype
Introduction
As the most common cancer in women worldwide [1] , breast cancer is not a single disease. Perou et al. firstly divided breast cancers into four intrinsic subtypes, i.e., luminal, HER2 positive, basal, and normal-like tumors [2]. Sorlie et al. have sub-divided luminal tumors into A and B subtypes [3]. A lot more molecular subtypes have been identified later on, with triple negative breast cancers (TNBCs) being the most heterogeneous and morphologically diverse encompassing at least basal, claudin-low, metaplastic breast cancers and the interferon-rich subtypes [4]. Different molecular subtypes have distinct clinical implications, with TNBC being the most aggressive that still lacks efficient targeted therapies [5]. How to appropriately identify TNBCs and understand the mechanism driving its malignancy is of great importance in improving the diagnosis and therapeutics of TNBCs.
We have previously identified FOXA1 as a potential marker for breast cancer subtyping through a series of bioinformatics analysis[6, 7]. By in vitro screening of FOXA1 and its correlated genes using 10 breast cancer cell lines covering four subtypes at both gene and protein expression levels followed by a series of computational verifications, functional studies and clinical validations, we propose that low FOXA1 expression is associated with TNBCs, and it functions as a transcriptional suppressor of SOD2 and IL6 to contribute to the invasive and stem-like features of TNBCs. By systematically comparing the performance of FOXA1 in characterizing TNBC and luminal tumors, we propose it as a marker highly associated with TNBC, which contradicts with the canonical conception that FOXA1 is representative of ER and associated with luminal type of cancers [8] , and elucidate the driving mechanism in vitro. The outputs of this study enrich the toolbox for the diagnosis and therapeutics of TNBCs.
Materials and methods
Experimental materials and protocols
Breast cancer cell lines
A total of 10 breast cancer cell lines, obtained from American Type Tissue Culture Collection (Manassas, VA, USA), were used in this study (Supplementary Table S1). These cell lines were authenticated through monitoring of cell morphology, and were passaged in our laboratory for fewer than 6 months after receipt or resuscitation.
Quantitative RT-PCR
Total RNA was extracted using RNA simple Total RNA Kit (TIANGEN, China), and complementary DNA (cDNA) was synthesized from total RNA using the PrimeScript PT reagent Kit with gDNA Eraser (TaKaRa, China) following the manufacturer's protocol. The primers designed for each gene are listed in Supplementary Table S2. Real time PCR was conducted on the ABI PRISM 7500 Quantitative PCR system (Life Technologies, USA) using the SYBR Green Real time PCR master mix (QPK-201, Toyobo). Each sample was examined in triplicates. The relative gene expression levels were normalized to GAPDH (internal control) using the 2-△△ Ct method.
Western blot
Cells were lysed with ice-cold RIPA buffer with 0.5 mM Phenylmethanesulphonyl fluoride (PMSF). The protein content was determined according to Bradford's method. After separation using SDS-PAGE gel, proteins were transferred to PVDF membrane and probed with human antibodies against FOXA1 (1:5000, Abcam, UK), SOD2 (1:5000, Abcam), MYC (1:1000, Proteintech, US), HER2 (1:1000, Proteintech), IL6 (1:1000, Proteintech) and GAPDH (1:4000, Proteintech).
Cell proliferation and apoptosis
Cell viability was assessed by a Cell Counting Kit 8 (CCK-8, Japan) according to the manufacturer's protocol. The apoptosis rates were identified using an Annexin V-FITC and PI Apoptosis Detection Kit (BD Biosciences, USA). Cells were detected using the FACS scan flow cytometer, and the data was analyzed using the Flowjo software.
Gene knockdown by siRNA transfection
Breast cancer cells were transfected with human-specific FOXA1, SOD2, IL6 or MYC siRNA, GAPDH siRNA (for optimization), and non-silencing siRNA (negative control siRNA) (Gene Pharma, China) using the siRNA-mate transfection agent (Gene Pharma). In addition, to avoid off-target effects of siRNAs, we used another siRNA sequence for each gene. The sequences of siRNAs for FOXA1, SOD2, and Myc are shown in Supplementary Table S2.
Gene up-regulation by CRISPR editing
FOXA1 was overexpressed using CRISPR/ dCas9 Synergistic Activation Mediator (SAM) system following protocols described previously [9]. Three sgRNAs targeting FOXA1 (sequences in Supplementary Table S2) were concatenated and cloned into one plasmid (Synbio Technologies, China) followed by co-transfection with the dCas9 Synergistic Activation Mediator Lentivector (Applied Biological Materials Inc, Canada) into BT474 using Lipofectamine 2000 (Invitrogen, USA). Positive cells were selected using G418 disulfate salt (300ug/ml) and Puromycin (0. 25ug/ml).
Cell migration detection by transwell
Transfected and non-transfected cells were incubated for 48 hours under normoxic and anaerobic conditions, respectively. Cell medium was added on the lower layer of 24-well culture plate and the chambers were placed in the medium. Cells were collected following pancreatic digestion, re-suspended and added to the chambers (2×10⁵/well). The culture media inside the chambers were discarded after 20 hours, and cells were washed by PBS (phosphate buffered saline). Migrated cells under the chambers were fixed by methanol followed by staining with 0.1% crystal violet solution.
ALDEFLUOR assay and separation of the ALDH positive population by FACS
ALDEFLUOR assays were performed according to the manufacturer's instructions (Stem Cell Technologies, Durham, NC, USA). In brief, 2.5×10⁵ cells were suspended in 500 μL ALDEFLUOR assay buffer containing 5 μL/mL ALDEFLUORTM substrate and incubated for 30 minutes at 37 °C in darkness. As a negative control, cells were stained under identical conditions in the presence of the specific ALDH inhibitor diethylaminobenzaldehyde (DEAB). After 30 minutes, cells were centrifuged, the supernatant was removed and the remaining pellet was suspended in ice-cold ALDEFLUORTM assay buffer and kept on ice. Cells were immediately assayed with FACS Calibur (Becton Dickinson Biosciences, Franklin Lakes, NJ, USA) using DEAB controls as baselines to gate ALDH+ and ALDH- cell populations.
Mammosphere formation assay
Mammosphere formation assays were performed to determine the sphere-forming activity of cancer stem cells (CSCs) as previously described[10]. Briefly, single-cell suspensions prepared from human SKBR3 cells (with or without being supplemented with IL6) were cultured at 2000 to 5000 cells/mL per well in 24-well ultra-low attachment plates (Corning) using serum-free DMEM/F-12 medium supplemented with 20 ng/mL basic FGF, 20 ng/mL EGF, 4 μg/mL insulin, 4 μg/mL heparin, 0.5 μg/mL hydrocortisone, 0.4% BSA and B27 (Invitrogen). Culture medium was replaced every other day with 50% fresh medium. Tumor spheres were counted and photographed after 7 days of culture. Cells forming tumor spheres were harvested and cultured as single clones to examine their ability of forming secondary tumor spheres following the same procedures.
Chromatin immunoprecipitation assay
Chromatin immunoprecipitation (ChIP) assay was performed according to the manufacturer's protocol (Beyotime, China) with slight modifications. Chromatin solutions were sonicated and incubated with a monoclonal goat anti-human FOXA1 antibody (0.02 μg/μL; Abcam) or control IgG overnight at 4℃. DNA-protein cross-links were reversed and chromatin DNA was purified and subjected to PCR analyses (primers are in Supplementary Table S2). After amplification, PCR products were resolved using 3% agarose gel and visualized by ethidium bromide staining.
Luciferase reporter assay
The pGL3 basic plasmids with or without adding the SOD2 and IL6 promoter sequence were co-transfected with the plasmid expressing Renilla luciferase (internal control) to BT474 cells. Thirty-six hours after transfection, cells were harvested and the luciferase activities were measured using a Luciferase Reporter Gene Assay Kit (Beyotime, China).
Clinical sample collection, IHC staining and statistical analysis
A total of 82 human primary breast cancer tissues were collected at Affiliated Hospital of Jiangnan University from years 2008 to 2012 with informed consent (Supplementary Table S3), and this project was approved by the Clinical Research Ethics Committees of Affiliated Hospital of Jiangnan University.
IHC staining was performed on 4 μm sections from formalin fixed paraffin embedded breast cancer tissues using anti-FOXA1 antibody (1:100, Abcam) and anti-SOD2 antibody (1:200, Abcam). FOXA1 nuclear expression was scored based on the staining intensity and the positive percentage of tumor cells as previously reported with some modifications [11]. Detailed evaluation method is described in Supplementary Table S4. For SOD2, IHC staining was observed in the cytoplasm of tumor cells, and a scale of 0 to 3 was used to score relative expression intensity. Chi-square test was conducted to examine the significance of FOXA1 or SOD2 IHC status in differentiating tumors of different subtypes.
Data and statistical analysis
Public dataset
METABRIC, TCGA (level 3), GSE24450 and E-MTAB-181 data were used for statistical analysis (Supplementary Table S5).
Statistical analysis
Gene expression was stratified by breast cancer subtypes to evaluate the subtyping performance of potential markers using clinical samples. Student T test was used to assess the statistical significance of dichotomizing patients into TNBC and non-TNBC cohorts.
KM plotter [12] (http://kmplot.com/analysis/) was used to screen genes with significant association with patient survival (Supplementary Table S6). KM plotter binarizes patients by the median expression of a gene. Five years relapse free survival (RFS) was conducted using 3951 patients (the number of available patients for conducting RFS analysis). The hazard ratio and p value from log rank test were computed for each gene.
Pearson correlation analysis was conducted to evaluate gene correlations, with p values from Pearson's Chi-squared test being used to access the statistical significance.
The receiver operating characteristic (ROC) curve was drawn to access the precision and recall of the performance of a marker as a classifier, where higher area under the curve (AUC, defined as the definite integral of the curve) represents a better marker performance.
The fitness of the markers in modeling TNBC or luminal breast cancers as independent cohorts was evaluated by fitting marker gene expression and clinical subtyping information into a linear model. The adjusted R2 and p values computed from Chi-squared test were used to access the statistical fitness of the model.
Results
FOXA1 identifies triple negative cells and exhibits an opposite expression pattern with SOD2 and IL6 in breast cancer cells
Through conducting Pearson correlation analysis using METABRIC, TCGA, GSE24450 (r>0.5, p<0.05) and Patients' 5-year RFS analysis using KM plotter (which includes 3951 patients), we found 18 genes transcriptionally associated with FOXA1 and being prognostic of patient clinical outcome with statistical significance (Supplementary Table S7). Additionally, IL6 could induce the percentage of breast CSCs and mammosphere formation (Figures 4E, 4F) and is a verified transcriptional target of IL6DBP that is among the candidates [13].
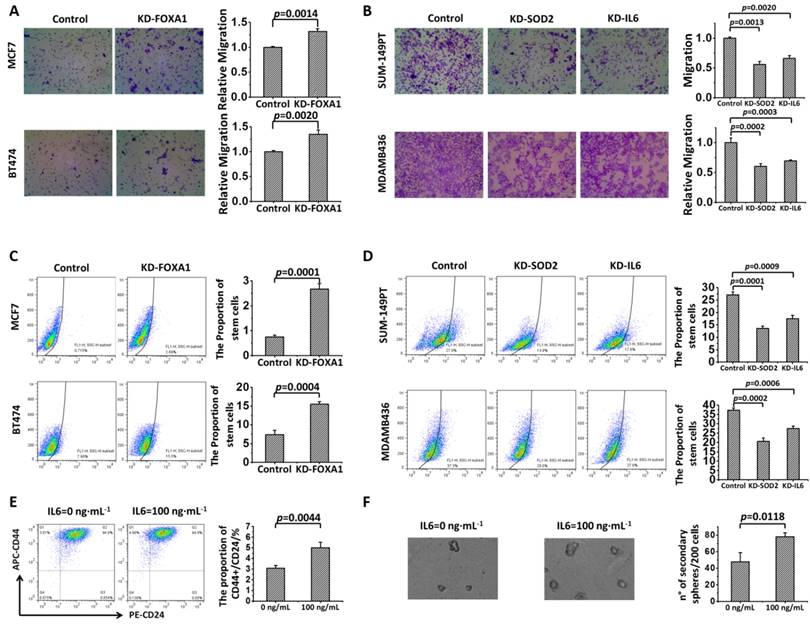
Effects of FOXA1, SOD2 and IL6 on the migration and cell stem-like feature of breast cancer cells. Cell migration is (A) promoted by knocking down FOXA1 and (B) suppressed by knocking down SOD2 or IL6 in MCF7 and BT474 cells. The proportion of cancer stem cells is (C) increased by knocking down FOXA1 and (D) reduced by knocking down SOD2 or IL6 in MCF7 and BT474 cells, and is (E) increased by adding IL6 in SKBR3 cells. (F) The formation of tumorsphere is increased in a dose-dependent manner by supplementing cancer cells with IL6 in SKBR3 cells.
We found that 9 out of the 19 candidates were capable of differentiating breast cancer subtypes with statistical significance at the transcriptional level (Figure 1, Supplementary Figure S1), and three out of them (FOXA1, SOD2, and IL6) could be verified at the protein expression level (Figure 1). Such patterns were also observed at the transcriptional level using E-MTAB-181 data set (Figure 2B, Supplementary Figure S2).
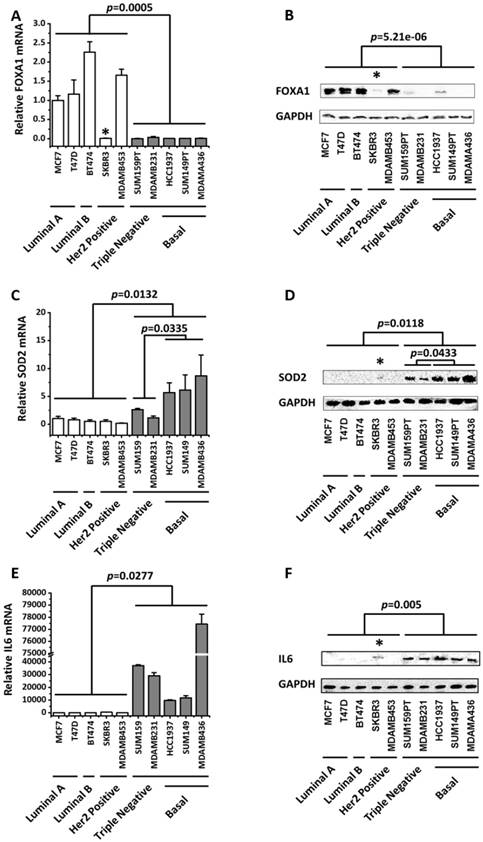
The expression profiles of FOXA1, SOD2 and IL6 across 10 breast cancer cell lines covering 4 subtypes. FOXA1 expression profiles at the (A) transcriptional and (B) translational levels. SOD2 expression profiles at the (C) transcriptional and (D) translational levels. IL6 expression profiles at the (E) transcriptional and (F) translational levels. The p values were computed by excluding SKBR3 in A, B, D, F. The relative expression level of FOXA1, SOD2, IL6 in MCF7 cells were set to 1. SKBR3 cells which harbors a MYC amplification was marked with *.
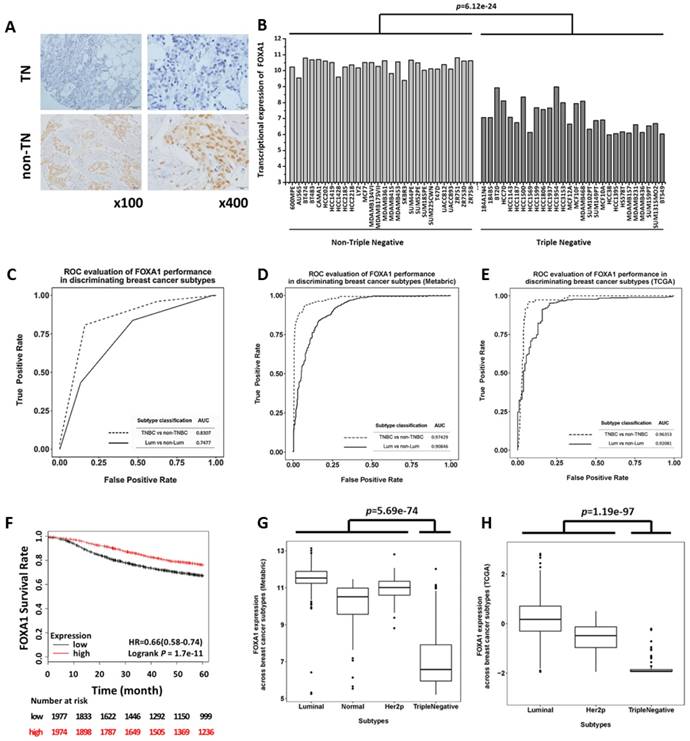
Evaluation of the diagnostic value of FOXA1 in triple negative breast cancer identification using clinical samples and cell line data. (A) IHC staining of FOXA1 in TNBC and non-TNBC breast tumors. (B) Gene expression profile of FOXA1 across 56 breast cancer cell lines using E-MTAB-181 data. (C) Precision and recall curves evaluating the performance of FOXA1 in discriminating TNBCs versus non-TNBCs, and luminal versus non-luminal cancers, using clinical data. Precision and recall curves evaluating the performance of FOXA1 in discriminating TNBCs versus non-TNBCs, and luminal versus non-luminal cancers, using (D) METABRIC data and (E) TCGA data. (F) Kaplan-Meier survival curves evaluating the association of FOXA1 (probe is 204667_at) expression with patient survival in breast cancer patients using KM plotter. FOXA1 mRNA expression stratified by breast cancer subtypes using (G) METABRIC data and (H) TCGA data.
It was interesting that FOXA1 exhibited an opposite pattern with SOD2 and IL6, both of which characterize triple negative cells. That is, while SOD2 (p=0.0132 for mRNA expression, p=0.0118 for protein expression) and IL6 (p=0.0277 for mRNA expression, p=0.005 for protein expression) were over-represented in the triple negative subtype, FOXA1 (p=0.0005 for mRNA expression, p=5.21e-6 for protein expression) was under-expressed in this type of tumor cells (Figure 1).
An exception was observed in SKBR3, a HER2 positive cell line, which exhibited low FOXA1 level and slightly over- expressed SOD2 and IL6 (Figure 1). BRCA1 mutation status did not alter the expression of FOXA1 nor IL6 with statistical significance (Figures 1A, 1B, 1E, 1F, Supplementary Table S1), but further up-regulated SOD2 expression (p=0.0335 for gene expression, p=0.0433 for protein expression as compared with the rest TNBC cells, Figures 1C, 1D).
FOXA1 is a subtyping marker associated with TNBCs rather than luminal tumors using clinical samples
IHC staining of 82 collected breast cancer samples including 29 TNBCs demonstrated that FOXA1 was significantly down-regulated in TNBCs (Figure 2A), and its subtyping potential was substantially higher in distinguishing TNBCs rather than luminal cancers from the other subtypes (p=3.52e-13 versus p=2.22e-03 for identifying TNBCs and luminal cancers, respectively, Table 2). In particular, 82.72% of TNBCs exhibited low FOXA1 expression (below score 2), whereas 68.75% of luminal cancers expressed high levels of FOXA1 (score≥2). The precision and recall of FOXA1 as a subtyping marker was evaluated using AUC, which were 0.8307 and 0.7477, respectively, for discriminating the TNBC and luminal subtypes from the rest breast cancers (Figure 2C). We obtained similar results using public datasets METABRIC (AUC= for 0.9743 TNBC versus AUC= for 0.9085 luminal tumor identification, Figure 2D) and TCGA (AUC=0.9635 for TNBC versus AUC=0.9208 for luminal tumor identification, Figure 2E).
IHC staining results of FOXA1 in 82 breast cancer tissue samples.
| Subtype | N | FOXA1 expression | p value | |
|---|---|---|---|---|
| Score 0-1 | Score 2-3 | |||
| TNBC | 29 | 24 | 5 | 3.52e-13 |
| non-TNBC | 53 | 11 | 47 | |
| Luminal | 32 | 10 | 22 | 2.22e-03 |
| non-Luminal | 50 | 25 | 25 | |
Patients' 5 years RFS analysis from 3951 breast cancer samples deposited in KM plotter suggested that low mRNA expression of FOXA1 was significantly associated with poor patient outcome in clinics (p=1.7e-11, Figure 2F). However, such an association diminished when samples were stratified by molecular subtypes (Supplementary Figure S3), further consolidating our claim that FOXA1 is a molecular marker for categorizing tumors of different subtypes but not for differentiating tumors within the same subtype. However, we could not completely exclude the possibility that the insignificance is caused by the limited number of patients available in certain subtype cohorts.
By grouping 502 breast cancer patients from TCGA into luminal, HER2 positive and triple negative subtypes, we found that the expression of FOXA1 in triple negative cancers was significantly lower than that in the other subtypes (p=1.19e-97, Figure 2H). More significant results were observed using METABRIC data (p=5.69e-74, Figure 2G).
Using METABRIC and TCGA data which have relatively large sample sizes (i.e., METABRIC encompasses 1217 patients and TCGA has 502 samples), we examined the fitness of using FOXA1, alone or in combination with the canonical marker panel (ER and HER2) in modeling TNBC subtype as an independent cohort. FOXA1 had a comparable fitness with the combined marker panel (adjusted R2=0.6844 and p=2.98e-308 for FOXA1, adjusted R2=0.6909 and p=8.38e-311 for combined panel, Table 1) that was considerably higher than using ER and HER2 (adjusted R2=0.5146 and p=8.82e-193, Table 1) from the analysis of the METABRIC data. Similar results were obtained from TCGA data. That is, the adjusted R2 was 0.6023 (p=2.35e-101), 0.5535 (p=4.97e-91), 0.5381 (p=4.99e-86) for the combined panel, FOXA1, and ER-HER2 combination respectively. It was interesting that as FOXA1 outperformed canonical ER-HER2 in discriminating TNBCs, ER-HER2 was better than FOXA1 in capturing the luminal feature of breast cancers. For example, the adjusted R2 were 0.6604 (METABRIC) and 0.6205 (TCGA) using ER-HER2, which became 0.4494 (METABRIC) and 0.4708 (TCGA) using FOXA1. Therefore, while the canonical ER-HER2 classifier mostly captures the properties of luminal cancers, low FOXA1 expression is a potential independent prognostic marker of TNBCs, which can be either integrated into the ER-HER2 panel for improved accuracy in breast cancer subtyping or used to substitute ER-HER2 for TNBC identification with enhanced precision and reduced complexity.
Results showing the fitness of FOXA1, ER-HER2 and their combined panel in modeling triple negative or luminal breast cancers as independent cohorts.
| Variables | Data | TNBC vs. non-TNBC | luminal vs. non-luminal | ||||
|---|---|---|---|---|---|---|---|
| Combined | FOXA1 | ER-HER2 | Combined | FOXA1 | ER-HER2 | ||
| ER, HER2, FOXA1 | FOXA1 | ER, HER2 | ER, HER2, FOXA1 | FOXA1 | ER, HER2 | ||
| Adjusted R2 | METABRIC | 0.6909 | 0.6844 | 0.5149 | 0.6838 | 0.4494 | 0.6604 |
| p (model) | 8.376e-311 | 2.98e-308 | 8.82e-193 | 7.96e-305 | 1.22e-160 | 3.09e-287 | |
| p (ER) | 1.62e-07 | - | 5.59e-178 | 2.50e-99 | - | 4.07e-286 | |
| p (HER2) | 5.17e-03 | - | 3.60e-53 | 6.44e-08 | - | 7.48e-01 | |
| p (FOXA1) | 1.08e-121 | 2.98e-308 | - | 5.56e-21 | 1.22e-160 | - | |
| Adjusted R2 | TCGA | 0.6023 | 0.5535 | 0.5381 | 0.6294 | 0.4708 | 0.6205 |
| p (model) | 2.35e-101 | 4.97e-91 | 4.99e-86 | 4.38e-109 | 2.67e-72 | 1.26e-107 | |
| p (ER) | 1.86e-11 | - | 6.93e-73 | 1.92e-40 | - | 3.43e-106 | |
| p (HER2) | 2.43E-09 | - | 6.95e-23 | 3.14e-02 | - | 4.66e-05 | |
| p (FOXA1) | 2.13E-18 | 4.97e-91 | - | 3.11e-04 | 2.67e-72 | - | |
The results were produced by fitting data (METABRIC and TCGA data) to a linear model. Adjusted R2 and the p values of the model as well as that of each predictor were used to evaluate the fitness of each model.
SOD2 is a weak subtyping marker associated with TNBCs and IL6 does not have diagnostic value using clinical samples
Both METABRIC and TCGA data showed that SOD2 expression can significantly distinguish TNBCs (p=4.25e-52 for METABRIC, p=1.38e-07 for TCGA, Supplementary Figures S4A, 3B), despite the reduced discrimination power as compared with FOXA1. High SOD2 gene expression was significantly prognostic of poor patient outcome in the 5 years RFS analysis using KM plotter (p=5.50e-10, Supplementary Figure S4C). However, only a slightly higher expression of SOD2 was observed in TNBCs as compared with samples of the other subtypes using our 82-patient cohort (Supplementary Figure S4D, Supplementary Table S8), suggesting that SOD2 is a weak subtyping maker associated with TNBCs.
No varied expression of IL6 across cancer subtypes was obtained using neither METABRIC nor TCGA data (Supplementary Figure S4E, 3F). No distinctive effect of IL6 on 5 years' patient RFS from KM plotter (Supplementary Figure S4G) was observed. However, IL6DBP over-expression was associated with poor patients 5 years' RFS (p=8.6e-08, Supplementary Figure S4H). Thereby, while IL6 could distinguish TNBCs in vitro (Figures 1E, 1F) and was transcriptionally regulated by IL6DBP that was associated with patient outcome (Supplementary Figure S4H), its diagnostic value was not visible in clinics given the complex tumor microenvironment and diversified roles of chemokines in living tissues.
FOXA1 inhibits cancer cell proliferation and migration, SOD2 and IL6 play the opposite roles
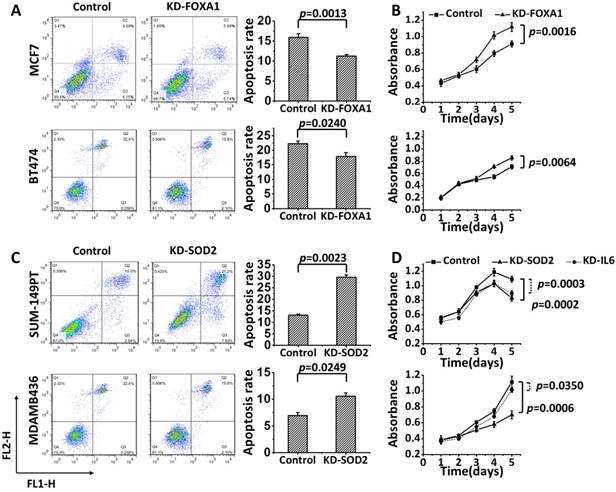
Knocking down FOXA1 decreased apoptosis (Figure 3A: p=0.0013 for MCF7; p=0.0240 for BT474) and accelerated cell proliferation (Figure 3B: p=0.0016 for MCF7, Supplementary Figure S5A; p=0.0064 for BT474, Supplementary Figure S5B). Oppositely, SOD2 knockdown promoted apoptosis (Figure 3C: p=0.0023 for SUM149PT; p=0.025 for MDAMB436) and inhibited cell growth (Figure 3D: p=0.0002 for SUM149PT, Supplementary Figure S5C; p=0.0006 for MDAMB436, Supplementary Figure S5D); and silencing IL6 led to inhibited cell growth (Figure 3D: p=0.0003 for SUM149PT, Supplementary Figure S5E; p=0.0350 for MDAMB436, Supplementary Figure S5F).
The effects of knocking down FOXA1, SOD2 and IL6 separately on the apoptosis and growth of breast cancer cells. Knocking down FOXA1 leads to (A) reduced apoptosis and (B) promoted cell proliferation in MCF7 and BT474 cells. (C) Knocking down SOD2 induces apoptosis in SUM149PT and MDAMB436 cells. (D) Knocking down SOD2 or IL6 inhibits cell proliferation in SUM149PT and MDAMB436 cells.
Enhanced motility (p=0.0014 for MCF7, p=0.0020 for BT474) and increased proportion of stem cells (p=0.0001 for MCF7, p=0.0004 for BT474) were observed in FOXA1-silenced MCF7 and BT474 cells (Figures 4A, 4C). On the contrary, knocking down SOD2 inhibited cell migration (p=0.0013 for SUM149PT, p=0.0002 for MDAMB436) and decreased the amount of CSCs (p=0.0001 for SUM149PT, p=0.0002 for MDAMB436,) in these luminal cells (Figures 4B, 4D). Similar behavior was observed for cells lacking IL6 expression, i.e., cell migration was significantly inhibited (p=0.0020 for SUM149PT, p=0.0003 for MDAMB436) and the percentage of stem cells largely decreases (p=0.0009 for SUM149PT, p=0.0006 for MDAMB436) in IL6-silenced SUM149PT and MDAMB436 cells (Figures 4B, 4D).
FOXA1 is a transcription factor of SOD2 and IL6
Transcription factor (TF) binding site prediction was conducted using JASPAR (http://jaspar.genereg.net/) [14] to investigate whether FOXA1 could regulate SOD2 and IL6 as a TF. FOXA1 was shown to be the most probable TF of SOD2 and IL6 among all TF binding motifs in vertebrates (the top scores of SOD2 and IL6 are 12.195 and 10.2481, respectively).
The ChIP assay performed using BT474 cells (cells expressing high level of FOXA1) revealed that FOXA1 could bind the promoter region of SOD2 and IL6 (Figure 5A)[15]. Silencing FOXA1 (p=4.17e-07) significantly enhanced SOD2 and IL6 expression at both transcriptional (p=9.82e-05 for SOD2, p=0.0059 for IL6, Figure 5B) and translational (Figure 5C) levels; over-expressing FOXA1 using CRISPR method (p=6.27e-05) showed the reverse pattern, both reaching statistical significance at the mRNA (p=4.82e-05 for SOD2, p=0.0013 for IL6, Figure 5B) and protein expression levels (Figure 5C).
FOXA1 is the transcription suppressor of SOD2 and IL6. (A) ChIP assay showing the binding affinity of FOXA1 to the promoter region of SOD2 and IL6 in BT474 cells. BT474 cells were processed for ChIP using anti-FOXA1 antibody. The Input group and anti-IgG group were used as the negative and positive controls, respectively. (B) Detection of SOD2 and IL6 gene expression after silencing FOXA1 in BT474. (C) Western blotting of SOD2 and IL6 protein expression after silencing and over-expressing FOXA1, respectively, in BT474. (D) The luciferase reporter assay showing the physical regulatory relationship between FOXA1 and SOD2 or IL6, where 'P', 'PS', 'PS_D', 'PI', 'PI_D' each represents pGL3 basic plasmids, pGL3 basic plasmids with the SOD2 promoter sequence added, pGL3 basic plasmids with the SOD2 promoter sequence added followed by FOXA1 knockdown, pGL3 basic plasmids supplemented with IL6 promoter sequence, pGL3 basic plasmids supplemented with IL6 promoter sequence followed by FOXA1 silencing, respectively. 'KD-FOXA1' and 'OE-FOXA1' each represents down- and up-regulation of FOXA1. (E) The scheme representing the molecular mechanism of FOXA1-mediated repression of SOD2 and IL-6 expression.
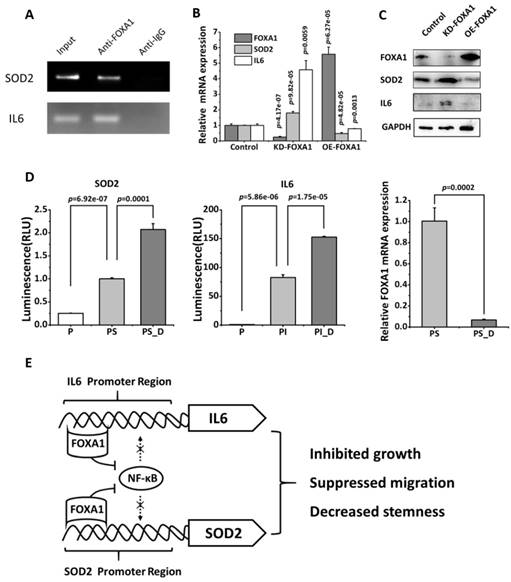
Luciferase reporter assay further validated our claim that FOXA1 physically binds the promoter region of SOD2 and IL6 and suppresses their expression (Figure 5D). That is, by adding the promoter sequences of SOD2 or IL6 to the basic plasmid, the expression of these genes enhanced (p=6.92e-07 and p=5.86e-06, respectively, for SOD2 and IL6, respectively), which were further increased with statistical significance (p=0.0001 for SOD2, p=1.75e-05 for IL6) when FOXA1 was down-regulated (p=0.0002).
We further analyzed the correlations between the expression of FOXA1 and SOD2, FOXA1 and IL6, and SOD2 and IL6 using clinical data from METABRIC, TCGA and GSE24450. The gene expression of FOXA1 showed a negative correlation with SOD2 and IL6 (average correlation coefficient is -0.61 and -0.32 for FOXA1-SOD2 and FOXA1-IL6, respectively), and SOD2 and IL6 were transcriptionally positively correlated using all these public datasets (average correlation coefficient is 0.3, Supplementary Table S9).
The Pearson correlation score between FOXA1 and SOD2 from our 82-sample cohort was -0.4129 (p=1.16E-4), which dropped to -0.3562 (p=1.02E-3) once the data was discretized by score 2. Though some information was lost due to data discretization, this adds further evidence to the negative regulatory relationship between FOXA1 and SOD2.
FOXA1 influences TNBC features by transcriptionally regulating SOD2 and IL6
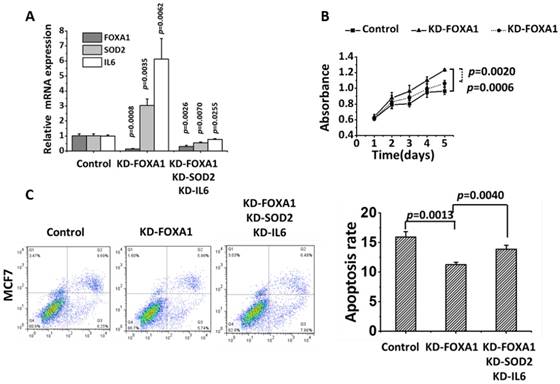
FOXA1, SOD2 and IL6 were effectively knocked down in MCF7 (p=0.0026 for FOXA1, p=0.0070 for SOD2, p=0.0225 for IL6). The proliferation of FOXA1-low cells was significantly reduced (p= 0.0020) and the apoptosis of FOXA1-low cells was significantly increased (p=0.0040) after knocking down SOD2 and IL6 despite the fact that FOXA1 was under-expressed (Figure 6).
Recovery test of knocking down SOD2 and IL6 besides FOXA1 in MCF7 cells. 'KD-FOXA1' means knocking down FOXA1, 'KD-FOXA1 KD-SOD2 KD-IL6' represents knocking down SOD2 and IL6 after knocking down FOXA1. (A) The knocking down efficiency of each gene. (B) Cell proliferation. (C) Apoptosis.
Discussion
FOXA1 is a subtyping marker for TNBC identification
FOXA1 is known indispensable for the expression of 50% of ER-related genes [8, 16] and implicated in various cancers including breast, prostate, lung, thyroid and esophageal squamous cell carcinomas [17]. There is a strikingly high Pearson correlation between ER/FOXA1 and apoptosis- related genes [18], suggesting its tumor suppressive role. However, the functionalities of FOXA1 have largely been associated with that of ER and luminal features, very rare has been reported to associate FOXA1 with TNBCs [19-21]. We found from our in vitro and clinical results (using both public datasets and our collected sample cohort) that FOXA1 significantly outperformed ER-HER2 (canonically applied in clinics for breast cancer subtyping) in TNBC identification and could be used alone to achieve enhanced accuracy and reduced complexity than the conventional diagnostic panel. Alternatively, FOXA1 can significantly enrich information captured by the ER-HER2 panel, which can be jointly applied for breast cancer subtyping with considerably enhanced diagnostic accuracy. These findings are not mutually exclusive from the previous reports that FOXA1 is a luminal differentiation factor [22], but provide a more accurate definition of FOXA1 towards its subtyping functionalities, i.e., excluding HER2 positive breast cancers from non- luminal tumors.
The exceptional observation of low FOXA1 expression in a HER2 positive cell line (SKBR3) that harbors an MYC amplification warrants us that the diagnostic accuracy of FOXA1 may be influenced by MYC mutation. This suggests a combinatorial use of FOXA1 and MYC in the diagnostic practice, i.e., favorable clinical outcome is expected for patients carrying high FOXA1 and low/normal MYC expression but not for cases otherwise.
FOXA1 contributes to TNBC phenotypic features through suppressing SOD2 and IL6
The discovery of FOXA1 as a prognostic marker of TNBCs uncovers its mechanistic functionalities in driving the invasiveness and stem-like features of TNBCs. Through TF predictions followed by ChIP and luciferase reporter assay, we identified FOXA1 as a transcriptional suppressor of SOD2 and IL6. As FOXA1 interferes with the recruitment of NF-κB to the promoter regions of IL6 [15] and SOD2[23], it is possible that FOXA1 suppresses NF-κB signaling by competing with NF-κB for the binding sites of downstream effectors such as IL6 and SOD2, leading to halted tumor migration and reduced cancer cell stemness (Figure 5E).
SOD2 is a known anti-apoptotic factor diluting the detrimental effects of reactive oxygen species (ROS) to cancer cells. Via suppressing SOD2 expression, FOXA1 is likely to function as a safe guard controlling cell life-death switch. This is in accordance with our observation that cells underwent faster proliferation with less apoptosis when FOXA1 was knocked down, and the reverse pattern was observed once SOD2 was silenced (Figure 2). SOD2 expression was over-represented in TNBCs and, in particular, in tumors with concomitant BRCA1 mutation (namely the basal subtype, Figure 1). That is, with enhanced ability of bypassing apoptotic signals (as empowered by SOD2 over-expression) and reduced capacity in repairing DNA damage (as enabled by BRCA1 deficiency[24]), cancer cells undergo accelerated evolutionary alterations that ultimately transit them towards a more malignant state, e.g., being invasive [25].
IL6 encodes a cytokine that is implicated in CSC maintenance and progenitor-enriched mammosphere formation [26-28] (Figures 4E, 4F). Increased stemness could ultimately lead to increased invasiveness of cancer cells. Yang et al. found that the IL6/CXCR2 axis played a critical role in the metastasis of oral squamous cell carcinoma [29], and IL-6 activation promoted cervical tumorigenesis through autocrine and paracrine pathways in tumor microenvironment [30]. Thus, FOXA1 may halt cancer metastatic transition through suppressing IL6 that contributes to the CSC properties of TNBCs.
Even FOXA1 transcriptionally suppresses SOD2 and IL6 expression, and modulating FOXA1 and SOD2/IL6 leads to opposite cell behaviors, we cannot claim that FOXA1 influences TNBC features by transcriptionally regulating SOD2 and IL6. Given that FOXA1 is a known proliferation marker[31], we examined cell proliferation and apoptosis in the recovery test. Concomitantly knocking down SOD2 and IL6 in FOXA1-low MCF7 cells restores cells with the luminal features (Figure 6), suggesting that FOXA1 likely exerts its roles via controlling the expression of SOD2 and IL6, which are the direct executioners regulating the phenotypic switch between triple negative and luminal features.
MYC suppresses FOXA1 expression in HER2 positive cells - Explanation of the exceptional in vitro observation
An exceptionally low FOXA1 expression and slightly increased levels of SOD2 and IL6 were observed in the SKBR3 cell line (Figures 1A, 1B, 1D, 1F) that is HER2 positive and harbors an MYC amplification[32]. This suggests strong signaling interventions among FOXA1, MYC and HER2 that partially interfere with SOD2 and IL6. We hypothesized a triangle negative feedback loop (Supplementary Figure 6A). That is, FOXA1 binds the promoter region of HER2 and elevates its expression, increased level of HER2 leads to decreased MYC expression, and MYC binds the promoter region of FOXA1 and suppresses its transcription, formulating a negative feedback loop. This concords with the report that FOXA1 regulates the transcription of a panel of genes in HER2 signaling, including reversely regulated MYC [33], and that MYC is a downstream effector of HER2 [34]. It is predicted from Jasper (http://jaspar.genereg.net/) [14] that FOXA1 is a potential TF of HER2 (the top binding affinity score is 10.721), and MYC potentially regulates FOXA1 expression (the highest binding affinity score is 14.020).
The results showed that silencing MYC led to increased FOXA1 and HER2 expression (Supplementary Figure 6C), and knocking down FOXA1 repressed HER2 but increased MYC expression (Supplementary Figure 6D) in SKBR3, which has a higher expression of MYC than MDAMB453, another HER2 positive cell line (Supplementary Figure 6B).
The rest genes imply other candidate markers and targets for breast cancer management
The rest genes (Supplementary Figure S1), which are transcriptionally associated with FOXA1 and prognostic of patient clinical outcome with statistical significance, also implicate candidate markers for breast cancer subtyping and worth further exploration.
FBP1 loss is required for cancer cells to acquire the basal-like phenotype [35]. The tumor suppressive role of FBP1 has been reported in various cancers such as non-small-cell lung cancer, a hepatocellular carcinoma, colon cancer, and pancreatic cancer [36-38]. Our results showed that FBP1 could differentiate luminal tumors with a superior performance than ER (p=0.0001 for FBP1, p=0.0021 for ER), suggesting its subtyping potential.
AGR2 and MYO5C were over-expressed in the luminal A subtype with statistical significance (p=0.0286 for AGR2, p=0.0001 for MYO5C). AGR2 is an estrogen-responsive gene that is positively correlated with ER at the transcriptional level [39]. It promoted tumor growth and metastasis [40, 41], and was suggested as a potential drug target or biomarker for various cancers including colorectal [42], gastric [43] and breast cancers [40, 44]. MYO5C functions in the trafficking of integral membrane proteins to melanomas [45]. Our results implicate their tumorigenic roles that worth further investigations.
LRBA and WWP1 were over represented in luminal B cells (p=0.0001 for both LRBA and WWP1). LRBA promoted cancer cell growth and was associated with p53 and Rb mutations [46]. WWP1 was considered an oncogenic factor in prostate [47], breast and oral cancers [47-49]. Further explorations on these genes may uncover the discrepancies between luminal A and luminal B types of breast cancers and the mechanism driving such a differentiation. Also, if confirmed as markers specific to the luminal B type of cancers (provided with more luminal B cell lines and clinical evidence), these may represent novel therapeutic targets besides their subtyping potential.
Conclusion
This study proposes FOXA1 as an independent subtyping marker for TNBCs identification through bioinformatics analysis followed by in vitro and clinical validations. Also, we propose that FOXA1 likely halts the triple negative feature of cancer cells by transcriptionally suppressing SOD2 that helps cells bypass DNA-damage-induced apoptosis and inhibiting IL6 that enables cells with stem-like features and invasive nature. That is, by impeding cells at two critical transitions towards carcinogenesis, i.e., life- death control and metastatic switch, FOXA1 plays a tumor suppressive role and is under-expressed in TNBCs. We are the first to propose FOXA1 as a TNBC identification marker and elucidate the potential mechanism, which are of the guiding significance in the precise control of TNBCs.
Abbreviations
TNBC: triple negative breast cancer; IHC: immunohistochemistry; ER: estrogen receptor; PR: progesterone receptor; HER2: human epidermal growth factor receptor 2; RFS: relapse free survival; ROC: receiver operating characteristic; CSCs: cancer stem cells; AUC: area under the curve; TF: Transcription factor; ROS: reactive oxygen species.
Supplementary Material
Supplementary figures and tables.
Acknowledgements
This work was funded by the National Natural Science Foundation of China (31471251 and 81672328), Natural Science Foundation of Jiangsu Province (BK20161130 and BK20150004), the Six Talent Peaks Project in Jiangsu Province (SWYY-128), National Science and Technology Major project (2018ZX10302205-004-002), Postgraduate Education Reform Project of Jiangsu Province, Research Funds for the Medical School of Jiangnan University ESI special cultivation project (1286010241170320), Medical Key Professionals Program of Jiangsu Province (AF052141), Medical Innovation Team Program of Wuxi (CXTP003), and Hospital Management Centre of Wuxi (YGZXZ1401). The funders had no role in study design, data collection and analysis, decision to publish, or preparation of the manuscript.
Competing Interests
The authors have declared that no competing interest exists.
References
1. Siegel RL, Miller KD, Jemal A. Cancer statistics, 2018. CA Cancer J Clin. 2018;68:7-30
2. Perou CM, Sørlie T, Eisen MB, van de Rijn M, Jeffrey SS, Rees CA. et al. Molecular portraits of human breast tumours. Nature. 2000;406:747-52
3. Sørlie T, Perou CM, Tibshirani R, Aas T, Geisler S, Johnsen H. et al. Gene expression patterns of breast carcinomas distinguish tumor subclasses with clinical implications. Proceedings of the National Academy of Sciences. 2001;98:10869-74
4. Dai X, Xiang L, Li T, Bai Z. Cancer Hallmarks, Biomarkers and Breast Cancer Molecular Subtypes. Journal of Cancer. 2016;7:1281-94
5. Ko JH, Ko EA, Gu W, Lim I, Bang H, Zhou T. Expression profiling of ion channel genes predicts clinical outcome in breast cancer. Molecular cancer. 2013;12:106
6. Dai X, Chen A, Bai Z. Integrative investigation on breast cancer in ER, PR and HER2-defined subgroups using mRNA and miRNA expression profiling. Sci Rep. 2014;4:6566
7. Dai X, Li Y, Bai Z, Tang XQ. Molecular portraits revealing the heterogeneity of breast tumor subtypes defined using immunohistochemistry markers. Sci Rep. 2015;5:14499
8. Habashy HO, Powe DG, Rakha EA, Ball G, Paish C, Gee J. et al. Forkhead-box A1 (FOXA1) expression in breast cancer and its prognostic significance. European journal of cancer. 2008;44:1541-51
9. Joung J, Konermann S, Gootenberg JS, Abudayyeh OO, Platt RJ, Brigham MD. et al. Genome-scale CRISPR-Cas9 knockout and transcriptional activation screening. Nature Protocols. 2017;12:828
10. Kreso A, van Galen P, Pedley NM, Lima-Fernandes E, Frelin C, Davis T. et al. Self-renewal as a therapeutic target in human colorectal cancer. Nat Med. 2014;20:29-36
11. Hosoda M, Yamamoto M, Nakano K, Hatanaka KC, Takakuwa E, Hatanaka Y. et al. Differential expression of progesterone receptor, FOXA1, GATA3, and p53 between pre- and postmenopausal women with estrogen receptor-positive breast cancer. Breast Cancer Res Treat. 2014;144:249-61
12. Györffy B, Lanczky A, Eklund AC, Denkert C, Budczies J, Li Q. et al. An online survival analysis tool to rapidly assess the effect of 22,277 genes on breast cancer prognosis using microarray data of 1,809 patients. Breast cancer research and treatment. 2010;123:725-31
13. Goransson M, Elias EA, Olofsson A, Andersson C, Aman P. Myxoid liposarcoma FUS-DDIT3 fusion oncogene induces C/EBP beta-mediated interleukin 6 expression. International journal of cancer. 2005;115:556
14. Wasserman WW, Sandelin A. Applied bioinformatics for the identification of regulatory elements. Nature Reviews Genetics. 2004;5:276-87
15. Yamaguchi N, Nakayama Y, Yamaguchi N. Down-regulation of Forkhead Box Protein A1 (FOXA1) Leads to Cancer-stem Cell-like Properties in Tamoxifen-resistant Breast Cancer Cells through Induction of Interleukin-6. Journal of Biological Chemistry. 2017;292:8136-48
16. Carroll JS, Liu XS, Brodsky AS, Li W, Meyer CA, Szary AJ. et al. Chromosome-wide mapping of estrogen receptor binding reveals long-range regulation requiring the forkhead protein FoxA1. Cell. 2005;122:33-43
17. Bernardo GM, Keri RA. FOXA1: a transcription factor with parallel functions in development and cancer. Bioscience reports. 2012;32:113-30
18. Liu Z, Chen S. ER regulates an evolutionarily conserved apoptosis pathway. Biochemical and biophysical research communications. 2010;400:34-8
19. Guiu S, Mollevi C, Charon-Barra C, Boissiere F, Crapez E, Chartron E. et al. Prognostic value of androgen receptor and FOXA1 co-expression in non-metastatic triple negative breast cancer and correlation with other biomarkers. British journal of cancer. 2018;119:76-9
20. Bernardo GM, Bebek G, Ginther CL, Sizemore ST, Lozada KL, Miedler JD. et al. FOXA1 Represses the Molecular Phenotype of Basal Breast Cancer Cells. Oncogene. 2013;32:554-63
21. Marchio C, Thorat M, Morimiya A, Savage K, Nakshatri H, Reis-Filho J. et al. FOXA1: A prognostic and luminal subtype a marker in breast cancer. Meeting of the. 2008 p. 45A-A
22. Pratt MA. Paradoxical roles for FOXA1 in anti-estrogen resistance and as a luminal differentiation factor in breast cancer. Gland surgery. 2012;1:9-11
23. Kiningham KK, Cardozo ZA, Cook C, Cole MP, Stewart JC, Tassone M. et al. All-Trans-Retinoic Acid Induces Manganese Superoxide Dismutase in Human Neuroblastoma Through NFκB. Free Radical Biology & Medicine. 2008;44:1610
24. Hatchi E, Skourti-Stathaki K, Ventz S, Pinello L, Yen A, Kamieniarz-Gdula K. et al. BRCA1 recruitment to transcriptional pause sites is required for R-loop-driven DNA damage repair. Molecular cell. 2015;57:636-47
25. Hempel N, Carrico PM, Melendez JA. Manganese superoxide dismutase (Sod2) and redox-control of signaling events that drive metastasis. Anti-cancer agents in medicinal chemistry. 2011;11:191-201
26. Bromberg J, Wang TC. Inflammation and cancer: IL-6 and STAT3 complete the link. Cancer cell. 2009;15:79
27. Sansone P, Storci G, Tavolari S, Guarnieri T, Giovannini C, Taffurelli M. et al. IL-6 triggers malignant features in mammospheres from human ductal breast carcinoma and normal mammary gland. Journal of Clinical Investigation. 2007;117:3988-4002
28. Iliopoulos D, Hirsch HA, Wang G, Struhl K. Inducible formation of breast cancer stem cells and their dynamic equilibrium with non-stem cancer cells via IL6 secretion. Proceedings of the National Academy of Sciences of the United States of America. 2011;108:1397-402
29. Qian Y, Wang Y, Li DS, Zhu YX, Lu ZW, Ji QH. et al. The chemokine receptor-CXCR2 plays a critical role in the invasion and metastases of oral squamous cell carcinoma in vitro and in vivo. Journal of Oral Pathology & Medicine. 2014;43:658-66
30. Ren C, Cheng X, Lu B, Yang G. Activation of interleukin-6/signal transducer and activator of transcription 3 by human papillomavirus early proteins 6 induces fibroblast senescence to promote cervical tumourigenesis through autocrine and paracrine pathways in tumour microenvironment. European Journal of Cancer. 2013;49:3889-99
31. Tachi K, Shiraishi A, Bando H, Yamashita T, Tsuboi I, Kato T. et al. FOXA1 expression affects the proliferation activity of luminal breast cancer stem cell populations. Cancer Science. 2016;107:281-9
32. Hollestelle A, Nagel JHA, Smid M, Lam S, Elstrodt F, Wasielewski M. et al. Distinct gene mutation profiles among luminal-type and basal-type breast cancer cell lines. Breast cancer research and treatment. 2010;121:53-64
33. Naderi A, Meyer M, Dowhan DH. Cross-regulation between FOXA1 and ErbB2 Signaling in Estrogen Receptor-Negative Breast Cancer 1 2. Neoplasia. 2012;14:283-96
34. Hynes NE, Lane HA. Myc and Mammary Cancer: Myc is a Downstream Effector of the ErbB2 Receptor Tyrosine Kinase. Journal of Mammary Gland Biology & Neoplasia. 2001;6:141-50
35. Dong C, Yuan T, Wu Y, Wang Y, Fan TW, Miriyala S. et al. Loss of FBP1 by Snail-mediated repression provides metabolic advantages in basal-like breast cancer. Cancer cell. 2013;23:316-31
36. Sheng H, Ying L, Zheng L, Zhang D, Zhu C, Wu J. et al. Down Expression of FBP1 Is a Negative Prognostic Factor for Non-Small-Cell Lung Cancer. Cancer investigation. 2015;33:197-204
37. Chen M, Zhang J, Li N, Qian Z, Zhu M, Li Q. et al. Promoter hypermethylation mediated downregulation of FBP1 in human hepatocellular carcinoma and colon cancer. PloS one. 2011;6:e25564
38. Zhu Y, Shi M, Chen H, Gu J, Zhang J, Shen B. et al. NPM1 activates metabolic changes by inhibiting FBP1 while promoting the tumorigenicity of pancreatic cancer cells. Oncotarget. 2015;6:21443-51
39. Verma S, Salmans ML, Geyfman M, Wang H, Yu Z, Lu Z. et al. The estrogen-responsive Agr2 gene regulates mammary epithelial proliferation and facilitates lobuloalveolar development. Developmental biology. 2012;369:249-60
40. Zweitzig DR, Smirnov DA, Connelly MC, Terstappen LW, O'Hara SM, Moran E. Physiological stress induces the metastasis marker AGR2 in breast cancer cells. Molecular and cellular biochemistry. 2007;306:255-60
41. Wang Z, Hao Y, Lowe AW. The adenocarcinoma-associated antigen, AGR2, promotes tumor growth, cell migration, and cellular transformation. Cancer research. 2008;68:492-7
42. Valladares-Ayerbes M, Blanco-Calvo M, Reboredo M, Lorenzo-Patino MJ, Iglesias-Diaz P, Haz M. et al. Evaluation of the adenocarcinoma-associated gene AGR2 and the intestinal stem cell marker LGR5 as biomarkers in colorectal cancer. International journal of molecular sciences. 2012;13:4367-87
43. Zhang J, Jin Y, Xu S, Zheng J, Zhang QI, Wang Y. et al. AGR2 is associated with gastric cancer progression and poor survival. Oncology letters. 2016;11:2075-83
44. Fritzsche FR, Dahl E, Pahl S, Burkhardt M, Luo J, Mayordomo E. et al. Prognostic relevance of AGR2 expression in breast cancer. Clinical Cancer Research. 2006;12:1728-34
45. Bultema JJ, Boyle JA, Malenke PB, Martin FE, Dell'Angelica EC, Cheney RE. et al. Myosin vc interacts with Rab32 and Rab38 proteins and works in the biogenesis and secretion of melanosomes. The Journal of biological chemistry. 2014;289:33513-28
46. Wang JW, Gamsby JJ, Highfill SL, Mora LB, Bloom GC, Yeatman TJ. et al. Deregulated expression of LRBA facilitates cancer cell growth. Oncogene. 2004;23:4089-97
47. Chen C, Sun X, Guo P, Dong XY, Sethi P, Zhou W. et al. Ubiquitin E3 ligase WWP1 as an oncogenic factor in human prostate cancer. Oncogene. 2007;26:2386-94
48. Nguyen Huu NS, Ryder WD, Zeps N, Flasza M, Chiu M, Hanby AM. et al. Tumour-promoting activity of altered WWP1 expression in breast cancer and its utility as a prognostic indicator. J Pathol. 2008;216:93-102
49. Masumoto K, Kitagawa M. E3 Ubiquitin Ligases as Molecular Targets in Human Oral Cancers. Current cancer drug targets. 2016;16:130-5
Author contact
![]() Corresponding authors: Xiaofeng Dai, Wuxi School of Medicine, Jiangnan University, Wuxi, 214122, China; E-mail: xiaofeng.daiedu.cn; and Zhaohui Huang, Wuxi Cancer Institute, Affiliated Hospital of Jiangnan University, 200 Hui He Road, Wuxi, 214062, China; E-mail: hzhwxsycom
Corresponding authors: Xiaofeng Dai, Wuxi School of Medicine, Jiangnan University, Wuxi, 214122, China; E-mail: xiaofeng.daiedu.cn; and Zhaohui Huang, Wuxi Cancer Institute, Affiliated Hospital of Jiangnan University, 200 Hui He Road, Wuxi, 214062, China; E-mail: hzhwxsycom