Impact Factor ISSN: 1449-2288
- Issue 12; 2026
- Issue 11; 2026
- Issue 10; 2026
- Issue 9; 2026
- Issue 8; 2026
- Volume 22; 2026
- Past Issues
- Advance Articles
- Editorial Board
- Cover Images
- Index & Coverage
- Cover Suggestion
- Special Issues
Introduction
Materials and Methods
Results and Discussion
Conclusions
Abbreviations
Supplementary Material
Acknowledgements
References

 Global reach, higher impact
Int J Biol Sci 2020; 16(8):1363-1375. doi:10.7150/ijbs.41395 This issue Cite
Research Paper
Quantitative determination of niraparib and olaparib tumor distribution by mass spectrometry imaging
Lavinia Morosi1* ![]() , Cristina Matteo1*, Tommaso Ceruti1, Silvia Giordano2, Marianna Ponzo1, Roberta Frapolli1, Massimo Zucchetti1, Enrico Davoli2, Maurizio D'Incalci1#, Paolo Ubezio1#
, Cristina Matteo1*, Tommaso Ceruti1, Silvia Giordano2, Marianna Ponzo1, Roberta Frapolli1, Massimo Zucchetti1, Enrico Davoli2, Maurizio D'Incalci1#, Paolo Ubezio1#
1. Istituto di Ricerche Farmacologiche Mario Negri IRCCS, Department of Oncology
2. Istituto di Ricerche Farmacologiche Mario Negri IRCCS, Laboratory of Mass Spectrometry
*L.M. and C.M. contributed equally
#M.D. and P.U. co-last authors
Received 2019-11-9; Accepted 2020-1-18; Published 2020-2-21
Abstract

Rationale: Optimal intratumor distribution of an anticancer drug is fundamental to reach an active concentration in neoplastic cells, ensuring the therapeutic effect. Determination of drug concentration in tumor homogenates by LC-MS/MS gives important information about this issue but the spatial information gets lost. Targeted mass spectrometry imaging (MSI) has great potential to visualize drug distribution in the different areas of tumor sections, with good spatial resolution and superior specificity. MSI is rapidly evolving as a quantitative technique to measure the absolute drug concentration in each single pixel.
Methods: Different inorganic nanoparticles were tested as matrices to visualize the PARP inhibitors (PARPi) niraparib and olaparib. Normalization by deuterated internal standard and a custom preprocessing pipeline were applied to achieve a reliable single pixel quantification of the two drugs in human ovarian tumors from treated mice.
Results: A quantitative method to visualize niraparib and olaparib in tumor tissue of treated mice was set up and validated regarding precision, accuracy, linearity, repeatability and limit of detection. The different tumor penetration of the two drugs was visualized by MSI and confirmed by LC-MS/MS, indicating the homogeneous distribution and higher tumor exposure reached by niraparib compared to olaparib. On the other hand, niraparib distribution was heterogeneous in an ovarian tumor model overexpressing the multidrug resistance protein P-gp, a possible cause of resistance to PARPi.
Conclusions: The current work highlights for the first time quantitative distribution of PAPRi in tumor tissue. The different tumor distribution of niraparib and olaparib could have important clinical implications. These data confirm the validity of MSI for spatial quantitative measurement of drug distribution providing fundamental information for pharmacokinetic studies, drug discovery and the study of resistance mechanisms.
Keywords: drug distribution, mass spectrometry imaging, PARPi
Introduction
Ovarian cancer is a worldwide leading cause of death from gynecologic malignancies with overall survival less than 45% within five years from diagnosis [1]. Despite a high initial response rate to platinum (Pt) and taxane treatments, most patients relapse with a median progression‐free survival of 18 months, gradually becoming Pt-resistant [2]. Recent clinical trials with Poly (ADP-ribose) polymerase inhibitors (PARPi) have shown great clinical benefit in ovarian cancer patients, with substantial progression‐free survival advantages over placebo in the maintenance setting [3-10]. The inhibition of PARP activity in homologous recombination-deficient cells (such as those with BRCA mutations) induces 'synthetic lethality' due to the simultaneous loss of both single strand break and homologous recombination-mediated double-strand break repair machineries, causing selective cytotoxicity for tumor cells [11-15].
The first Food and Drug Administration PARPi approved for BRCAmut ovarian cancer was olaparib while niraparib was the first PARPi that demonstrated clinical efficacy in both BRCAwt and BRCAmut tumors [3]. In addition, niraparib broader clinical activity might be intrinsically linked to its biophysical properties, such as better water solubility, higher membrane permeability and greater distribution volume [16]. All these factors may contribute to a different pharmacokinetic profile, achieving higher tumor exposure to niraparib than olaparib. This could explain why -particularly in BRCAwt models- niraparib was more effective than olaparib in vivo, although the two drugs have similar in vitro PARP catalytic inhibition potency and cytotoxicity in BRCAmut cells [16].
The determination of tumor drug concentrations and distribution is important because in order to be effective, an anticancer drug has to reach an active concentration in cancer cells. Pharmacokinetic analysis, monitoring circulating drug concentrations, are not necessarily predictive of the concentration achieved in the tumor because of its complex and poorly/irregularly vascularized microenvironment [17]. Measuring drug concentrations in tumor homogenates by LC-MS/MS adds valuable knowledge about this issue, but completely ignores the heterogeneity of drug distribution, losing the spatial information [18]. The irregular drug delivery in tumor tissue is instead a critical problem, mainly due to the altered tumor microenvironment. The abnormal blood and lymphatic vessels, inflammation, dense and fibrous connective tissue characterizing the neoplastic phenotype increase interstitial fluid pressure (IFP), solid stress and hypoxia that limit the distribution and efficacy of anticancer drugs [17,19]. Another factor influencing the intracellular concentrations of many drugs is the expression and function of membrane transporters. This is particularly important for anticancer drugs as tumor cells often overexpress the ABC transporters (e.g. P-glycoprotein, P-gp) involved in the extrusion of drugs from the cell, thus causing multidrug resistance [20]. Some findings suggest that overexpression of ABC transporters might induce resistance to PARP inhibitors (PARPi) too [21]. Olaparib and niraparib in fact were reported to be a substrate for P-gp [22,23].
Only few data are available about PARPi distribution in tumor tissue in the literature. Some imaging results indicated that distribution of olaparib through tumor tissue was quite uniform and uptake into cancer cells is sufficiently high to induce molecular effect [24-26]. In contrast, the visualization of rucaparib and veliparib in xenograft models indicated that their intratumor distribution was highly heterogeneous [27,28]. To our knowledge, no information has been published on the intratumor distribution of niraparib.
To look into this properly, an accurate method is essential to obtain information on the spatial distribution of the drug in tumor tissue. Matrix-assisted laser desorption ionization (MALDI) mass spectrometry imaging (MSI) has evolved as a valuable tool for the qualitative visualization of drugs in tumor slices, with high spatial and mass resolution and great specificity and without the need of labeling the analytes [29-34]. Our group has already reported that the intratumor distribution of small molecules is extremely heterogeneous in different tumor models. Drug distribution seems very low and irregular in solid tumors with large necrotic or fibrotic areas [35,36] and irregular vasculature [37]. MSI of pharmaceutical compounds has been performed not only using MALDI ion source but even with two alternative ionization technique: secondary ion mass spectrometry (SIMS) and desorption electrospray ionization (DESI). SIMS can achieve the best spatial resolution (<250nm) but with limited sensitivity while DESI allows rapid image acquisition with almost no need of sample preparation [38]. However, the most suitable and widely applied ionization technique for quantitative analysis of exogenous compound in treated animals is MALDI [38]. MALDI-MSI is now moving forward to overcome its main limitation: the difficulty of acquiring reliable absolute quantitative measurements of the amount of drug in each pixel of the image [39,40]. Quantitative MSI has in fact to deal with several issues: sensitivity is limited by the small sample size (e.g. a single pixel); ion intensity can vary widely because of uneven matrix deposition or differences in extraction efficiency [41]; the ionization efficiency is strongly analyte-dependent and influenced by ion suppression effect due to the local composition of the surface [42,43]. Drug ions identification is further complicated by their very low relative intensity in the spectrum because of their limited concentration in tissue compared to endogenous molecules, especially when potent anticancer drugs are administered at very low doses. Moreover, the small molecules mass range is dominated by matrix fragment and cluster signals that further mask drug-related ion signals [44]. Finally a crucial step is the building of a reliable calibration curve prepared in the most similar conditions possible to the analyzed samples [45].
In this study, we developed a mass spectrometry imaging method to obtain for the first time quantitative information at single pixel level about the distribution of olaparib and niraparib in tumor tissue.
We applied the widely accepted normalization method based on stable isotope added to the matrix to take into account the ion suppression and recovery variability [36,39,46]. We also tested different inorganic nanoparticles as a MALDI matrix to ensure the almost complete absence of background signals from matrix degradation in the drug mass range, as well as optimal spatial resolution and less recovery problems by avoiding the co-crystallization process [47,48]. The preprocessing steps allow to correctly identify and integrate the low intensity ion peaks and to convert the ion signal intensity into drug concentration units using a calibration curve made with the spot on tissue approach in each MALDI detection plate [49]. Moreover, we proposed one of the first attempt of rigorous method validation in the emerging field of quantitative MSI [29,42,50].
The MSI method was applied to determine the intra-tumor distribution of niraparib and olaparib in A2780 ovarian cancer model. Overall tumor drug exposure was consistent with LC-MS/MS quantitative analysis on the second half of the same tumors. Niraparib distribution was also analyzed in A2780 resistant cancer model overexpressing P-gp to investigate the role of this transporter in PARPi accumulation in tumor and efficacy.
Materials and Methods
Drugs and reagents
Olaparib (batch #24830 MedChemExpress) and niraparib (batch #BO160P003 MedChemExpress) were provided by TESARO Inc (Waltham, MA, USA). Drugs were dissolved in DMSO. Serial dilutions were prepared in 50% ethanol from 5 to 250 pmol/µL for MSI. For chromatographic analysis, niraparib was dissolved in H2O:CH3CN, 1:1 (v/v) and diluted to obtain standard and quality control (QC) working solutions at 1, 5, 10, 25, 50 and 100 ng/sample and 2.5, 40 and 80 ng/sample, respectively. Serial dilutions of olaparib in methanol were done to prepare standard working solutions at 0.5, 2.0, 5.0, 10.0 and 50.0 ng/sample and the QC working solutions at 4, 25 and 40 ng/sample.
Niraparib-D7 (batch #TJ1-2017-137T Charles Rivers) was dissolved in DMSO at the concentration of 1mg/mL and olaparib-D8 (batch #ALG-ALS-12-072-P3 Alsachim) was dissolved in methanol at a nominal concentration of 1 mg/mL.
For treatment purposes niraparib was dissolved in 10% DMSO-methyl cellulose 0.5% and olaparib in 10% DMSO-Hydroxypropyl)-beta-cyclodextrin 10%.
Gold nanoparticles (AuNPs, 0.7 mM in 50% ethanol synthesized in-house as described in our previous publication [48]; titanium dioxide nanoparticles (TiO2NPs, 1 mg/mL in 50% ethanol / 0.5% KCl Evonik Industrials, Essen, Germany) and titanium dioxide conjugated with gold nanoparticles (AuTiO2NPs, 0.5% gold w/w dissolved at the concentration of 3 mg/mL in 50% ethanol kindly provided by THETIS S.p.A. and produced as described in the Supplementary Material).
TiO2-based NP suspensions were vortexed and sonicated for 3 min just before use, to reduce agglomeration and sedimentation.
Animals and treatments
Experiments involving animals were conducted in conformity with the following laws, regulations, and policies: Italian Governing Law (D.lgs 26/2014; Authorization n.19/2008-A issued March 6, 2008 by Ministry of Health); Mario Negri Institutional Regulations and Policies providing internal authorization for persons conducting animal experiments (Quality Management System Certificate - UNI EN ISO 9001:2008 - Reg. N° 8576-A); the NIH Guide for the Care and Use of Laboratory Animals (2011 edition) and EU directives and guidelines (EEC Council Directive 2010/63/UE) and in line with guidelines for the welfare and use of animals in cancer research [51]. Animal experiments were reviewed and approved by the Mario Negri Animal Care and Use Committee (IACUC), which includes members ad hoc for ethical issues. Animals were housed in the Institute's Animal Care Facilities, which meet international standards; they are regularly checked by a certified veterinarian who is responsible for health monitoring, animal welfare supervision, experimental protocols and review of procedures.
Ten million A2780wt or A2780/P-gp cells were injected subcutaneously into the right flank of seven-week-old female CD1 nude mice (Charles River, Calco, Italy). When tumor weight reached approximately 400 mg, mice were treated either with vehicle (10% DMSO-methyl cellulose 0.5% for niraparib and 10% DMSO-Hydroxypropyl)-beta-cyclodextrin 10% for olaparib) or with a single dose of niraparib (50 mg/kg p.o.) or olaparib (67 mg/kg p.o) and euthanized 2h after treatment by exposition to increasing CO2 concentration. The doses were chosen to reproduce the clinical treatment. The vehicle treated tumors were used for blank evaluation and scale calibration. Tumors were explanted and divided into two parts: the first one was immediately snap-frozen in liquid nitrogen and stored at -80°C until MSI analysis while the second one was stored at -20°C for LC-MS/MS analysis.
Matrix selection for MSI
For the initial setup, 1 µL of 100 pmol/µL drug standard solutions dissolved in 50% ethanol were spotted onto the steel MALDI plate (Opti-TOF 384 Well insert). After complete air-drying, the drug spot was covered with 1 µL of different NP suspensions to be tested as matrices.
To assess the influence of biological matrix on drugs ionization, niraparib and olaparib standards were spotted (0.2 µL per spot) at increasing concentrations (5, 10, 20, 50 and 100 pmol/spot) on untreated tumor sections. The parameters evaluated to compare the ionization efficiency were the drug signal intensity and the signal to background intensity ratio (calculated as the ratio of the mean signal intensities in the drug spots to the blank spot). The ion signal intensity in the spots over tissue section is compared with the ion signal intensity on MALDI plate to address the ion suppression problem.
Frozen tumors were cut into 10 μm thick sections using a cryo-microtome (Leica Microsystems, Wetzler, Germany) at -20°C and mounted on a pre-cooled MALDI plate (Opti-TOF 384 Well insert) by standard thaw-mounting techniques. The plate was dried in a vacuum drier at room temperature overnight. Then each plate was sprayed with AuNPs, TiO2NPs or AuTiO2NPs matrix suspensions using a BD 180 precision double-action trigger airbrush (FENGDA, Zhejiang, China) with a 0.20 mm nozzle diameter, using nitrogen at 0.2 atm. Typically 5 mL of matrix solution was sprayed on each 3cm x 3cm portion of MALDI plate.
A MALDI 4800 TOF-TOF (AB SCIEX Old Connecticut Path, Framingham, MA 01701, USA) was used, equipped with a 355 nm Nd:YAG laser with a 200 Hz repetition rate and 10µm spot size, controlled by the 4000 Series ExplorerTM software (AB SCIEX Old Connecticut Path, Framingham, MA 01701, USA). MS were acquired in reflectron with 20 laser shots with intensity of 4500 arbitrary units, with a bin size of 0.5 ns. The instrument was mass calibrated with a CAL-MIX before analysis and used at 10,000 resolving power.
Images of tissue sections were acquired using the 4800 Imaging Tool software (www.maldi-msi.org, M. Stoeckli, Novartis Pharma, Basel, Switzerland), with an imaging raster of 100x100 µm.
Tissue View software 1.1 (AB SCIEX) was used to process and display the ion distribution inside the tumor sections in this preliminary setup phase. Niraparib and olaparib were imaged by plotting K+ or Na+ adduct ions at m/z 359.1 or m/z 343.1 and m/z 473.1 or m/z 457.1 respectively. A classical RAINBOW color scale was used to create images of drugs, setting the saturation following the maximum in each acquisition.
Quantitative MSI
D7-niraparib or D8-olaparib 3 μg/mL were added to the matrix as internal standard (IS) before spraying and uniformly applied over tissue sections. The IS ion signals has a double function in each pixel: to find the m/z range where the drug ion signal should be identified and then to normalize the signal intensity. This procedure is essential to correct the resulting images in order to take into account the laser shot-to-shot variability and the different ion suppression and/or experimental m/z drifts during acquisition due to the tissue heterogeneity [29].
Molecular images were generated and analyzed using a custom data processing pipeline [49] adapted for niraparib and olaparib. The method (described in details in the Supplementary Material) comprised several steps: data extraction from raw MS acquisition, identification of the m/z position of the peaks of interest, integration of the signals over (pixel-specific) optimized m/z ranges, tissue identification, normalization with the internal standard and noise reduction applying a median filter (3x3) to the 2D image matrix. Then 2D images of the normalized drug-related signals were converted in “quantitative” images by applying the parameters of the calibration curve. In this work, the calibration curve was built by spotting increasing standard drug concentrations (1, 2, 5, 10, 20 and 50 pmol/spot) on a section of untreated tumor in each MALDI plate. We considered a ROI within each spot (including typically 100 pixels and excluding the edges) and we assumed the signals of pixels within a ROI as replicate measures of the same nominal drug concentration [50]. The mean normalized ion signal and the standard error (SE) inside these ROIs were plotted against the respective nominal concentrations to build the calibration curve, obtained with a weighted linear fit with 1/SE2 weight. The weighting allows compensation over the different variances of the mean signal intensities within the spots at different concentrations. The nominal concentration (pmol/mm2) of each ROI was obtained dividing the overall drug amount spotted, by the exact number of pixels in the ROI (converted to mm2 taking into account the dimension of each pixel, 100μm x 100μm).
The frequency distributions of the replicated signals in each ROI and in an untreated tumor section (blank) were used to state the limit of blank (LOB) and limit of detection (LOD) (Figure 1) [52]. LOB was set as the signal level not exceeded by 95% of the pixels in untreated control sections. LOD was taken as the average signal in the lowest nominal drug concentration ROI of the calibration scale, wherein only the 5% of the pixels were under the LOB [45,53]. The parameters of the calibration curve were used to transform the 2D images of the normalized drug-related signals into quantitative images of the spatial distribution of the drug concentration in each pixel (pg/pixel). The corresponding concentration per grams of tissue (μg/g) was estimated considering the depth of the section (10 μm) and assuming unitary density.
2D images of the normalized niraparib ion signal after application of the median filter (3x3) in an untreated tumor (A) and in a calibration curve section (B). The dotted white square depict the 100 pixel ROIs taken into account for calibration. Cumulative distribution of normalized drug-related signals in the pixel of untreated tumor and of the ROIs of each calibration spot (C). The value at 95% of the distribution of untreated tumor (dotted black line) corresponds to the LOB. The LOD correspond to the mean of first distribution whose only the 5% is under the LOB (D). In this example the LOD is the mean of the signals of spot 1pmol (dotted red line).
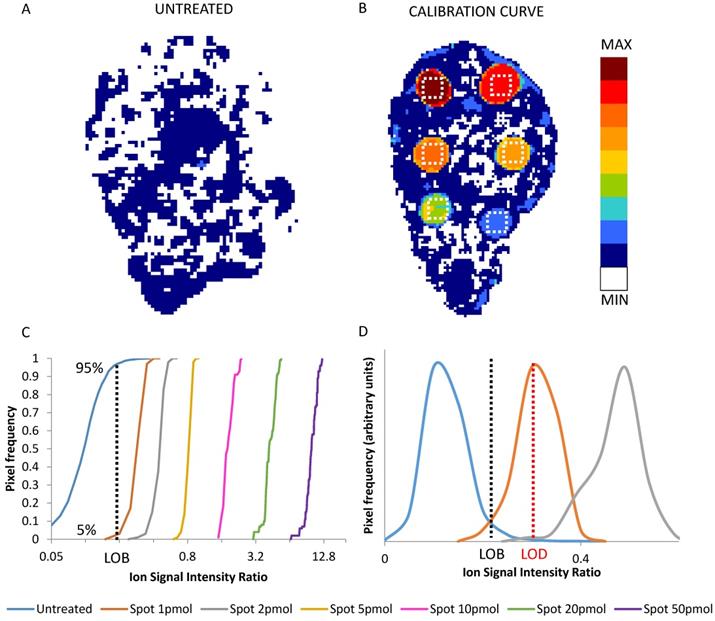
We included the LOD information in the color scale of the final quantitative images of the drug distribution, painting dark blue the pixels with drug signals below the LOD, above the average of the blank, and white those pixels with signals even below the average of the blank.
The method was validated by adapting for MSI, the generally accepted guidelines for HPLC bioanalytical methods [53-55]. We assessed the following parameters for niraparib and olaparib imaging: precision, goodness of the fitting, repeatability, limit of detection and accuracy.
The precision of the method was determined using the CV% at two different levels:
1) the pixel level (0.01 mm2, rougly 0.1 μg tissue) comparing the pixels in the ROIs within each calibration spot.
2) the ROI level (1 mm2, roughly 0.01 mg tissue) comparing average concentrations in replicate spots.
Under these experimental conditions, the goal was mean precision determined at each level not exceeding 20% of the CV%.
The accuracy was expressed as the percentage deviation between the mean calculated concentrations and the nominal concentration at ROI level. We consider acceptable mean values within 20% of the nominal value (25% for the lowest calibration point).
Three calibration curves of niraparib and olaparib were analyzed on the same working day including six spots to determine the precision at single-pixel level, to assess the goodness of the fitting and the intra-day repeatability.
The goodness of weighted fits was evaluated by the standard deviation (SD) and the CV% of best fit slope (m) and y intercept (q) and the plot of the standardized residuals, calculated as the ratio of the percentage residuals (the difference between the measured Y value and the Y value predicted by the calibration equation) to the standard deviation of the measures.
The intra-day repeatability was assessed comparing m and q of the three calibration curves considering acceptable an inter-curve CV% of these parameters lower than 25%.
The precision (at ROI level) and accuracy were checked by measuring the analytes in three replicates of QC samples spotted on untreated tumor sections. Two QC levels were analyzed at the concentrations of 3 and 7 pmol/spot. Moreover, the inter-day repeatability of the calibration scales was validated over three working days together with the accuracy of the back-calculated concentrations.
The analytical method was applied to a preliminary drug distribution study in ovarian cancer models (A2780wt or A2780/P-gp). For niraparib and olaparib drug distribution experiments, four tumors per group and three sections per each tumor were analyzed. One 10 μm section every 300 μm of tumor tissue was cut and mounted on MALDI plate, the adjacent one was mounted on a glass slide and stored at -20°C for H&E staining. The percentage of pixels where the drug is over the LOD has been calculated as a parameter to compare the extent of drug diffusion in the analyzed sections.
Quantitative LC-MS/MS analysis
On the second half of each tumor analyzed by MSI we measured the total drug concentration in tissue homogenate by LC-MS/MS.
For niraparib in tumor tissues the method was adapted from Sun et al. [16]. Briefly, tumors were homogenized 1 g: 10 mL (w/v) in NH4CH3COOH 20 mM and 100 µL of unknown samples were transferred to polypropylene tubes to be extracted. Six-point calibration curve and three replicates of each QC concentration were prepared spiking 5 µL of the corresponding working solution into 95 µL of control matrix homogenate. To all samples analyzed we added 5 µL of IS (D7-niraparib) at the final concertation of 25 ng/sample (2.75 µg/g), vortexed and extracted with 0.5 mL of CH3CN:CH3OH solution 1:1 (v/v). Samples were centrifuged for 10 min at 13200 rpm 4°C and the supernatant was dried under N2 at 40°C and reconstituted in 120 µL of a MP-A:MP-B 1:1 (v/v) solution (MP-A: CH3COONH4 20 mM; MP-B: CH3OH:CH3CN 1:1 (v/v), HCOOH 0.1%). After vigorous vortex mixing, samples were centrifuged again at 13200 rpm for 10 minutes at 20°C, then the supernatant was transferred to a glass vial and 2 µL were injected into the HPLC-MS/MS system.
For olaparib quantification in tissues, the method was adapted from Nijenhuis et al. [56]. Tumors were homogenized 1 g: 10 mL (w/v) in CH3COONH4 20 mM and 25 μL of tumor homogenate was further diluted with 10%BSA, 1:1 (v/v). D8-olaparib (50 ng) dissolved in methanol was added to all the samples. For extraction 1 mL of methyl tert-butyl ether was added with shaking for 5 min and centrifuging at 13000 rpm for 10 min. The samples were snap-frozen and the organic layer was properly separated and removed. Extracted samples were evaporated under nitrogen, then reconstituted in 100 μL of methanol, and 2 μL were injected into the HPLC-MS/MS system for quantification.
MS detection was carried out on a triple quadrupole API 4000 mass spectrometer (Sciex, MA, USA) equipped with electrospray ionization (ESI) operating in positive ion mode.
The chromatographic separation of both drugs was obtained with a Gemini C18 column, 50 mm×2·0 mm, 5 μm (Phenomenex, Torrance, USA) at 40°C, protected with Security Guard™ ULTRA cartridges C18 (Phenomenex Inc., Torrance, CA, USA).
For quantification we monitored the transitions 435.40>367.10 m/z. and 321.0>304.1 of olaparib and niraparib, respectively.
Statistical analysis
Fitting of the calibration scale and statistical analyses were performed with GraphPad Prism version 6.01 software (GraphPad software, Inc., La Jolla, CA, U.S.A.). Shapiro-Wilk normality test and runs-test were used to analyze residuals to test the goodness of the fitting [57,58]. Student's t test was performed to evaluate differences in drug distribution experiments.
Results and Discussion
Matrix selection for MSI
The mass spectra obtained with three different matrices are shown in the Supplementary Material (Figures S1-S6). The ionization best was obtained for both drugs with AuTiO2NPs as Na+ or K+ adducts (for niraparib m/z 343.1 and m/z 359.1 and for olaparib m/z 457.1 and m/z 473.1 respectively) in positive ion mode, as described in detail in the Supplementary Material.
Table 1 summarizes the main ion signals intensity of niraparib and olaparib (Na+ or K+ adduct depending on the drug/matrix combination), spotted at increasing concentrations on untreated tumor sections. The lowest detectable niraparib concentration on tissue with AuNPs and TiO2NPs matrices was that of the 10 pmol spot, while the 5 pmol spot was well detectable only with AuTiO2NPs. Olaparib was detectable in the 20 pmol spot with AuNPs, only in the 50 pmol spot with TiO2NPs (with negative ionization), while AuTiO2NPs again performed better, enabling the detection of the 5 pmol spot. AuTiO2 gave the best results not only in terms of signal intensity but even evaluating background intensity to signal ratio (Table 1).
Mean ion signal intensity and the signal to background Ratio ratio for each drug; ND= not detectable
| Mean ion signal intensity | Signal to Background Ratio | ||||||
|---|---|---|---|---|---|---|---|
| pmol/ spot | AuNPs | TiO2 NPs | AuTiO2 NPs | AuNPs | TiO2 NPs | AuTiO2 NPs | |
| Niraparib | 100 | 277.5 | 149.5 | 1319.4 | 15.3 | 20.8 | 47.0 |
| 50 | 219.1 | 78.7 | 763.1 | 12.1 | 10.9 | 27.2 | |
| 20 | 86.9 | 66.7 | 445.1 | 4.8 | 9.3 | 15.8 | |
| 10 | 61.1 | 27.6 | 269.7 | 3.4 | 3.8 | 9.6 | |
| 5 | ND | ND | 155.3 | ND | ND | 5.5 | |
| Blank | 18.1 | 7.2 | 28.1 | ||||
| Olaparib | 100 | 745.2 | 613.5 | 4701.6 | 32.7 | 2.4 | 230.5 |
| 50 | 321.7 | 353.4 | 2490.1 | 14.1 | 1.4 | 122.1 | |
| 20 | 176.2 | ND | 673.1 | 7.7 | ND | 33.0 | |
| 10 | ND | ND | 271.4 | ND | ND | 13.3 | |
| 5 | ND | ND | 124.6 | ND | ND | 6.1 | |
| Blank | 22.8 | 253.2 | 20.4 | ||||
As regard the effect of biological matrix on ionization, a 100 fold decrease in niraparib signal intensity resulted on tissue compared to MALDI plate with AuNPs and TiO2NPs while the ion suppression was less marked with AuTiO2NPs (40 fold). For olaparib, ion suppression caused a 20 time decrease in ion signal intensity on tissue compared to MALDI plate with AuNPs and TiO2NPs while only a 4 time decrease with AuTiO2NPs.
In conclusion, the most suitable matrix for imaging experiments was AuTiO2 in positive ion mode, since it allowed visualization of the lowest drug concentration with a very low background noise.
Quantitative MSI method validation
LOD determination is an often neglected but vital step to ensure correct interpretation of MSI quantitative data, especially when the relationship between tissue drug distribution and the efficacy of therapy is under investigation [50]. A formal assessment of the LOD requires taking account not only of the variability of the blank, but also the precision of the detection within the standard spots, here in ROIs where variability of the actual drug concentration can be neglected. Figure 1 panel A and B shows an example of an untreated tumor section and of a calibration curve section respectively, while panel C shows the frequency distributions of normalized drug-related signals in the ROIs of the spots at increasing drug amount. The average normalized drug-related signal of the frequency distribution which had the 5th percentile equal to the LOB (95th percentile of blank) was used to calculate the LOD. Then the average normalized drug-related signal of each ROI with the respective nominal concentration were used to build a calibration curve.
The LOD was found near to the 1 pmol spot, corresponding for niraparib a to 1.47± 0.15 pg/pixel, roughly 14.7 ± 1.5 µg/g (mean and SD of the three independent determinations) and for olaparib to 2.24± 0.43 pg/pixel, roughly 22.4 ± 4.3 µg/g.
The precision at pixel level was evaluated on the three calibration curves (6 concentrations, 18 spots) spotted on untreated tumor tissue the same working day (Figure 2), The mean CV% for the niraparib ion signal was 10.6±2.4%, (range 7.3-15.5%) (Figure 2A). The mean CV% in the 18 spots for olaparib was higher: 18.4±5.9% (range 11.1-29.7%) (Figure 2B). Considering the complexity of the measure and the small quantity of tissue in each pixel, this level of precision is in our opinion quite acceptable for the aim of construction a quantitative 2D image. Moreover, because the precision of the 1 pmol spots, where the LOD is calculated, was not higher and respected the same acceptability criteria, the limit of quantification was set equal to the LOD.
Precision at single pixel level expressed as CV% in 18 spot of Niraparib (A) and of Olaparib (B). The red line corresponds to the mean CV%.
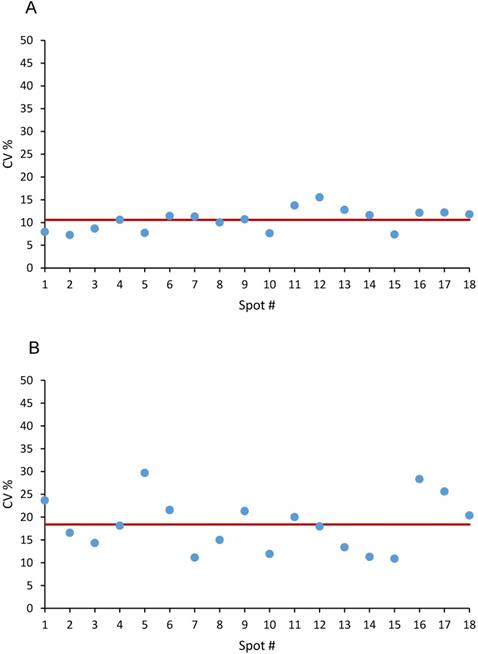
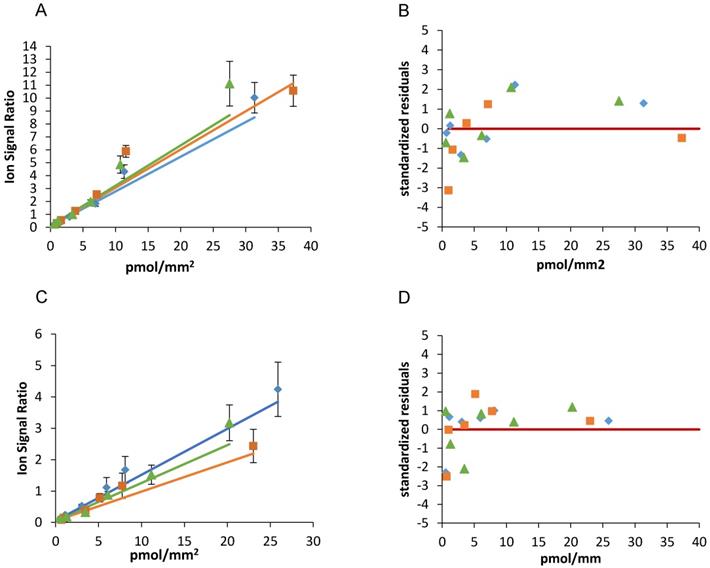
Figure 3 and table 2 show the results of the weighted linear fitting and the intra-day repeatability of the two drugs calibration scales. The slope (m) and intercept (q) were estimated in each curve with CV% <15% and standardized residuals were distributed above and below the zero, satisfying the Shapiro-Wilk normality test with a single exception (panel C blue line). Because systematic deviations from linearity were not observed and were never detected by runs- test, we did not consider more complex (e.g. polynomial) models nor a restriction of the linearity range.
Niraparib (A) and olaparib (C) calibration curves spotted the same working day and the corresponding standardized residuals (B and D). The red lines indicate the zero.
Slope and y intercepts values of three calibration curve of niraparib and olaparib spotted in the same working day. SD and CV% is presented for each m and q and comparing different curves.
| Niraparib | Olaparib | |||
|---|---|---|---|---|
| m±SD (CV%) [Udrug/(pmol/mm2)]* | q±SD (CV%) [Udrug)]* | m±SD (CV%) [Udrug/(pmol/mm2)]* | q±SD (CV%) [Udrug)]* | |
| Rep 1 | 0.296±0.035 (11.8) | 0.101±0.016 (15.9) | 0.093±0.014 (14.7) | 0.0527±0.0014 (2.7) |
| Rep 2 | 0.312±0.022 (7.1) | 0.104±0.009 (8.5) | 0.121±0.012 (9.7) | 0.0529±0.0012 (2.3) |
| Rep 3 | 0.268±0.018 (6.8) | 0.104±0.008 (8.1) | 0.147±0.014 (9.4) | 0.0528±0.0012 (2.2) |
| MEAN | 0.292 | 0.103 | 0.120 | 0.0528 |
| SD | 0.022 | 0.002 | 0.027 | 0.0001 |
| CV% | 7.6 | 1.7 | 22.3 | 0.2 |
* Udrug : unit of the normalised drug signal (dimensionless)
The best fit slope (m) and y intercept (q) of three independent scales of niraparib spotted the same working day were close to each other (m mean±SD: 0.292±0.022, CV%=7.6); q mean±SD: 0.103±0.002, CV%=1.7) confirming the intra-day repeatability.
As regard olaparib, the slope (m mean±SD: 0.120±0.027, CV%=22.3) and y intercept (q mean±SD: 0.053±0.0001, CV%=0.2) were similar comparing the three curves, although with somewhat more variability than niraparib.
For niraparib the concentration accuracy of QCs spotted at 3 and 7 pmol/spot expressed as the percentage deviation was 12.6-17.7% and the precision at ROI level fell into the range 12.4-15.7% (Table 3).
Accuracy and precision at ROI level on QCs at two concentrations of niraparib
| Spotted pmol/spot | Nominal pmol/mm2 | Measured pmol/mm2 | MEAN | SD | CV (%) | Accuracy (%) | Accuracy MEAN (%) |
|---|---|---|---|---|---|---|---|
| 7 | 5.2 | 5.1 | 5.9 | 0.9 | 12.4 | 1.7 | 17.7 |
| 4.6 | 5.7 | 22.7 | |||||
| 5.4 | 6.9 | 28.8 | |||||
| 3 | 2.1 | 1.7 | 1.8 | 0.2 | 15.7 | 18.8 | 12.6 |
| 1.9 | 2.0 | 4.0 | |||||
| 1.9 | 1.6 | 15.1 |
For olaparib the concentration accuracy of QCs expressed as the percentage deviation was 12.2-27.2% and the precision at ROI level fell into in the range 3.4-14.5% (Table 4). For both drugs the precision at ROI level was adequate for all the concentrations and the accuracy was acceptable for an imaging method considering that the percentage deviation from the nominal value of the QCs was less than 20% for at least 67% of the QCs and for 50% of the concentrations. Moreover, the total mean accuracy of the QCs was 19.7% (Table 4).
Accuracy and precision at ROI level on QCs at two concentrations of olaparib
| Spotted pmol/spot | Nominal pmol/mm2 | Measured pmol/mm2 | MEAN | SD | CV (%) | Accuracy (%) | Accuracy MEAN (%) |
|---|---|---|---|---|---|---|---|
| 7 | 4.5 | 4.6 | 4.8 | 0.2 | 3.4 | 2.6 | 27.2 |
| 3.1 | 4.7 | 52.3 | |||||
| 3.9 | 5.0 | 26.6 | |||||
| 3 | 2.0 | 1.8 | 1.8 | 0.3 | 14.5 | 12.0 | 12.2 |
| 1.8 | 1.5 | 18.6 | |||||
| 1.9 | 2.0 | 6.2 |
The inter-day repeatability and the back-calculated concentration accuracy of niraparib and olaparib methods are reported in supplementary information (Figure S8 and Table S1-S2).
It is important to point out the high variability (especially for olaparib) of the best value of the y intercept in different days. This is mainly due to the different background noise from plate to plate. In this situation, it is mandatory to prepare a fresh calibration curve for each plate analyzed in order to determine the specific LOB, LOD, m and q.
PARPi tumor distribution
The tumor distribution of niraparib and olaparib was analyzed in four tumors per group in mice bearing the A2780wt ovarian cancer treated at comparable doses (Niraparib 50 mg/kg p.o.; Olaparib 67 mg/kg p.o.).
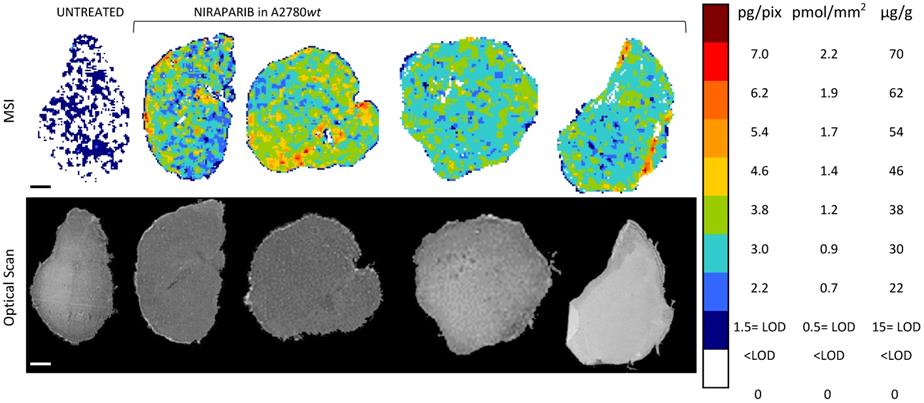
The MSI normalized images (Figure 4) show a homogeneous niraparib distribution in A2780wt, with low variability within slices of the same tumors and between tumors. The mean CV% of the drug concentration in each pixel was in fact 32.3% (ranging from 24.5% to 42.4%). The olaparib ion signal instead was below the LOD (2.24± 0.43 pg/pixel) in all the sections analyzed, with no appreciable difference from untreated tumors (Figure 5). The different intratumor drug concentration reached by the two drug was confirmed by the parallel LC-MS/MS analysis: the average olaparib concentration was 1.18±0.31 µg/g, 10 times lower than the concentration reached by niraparib (10.40±1.69 µg/g; t test p-value= 0.000025). These data indicate a widely different tumor drug exposure of the two PARPi, administered at comparable doses, as used in clinical practice.
Niraparib quantitative distribution by MSI in the ovarian cancer model A2780wt. One representative section of the three analyzed for each tumor is shown. The lower panel shows the corresponding optical scan of the sections. Scale bar: 1mm
Olaparib resulted undetectable by MSI in the ovarian cancer model A2780wt. One representative tumor of the four analyzed is shown. The lower panel shows the corresponding optical scan of the sections. Scale bar: 1mm
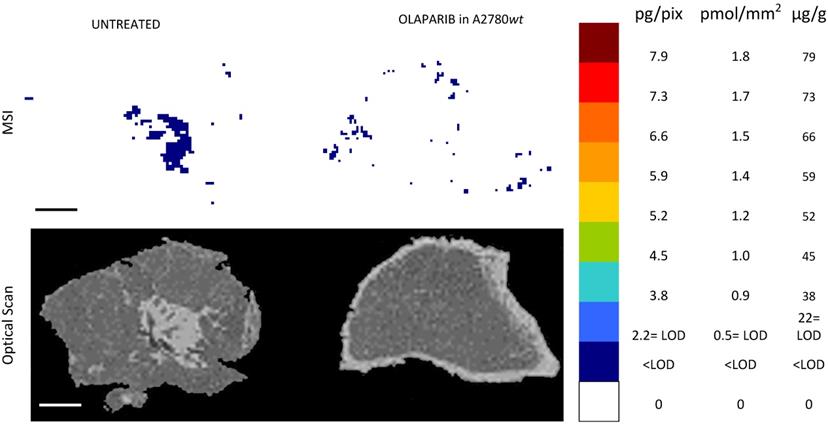
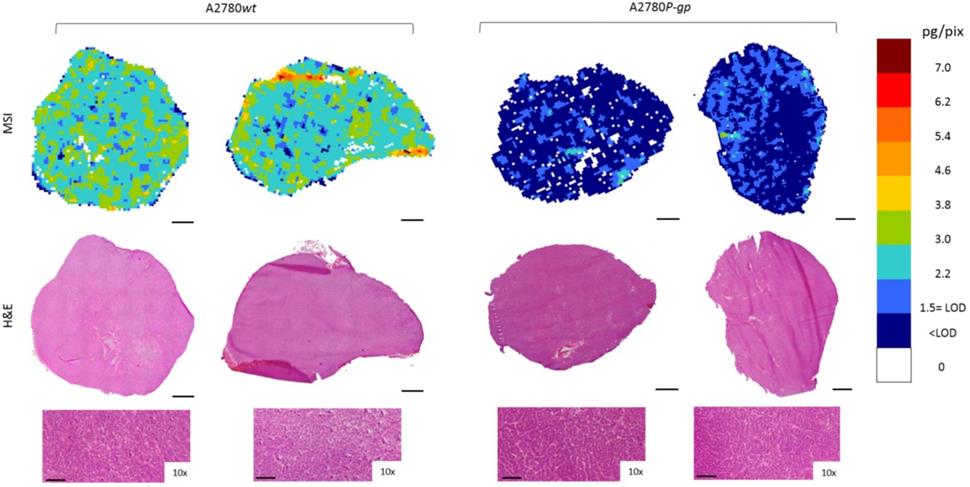
Moreover, to investigate niraparib affinity for P-gp, we performed MSI and LC-MS/MS analysis in a resistant ovarian model overexpressing P-gp (A2780P-gp). The drug penetration in the P-gp model was lower than in wt tumors and niraparib reached concentrations above the LOD only in limited tumor areas. In fact the percentage of pixels “positive” to the drug (where the drug concentration is above the LOD) was lower in the P-gp-overexpressing tumor model (18.4±8.8%) than its wild type counterpart (87.7±7.4%; p-value test t=0.0000916) in which the distribution homogeneously exceeded the LOD (Figure 6). H&E staining was performed on the section adjacent to the one analyzed by MSI (Figure 7). No macroscopic difference in tissue morphology can be pointed out comparing A2780wt and A2780/P-gp or among the area with different drug concentrations. Quantitative LC-MS/MS analysis of tumor homogenates confirmed this different distribution: average tumor concentration of niraparib was double in the wild type than in A2780/P-gp tumors (mean±SD: 10.40±1.69 µg/g in A2780wt and 5.29±0.55 µg/g in A2780/P-gp; t test p-value=0.00237). Similarly, the mean drug concentrations calculated locally in the sections by MSI were respectively 25.74±3.20 µg/g and 9.96±2.93 µg/g in A2780wt and A2780/P-gp.
Niraparib quantitative distribution by MSI in the ovarian cancer model A2780P-gp. One representative section of the three analyzed for each tumor is shown. The lower panel shows the corresponding optical scan of the sections. Scale bar: 1mm

Niraparib quantitative distribution by MSI in the ovarian cancer models compared to H&E staining on the adjacent section. The lower panels show a 10x enlargement of the section. One representative section of the three analyzed for each tumor is shown. Scale bar: 1mm or 100µm (10x images)
Taking account of the diversity of the methods and their limitations, the correlation between LC-MS/ MS and MSI quantitative results was satisfactory (R=0.93, p-value=0.0025) (figure S10 and Table S3).
The differences between the two techniques can be due to several factors. First of all the sampling in different parts of the tumor makes the results not exactly comparable: LC-MS/MS in fact addresses the drug quantification in the whole tumor homogenate while MSI deals with a few sections of the tumor where the distribution can vary widely. In addition, LC-MS/MS measures of drug concentration rely on an accurate measure of the weight of tumor specimen to be analysed, while MSI properly measures a surface concentration in dried microtome-cut sections, which can be converted to μg/g only with assumptions on the section width and specific weight. Moreover, MSI quantification can be slightly influenced by the different extraction of the analyte from the treated samples (from inside the tissue) compared to the calibration curve where the drug is spotted over the tissue. Alternative methods to build a calibration curve taking this problem into account has been published (e.g. mimetic tissue model [41,45]), but are extremely time-consuming and not straightforwardly applicable in our experimental conditions because of massive ion suppression in tumor homogenates (data not shown). Therefore, knowing its limitations, the calibration curve spotted on tissue can be considered a reasonable alternative [42]. Finally, the higher LOD of MSI than LC-MS/MS could cause the loss of some quantitative information.
Conclusions
An accurate, reproducible imaging method to determine niraparib and olaparib distribution in tumor tissue is proposed for the first time, allowing the quantification of the two drugs in each pixel of the tissue image, preserving the spatial information. Analysis of niraparib distribution in wt A2780 ovarian cancer showed homogeneous penetration inside tumor tissue, while the olaparib ion signal was below the LOD in all the sections analyzed and in fact, no differences could be seen between treated and untreated tumors in molecular images and in the tissue mean spectrum. MSI data were consistent with the measurement of the two PARPi in tumor homogenates by LC-MS/MS. This highlighted an interesting difference in tumor concentration of the drugs administered at therapeutic and comparable doses: niraparib mean concentrations in tumor A2780wt were in fact, ten times higher than olaparib. The different concentrations in tumor tissue can partially explain why niraparib, and not olaparib, is active in BRCAwt patients [3] thanks probably to the higher drug concentration at the site of action. One can speculate that BRCA-mutated tumors are so sensitive to PARPi that even low concentrations of either olaparib or niraparib induce an antitumor response, whereas antitumor activity against BRCAwt tumors requires an higher drug concentration and therefore niraparib has a better chance of being effective. Thus the different pharmacokinetic behavior can partially explain the broader clinical activity of niraparib. The high tumor concentrations of niraparib and longer half-life (36 vs 15 h) suggest that a partial dose reduction should not lead to any loss of drug activity.
Due to the low tumor penetration of olaparib, the MSI method was not sensitive enough to detect the drug in mice treated with a standard schedule. Thus, while the niraparib MSI method was successfully established at a quantitative level, olaparib need further improvements to lower the LOD and overcome the standard criteria for a full validation.
Moreover, the distribution of niraparib was analyzed in a resistant P-gp overexpressing ovarian cancer model, where the drug penetrated the tumor to a lower extent and it was detectable only in small areas of the tumor section. LC-MS/MS determination of drug concentrations in tumor homogenates validated this different distribution. The overexpresssion of P-gp might therefore contribute to the resistance to PARPi.
This study demonstrates the potential of quantitative MSI combined with LC-MS/MS for fuller understanding of anticancer drug intratumor distribution.
We plan to use this method to investigate a broad range of tumors, sensitive and resistant to PARPi to understand whether at least in some cases, e.g. in BRCAwt the sensitivity to these drugs is related to the tumor drug concentrations.
Abbreviations
BRCA: Breast Related Cancer Antigens; CV: coefficient of variation; LOB: limit of blank; LOD: limit of detection; MALDI: matrix assisted laser desorption ionization; MS: mass spectrometry; MSI: mass spectrometry imaging; NPs: nanoparticles; PARPi: poly (ADP-ribose) polymerase inhibitors; P-gp: P-glycoprotein; Pt: platinum; QC: quality control; ROI: region of interest; SD: standard deviation; SE: standard error.
Supplementary Material
Supplementary figures and tables.
Acknowledgements
We acknowledge support from Sonja Visentin (University of Torino, Department of Molecular Biotechnology and Health Science) for AuNPs synthesis and Emanuele Barborini (at the time of the present study Tethis SpA, Milan, Italy; currently at Luxembourg Institute of Science and Technology, Luxembourg) and Simone Vinati (at the time of the present study Tethis SpA, Milan, Italy; currently at ParteQ GmbH, Germany) for AuTiO2NPs production. The study was supported in part by funding from TESARO Inc (Waltham, MA, USA). The authors thank J.D. Baggott for editing.
Competing Interests
The authors have declared that no competing interest exists.
References
1. Webb PM, Jordan SJ. Epidemiology of epithelial ovarian cancer. Best Pract Res Clin Obstet Gynaecol. 2017;41:3-14 https://doi.org/10.1016/j.bpobgyn.2016.08.006
2. Christie EL, Bowtell DDL. Acquired chemotherapy resistance in ovarian cancer. Ann Oncol. 2017;28:viii13-5 https://doi.org/10.1093/annonc/mdx446
3. Mirza MR, Monk BJ, Herrstedt J, Oza AM, Mahner S, Redondo A. et al. Niraparib Maintenance Therapy in Platinum-Sensitive, Recurrent Ovarian Cancer. N Engl J Med. 2016;375:2154-64 https://doi.org/10.1056/NEJMoa1611310
4. Ledermann J, Harter P, Gourley C, Friedlander M, Vergote I, Rustin G. et al. Olaparib maintenance therapy in platinum-sensitive relapsed ovarian cancer. N Engl J Med. 2012;366:1382-92 https://doi.org/10.1056/NEJMoa1105535
5. Kaufman B, Shapira-Frommer R, Schmutzler RK, Audeh MW, Friedlander M, Balmaña J. et al. Olaparib monotherapy in patients with advanced cancer and a germline BRCA1/2 mutation. J Clin Oncol. 2015;33:244-50 https://doi.org/10.1200/JCO.2014.56.2728
6. Moore K, Colombo N, Scambia G, Kim B-G, Oaknin A, Friedlander M. et al. Maintenance Olaparib in Patients with Newly Diagnosed Advanced Ovarian Cancer. N Engl J Med. 2018;379:2495-505 https://doi.org/10.1056/NEJMoa1810858
7. Swisher EM, Lin KK, Oza AM, Scott CL, Giordano H, Sun J. et al. Rucaparib in relapsed, platinum-sensitive high-grade ovarian carcinoma (ARIEL2 Part 1): an international, multicentre, open-label, phase 2 trial. Lancet Oncol. 2017;18:75-87 https://doi.org/10.1016/S1470-2045(16)30559-9
8. Coleman RL, Oza AM, Lorusso D, Aghajanian C, Oaknin A, Dean A. et al. Rucaparib maintenance treatment for recurrent ovarian carcinoma after response to platinum therapy (ARIEL3): a randomised, double-blind, placebo-controlled, phase 3 trial. Lancet. 2017;390:1949-61 https://doi.org/10.1016/S0140-6736(17)32440-6
9. Kristeleit R, Shapiro GI, Burris HA, Oza AM, LoRusso P, Patel MR. et al. A Phase I-II Study of the Oral PARP Inhibitor Rucaparib in Patients with Germline BRCA1/2-Mutated Ovarian Carcinoma or Other Solid Tumors. Clin Cancer Res. 2017;23:4095-106 https://doi.org/10.1158/1078-0432.CCR-16-2796
10. Moore KN, Secord AA, Geller MA, Miller DS, Cloven N, Fleming GF. et al. Niraparib monotherapy for late-line treatment of ovarian cancer (QUADRA): a multicentre, open-label, single-arm, phase 2 trial. Lancet Oncol. 2019;20:636-48 https://doi.org/10.1016/S1470-2045(19)30029-4
11. Satoh MS, Lindahl T. Role of poly(ADP-ribose) formation in DNA repair. Nature. 1992;356:356-8 https://doi.org/10.1038/356356a0
12. De Vos M, Schreiber V, Dantzer F. The diverse roles and clinical relevance of PARPs in DNA damage repair: current state of the art. Biochem Pharmacol. 2012;84:137-46 https://doi.org/10.1016/j.bcp.2012.03.018
13. Farmer H, McCabe N, Lord CJ, Tutt ANJ, Johnson DA, Richardson TB. et al. Targeting the DNA repair defect in BRCA mutant cells as a therapeutic strategy. Nature. 2005;434:917-21 https://doi.org/10.1038/nature03445
14. Franzese E, Centonze S, Diana A, Carlino F, Guerrera LP, Di Napoli M. et al. PARP inhibitors in ovarian cancer. Cancer Treat Rev. 2019;73:1-9 https://doi.org/10.1016/j.ctrv.2018.12.002
15. Weaver AN, Yang ES. Beyond DNA Repair: Additional Functions of PARP-1 in Cancer. Front Oncol. 2013;3:290. https://doi.org/10.3389/fonc.2013.00290
16. Sun K, Mikule K, Wang Z, Poon G, Vaidyanathan A, Smith G. et al. A comparative pharmacokinetic study of PARP inhibitors demonstrates favorable properties for niraparib efficacy in preclinical tumor models. Oncotarget. 2018;9:37080-96 https://doi.org/10.18632/oncotarget.26354
17. Fuso Nerini I, Morosi L, Zucchetti M, Ballerini A, Giavazzi R, D'Incalci M. Intratumor heterogeneity and its impact on drug distribution and sensitivity. Clin Pharmacol Ther. 2014;96:224-38 https://doi.org/10.1038/clpt.2014.105
18. Prideaux B, Stoeckli M. Mass spectrometry imaging for drug distribution studies. J Proteomics. 2012;75:4999-5013 https://doi.org/10.1016/j.jprot.2012.07.028
19. Saggar JK, Yu M, Tan Q, Tannock IF. The tumor microenvironment and strategies to improve drug distribution. Front Oncol. 2013;3:154. https://doi.org/10.3389/fonc.2013.00154
20. Durmus S, Sparidans RW, van Esch A, Wagenaar E, Beijnen JH, Schinkel AH. Breast cancer resistance protein (BCRP/ABCG2) and P-glycoprotein (P-GP/ABCB1) restrict oral availability and brain accumulation of the PARP inhibitor rucaparib (AG-014699). Pharm Res. 2015;32:37-46 https://doi.org/10.1007/s11095-014-1442-z
21. Vaidyanathan A, Sawers L, Gannon A-L, Chakravarty P, Scott AL, Bray SE. et al. ABCB1 (MDR1) induction defines a common resistance mechanism in paclitaxel- and olaparib-resistant ovarian cancer cells. Br J Cancer. 2016;115:431-41 https://doi.org/10.1038/bjc.2016.203
22. Henneman L, van Miltenburg MH, Michalak EM, Braumuller TM, Jaspers JE, Drenth AP. et al. Selective resistance to the PARP inhibitor olaparib in a mouse model for BRCA1-deficient metaplastic breast cancer. Proc Natl Acad Sci USA. 2015;112:8409-14 https://doi.org/10.1073/pnas.1500223112
23. Jaspers JE, Sol W, Kersbergen A, Schlicker A, Guyader C, Xu G. et al. BRCA2-deficient sarcomatoid mammary tumors exhibit multidrug resistance. Cancer Res. 2015;75:732-41 https://doi.org/10.1158/0008-5472.CAN-14-0839
24. Thurber GM, Yang KS, Reiner T, Kohler RH, Sorger P, Mitchison T. et al. Single-cell and subcellular pharmacokinetic imaging allows insight into drug action in vivo. Nat Commun. 2013;4:1504. https://doi.org/10.1038/ncomms2506
25. Reiner T, Lacy J, Keliher EJ, Yang KS, Ullal A, Kohler RH. et al. Imaging therapeutic PARP inhibition in vivo through bioorthogonally developed companion imaging agents. Neoplasia. 2012;14:169-77
26. Shimma S, Takashima Y, Hashimoto J, Yonemori K, Tamura K, Hamada A. Alternative two-step matrix application method for imaging mass spectrometry to avoid tissue shrinkage and improve ionization efficiency. J Mass Spectrom. 2013;48:1285-90 https://doi.org/10.1002/jms.3288
27. Parrish KE, Cen L, Murray J, Calligaris D, Kizilbash S, Mittapalli RK. et al. Efficacy of PARP Inhibitor Rucaparib in Orthotopic Glioblastoma Xenografts Is Limited by Ineffective Drug Penetration into the Central Nervous System. Mol Cancer Ther. 2015;14:2735-43 https://doi.org/10.1158/1535-7163.MCT-15-0553
28. Bartelink IH, Prideaux B, Krings G, Wilmes L, Lee PRE, Bo P. et al. Heterogeneous drug penetrance of veliparib and carboplatin measured in triple negative breast tumors. Breast Cancer Res. 2017;19:107. https://doi.org/10.1186/s13058-017-0896-4
29. Porta T, Lesur A, Varesio E, Hopfgartner G. Quantification in MALDI-MS imaging: what can we learn from MALDI-selected reaction monitoring and what can we expect for imaging? Anal Bioanal Chem. 2015;407:2177-87 https://doi.org/10.1007/s00216-014-8315-5
30. Morosi L, Spinelli P, Zucchetti M, Pretto F, Carrà A, D'Incalci M. et al. Determination of paclitaxel distribution in solid tumors by nano-particle assisted laser desorption ionization mass spectrometry imaging. PLoS ONE. 2013;8:e72532. https://doi.org/10.1371/journal.pone.0072532
31. Torok S, Rezeli M, Kelemen O, Vegvari A, Watanabe K, Sugihara Y. et al. Limited Tumor Tissue Drug Penetration Contributes to Primary Resistance against Angiogenesis Inhibitors. Theranostics. 2017;7:400-12 https://doi.org/10.7150/thno.16767
32. Tsubata Y, Hayashi M, Tanino R, Aikawa H, Ohuchi M, Tamura K. et al. Evaluation of the heterogeneous tissue distribution of erlotinib in lung cancer using matrix-assisted laser desorption ionization mass spectrometry imaging. Sci Rep. 2017;7:12622. https://doi.org/10.1038/s41598-017-13025-8
33. Ryu S, Hayashi M, Aikawa H, Okamoto I, Fujiwara Y, Hamada A. Heterogeneous distribution of alectinib in neuroblastoma xenografts revealed by matrix-assisted laser desorption ionization mass spectrometry imaging: a pilot study. Br J Pharmacol. 2018;175:29-37 https://doi.org/10.1111/bph.14067
34. Tanaka Y, Hirata M, Shinonome S, Torii M, Nezasa K-I, Tanaka H. Distribution analysis of epertinib in brain metastasis of HER2-positive breast cancer by imaging mass spectrometry and prospect for antitumor activity. Sci Rep. 2018;8:343. https://doi.org/10.1038/s41598-017-18702-2
35. Morosi L, Giordano S, Falcetta F, Frapolli R, Licandro SA, Matteo C. et al. Application of 3D Mass Spectrometry Imaging to TKIs. Clin Pharmacol Ther. 2017;102:748-51 https://doi.org/10.1002/cpt.786
36. Giordano S, Zucchetti M, Decio A, Cesca M, Fuso Nerini I, Maiezza M. et al. Heterogeneity of paclitaxel distribution in different tumor models assessed by MALDI mass spectrometry imaging. Sci Rep. 2016;6:39284. https://doi.org/10.1038/srep39284
37. Cesca M, Morosi L, Berndt A, Fuso Nerini I, Frapolli R, Richter P. et al. Bevacizumab-Induced Inhibition of Angiogenesis Promotes a More Homogeneous Intratumoral Distribution of Paclitaxel, Improving the Antitumor Response. Mol Cancer Ther. 2016;15:125-35 https://doi.org/10.1158/1535-7163.MCT-15-0063
38. Prideaux B, Lenaerts A, Dartois V. Imaging and spatially resolved quantification of drug distribution in tissues by mass spectrometry. Curr Opin Chem Biol. 2018;44:93-100 https://doi.org/10.1016/j.cbpa.2018.05.007
39. Schulz S, Becker M, Groseclose MR, Schadt S, Hopf C. Advanced MALDI mass spectrometry imaging in pharmaceutical research and drug development. Curr Opin Biotechnol. 2019;55:51-9 https://doi.org/10.1016/j.copbio.2018.08.003
40. Ellis SR, Bruinen AL, Heeren RMA. A critical evaluation of the current state-of-the-art in quantitative imaging mass spectrometry. Anal Bioanal Chem. 2014;406:1275-89 https://doi.org/10.1007/s00216-013-7478-9
41. Barry JA, Ait-Belkacem R, Hardesty WM, Benakli L, Andonian C, Licea-Perez H. et al. Multicenter Validation Study of Quantitative Imaging Mass Spectrometry. Anal Chem. 2019;91:6266-74 https://doi.org/10.1021/acs.analchem.9b01016
42. Rzagalinski I, Volmer DA. Quantification of low molecular weight compounds by MALDI imaging mass spectrometry - A tutorial review. Biochim Biophys Acta Proteins Proteom. 2017;1865:726-39 https://doi.org/10.1016/j.bbapap.2016.12.011
43. Karlsson O, Hanrieder J. Imaging mass spectrometry in drug development and toxicology. Arch Toxicol. 2017;91:2283-94 https://doi.org/10.1007/s00204-016-1905-6
44. Nilsson A, Goodwin RJA, Shariatgorji M, Vallianatou T, Webborn PJH, Andrén PE. Mass spectrometry imaging in drug development. Anal Chem. 2015;87:1437-55 https://doi.org/10.1021/ac504734s
45. Barry JA, Groseclose MR, Castellino S. Quantification and assessment of detection capability in imaging mass spectrometry using a revised mimetic tissue model. Bioanalysis. 2019;11:1099-116 https://doi.org/10.4155/bio-2019-0035
46. Buck A, Halbritter S, Späth C, Feuchtinger A, Aichler M, Zitzelsberger H. et al. Distribution and quantification of irinotecan and its active metabolite SN-38 in colon cancer murine model systems using MALDI MSI. Anal Bioanal Chem. 2015;407:2107-16 https://doi.org/10.1007/s00216-014-8237-2
47. Shrivas K, Hayasaka T, Sugiura Y, Setou M. Method for simultaneous imaging of endogenous low molecular weight metabolites in mouse brain using TiO2 nanoparticles in nanoparticle-assisted laser desorption/ionization-imaging mass spectrometry. Anal Chem. 2011;83:7283-9 https://doi.org/10.1021/ac201602s
48. Giordano S, Pifferi V, Morosi L, Morelli M, Falciola L, Cappelletti G. et al. A Nanostructured Matrices Assessment to Study Drug Distribution in Solid Tumor Tissues by Mass Spectrometry Imaging. Nanomaterials (Basel). 2017:7 https://doi.org/10.3390/nano7030071
49. Falcetta F, Morosi L, Ubezio P, Giordano S, Decio A, Giavazzi R. et al. Past-in-the-Future. Peak detection improves targeted mass spectrometry imaging. Anal Chim Acta. 2018;1042:1-10 https://doi.org/10.1016/j.aca.2018.06.067
50. Rzagalinski I, Kovačević B, Hainz N, Meier C, Tschernig T, Volmer DA. Toward Higher Sensitivity in Quantitative MALDI Imaging Mass Spectrometry of CNS Drugs Using a Nonpolar Matrix. Anal Chem. 2018;90:12592-600 https://doi.org/10.1021/acs.analchem.8b02740
51. Workman P, Aboagye EO, Balkwill F, Balmain A, Bruder G, Chaplin DJ. et al. Guidelines for the welfare and use of animals in cancer research. Br J Cancer. 2010;102:1555-77 https://doi.org/10.1038/sj.bjc.6605642
52. Armbruster DA, Pry T. Limit of blank, limit of detection and limit of quantitation. Clin Biochem Rev. 2008;29(Suppl 1):S49-52
53. Protocols for determination of limits of detection andlimits of quantification: approved guideline In: EP17-A (Ed.) National Committee for Clinical Laboratory Standard n.d
54. FDA, Bioanalytical Method Validation Guidance for Industry, (2018) 44. n.d
55. European Medicines Agency, Guideline on bioanalytical method validation, (2011) 23. n.d
56. Nijenhuis CM, Lucas L, Rosing H, Schellens JHM, Beijnen JH. Development and validation of a high-performance liquid chromatography-tandem mass spectrometry assay quantifying olaparib in human plasma. J Chromatogr B Analyt Technol Biomed Life Sci. 2013;940:121-5 https://doi.org/10.1016/j.jchromb.2013.09.020
57. Shapiro SS, Francia RS. An Approximate Analysis of Variance Test for Normality. Journal of the American Statistical Association. 1972;67:215-6 https://doi.org/10.1080/01621459.1972.10481232
58. Wald A, Wolfowitz J. On a Test Whether Two Samples are from the Same Population. Ann Math Statist. 1940;11:147-62 https://doi.org/10.1214/aoms/1177731909
Author contact
![]() Corresponding author: Lavinia Morosi, Istituto di Ricerche Farmacologiche Mario Negri IRCCS, via M. Negri 2, 20156 Milano. Phone: +39 02 39014726; Fax: +39 02 39014734; Email: lavinia.morosiit
Corresponding author: Lavinia Morosi, Istituto di Ricerche Farmacologiche Mario Negri IRCCS, via M. Negri 2, 20156 Milano. Phone: +39 02 39014726; Fax: +39 02 39014734; Email: lavinia.morosiit