Impact Factor ISSN: 1449-2288
- Issue 12; 2026
- Issue 11; 2026
- Issue 10; 2026
- Issue 9; 2026
- Issue 8; 2026
- Volume 22; 2026
- Past Issues
- Advance Articles
- Editorial Board
- Cover Images
- Index & Coverage
- Cover Suggestion
- Special Issues
Introduction
Methods
Results
Discussion
Conclusions
Abbreviations
Supplementary Material
Acknowledgements
References

 Global reach, higher impact
Int J Biol Sci 2020; 16(13):2464-2476. doi:10.7150/ijbs.48639 This issue Cite
Research Paper
Bioinformatic Analysis of Correlation between Immune Infiltration and COVID-19 in Cancer Patients
Xin Huang1,2,3*, Chaobin He1,2,3*, Xin Hua1,2,4*, Anna Kan1,2,5, Shuxin Sun1,2,3, Jun Wang1,2,3, Shengping Li1,2,3 ![]()
1. Sun Yat-sen University Cancer Center, State Key Laboratory of Oncology in South China, Collaborative Innovation Center for Cancer Medicine, Guangzhou 510060, China.
2. Department of Experimental Research, Sun Yat-sen University Cancer Center, Guangzhou 510060, China.
3. Department of Pancreatobiliary Surgery, Sun Yat-sen University Cancer Center, Guangzhou 510060, China.
4. Department of Medical Oncology, Sun Yat-sen University Cancer Center, Guangzhou 510060, China.
5. Department of Hepatic Surgery, Sun Yat-sen University Cancer Center, Guangzhou 510060, China.
*These authors contributed equally to this work.
Received 2020-5-24; Accepted 2020-6-20; Published 2020-7-6
Abstract

In 2020, severe acute respiratory syndrome coronavirus 2 (SARS-CoV-2) has caused infections worldwide. However, the correlation between the immune infiltration and coronavirus disease 2019 (COVID-19) susceptibility or severity in cancer patients remains to be fully elucidated. ACE2 expressions in normal tissues, cancers and cell lines were comprehensively assessed. Furthermore, we compared ACE2 expression between cancers and matched normal tissues through Gene Expression Profiling Interactive Analysis (GEPIA). In addition, we performed gene set enrichment analysis (GSEA) to investigate the related signaling pathways. Finally, the correlations between ACE2 expression and immune infiltration were investigated via Tumor Immune Estimation Resource (TIMER) and GEPIA. We found that ACE2 was predominantly expressed in both adult and fetal tissues from the digestive, urinary and male reproductive tracts; moreover, ACE2 expressions in corresponding cancers were generally higher than that in matched healthy tissues. GSEA showed that various metabolic and immune-related pathways were significantly associated with ACE2 expression across multiple cancer types. Intriguingly, we found that ACE2 expression correlated significantly with immune cell infiltration in both normal and cancer tissues, especially in the stomach and colon. These findings proposed a possible fecal-oral and maternal-fetal transmission of SARS-CoV-2 and suggested that cancers of the respiratory, digestive or urinary tracts would be more vulnerable to SARS-CoV-2 infection.
Keywords: ACE2, COVID-19, immune infiltration, cancer
Introduction
Severe acute respiratory syndrome coronavirus 2 (SARS-CoV-2) belongs to the beta genus coronavirus [1] and has caused an outbreak of coronavirus diseases 2019 (COVID-19) worldwide in 2020. As of 22 June 2020, a total of 9044581 cases have been identified around the world (https://www.worldometers.info/coronavirus/), and SAR-CoV-2 has been declared a pandemic by the World Health Organization (WHO).
As the functional receptor for the spike glycoprotein of SARS-CoV-2, angiotensin-converting enzyme 2 (ACE2) has played a crucial role in SARS-CoV-2 infection [2]. Epithelial cells that have ACE2 expression in normal lungs are the main target of SARS-CoV-2 [3]. In addition, others have found ACE2 mRNA and protein expression in renal, cardiovascular and gastrointestinal tissues [4, 5]; the conjunctivae, digestive and urogenital tracts are also exposed to the external environment, providing potential routes of transmission. Likewise, other studies have found SARS-CoV-2 RNA in feces, urine and gastrointestinal mucosa [6].
Both humoral and cellular immunity participate in the protection against SARS-CoV-2 infection [7]. Evidence has indicated that the dysregulation of the immune response, especially T cells, might be highly involved in the pathological process of COVID-19 [8]. Meanwhile, others also demonstrated that aberrant and excessive immune cells, such as monocytes and macrophages, played an immune damaging role in COVID-19 [9]. By postmortem biopsies, others researchers have found intestinal infiltration of mononuclear cells in the lungs and indicated that overwhelming inflammation and cytokine-associated lung injury could be important in the progression of COVID-19 [3, 9, 10].
Cancer is associated with immune dysfunction [11], and cancer patients are more prone to infections because of the systemic immunosuppressive state caused by malignancy or anticancer treatments, such as chemotherapy or surgery [12]. Moreover, accumulating evidences have demonstrated that cancer is closely associated with chronic inflammation, and the tumor microenvironment (TME) is infiltrated by various blood-derived immune cells [13]. Liang et al. found that cancer patients had a higher risk of COVID-19 and a poorer prognosis than those without cancer [14]. Another study reported that cancer patients had an increased risk of COVID-19 compared with the general population [15]. However, it is worth noting that the association between COVID-19 and cancer remains unknown due to the small sample size and high heterogeneity of the cancer patients in these studies [16].
ACE2 has been reported to inhibit cancer progression in liver hepatocellular carcinoma (LIHC) [17] and pancreatic adenocarcinoma (PAAD) [18], whereas opposite results were observed in kidney renal clear cell carcinoma (KIRC) [19]. However, the correlations among SARS-CoV-2 infection, ACE2 expression and immune cell infiltration in tumor tissues, especially lung cancer and gastrointestinal cancers, have not been fully elucidated. In this study, we aimed to investigate the ACE2 expression in cancer patients or healthy individuals through bioinformatics analysis.
Methods
Gene expression analysis
ACE2 expression in normal and cancer tissues was assessed by the Human Protein Atlas (HPA) (http://www.proteinatlas.org/) [20], which has now incorporated baseline expression profiles of tissues from the Genotype-Tissue Expression (GTEx) and FANTOM5 projects; and ACE2 expression in human cancer cell lines was determined through the Cancer Cell Line Encyclopedia (CCLE) (https://portals.broadinstitute.org/ccle) [21]. In addition, we used data from GTEx to compare ACE2 expression between male and female with R package ggpubr. Finally, ACE2 expression in single cells was explored through the human cell landscape (HCL) (http://bis.zju.edu.cn/HCL/) constructed by Guo et al. [22], including both fetal and adult tissues.
Comparisons of ACE2 expression among cancer, adjacent normal tissue and healthy tissue
Gene Expression Profiling Interactive Analysis (GEPIA) is an interactive website that provides customizable functions, including differential expression analysis, profiling plotting and correlation analysis based on the RNA-Seq expression data of 9736 tumors and 8587 normal samples from The Cancer Genome Atlas (TCGA) and GTEx datasets (http://gepia2.cancer-pku.cn/) [23]. It was used to compare ACE2 expression between cancer and normal tissues. In addition, we downloaded the data of number of fragments per kilobase of exon per million reads (FPKM) in cancer, adjacent normal tissue and healthy tissue from TCGA or GTEx, which were normalized in R environment using NormalizeBetweenArrays [24]. In addition, pairwise comparisons of ACE2 expression were performed in TCGA datasets.
Gene set enrichment analysis (GSEA)
Genes and Kyoto Encyclopedia of Genes and Genomes (KEGG) pathways associated with ACE2 expression across various types of cancer were analyzed by GSEA as previously described by using the R package clusterProfiler [25], with the normalized enrichment score (NES) calculated.
Prognostic value analysis
The relationships between the gene expression level of ACE2 and the overall survival (OS) or disease-free survival (DFS) of cancer patients were analyzed using GEPIA and the log-rank test, with Cox proportional hazard ratio (HR) and 95% confidence intervals calculated.
Correlation analysis of gene expression
Tumor Immune Estimation Resource (TIMER) is a comprehensive web server for the systematic analysis of immune infiltration across diverse cancer types (http://timer.cistrome.org/) [26], as described previously [27].
Furthermore, we explored the correlation between gene expression and tumor stage through GEPIA, and gene expression correlation analysis was performed for the given TCGA and GTEx datasets in GEPIA, with the Spearman method being used.
Statistical analysis
For comparisons among cancer, adjacent normal tissue and healthy tissue, Kruskal-Wallis tests with post hoc using Dunn's method, Wilcoxon matched-pairs signed rank tests or paired t tests were performed (GraphPad Prism 7.0 software). Two-side p < 0.05 was considered statistically significant, unless otherwise specified.
Results
ACE2 was predominantly expressed by glandular cells of the digestive, urinary and male reproductive tracts in both the fetus and the adult
Fig. 1a shows the overview of ACE2 expression by human subjects from the HPA database. We found that ACE2 expression in the digestive, urinary and male reproductive tracts was higher than that in other tissues, at both the RNA and protein levels.
ACE2 expression in normal human tissues. (a) Overview of RNA and protein expression data in the human body. Left panel: the depth of red represents the different expression levels. Middle panel: bars represent the highest NX (RNA expression) and expression score (protein expression) found in a particular group of tissues. Right panel: representative images of immunohistochemical staining for ACE2 in the normal cerebral cortex, colon, liver, gallbladder, kidney, testis and lymph node. (b) Protein expressions of ACE2 in normal tissues, which were ranked by the expression levels. The y-axis represents the scores based on immunohistochemistry. (c) RNA expressions of ACE2 in normal tissues, which were ranked by the expression levels. The data were from the consensus dataset based on a combination of all three sources (HPA RNA-seq data, GTEx RNA-seq data and FANTOM5 data). (d) Difference in ACE2 expression between men and women from GTEx data. The y-axis represents transformed log2(FPKM+1). NX, consensus normalized expression; HPA, Human Protein Atlas; GTEx, Genotype-Tissue Expression; FPKM, number of fragments per kilobase of exon per million reads. *, P < 0.05; **, P < 0.01.
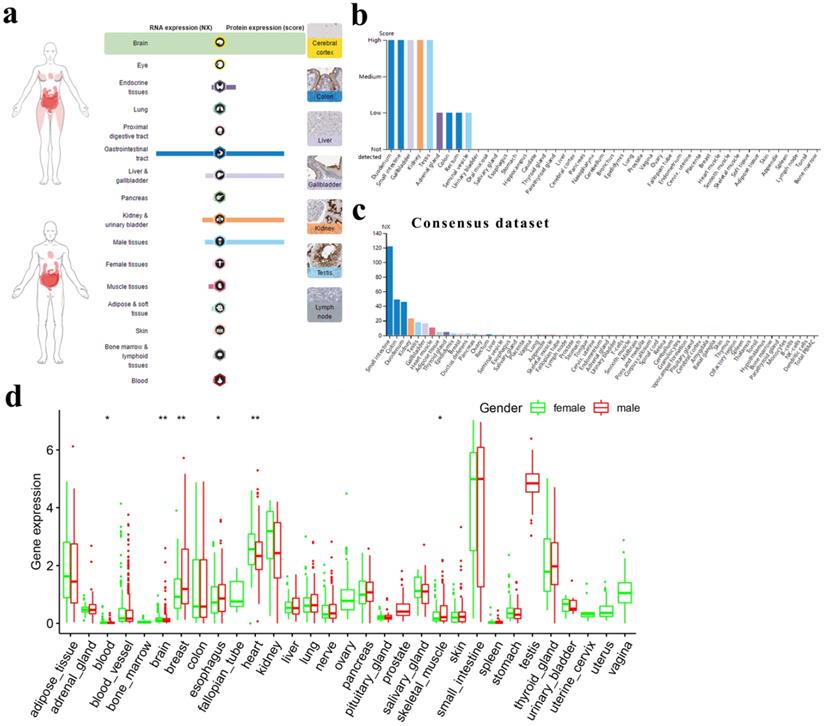
For the digestive tract, the immunohistochemical results showed that the duodenum, small intestine and gallbladder expressed ACE2 at high levels; the colon and rectum expressed ACE2 at medium levels; and the oral mucosa, salivary gland, esophagus, stomach, liver and pancreas expressed almost no ACE2. For the urinary and male reproductive tracts, we found that the kidney and testis expressed high levels of ACE2; the seminal vesicle expressed low levels of ACE2; and the urinary bladder, epididymis and prostate expressed almost no ACE2 (Fig. 1b). A similar trend was observed for mRNA expression, with consensus expression in the small intestine, colon, duodenum, kidney and testis ranking in the top 5 (Fig. 1c). In general, there was no big difference in ACE2 expression between men and women across different tissues (Fig. 1d).
Finally, we found that ACE2 expression was mainly restricted to glandular cells and Leydig cells (Table S1) and that peripheral blood cells expressed almost no ACE2 (Fig. S1). Moreover, by analyzing single-cell RNA-seq data through HCL, we found that ACE2 was a marker gene for hepatocytes/endodermal cells and enterocytes. Meanwhile, fetal enterocytes, epithelial cells, proximal tubule progenitors and goblet cells expressed ACE2 at relatively high levels, while fibroblasts and epithelial cells expressed ACE2 at relatively low levels (Table 1).
ACE2 expression by single cell through the human cell landscape
| Cluster | Cell type | Expression level | Tissue sources | Cell number | |
|---|---|---|---|---|---|
| Total | Contribution | ||||
| 15 | Fetal enterocyte | 5.53 | Adult ileum | 3367 | 26 |
| Adult jejunum | 5549 | 22 | |||
| Fetal adrenal gland | 14416 | 1563 | |||
| Fetal intestine | 23516 | 9935 | |||
| Fetal kidney | 22662 | 10 | |||
| Fetal stomach | 7953 | 166 | |||
| 16 | Hepatocyte/ Endodermal cell | 9.08 | Adult jejunum | 5549 | 10 |
| Fetal adrenal gland | 14416 | 1001 | |||
| Fetal intestine | 23516 | 10232 | |||
| Fetal stomach | 7953 | 15 | |||
| 36 | Fibroblast | 1.69 | Adult gallbladder | 14800 | 6797 |
| Adult stomach | 14624 | 47 | |||
| 39 | Enterocyte | 7.39 | Adult duodenum | 4681 | 1504 |
| Adult ileum | 3367 | 1204 | |||
| Adult jejunum | 5549 | 3852 | |||
| Adult transverse colon | 16994 | 13 | |||
| Fetal intestine | 23516 | 11 | |||
| 59 | Epithelial cell | 6.62 | Adult kidney | 22968 | 4396 |
| 81 | Epithelial cell | 2.42 | Adult ascending colon | 2026 | 12 |
| Adult rectum | 5718 | 178 | |||
| Adult sigmoid colon | 3281 | 102 | |||
| Adult transverse colon | 16994 | 1801 | |||
| 83 | Proximal tubule progenitor | 6.48 | Fetal adrenal gland | 14416 | 19 |
| Fetal kidney | 22662 | 1970 | |||
| Fetal male gonad | 13211 | 21 | |||
| 91 | Goblet cell | 6.71 | Adult gallbladder | 14800 | 1202 |
Expression level, log2(clusterMean_TPM+1); Total, the number of cells isolated from the tissue; Contribution, the number of cells belonging to the cluster; TPM, transcripts per million.
Differential expression of ACE2 between cancer and matched normal tissues
First, we found that expressions of ACE2 in cancers of the digestive, urinary or male reproductive tracts were generally higher than that in other cancers (Fig. 2a-c and Table S2).
ACE2 expression levels in human cancers. (a) The protein expressions of ACE2 in cancer tissues, which were ranked by the expression level, as assessed by HPA000288 and CAB026174 antibodies. The y-axis represents the percent of patients (maximum 12 patients) with high or medium expression levels. The data were obtained from the pathology atlas. (b) Overview of RNA expressions in different cancers. The data were obtained from the TCGA dataset in the pathology atlas. (c) Box plot showing the mRNA expression levels of ACE2 in human cancer cell lines from the CCLE database. Within each box, the median is a solid line, while the mean is a dashed line. (d) Bar plot and interactive body map of ACE2 expression levels in cancer samples and matched normal samples through GEPIA (TCGA normal + GTEx normal); each dot represents a sample. (e-j) Boxplot showing ACE2 expressions in human cancer and matched normal tissue (TCGA normal + GTEx normal) (e-g) or in human cancer and adjacent normal tissue (TCGA) (h-j), as obtained using GEPIA. The y-axis represents transformed log2(TPM+1). The |log2FC| cutoff is 0.5 and the p-value cutoff is 0.05. The jitter size is 0.4 (red color: cancer samples; gray color: normal samples). RMA, Robust Multi-array Average; CCLE, Cancer Cell Line Encyclopedia; TPM, transcripts per million; TCGA, The Cancer Genome Atlas; GTEx, Genotype-Tissue Expression; GEPIA, Gene Expression Profiling Interactive Analysis; CHOL, cholangiocarcinoma; COAD, colon adenocarcinoma; ESCA, esophageal carcinoma; LIHC, liver hepatocellular carcinoma; PAAD, pancreatic adenocarcinoma; READ, rectum adenocarcinoma; STAD, stomach adenocarcinoma; BLCA, bladder urothelial carcinoma; KIRC, kidney renal clear cell carcinoma; KIRP, kidney renal papillary cell carcinoma; PRAD, prostate adenocarcinoma; TGCT, testicular germ cell tumor; LUAD, lung adenocarcinoma; LUSC, lung squamous cell carcinoma.
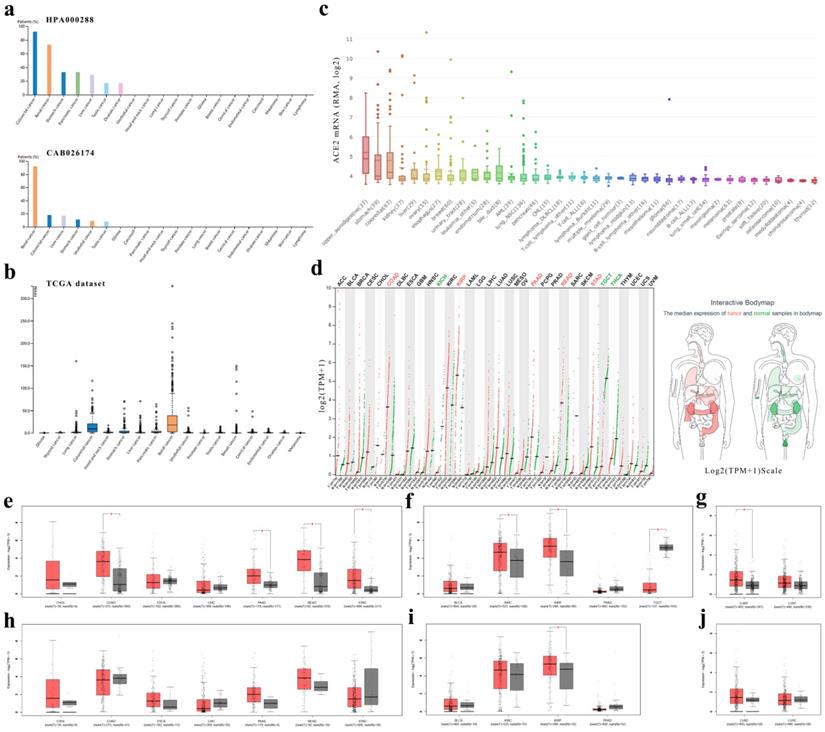
Second, we analyzed the ACE2 mRNA expression profiles across multiple cancer types and matched normal tissues (from both TCGA and GTEx) in GEPIA (Fig. 2d-g) and found that colon adenocarcinoma (COAD), PAAD, rectum adenocarcinoma (READ) and stomach adenocarcinoma (STAD) expressed ACE2 at higher levels than matched normal tissues in the digestive tract; however, there was no statistical significance in cholangiocarcinoma (CHOL), esophageal carcinoma (ESCA) or LIHC (Fig. 2e). In the urinary and male reproductive tracts, ACE2 was expressed at a higher level in KIRC and kidney renal papillary cell carcinoma (KIRP) than in normal kidney, but at a lower level in testicular germ cell tumor (TGCT) than in normal testis; nevertheless, the difference in bladder urothelial carcinoma (BLCA) and prostate adenocarcinoma (PRAD) did not reach statistical significance (Fig. 2f). Additionally, for the respiratory tract, ACE2 expression in lung adenocarcinoma (LUAD) was higher than that in normal lung (Fig. 2g).
In GEPIA, it should be noted that the matched GTEx data for READ were from the healthy colon; and matched GTEx data for ESCA included gastroesophageal junction, mucosa and muscularis. Therefore, we excluded the data in GTEx and found no significant differences between cancer and adjacent normal tissues, except in KIRP, indicating a difference between normal data in TCGA and data in GTEx. In general, the expression level of ACE2 in healthy tissues was lower than that in adjacent normal tissues (Fig. 2e-j). Additionally, by using GEPIA, we found that early-stage tumors tend to express ACE2 at a higher level than advanced tumors in KIRC and KIRP. However, there was no statistically significant difference in the expression level of ACE2 among different stages of other cancer types (Fig. S2).
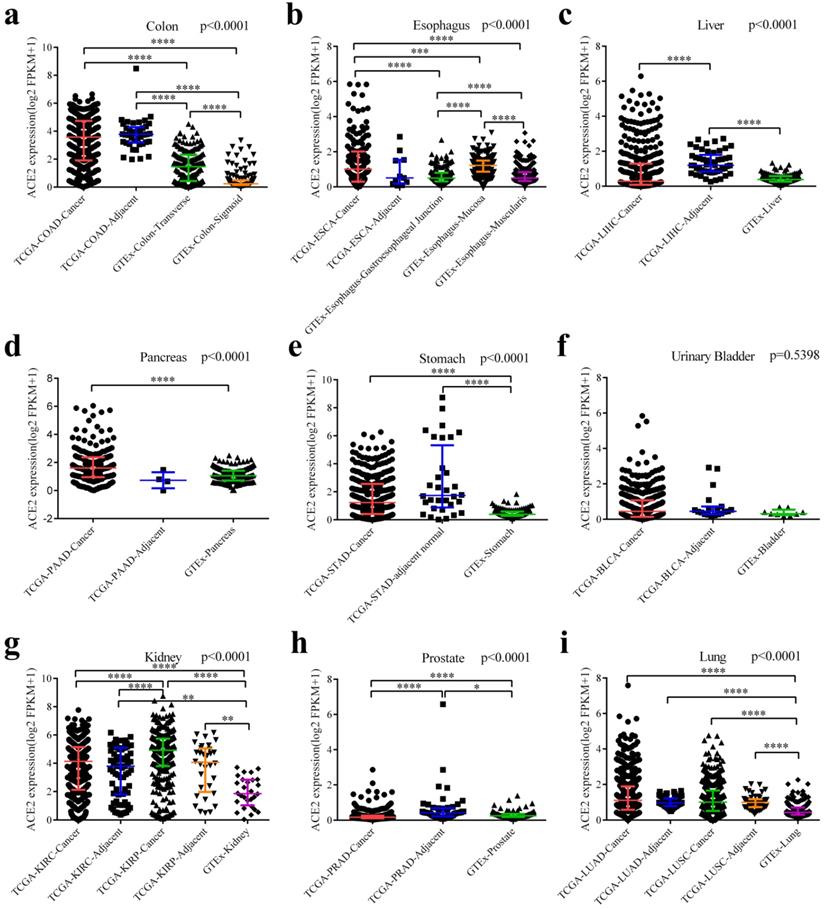
Finally, we downloaded the original data and compared ACE2 expression among cancers (from TCGA), adjacent normal tissues (from TCGA) and healthy tissues (from GTEx). As generally shown in Fig. 3, adjacent normal tissues expressed ACE2 at a different manner than healthy tissues. ACE2 expression in adjacent normal colon was higher than in transverse or sigmoid colon, and these two sections of colon expressed ACE2 at a different level (Fig. 3a). In healthy esophagus, mucosa expressed higher level of ACE2 compared to muscularis (Fig. 3b). Intriguingly, ACE2 expression in adjacent normal liver was higher than both LIHC and healthy liver (Fig. 3c); and a same trend was observed in prostate (Fig. 3h). Both cancers and adjacent normal tissues expressed ACE2 at higher levels than healthy tissues in colon (Fig. 3a), stomach (Fig. 3e), kidney (Fig. 3g) and lung (Fig. 3i). Moreover, we have performed pairwise comparisons between cancers and adjacent normal tissues (Fig. S3), and the results were similar to that in Fig. 3.
Differential expressions of ACE2 among cancers, adjacent normal tissues and healthy tissues. (a) Differential expressions among COAD, adjacent normal colon and healthy colon (including transverse and sigmoid colon). (b) Differential expressions among ESCA, adjacent normal esophagus and healthy esophagus (including gastroesophageal junction, mucosa and muscularis). (c) Differential expressions among LIHC, adjacent normal liver and healthy liver. (d) Differential expressions among PDAC, adjacent normal pancreas and healthy pancreas. (e) Differential expressions among STAD, adjacent normal stomach and healthy stomach. (f) Differential expressions among BLCA, adjacent normal bladder and healthy bladder. (g) Differential expressions among KIRC (together with adjacent normal kidney), KIRP (together with adjacent normal kidney) and healthy kidney. (h) Differential expressions among PRAD, adjacent normal prostate and healthy prostate. (i) Differential expressions among LUAD (together with adjacent normal lung), LUSC (together with adjacent normal lung) and healthy lung. Kruskal-Wallis tests were performed followed by pairwise post-hoc analysis. TCGA, The Cancer Genome Atlas; GTEx, Genotype-Tissue Expression; FPKM, number of fragments per kilobase of exon per million reads; COAD, colon adenocarcinoma; ESCA, esophageal carcinoma; LIHC, liver hepatocellular carcinoma; PAAD, pancreatic adenocarcinoma; STAD, stomach adenocarcinoma; BLCA, bladder urothelial carcinoma; KIRC, kidney renal clear cell carcinoma; KIRP, kidney renal papillary cell carcinoma; PRAD, prostate adenocarcinoma; LUAD, lung adenocarcinoma; LUSC, lung squamous cell carcinoma. **, P < 0.01; ***, P < 0.001; **** P < 0.0001.
ACE2 expression correlated with metabolic and immune-related pathways across multiple cancer types
Through GSEA we identified the enriched KEGG pathways by ACE2. As shown in Fig. 4a, across multiple cancer types, ACE2 expression correlated significantly with metabolic pathways, such as arginine and proline metabolism, ascorbate and aldarate metabolism, butanoate metabolism, drug metabolism-cytochrome P450, and peroxisome. In addition, ACE2 expression correlated significantly with immune-related pathways, such as allograft rejection, antigen processing and presentation, autoimmune thyroid disease, intestinal immune network for IgA production, and primary immunodeficiency.
Enriched pathways and prognostic value of ACE2 expression in multiple cancer types. (a) KEGG pathway analysis was performed using GSEA. The x-axis represents different KEGG pathways (triangles: positively correlated pathways; circles: negatively correlated pathways). (b) Survival significance map of ACE2 showed the survival analysis results, including OS and DFS, across multiple cancer types through GEPIA (the red and blue blocks denote higher and lower risks, respectively; the rectangles with frames indicate significant unfavorable and favorable results). The lower panel shows the Kaplan-Meier plots of OS and DFS in KIRC and LIHC. Median ACE2 expression values were adopted as the cutoff to divide the patients into high-expression and low-expression groups. The log-rank test was used without P-value adjustment. KEGG, Kyoto Encyclopedia of Genes and Genomes; GSEA, gene set enrichment analysis; NES, normalized enrichment score; OS, overall survival; DFS, disease-free survival; HR, hazard ratio; KIRC, kidney renal clear cell carcinoma; LIHC, liver hepatocellular carcinoma. P < 0.05 was considered statistically significant.
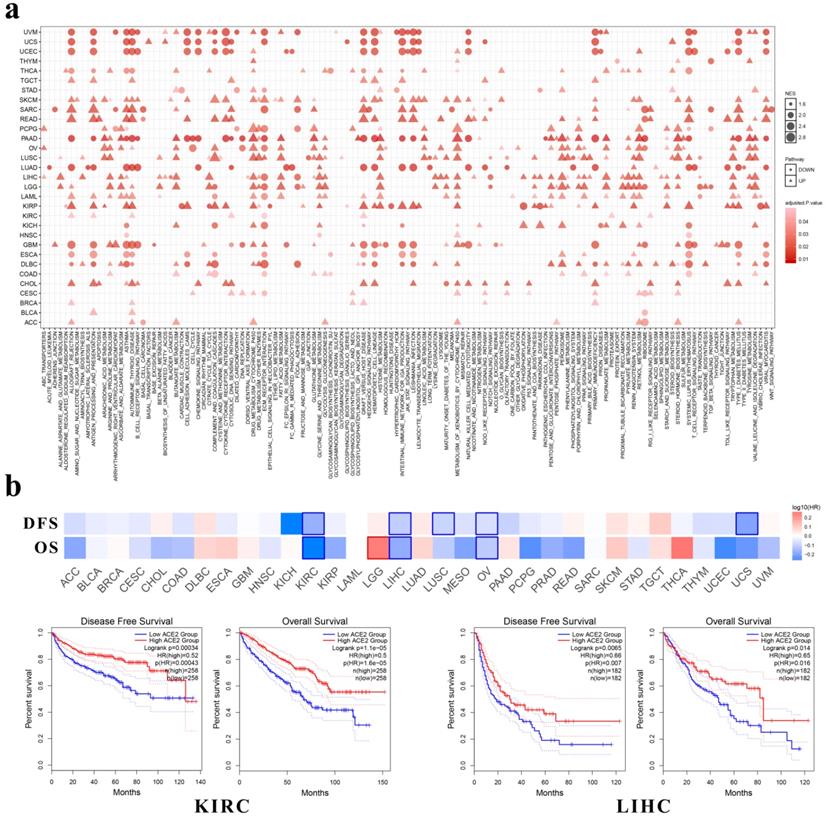
Among these cancers, ACE2 expression correlated positively with immune-related pathways in CHOL, KIRP and READ, whereas it had negative correlations with immune-related pathways in ESCA, PAAD and TGCT. Additionally, in LUAD and lung squamous cell carcinoma (LUSC), we found a negative correlation between ACE2 expression and the olfactory or taste transduction pathways.
Moreover, we investigated the clinical relevance of ACE2 expression through GEPIA and found that the expression of ACE2 was associated with better OS and DFS in KIRC, LIHC (Fig. 4b) and ovarian serous cystadenocarcinoma (OV) patients. In addition, ACE2 expression correlated with better DFS in LUSC and uterine carcinosarcoma (UCS). However, its expression correlated with worse OS in brain lower grade glioma (LGG).
ACE2 expression correlated with immune cell infiltration in both cancer and normal tissues
Based on the above results, the correlation between ACE2 expression and immune infiltration levels was further investigated.
First, as is shown in the heatmap (Fig. S4a), ACE2 was positively and significantly associated with the infiltration of at least two types of immune cells in BLCA, breast invasive carcinoma (BRCA), KIRC, OV, PAAD, PRAD, READ, primary skin cutaneous melanoma (SKCM), thyroid carcinoma (THCA) and uterine corpus endometrial carcinoma (UCEC). However, there were generally negative correlations with immune cell infiltration in COAD, LIHC, LUSC and thymoma (THYM).
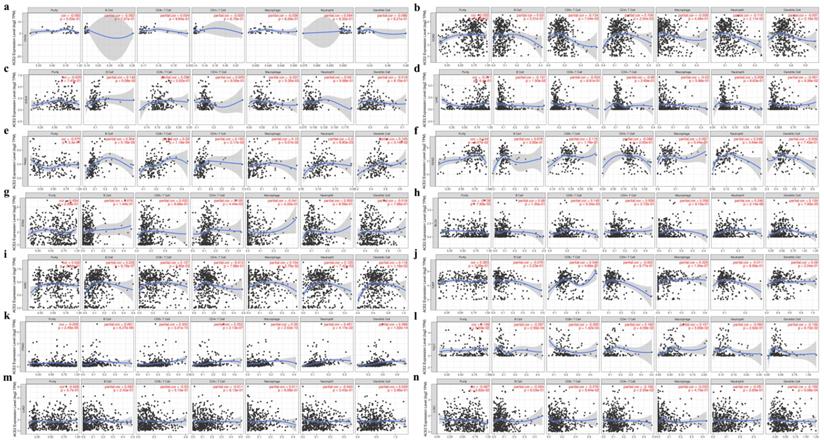
Second, we explored the correlation coefficients in cancers of the digestive, urinary, male reproductive and respiratory tracts. No significant correlation was found in CHOL (Fig. 5a), whereas in other cancers ACE2 expression had a significant correlation with infiltrating immune cells (Fig. 5b-l). Additionally, for lung cancers, we found no significant correlation in LUAD (Fig. 5m and 5n).
Correlation between ACE2 expression and tumor purity or immune infiltration levels in multiple cancer types through TIMER. (a-g) Scatter plots present the correlations between ACE2 expression and tumor purity or immune cell infiltration in CHOL, COAD, ESCA, LIHC, PAAD, READ and STAD (cancers of the digestive tracts). (h-l) Scatter plots present the correlations between ACE2 expression and tumor purity or immune cell infiltration in BLCA, KIRC, KIRP, PRAD and TGCT (cancers of urinary and male reproductive tracts). (m and n) Scatter plots present the correlations between ACE2 expression and tumor purity or immune cell infiltration in lung cancers, including LUAD and LUSC. The x-axis represents the infiltration level. Partial_Cor, purity-adjusted partial Spearman's correlation; CHOL, cholangiocarcinoma; COAD, colon adenocarcinoma; ESCA, esophageal carcinoma; LIHC, liver hepatocellular carcinoma; PAAD, pancreatic adenocarcinoma; READ, rectum adenocarcinoma; STAD, stomach adenocarcinoma; BLCA, bladder urothelial Carcinoma; KIRC, kidney renal clear cell carcinoma; KIRP, kidney renal papillary cell carcinoma; PRAD, prostate adenocarcinoma; TGCT, testicular germ cell tumor; LUAD, lung adenocarcinoma; LUSC, lung squamous cell carcinoma. P < 0.05 was considered statistically significant.
Finally, by using TIMER and GEPIA, we investigated the correlations between ACE2 and related markers of various immune cells, including CD8+ T cell, T cell (general), B cell, monocyte, tumor-associated macrophage (TAM), M1/M2 macrophage, neutrophil, natural killer (NK) cell, dendritic cell (DC), T-helper 1 (Th1) cell, T-helper 2 (Th2) cell, follicular helper T (Tfh) cell, T-helper 17 (Th17) cell, regulatory T cell (Treg) and exhausted T cell. Similar to the results described above, after adjustment for purity, a heatmap in TIMER (Fig. S4b) showed that ACE2 was significantly associated with most immune marker sets in various types of human cancers. We further analyzed the correlation between ACE2 expression and the above immune markers in cancers, including KIRC, PAAD and PRAD, through GEPIA (Table 2), the results were similar to those in TIMER; meanwhile, we found significant correlations in normal tissues (from both TCGA and GTEx).
The correlation analysis between ACE2 and gene markers of immune cells in cancers and match normal tissues through GEPIA
| Description | Gene markers | KIRC | PAAD | PRAD | |||||||||
|---|---|---|---|---|---|---|---|---|---|---|---|---|---|
| Tumor | Normal | Tumor | Normal | Tumor | Normal | ||||||||
| Cor | P | Cor | P | Cor | P | Cor | P | Cor | P | Cor | P | ||
| CD8+ T cell | CD8A | 0.13 | ** | 0.25 | ** | 0.36 | **** | 0.16 | * | 0.41 | **** | 0.32 | **** |
| CD8B | 0.14 | ** | 0.38 | **** | 0.23 | ** | 0.091 | 0.24 | 0.25 | **** | 0.088 | 0.28 | |
| T cell (general) | CD3D | 0.053 | 0.23 | 0.25 | ** | 0.31 | **** | 0.11 | 0.14 | 0.33 | **** | 0.16 | * |
| CD3E | 0.086 | 0.05 | 0.37 | **** | 0.36 | **** | 0.097 | 0.21 | 0.38 | **** | 0.22 | ** | |
| CD2 | 0.12 | ** | 0.34 | **** | 0.37 | **** | 0.13 | 0.093 | 0.39 | **** | 0.22 | ** | |
| B cell | CD19 | -0.15 | *** | 0.075 | 0.35 | 0.15 | 0.052 | 0.17 | * | 0.24 | **** | -0.018 | 0.82 |
| CD79A | -0.11 | * | 0.4 | **** | 0.17 | * | 0.16 | * | 0.25 | **** | 0.086 | 0.29 | |
| Monocyte | CD86 | 0.17 | *** | 0.39 | **** | 0.15 | * | 0.26 | *** | 0.42 | **** | 0.24 | ** |
| CD115 (CSF1R) | 0.12 | ** | 0.43 | **** | 0.24 | ** | 0.2 | ** | 0.41 | **** | 0.19 | * | |
| TAM | CCL2 | 0.29 | **** | -0.16 | 0.05 | 0.21 | ** | 0.23 | ** | 0.36 | **** | 0.12 | 0.15 |
| CD68 | 0.22 | **** | 0.72 | **** | 0.2 | ** | 0.21 | ** | 0.37 | **** | 0.27 | *** | |
| IL10 | 0.047 | 0.29 | 0.1 | 0.2 | 0.11 | 0.13 | 0.37 | **** | 0.3 | **** | 0.32 | **** | |
| M1 Macrophage | INOS (NOS2) | 0.2 | **** | 0.21 | ** | 0.1 | 0.18 | 0.082 | 0.29 | 0.37 | **** | 0.14 | 0.091 |
| IRF5 | 0.28 | *** | -0.55 | **** | 0.081 | 0.28 | 0.19 | * | 0.34 | **** | 0.46 | **** | |
| COX2 (PTGS2) | -0.19 | **** | -0.21 | ** | -0.082 | 0.27 | 0.059 | 0.45 | 0.35 | **** | 0.29 | *** | |
| M2 Macrophage | CD163 | -0.055 | 0.21 | 0.23 | ** | 0.18 | * | 0.4 | **** | 0.26 | **** | 0.29 | *** |
| VSIG4 | -0.022 | 0.62 | 0.3 | *** | 0.15 | * | 0.38 | **** | 0.36 | **** | 0.31 | *** | |
| MS4A4A | 0.048 | 0.27 | 0.43 | **** | 0.19 | * | 0.34 | **** | 0.3 | **** | 0.3 | *** | |
| Neutrophil | CD66b (CEACAM8) | 0.05 | 0.26 | -0.17 | * | 0.22 | ** | 0.016 | 0.83 | 0.095 | * | 0.5 | **** |
| CD11b (ITGAM) | 0.17 | **** | 0.38 | **** | 0.17 | * | 0.27 | *** | 0.42 | **** | 0.24 | ** | |
| CCR7 | 0.019 | 0.67 | 0.21 | ** | 0.27 | *** | 0.38 | **** | 0.34 | **** | 0.5 | **** | |
| Natural killer cell | KIR2DL1 | 0.19 | **** | 0.25 | ** | 0.089 | 0.24 | -0.12 | 0.1 | 0.21 | **** | 0.036 | 0.66 |
| KIR2DL3 | 0.17 | *** | 0.28 | *** | 0.093 | 0.22 | 0.068 | 0.37 | 0.1 | * | 0.17 | * | |
| KIR2DL4 | 0.066 | 0.13 | 0.13 | * | 0.055 | 0.46 | 0.13 | 0.1 | 0.16 | **** | 0.096 | 0.24 | |
| KIR3DL1 | 0.21 | **** | 0.27 | *** | 0.001 | 1 | 0.096 | 0.21 | 0.093 | * | -0.003 | 0.97 | |
| KIR3DL2 | 0.17 | **** | 0.2 | * | 0.24 | *** | -0.069 | 0.37 | 0.14 | ** | 0.17 | * | |
| KIR3DL3 | -0.078 | 0.07 | 0.055 | 0.5 | 0.11 | 0.14 | -0.053 | 0.49 | 0.092 | * | 0.01 | 0.9 | |
| KIR2DS4 | 0.11 | * | 0.13 | 0.11 | -0.017 | 0.82 | 0.012 | 0.87 | 0.15 | *** | 0.17 | * | |
| Dendritic cell | HLA-DPB1 | 0.25 | **** | 0.14 | 0.082 | 0.28 | *** | 0.12 | 0.13 | 0.38 | **** | -0.023 | 0.78 |
| HLA-DQB1 | 0.16 | *** | -0.031 | 0.7 | 0.16 | * | -0.052 | 0.5 | 0.26 | **** | 0.074 | 0.37 | |
| HLA-DRA | 0.27 | **** | 0.13 | 0.095 | 0.27 | *** | 0.11 | 0.14 | 0.43 | **** | 0.11 | 0.16 | |
| HLA-DPA1 | 0.29 | **** | 0.16 | * | 0.26 | *** | 0.053 | 0.5 | 0.4 | **** | -0.021 | 0.8 | |
| BDCA-1 (CD1C) | 0.21 | **** | 0.41 | **** | 0.42 | **** | 0.076 | 0.32 | 0.4 | **** | 0.039 | 0.63 | |
| BDCA-4 (NRP1) | 0.25 | **** | 0.53 | **** | 0.21 | ** | 0.19 | * | 0.26 | **** | 0.079 | 0.33 | |
| CD11c (ITGAX) | 0.041 | 0.35 | 0.17 | * | 0.12 | 0.099 | 0.15 | 0.053 | 0.36 | **** | 0.11 | 0.19 | |
| Th1 | T-bet (TBX21) | 0.11 | * | 0.26 | *** | 0.3 | **** | 0.14 | 0.077 | 0.37 | **** | 0.26 | ** |
| STAT4 | 0.018 | 0.68 | 0.064 | 0.43 | 0.26 | *** | 0.18 | * | 0.42 | **** | 0.14 | 0.089 | |
| STAT1 | 0.23 | **** | -0.14 | 0.086 | 0.18 | * | 0.12 | 0.12 | 0.36 | **** | 0.17 | * | |
| IFN-g (IFNG) | 0.08 | 0.07 | 0.006 | 0.94 | 0.084 | 0.26 | -0.013 | 0.86 | 0.27 | **** | 0.069 | 0.4 | |
| TNF-a (TNF) | 0.073 | 0.09 | -0.18 | * | 0.13 | 0.076 | 0.26 | *** | 0.35 | **** | 0.28 | *** | |
| Th2 | GATA3 | -0.17 | *** | -0.35 | **** | -0.09 | 0.23 | 0.24 | ** | 0.48 | **** | 0.34 | **** |
| STAT6 | 0.26 | **** | -0.21 | ** | 0.32 | **** | 0.17 | * | 0.27 | **** | 0.19 | * | |
| STAT5A | 0.2 | **** | 0.23 | ** | 0.24 | ** | 0.27 | *** | 0.44 | **** | 0.31 | **** | |
| IL13 | -0.041 | 0.35 | -0.087 | 0.28 | -0.07 | 0.35 | 0.06 | 0.43 | 0.13 | ** | 0.11 | 0.17 | |
| Tfh | BCL6 | 0.01 | 0.82 | -0.52 | **** | 0.17 | * | 0.17 | * | 0.29 | **** | 0.26 | ** |
| IL21 | -0.032 | 0.47 | 0.18 | * | 0.099 | 0.19 | -0.028 | 0.72 | 0.18 | **** | -0.018 | 0.82 | |
| Th17 | STAT3 | 0.22 | **** | -0.19 | * | 0.26 | *** | 0.13 | 0.08 | 0.42 | **** | 0.24 | ** |
| IL17A | -0.015 | 0.73 | -0.042 | 0.6 | 0.16 | * | 0.051 | 0.51 | 0.23 | **** | 0.23 | ** | |
| Treg | FOXP3 | -0.13 | ** | -0.08 | 0.32 | 0.2 | ** | 0.18 | * | 0.29 | **** | 0.22 | ** |
| CCR8 | 0.06 | 0.17 | 0.42 | **** | 0.23 | ** | 0.008 | 0.91 | 0.27 | **** | 0.15 | 0.063 | |
| STAT5B | 0.41 | **** | 0.25 | ** | 0.22 | ** | 0.23 | ** | 0.33 | **** | 0.15 | 0.06 | |
| TGFb (TGFB1) | -0.27 | **** | -0.43 | **** | -0.11 | 0.15 | 0.096 | 0.21 | 0.37 | **** | 0.19 | * | |
| T cell exhaustion | PD-1 (PDCD1) | 0.062 | 0.16 | 0.34 | **** | 0.26 | *** | 0.14 | 0.067 | 0.31 | **** | 0.22 | ** |
| CTLA4 | 0.033 | 0.45 | 0.13 | 0.096 | 0.2 | ** | 0.14 | 0.067 | 0.26 | **** | 0.23 | ** | |
| LAG3 | 0.036 | 0.41 | -0.53 | **** | 0.095 | 0.21 | 0.13 | 0.098 | 0.24 | **** | 0.097 | 0.23 | |
| TIM-3 (HAVCR2) | 0.37 | **** | 0.82 | **** | 0.15 | 0.051 | 0.24 | ** | 0.42 | **** | 0.3 | *** | |
| GZMB | -0.0091 | 0.84 | 0.29 | *** | 0.15 | 0.05 | -0.01 | 0.9 | 0.39 | **** | 0.21 | ** | |
KIRC, kidney renal clear cell carcinoma; PAAD, pancreatic adenocarcinoma; PRAD, prostate adenocarcinoma; Cor, R value of Spearman's correlation; TAM, tumor-associated macrophage; Th1, T-helper 1; Th2, T-helper 2; Tfh, follicular helper T; Th17, T-helper 17; Treg, regulatory T cell. *, p < 0.05; **, p < 0.01; ***, p < 0.001; ****, p < 0.0001.
Therefore, we extended this analysis to other normal tissues (Table 3). Similar to the results in cancer tissues, the correlations were also tissue type-dependent, with high correlation coefficients in the normal stomach and colon, which were even higher than those in corresponding cancer tissues. Whereas, there was almost no statistically significant correlation in bladder.
The correlation analysis between ACE2 and gene markers of immune cells in normal tissues through GEPIA
| Description | Gene markers | Lung | Esophagus | Stomach | Colon | Liver | Bladder | Testis | |||||||
|---|---|---|---|---|---|---|---|---|---|---|---|---|---|---|---|
| Cor | P | Cor | P | Cor | P | Cor | P | Cor | P | Cor | P | Cor | P | ||
| CD8+ T cell | CD8A | -0.16 | ** | 0.26 | **** | 0.27 | **** | 0.68 | **** | 0.23 | ** | 0.15 | 0.44 | 0.033 | 0.68 |
| CD8B | -0.12 | * | 0.23 | **** | 0.26 | *** | 0.67 | **** | 0.23 | ** | 0.19 | 0.34 | 0.015 | 0.84 | |
| T cell (general) | CD3D | -0.14 | ** | 0.34 | **** | 0.33 | **** | 0.68 | **** | 0.25 | ** | 0.14 | 0.48 | 0.056 | 0.48 |
| CD3E | -0.014 | 0.78 | 0.34 | **** | 0.37 | **** | 0.72 | **** | 0.31 | **** | 0.14 | 0.48 | -0.28 | *** | |
| CD2 | 0.004 | 0.93 | 0.37 | **** | 0.36 | **** | 0.69 | **** | 0.3 | *** | 0.13 | 0.5 | -0.57 | **** | |
| B cell | CD19 | -0.21 | **** | 0.018 | 0.76 | 0.3 | **** | 0.51 | **** | -0.014 | 0.86 | -0.31 | 0.11 | -0.5 | **** |
| CD79A | 0.043 | 0.4 | 0.18 | ** | 0.32 | **** | 0.74 | **** | 0.26 | *** | -0.057 | 0.77 | 0.017 | 0.82 | |
| Monocyte | CD86 | 0.2 | **** | 0.21 | *** | 0.58 | **** | 0.44 | **** | 0.17 | * | 0.039 | 0.84 | -0.3 | *** |
| CD115 (CSF1R) | 0.12 | * | 0.16 | ** | 0.42 | **** | 0.13 | * | 0.095 | 0.23 | -0.022 | 0.91 | 0.24 | ** | |
| TAM | CCL2 | -0.2 | **** | -0.26 | **** | 0.16 | * | -0.49 | **** | 0.012 | 0.88 | -0.16 | 0.43 | 0.32 | **** |
| CD68 | 0.45 | **** | 0.48 | **** | 0.66 | **** | 0.62 | **** | 0.066 | 0.41 | 0.48 | ** | 0.22 | ** | |
| IL10 | 0.088 | 0.08 | 0.28 | **** | 0.36 | **** | 0.11 | * | -0.083 | 0.3 | 0.14 | 0.47 | -0.47 | **** | |
| M1 Macrophage | INOS (NOS2) | -0.24 | **** | 0.055 | 0.36 | 0.31 | **** | 0.73 | **** | 0.35 | **** | -0.12 | 0.54 | 0.23 | ** |
| IRF5 | -0.1 | * | 0.059 | 0.32 | 0.48 | **** | 0.46 | **** | -0.12 | 0.13 | 0.41 | * | 0.28 | *** | |
| COX2 (PTGS2) | -0.18 | *** | -0.39 | **** | 0.11 | 0.11 | -0.6 | **** | 0.016 | 0.84 | -0.05 | 0.8 | 0.19 | * | |
| M2 Macrophage | CD163 | 0.32 | **** | 0.3 | **** | 0.13 | 0.06 | 0.039 | 0.47 | -0.002 | 0.98 | -0.16 | 0.4 | 0.28 | *** |
| VSIG4 | 0.4 | **** | 0.34 | **** | 0.34 | **** | 0.18 | *** | 0.024 | 0.77 | -0.17 | 0.37 | 0.28 | *** | |
| MS4A4A | 0.33 | **** | 0.29 | **** | 0.33 | **** | 0.18 | *** | 0.078 | 0.32 | -0.19 | 0.32 | 0.3 | **** | |
| Neutrophil | CD66b (CEACAM8) | -0.11 | * | -0.13 | * | 0.086 | 0.21 | 0.66 | **** | -0.056 | 0.48 | 0.15 | 0.44 | -0.15 | 0.05 |
| CD11b (ITGAM) | -0.048 | 0.34 | 0.13 | * | 0.27 | **** | -0.33 | **** | -0.2 | ** | -0.16 | 0.41 | 0.3 | **** | |
| CCR7 | 0.026 | 0.6 | 0.091 | 0.12 | 0.51 | **** | 0.29 | **** | -0.19 | * | 0.24 | 0.21 | 0.22 | ** | |
| Natural killer cell | KIR2DL1 | -0.24 | **** | -0.07 | 0.24 | 0.16 | * | 0.11 | * | 0.034 | 0.67 | 0.31 | 0.11 | 0.015 | 0.85 |
| KIR2DL3 | -0.21 | **** | -0.021 | 0.72 | 0.32 | **** | 0.3 | **** | 0.07 | 0.38 | 0.35 | 0.07 | 0.16 | * | |
| KIR2DL4 | -0.16 | ** | 0.014 | 0.82 | 0.47 | **** | 0.76 | **** | -0.1 | 0.2 | 0.54 | ** | -0.081 | 0.3 | |
| KIR3DL1 | -0.11 | * | -0.12 | 0.05 | 0.2 | ** | 0.3 | **** | 0.013 | 0.87 | 0.23 | 0.24 | -0.001 | 0.99 | |
| KIR3DL2 | -0.05 | 0.32 | 0.05 | 0.4 | 0.26 | *** | 0.52 | **** | 0.12 | 0.13 | 0.37 | 0.05 | 0.014 | 0.86 | |
| KIR3DL3 | -0.096 | 0.06 | 0.12 | 0.05 | 0.13 | 0.06 | 0.32 | **** | 0.089 | 0.26 | -0.12 | 0.56 | 0.059 | 0.45 | |
| KIR2DS4 | -0.2 | **** | -0.11 | 0.06 | 0.21 | ** | 0.23 | **** | 0.11 | 0.18 | 0.21 | 0.29 | -0.15 | 0.06 | |
| Dendritic cell | HLA-DPB1 | 0.2 | **** | 0.034 | 0.57 | 0.59 | **** | 0.25 | **** | 0.37 | **** | 0.077 | 0.7 | 0.41 | **** |
| HLA-DQB1 | -0.016 | 0.75 | -0.1 | 0.08 | 0.39 | **** | 0.16 | ** | 0.23 | ** | 0.091 | 0.64 | -0.056 | 0.48 | |
| HLA-DRA | 0.24 | **** | 0.15 | * | 0.63 | **** | 0.35 | **** | 0.36 | **** | 0.12 | 0.55 | 0.34 | **** | |
| HLA-DPA1 | 0.23 | **** | 0.094 | 0.11 | 0.58 | **** | 0.29 | **** | 0.32 | **** | 0.12 | 0.56 | 0.29 | *** | |
| BDCA-1 (CD1C) | 0.099 | * | 0.26 | **** | 0.43 | **** | 0.064 | 0.23 | 0.32 | **** | 0.09 | 0.65 | -0.17 | * | |
| BDCA-4 (NRP1) | -0.15 | ** | -0.23 | *** | 0.26 | *** | -0.55 | **** | -0.06 | 0.45 | -0.15 | 0.46 | 0.4 | **** | |
| CD11c (ITGAX) | -0.43 | **** | -0.15 | * | 0.22 | ** | -0.19 | *** | -0.28 | *** | 0.019 | 0.92 | 0.23 | ** | |
| Th1 | T-bet (TBX21) | -0.4 | **** | 0.089 | 0.13 | 0.17 | * | 0.51 | **** | 0.13 | 0.1 | 0.28 | 0.15 | 0.22 | ** |
| STAT4 | -0.49 | **** | 0.004 | 0.95 | 0.16 | * | 0.3 | **** | -0.13 | 0.11 | 0.3 | 0.12 | -0.51 | **** | |
| STAT1 | 0.039 | 0.43 | 0.18 | ** | 0.51 | **** | -0.075 | 0.16 | 0.14 | 0.075 | 0.012 | 0.95 | 0.4 | **** | |
| IFN-g (IFNG) | -0.37 | **** | 0.001 | 0.98 | 0.21 | ** | 0.22 | **** | 0.24 | ** | 0.27 | 0.16 | 0.015 | 0.85 | |
| TNF-a (TNF) | -0.23 | **** | 0.21 | *** | 0.38 | **** | 0.26 | **** | 0.077 | 0.33 | -0.074 | 0.71 | 0.15 | 0.06 | |
| Th2 | GATA3 | -0.21 | **** | 0.24 | **** | 0.5 | **** | 0.51 | **** | 0.19 | * | 0.32 | 0.1 | 0.19 | * |
| STAT6 | -0.29 | **** | -0.13 | * | 0.28 | **** | -0.28 | **** | -0.3 | **** | 0.21 | 0.27 | 0.4 | **** | |
| STAT5A | -0.31 | **** | -0.17 | ** | 0.28 | **** | -0.55 | **** | -0.28 | *** | -0.38 | * | 0.35 | **** | |
| IL13 | -0.11 | * | -0.13 | * | -0.032 | 0.64 | -0.26 | **** | 0.18 | * | -0.087 | 0.66 | -0.56 | **** | |
| Tfh | BCL6 | -0.26 | **** | 0.07 | 0.24 | 0.043 | 0.54 | -0.57 | **** | -0.43 | **** | -0.11 | 0.58 | 0.2 | * |
| IL21 | 0.041 | 0.42 | 0.19 | ** | 0.28 | **** | 0.35 | **** | 0.15 | 0.06 | -0.088 | 0.66 | -0.44 | **** | |
| Th17 | STAT3 | -0.11 | * | 0.14 | * | 0.28 | **** | -0.34 | **** | -0.43 | **** | -0.1 | 0.6 | 0.52 | **** |
| IL17A | -0.11 | * | 0.2 | *** | 0.43 | **** | 0.44 | **** | -0.015 | 0.85 | -0.028 | 0.89 | -0.042 | 0.6 | |
| Treg | FOXP3 | 0.13 | * | 0.36 | **** | 0.48 | **** | 0.63 | **** | 0.46 | **** | 0.24 | 0.23 | 0.18 | * |
| CCR8 | 0.044 | 0.38 | 0.22 | *** | 0.44 | **** | 0.47 | **** | 0.067 | 0.4 | 0.31 | 0.11 | -0.037 | 0.64 | |
| STAT5B | -0.41 | **** | -0.21 | *** | 0.089 | 0.2 | -0.7 | **** | -0.3 | **** | -0.35 | 0.06 | -0.033 | 0.67 | |
| TGFb (TGFB1) | -0.41 | **** | 0.032 | 0.59 | 0.42 | **** | -0.62 | **** | 0.022 | 0.78 | -0.064 | 0.75 | 0.48 | **** | |
| T cell exhaustion | PD-1 (PDCD1) | -0.2 | **** | 0.25 | **** | 0.29 | **** | 0.56 | **** | 0.13 | 0.09 | 0.029 | 0.88 | 0.13 | 0.11 |
| CTLA4 | -0.29 | **** | 0.25 | **** | 0.34 | **** | 0.35 | **** | 0.22 | ** | 0.19 | 0.33 | 0.29 | *** | |
| LAG3 | -0.39 | **** | -0.14 | * | 0.41 | **** | -0.34 | **** | 0.2 | ** | 0.011 | 0.96 | 0.33 | **** | |
| TIM-3 (HAVCR2) | 0.008 | 0.87 | 0.2 | *** | 0.5 | **** | 0.32 | **** | 0.007 | 0.93 | 0.045 | 0.82 | -0.27 | *** | |
| GZMB | -0.24 | **** | 0.03 | 0.61 | 0.4 | **** | 0.51 | **** | 0.1 | 0.2 | 0.2 | 0.3 | 0.1 | 0.2 | |
Cor, R value of Spearman's correlation; TAM, tumor-associated macrophage; Th1, T-helper 1; Th2, T-helper 2; Tfh, follicular helper T; Th17, T-helper 17; Treg, regulatory T cell. *, p < 0.05; **, p < 0.01; ***, p < 0.001; ****, p < 0.0001.
Discussion
The worldwide outbreak of COVID-19 has been a severe challenge for public health and the economy, exploring the susceptibility to COVID-19 and its severity in the population is of paramount importance.
In this study, we found that glandular cells in the digestive, urinary and male reproductive tracts expressed ACE2 at high levels (Fig. 1), which is generally consistent with the findings of previous studies [4, 5]. In contrast, blood cells expressed almost no ACE2 (Fig. S1), although others demonstrated that classical monocytes (CD14++CD16-) expressed ACE2 at a relatively high level [28]. Moreover, by analyzing single-cell RNA-seq data through HCL, we found that ACE2-expressing cells were mainly from the fetal intestine, fetal adrenal gland, fetal kidney, adult intestine, adult kidney and adult gallbladder (Table 1). Others have detected SARS-CoV-2 IgM antibodies in neonatal sera samples that were collected at birth [29]. These results raised the possibility of fecal-oral and maternal-fetal transmission of SARS-CoV-2, which needs to be further validated [30]. In addition, SARS-CoV-2 may infect other tissues besides the lung or persist in extrapulmonary tissues even after the cure of pneumonia [31]. Other studies reported that the characteristics of pediatric SARS-CoV-2 infection differed from those of adult patients, with pediatric patients having milder respiratory symptoms but demonstrating persistently positive rectal swabs, even after the nasopharyngeal testing was negative [31, 32], which could be ascribed to the high expression of ACE2 in the gastrointestinal tracts in children.
Cancer is a disorder with immune dysfunction [11], and cancer patients are more susceptible to infections. In this study, we found that ACE2 was expressed at a high level in cancers of the digestive and urinary tracts; and ACE2 expressions in COAD, PAAD, STAD, KIRC, KIRP and LUAD were higher than that in matched normal tissues (including TCGA and GTEx data; Fig. 2). The results were generally same as other study [33]. In addition, others have indicated that adjacent normal tissues presented a unique intermediate state between healthy and tumor [34]; in this study, we found that the ACE2 expression level in adjacent normal tissues was generally higher than that in healthy tissues (Fig. 3). For example, other research has found that adjacent mucous membrane from COAD expressed ACE2 at a higher level than normal mucous membrane from healthy individuals [35]. Moreover, sigmoid and transverse colons expressed ACE2 at different levels. These abovementioned results indicated that it was inappropriate to combine adjacent normal tissues (TCGA) and healthy tissues (GTEx) for comparison of ACE2 expression between tumor and normal tissues; and that cancer patients could be more susceptible to SARS-CoV-2 infection [14, 15], possibly through respiratory or digestive routes.
GSEA demonstrated that ACE2 was widely associated with immune-related signaling pathways (Fig. 4a). On the one hand, SARS-CoV-2 has been reported to be associated with lymphopenia (especially in severe cases [6, 8]) and the infiltration of a large number of immune cells at infection sites [3, 10]. On the other hand, cancer patients harbor dysfunctional immune cells in both the peripheral blood and inflammatory TME [11]. Nevertheless, the correlation among SARS-CoV-2, cancer and immune infiltration has not been fully described. First, we found no significant correlation with tumor purity, except in BLCA and PRAD (Fig. 5), which could be explained by ACE2 expression in stromal cells, such as myofibroblasts and vascular cells [5]. Intriguingly, we found that ACE2 expression correlated significantly with different immune cell infiltration in various tumor tissues, especially in PAAD, KIRC and PRAD, but not in CHOL or LUAD (Fig. 5) [36].
For cancer patients, once infection occurred either in the lung or the cancer, immune cells, including T cell, monocyte and macrophage [3, 9], were mobilized rapidly into the sites of infection to clear SARS-CoV-2, which could partially explain the lymphopenia and decreased monocytes in blood [8]. Until now, conclusions about the severity of COVID-19 in cancer patients, when compared with the general population, have been controversial in different studies with small sample sizes [14, 15]. Considering that immune cells in cancer patients are generally blunt, we postulated that COVID-19 in cancer patients would be more prolonged than in the general population.
Intriguingly, we found that ACE2 expression correlated significantly with the gene markers of various immune cells in normal tissues (Table 2 and Table 3). The immune infiltration levels among healthy tissues, adjacent normal tissues and cancers were different [35, 37, 38]. Inflammatory response-related pathways were enriched in the adjacent normal tissues in most tissue types [34], and cancers such as STAD, LIHC, COAD and PAAD correlated significantly with chronic inflammation [39]. Based on above results (Fig. 4, Fig. 5, Table 2 and Table 3), this immune infiltration pattern could partially explain the results that ACE2 expression in cancers or adjacent normal tissues was generally higher than that in healthy tissues (Fig. 3). As for differential ACE2 expression between cancers and adjacent normal tissues (Fig. 3 and Fig. S3), LIHC expressed ACE2 at a lower level than adjacent normal liver (Fig. 3c and Fig. S3c) [17], which may be related to the lower infiltration of immune cells in the cancer tissue, when compared with adjacent normal liver tissue [40]. Similarly, PARD and PAAD were classified as immunologically “cold” with low immune cell infiltration [41, 42], which may contribute to the low cancerous ACE2 expression (Fig. 3h and Fig. S3h) [18]; however, we found no significant difference in ACE2 expression between PAAD and adjacent normal pancreas (Fig. 3d and Fig. S3d), the discrepancy may be attributable to the small sample size of adjacent normal pancreas in our study (n = 4). ACE2 expression correlated with almost no gene markers of immune cells in bladder (Table 3), and there were no significant differences among BLCA, adjacent and normal bladders (Fig. 3). Therefore, we supposed that inflammation would increase ACE2 expression [43, 44], thus rendering people more susceptible to SARS-CoV-2. Similarly, others suggested that patients with inflammatory bowel disease (IBD) might be at an increased risk of SARS-CoV-2 infection [45].
It should be noted that other molecules have also been identified for host cell entry [2]. In addition, although others reported that ACE2 protein and mRNA levels were strongly correlated [44], we analyzed only the mRNA expression of ACE2, but not the cell-surface expression. Since our data were from public databases and there were limited biopsy samples in other studies, whether SARS-CoV-2 could infect other tissues, such as cancers, merits further study. The predominant immune cells varied across different cancer types, therefore, the correlation between ACE2 expression and immune infiltration needs experimental evidences.
Conclusions
In this study, we provided evidence for the tissue tropism of SARS-CoV-2 in both the adult and the fetus, although no reliable evidence is available to support the intrauterine infection caused by vertical transmission. Moreover, ACE2 expressions in COAD, ESCA, PAAD, STAD, KIRC, KIRP, LUAD and LUSC were higher than that in matched healthy tissues, providing a molecular rationale explaining why cancer patients could be more susceptible to SARS-CoV-2. In addition, we revealed a link between ACE2 expression and immune cell infiltration and indicated that adjacent normal tissues generally expressed ACE2 at higher levels than healthy tissues. Therefore, more intensive surveillance should be considered for respiratory and fecal-oral transmission in the patients with inflammation or cancers, and the immune response of cancer patients. Further investigation on the susceptibility to and severity of COVID-19 in cancer patients is urgently needed.
Abbreviations
ACE2: angiotensin-converting enzyme 2; BLCA: bladder urothelial carcinoma; BRCA: breast invasive carcinoma; CCLE: Cancer Cell Line Encyclopedia; CHOL: cholangiocarcinoma; COAD: colon adenocarcinoma; COVID-19: coronavirus disease 2019; DC: dendritic cell; DFS: disease-free survival; ESCA: esophageal carcinoma; FPKM: number of fragments per kilobase of exon per million reads; GEPIA: Gene Expression Profiling Interactive Analysis; GSEA: gene set enrichment analysis; GTEx: Genotype-Tissue Expression; HCL: human cell landscape; HPA: Human Protein Atlas; HR: hazard ratio; IBD: inflammatory bowel disease; KEGG: Kyoto Encyclopedia of Genes and Genomes; KIRC: kidney renal clear cell carcinoma; KIRP: kidney renal papillary cell carcinoma; LGG: brain lower grade glioma; LIHC: liver hepatocellular carcinoma; LUAD: lung adenocarcinoma; LUSC: lung squamous cell carcinoma; NES: normalized enrichment score; NK: natural killer; NX: consensus normalized expression; OS: overall survival; OV: ovarian serous cystadenocarcinoma; PAAD: pancreatic adenocarcinoma; Partial_Cor: purity-adjusted partial Spearman's correlation; PBMC: peripheral blood mononuclear cells; PRAD: prostate adenocarcinoma; pTPM: protein-coding transcripts per million; READ: rectum adenocarcinoma; RMA: Robust Multi‑array Average; SARS-CoV-2: severe acute respiratory syndrome coronavirus 2; SKCM: skin cutaneous melanoma; STAD: stomach adenocarcinoma; TAM: tumor associated macrophage; TCGA: The Cancer Genome Atlas; Tfh: follicular helper T; TGCT: testicular germ cell tumor; Th1: T-helper 1; Th2: T-helper 2; Th17: T-helper 17; THCA: thyroid carcinoma; THYM: thymoma; TIMER: Tumor Immune Estimation Resource; TME: tumor microenvironment; TPM: transcripts per million; Treg: regulatory T cell; UCEC: uterine corpus endometrial carcinoma; UCS: uterine carcinosarcoma; WHO: World Health Organization.
Supplementary Material
Supplementary figures and tables.
Acknowledgements
This work was supported by grants from the National Natural Science Foundation of China (No. 81672390) and the National Key Research and Development Plan (No. 2017YFC0910002).
Competing Interests
The authors have declared that no competing interest exists.
References
1. Lu R, Zhao X, Li J, Niu P, Yang B, Wu H. et al. Genomic characterisation and epidemiology of 2019 novel coronavirus: implications for virus origins and receptor binding. Lancet (London, England). 2020;395:565-74
2. Hoffmann M, Kleine-Weber H, Schroeder S, Kruger N, Herrler T, Erichsen S. et al. SARS-CoV-2 Cell Entry Depends on ACE2 and TMPRSS2 and Is Blocked by a Clinically Proven Protease Inhibitor. Cell. 2020;181:271-80 e8
3. Xu Z, Shi L, Wang Y, Zhang J, Huang L, Zhang C. et al. Pathological findings of COVID-19 associated with acute respiratory distress syndrome. The Lancet Respiratory medicine. 2020;8:420-2
4. Harmer D, Gilbert M, Borman R, Clark KL. Quantitative mRNA expression profiling of ACE 2, a novel homologue of angiotensin converting enzyme. FEBS letters. 2002;532:107-10
5. Hamming I, Timens W, Bulthuis ML, Lely AT, Navis G, van Goor H. Tissue distribution of ACE2 protein, the functional receptor for SARS coronavirus. A first step in understanding SARS pathogenesis. J Pathol. 2004;203:631-7
6. Guan WJ, Ni ZY, Hu Y, Liang WH, Ou CQ, He JX. et al. Clinical Characteristics of Coronavirus Disease 2019 in China. The New England journal of medicine. 2020;382:1708-20
7. Ni L, Ye F, Cheng ML, Feng Y, Deng YQ, Zhao H. et al. Detection of SARS-CoV-2-Specific Humoral and Cellular Immunity in COVID-19 Convalescent Individuals. Immunity. 2020;52:971-7 e3
8. Qin C, Zhou L, Hu Z, Zhang S, Yang S, Tao Y. et al. Dysregulation of immune response in patients with COVID-19 in Wuhan, China. Clin Infect Dis. 2020
9. Merad M, Martin JC. Pathological inflammation in patients with COVID-19: a key role for monocytes and macrophages. Nature reviews Immunology. 2020;20:355-62
10. Yao XH, Li TY, He ZC, Ping YF, Liu HW, Yu SC. et al. [A pathological report of three COVID-19 cases by minimal invasive autopsies]. Zhonghua bing li xue za zhi = Chinese journal of pathology. 2020;49:411-7
11. Critchley-Thorne RJ, Simons DL, Yan N, Miyahira AK, Dirbas FM, Johnson DL. et al. Impaired interferon signaling is a common immune defect in human cancer. Proceedings of the National Academy of Sciences of the United States of America. 2009;106:9010-5
12. Sica A, Massarotti M. Myeloid suppressor cells in cancer and autoimmunity. Journal of autoimmunity. 2017;85:117-25
13. Fridman WH, Pages F, Sautes-Fridman C, Galon J. The immune contexture in human tumours: impact on clinical outcome. Nature reviews Cancer. 2012;12:298-306
14. Liang W, Guan W, Chen R, Wang W, Li J, Xu K. et al. Cancer patients in SARS-CoV-2 infection: a nationwide analysis in China. The Lancet Oncology. 2020;21:335-7
15. Yu J, Ouyang W, Chua MLK, Xie C. SARS-CoV-2 Transmission in Patients With Cancer at a Tertiary Care Hospital in Wuhan, China. JAMA oncology. 2020
16. Xia Y, Jin R, Zhao J, Li W, Shen H. Risk of COVID-19 for patients with cancer. The Lancet Oncology. 2020;21:e180
17. Ye G, Qin Y, Lu X, Xu X, Xu S, Wu C. et al. The association of renin-angiotensin system genes with the progression of hepatocellular carcinoma. Biochem Biophys Res Commun. 2015;459:18-23
18. Zhou L, Zhang R, Zhang L, Yao W, Li J, Yuan Y. Angiotensin-converting enzyme 2 acts as a potential molecular target for pancreatic cancer therapy. Cancer letters. 2011;307:18-25
19. Errarte P, Beitia M, Perez I, Manterola L, Lawrie CH, Solano-Iturri JD. et al. Expression and activity of angiotensin-regulating enzymes is associated with prognostic outcome in clear cell renal cell carcinoma patients. PloS one. 2017;12:e0181711
20. Uhlen M, Fagerberg L, Hallstrom BM, Lindskog C, Oksvold P, Mardinoglu A. et al. Proteomics. Tissue-based map of the human proteome. Science (New York, NY). 2015;347:1260419
21. Barretina J, Caponigro G, Stransky N, Venkatesan K, Margolin AA, Kim S. et al. The Cancer Cell Line Encyclopedia enables predictive modelling of anticancer drug sensitivity. Nature. 2012;483:603-7
22. Han X, Zhou Z, Fei L, Sun H, Wang R, Chen Y. et al. Construction of a human cell landscape at single-cell level. Nature. 2020;581:303-9
23. Tang Z, Kang B, Li C, Chen T, Zhang Z. GEPIA2: an enhanced web server for large-scale expression profiling and interactive analysis. Nucleic Acids Res. 2019;47:W556-w60
24. Cao T, Pan W, Sun X, Shen H. Increased expression of TET3 predicts unfavorable prognosis in patients with ovarian cancer-a bioinformatics integrative analysis. J Ovarian Res. 2019;12:101
25. Yu G, Wang LG, Han Y, He QY. clusterProfiler: an R package for comparing biological themes among gene clusters. Omics: a journal of integrative biology. 2012;16:284-7
26. Li T, Fan J, Wang B, Traugh N, Chen Q, Liu JS. et al. TIMER: A Web Server for Comprehensive Analysis of Tumor-Infiltrating Immune Cells. Cancer research. 2017;77:e108-e10
27. Huang X, He C, Lin G, Lu L, Xing K, Hua X. et al. Induced CD10 expression during monocyte-to-macrophage differentiation identifies a unique subset of macrophages in pancreatic ductal adenocarcinoma. Biochem Biophys Res Commun. 2020;524:1064-71
28. Rutkowska-Zapala M, Suski M, Szatanek R, Lenart M, Weglarczyk K, Olszanecki R. et al. Human monocyte subsets exhibit divergent angiotensin I-converting activity. Clin Exp Immunol. 2015;181:126-32
29. Zeng H, Xu C, Fan J, Tang Y, Deng Q, Zhang W. et al. Antibodies in Infants Born to Mothers With COVID-19 Pneumonia. Jama. 2020;323:1848-9
30. Schmid MB, Fontijn J, Ochsenbein-Kolble N, Berger C, Bassler D. COVID-19 in pregnant women. The Lancet Infectious diseases. 2020;20:653
31. Zhang T, Cui X, Zhao X, Wang J, Zheng J, Zheng G. et al. Detectable SARS-CoV-2 viral RNA in feces of three children during recovery period of COVID-19 pneumonia. Journal of medical virology. 2020;92:909-14
32. Xu Y, Li X, Zhu B, Liang H, Fang C, Gong Y. et al. Characteristics of pediatric SARS-CoV-2 infection and potential evidence for persistent fecal viral shedding. Nat Med. 2020;26:502-5
33. Chai P, Yu J, Ge S, Jia R, Fan X. Genetic alteration, RNA expression, and DNA methylation profiling of coronavirus disease 2019 (COVID-19) receptor ACE2 in malignancies: a pan-cancer analysis. J Hematol Oncol. 2020;13:43
34. Aran D, Camarda R, Odegaard J, Paik H, Oskotsky B, Krings G. et al. Comprehensive analysis of normal adjacent to tumor transcriptomes. Nat Commun. 2017;8:1077
35. Bernardi S, Zennaro C, Palmisano S, Velkoska E, Sabato N, Toffoli B. et al. Characterization and significance of ACE2 and Mas receptor in human colon adenocarcinoma. Journal of the renin-angiotensin-aldosterone system: JRAAS. 2012;13:202-9
36. Yang J, Li H, Hu S, Zhou Y. ACE2 correlated with immune infiltration serves as a prognostic biomarker in endometrial carcinoma and renal papillary cell carcinoma: implication for COVID-19. Aging. 2020;12:6518-35
37. Aran D, Lasry A, Zinger A, Biton M, Pikarsky E, Hellman A. et al. Widespread parainflammation in human cancer. Genome Biol. 2016;17:145
38. Ying L, Yan F, Meng Q, Yuan X, Yu L, Williams BRG. et al. Understanding immune phenotypes in human gastric disease tissues by multiplexed immunohistochemistry. Journal of translational medicine. 2017;15:206
39. Wu P, Wu D, Ni C, Ye J, Chen W, Hu G. et al. gammadeltaT17 cells promote the accumulation and expansion of myeloid-derived suppressor cells in human colorectal cancer. Immunity. 2014;40:785-800
40. Chew V, Tow C, Teo M, Wong HL, Chan J, Gehring A. et al. Inflammatory tumour microenvironment is associated with superior survival in hepatocellular carcinoma patients. Journal of hepatology. 2010;52:370-9
41. Ihle CL, Owens P. Integrating the immune microenvironment of prostate cancer induced bone disease. Molecular carcinogenesis. 2020;59:822-9
42. Ho WJ, Jaffee EM. Disrupting a converging metabolic target turns up the immunologic-heat in pancreatic tumors. The Journal of clinical investigation. 2020;130:71-3
43. Brake SJ, Barnsley K, Lu W, McAlinden KD, Eapen MS, Sohal SS. Smoking Upregulates Angiotensin-Converting Enzyme-2 Receptor: A Potential Adhesion Site for Novel Coronavirus SARS-CoV-2 (Covid-19). J Clin Med. 2020 9
44. Smith JC, Sausville EL, Girish V, Yuan ML, Vasudevan A, John KM. et al. Cigarette Smoke Exposure and Inflammatory Signaling Increase the Expression of the SARS-CoV-2 Receptor ACE2 in the Respiratory Tract. Dev Cell. 2020;53:514-29 e3
45. Zingone F, Savarino EV. Viral screening before initiation of biologics in patients with inflammatory bowel disease during the COVID-19 outbreak. The lancet Gastroenterology & hepatology. 2020;5:525
Author contact
![]() Corresponding author: Shengping Li, Department of Pancreatobiliary Surgery, Sun Yat-sen University Cancer Center, No. 651 Dongfeng Road East, Guangzhou 510060, People's Republic of China. Tel.: +86 20 87343572; Fax: +86 20 87343572; E-mail: lishengpsysu.edu.cn.
Corresponding author: Shengping Li, Department of Pancreatobiliary Surgery, Sun Yat-sen University Cancer Center, No. 651 Dongfeng Road East, Guangzhou 510060, People's Republic of China. Tel.: +86 20 87343572; Fax: +86 20 87343572; E-mail: lishengpsysu.edu.cn.