Impact Factor ISSN: 1449-2288
- Issue 11; 2026
- Issue 10; 2026
- Issue 9; 2026
- Issue 8; 2026
- Issue 7; 2026
- Volume 22; 2026
- Past Issues
- Advance Articles
- Editorial Board
- Cover Images
- Index & Coverage
- Cover Suggestion
- Special Issues
Introduction
Materials and Methods
Results
Discussion
Abbreviations
Supplementary Material
Acknowledgements
References

 Global reach, higher impact
Int J Biol Sci 2021; 17(1):107-118. doi:10.7150/ijbs.49243 This issue Cite
Research Paper
Deciphering the genomic and lncRNA landscapes of aerobic glycolysis identifies potential therapeutic targets in pancreatic cancer
Li-Li Zhu1,2*, Zheng Wu3*, Rong-Kun Li4*, Xin Xing5*, Yong-Sheng Jiang6, Jun Li2, Ya-Hui Wang2, Li-Peng Hu1,2, Xu Wang4, Wei-Ting Qin2, Yong-Wei Sun6, Zhi-Gang Zhang1,2, Qin Yang2 ![]() , Shu-Heng Jiang2
, Shu-Heng Jiang2 ![]()
1. State Key Laboratory of Oncogenes and Related Genes, Ren Ji Hospital, School of Biomedical Engineering, Shanghai Jiao Tong University, Shanghai 200240, P.R. China.
2. State Key Laboratory of Oncogenes and Related Genes, Shanghai Cancer Institute, Ren Ji Hospital, School of Medicine, Shanghai Jiao Tong University, Shanghai 200240, P.R. China.
3. Department of Radiation Oncology, Ren Ji Hospital, School of Medicine, Shanghai Jiao Tong University, Shanghai 200127, PR China.
4. Institute of Oncology, Affiliated Hospital of Jiangsu University, Zhenjiang 212001, P.R. China.
5. The Fengxian Hospital, Southern Medical University, Shanghai 201499, PR China.
6. Department of Biliary-Pancreatic Surgery, Ren Ji Hospital, School of Medicine, Shanghai Jiao Tong University, Shanghai 200217, P.R. China.
*These authors contributed equally to this work.
Received 2020-6-28; Accepted 2020-10-29; Published 2021-1-1
Abstract

Aerobic glycolysis, also known as the Warburg effect, is emerged as a hallmark of most cancer cells. Increased aerobic glycolysis is closely associated with tumor aggressiveness and predicts a poor prognosis. Pancreatic ductal adenocarcinoma (PDAC) is characterized by prominent genomic aberrations and increased glycolytic phenotype. However, the detailed molecular events implicated in aerobic glycolysis of PDAC are not well understood. In this study, we performed a comprehensive molecular characterization using multidimensional ''omic'' data from The Cancer Genome Atlas (TCGA). Detailed analysis of 89 informative PDAC tumors identified substantial copy number variations (MYC, GATA6, FGFR1, IDO1, and SMAD4) and mutations (KRAS, SMAD4, and RNF43) related to aerobic glycolysis. Moreover, integrated analysis of transcriptional profiles revealed many differentially expressed long non-coding RNAs involved in PDAC aerobic glycolysis. Loss-of-function studies showed that LINC01559 and UNC5B-AS1 knockdown significantly inhibited the glycolytic capacity of PDAC cells as revealed by reduced glucose uptake, lactate production, and extracellular acidification rate. Moreover, genetic silencing of LINC01559 and UNC5B-AS1 suppressed tumor growth and resulted in alterations in several signaling pathways, such as TNF signaling pathway, IL-17 signaling pathway, and transcriptional misregulation in cancer. Notably, high expression of LINC01559 and UNC5B-AS1 predicted poor patient prognosis and correlated with the maximum standard uptakevalue (SUVmax) in PDAC patients who received preoperative 18F-FDG PET/CT. Taken together, our results decipher the glycolysis-associated copy number variations, mutations, and lncRNA landscapes in PDAC. These findings improve our knowledge of the molecular mechanism of PDAC aerobic glycolysis and may have practical implications for precision cancer therapy.
Keywords: Tumor metabolism, Energy metabolism, LncRNA, CNVs, FEZF1-AS1
Introduction
Pancreatic ductal adenocarcinoma (PDAC) is a highly lethal malignancy with an overall 5-year survival rate of < 8%. PDAC is predicted to become the second leading cause of cancer-related deaths by the year 2030 and is refractory to most therapeutic strategies [1]. The deep whole exome sequencing study of PDAC have identified key mutations and somatic copy number alterations (SCNAs) in many key oncogenes and tumor suppressor genes, including KRAS, TP53, CDKN2A, and SMAD4 [2, 3]. Unfortunately, none of these genetic drivers are currently targetable, thus making it difficult to develop effective treatment modality for PDAC.
PDAC is characterized by prominent desmoplastic reaction and poor vascularity, which led to a nutrient-deficiency and hypoxic tumor microenvironment [4]. Energy metabolism is extensively reprogrammed in PDAC to enable cell survival and proliferation under this hostile condition. One of the most common metabolic alterations of cancer cells is aerobic glycolysis, also known as Warburg effect, which provides cancer cells with sufficient intermediary metabolites for generation of reducing equivalents and macromolecules (nucleotides) required for rapid proliferation and to avoid apoptosis [5, 6]. Aerobic glycolysis can be regulated by many oncogenic signals, such as MYC, HIF-1α, and PI3K/AKT pathway [7-9]. Recently, emerging evidence suggests that long non-coding RNA (lncRNA) plays crucial roles in a variety of cellular processes, such as chromatin remodeling, embryonic development, cell differentiation, energy metabolism, and tumorigenesis by regulating gene expression through multiple mechanisms [10, 11]. Several dysregulated lncRNAs with oncogenic activities have been identified in PDAC, such as LINC00673, FAM83H-AS1, and GLS-AS [12, 13]. However, the lncRNAs that responsible for PDAC aerobic glycolysis remain largely unknown.
In this study, by leveraging large-scale PDAC genomic data and molecular profiles from The Cancer Genome Atlas (TCGA) cohort, we revealed many copy number variations, mutations, and lncRNAs related to aerobic glycolysis in PDAC. Two aberrantly expressed lncRNAs, LINC01559 and UNC5B-AS1, were demonstrated to regulate PDAC aerobic glycolysis and tumor growth. Thus, this study, 1) reveals a molecular link between genomic alteration and cancer metabolism, 2) broadens understanding of lncRNA-mediated regulatory roles of aerobic glycolysis in PDAC, and 3) provides potential therapeutic targets for PDAC treatment.
Materials and Methods
Bioinformatic analysis
The genomic and level 3 molecular profiling data of the PDAC patients were downloaded from The Cancer Genome Atlas (TCGA) database (http://cancergenome.nih.gov). Copy number variation was assessed from the Affymetrix genome-wide human SNP array 6.0 platform using GISTIC2.0 (Version 2.0.22). Somatic mutations, single-nucleotide variants (SNVs), small insertion, and deletion were determined by Mutect. Fractions of single nucleotide substitutions in the six possible mutation classes (ie, C>T, C>A, C>G, A>G, A>C, and A>T) were calculated for each sample. Tumor mutational burden (TMB) was defined as the number of somatic, coding, base substitution, and indel mutations per mega base of genome examined. The nonparametric Mann-Whitney U-test was used to determine the significance in TMB difference between two populations. The R software package Limma was used to identify differentially expressed genes. Gene set enrichment analysis was performed using the GSEA software. Gene ontology and pathway analyses were performed with DAVID (https://david.ncifcrf.gov/).
Cell lines, culture conditions, and transfection
Pancreatic cancer cell lines (AsPC-1, BxPC-3, Capan-1, PANC-1, and SW1990) were all preserved in Shanghai Cancer Institute. Mycoplasma contamination was tested and cell characterization was performed using polymorphic short tandem repeat (STR) profiling. Cells were cultured in RPIM-1640 or DMEM (Life Technologies, USA) supplemented with 10% fetal bovine serum (Gibco, Grand Island, NY, USA). All cells were cultured at 37°C in a saturated humidity atmosphere containing 5% CO2. For cell transfections, specific siRNA targeting human LINC01559 and UNC5B-AS1 along with control-siRNA targeting no known gene sequence were synthesized from GenePharma (Shanghai, China). All transfections were conducted using Lipofectamine® RNAiMAX reagent (ThermoFisher Scientific, #13778030) following the manufacturer's instructions. The sequence information for siRNAs are as follow: si-LINC01559-#1, GCACCCAACAUGUUGGAUAdTdT; si-LINC01559-#2, GCCCUAAAUGUGGUUGGAUdTdT; si-UNC5B-AS1-#1, GAUCCUGCCUCAGGGAAAUdTdT; si-UNC5B-AS1-#2, GCCUUCCGCAAAGUGUUCUdTdT. Moreover, the same targeting sequences of si-LINC01559-#1 and si-UNC5B-AS1-#1 were used for generation of stable knockdown cell lines. In brief, BxPC-3 were transfected with recombinant lentivirus-transducing units in the presence of polybrene (Sigma, 5 μg/ml). One week later, the stable sh-LINC01559 or sh-UNC5B-AS1 cells were selected by 2 μg/ml puromycin (Sangon, Shanghai, China).
Real-time quantitative PCR
Total RNA from PDAC cells was extracted using the Trizol reagent (Invitrogen, USA) and reverse-transcribed to cDNA using PrimeScript RT-PCR kit (Takara, Japan) according to the manufacturer's instructions. Quantitative real-time PCR was performed with SYBR Premix Ex Taq (Takara, Japan) using the Applied Biosystems ViiA7 machine. The primers sequences are as follow: LINC01559 forward, 5'-TCTGAAACGAAGGGCTGACC-3'; LINC01559 reverse, 5'-TCTACGAGCGCTCTGACTCT-3'; UNC5B-AS1 forward, 5'-GATCCTGCCTCAGGGAAA-3'; UNC5B-AS1 reverse, 5'-GCTCAAGAGGTTGGGACT-3'; β-actin forward, 5'-CATGTACGTTGCTATCCAGGC-3'; β-actin reverse, 5'-CTCCTTAATGTCACGCACGAT-3'. Relative expression level of each gene was calculated using the 2(-ΔΔCt) method and normalized to β-actin gene. Experiments were repeated at least three times.
Immunohistochemical (IHC) analysis
IHC staining was performed as reported previously described [14]. In brief, paraffin-embedded tumor tissue sections were deparaffinized and rehydrated with graded ethanol. Endogenous peroxidase was blocked by 0.3% hydrogen peroxide in methanol. Antigen retrieval was done in 10 mM citrate buffer (pH 6.0) at 100°C for 15 minutes, followed by incubation with 10% BSA (Sangon, Shanghai, China) for 1 h at room temperature. After washing with phosphate-buffered saline (PBS) for three times, the slides were incubated with primary antibody against Ki67 (Cell Signaling Technology, #9449, USA) at 4°C overnight. The next day, slides were incubated with HRP (rabbit) second antibody and the immunoreactivity was generated by DAB substrate liquid (GeneTech, Shanghai, China). Finally, sections were counterstained by hematoxylin.
Measurement of glucose and lactate
Glucose consumption and lactate production were tested using a Glucose Assay kit (Sigma, MAK181) and a Lactate Assay kit (BioVision, K607-100) as described previously [15]. The values were normalized to total protein concentration of each sample. The experiment was performed in triplicate and repeated twice.
Measurement of extracellular acidification rate
Extracellular acidification rate (ECAR) was monitored with XF96 Extracellular Flux Analyzer (Seahorse Bioscience) according to the manufacturer's instructions. BxPC-3 cells were seeded in a XF96-well plate at a density of 1 × 10⁴ per well the day before determination. Cells were plated in XF96 Cell Culture Microplates (Seahorse Bioscience) at an initial cellular density of 1 × 10⁴ cells/well. One hour before, the culture medium was replaced by seahorse buffer, which is consists of DMEM, phenol red, 25 mM glucose, 2 mM sodium pyruvate, and 2 mM glutamine. Then, ECAR was determined by a sequential injection of 10 mM glucose, 1 μM oligomycin, and 50 mM 2-deoxyglucose (Agilent Technologies, #103017). ECAR in each well was normalized to total protein content. Each assay was run in triplicate.
Fluorescence in situ hybridization (FISH) experiment
RNA-FISH was performed using Fluorescent in situ Hybridization Kit (Servicebio Company, technology CO., LTD, Wuhan, China). LINC01559 and UNC5B-AS1 probes were designed and synthesized by Servicebio Company and labeled with Digoxin (DIG). Paraffin sections (5 μm) of human PDAC tumor tissues were deparaffinized, rehydrated with graded ethanol, and subjected to digestion with proteinase K (20 μg/ml), followed by incubation with hybridization buffer supplemented with FISH probe and washed with PBS for three times. Anti-DIG secondary antibodies were used to detect the signals, and DAPI was applied to stain the nuclei. Fluorescence signal detection was performed using aconfocal laser scanning microscope (Leica, Germany). All patients included in this study signed informed consent and this study was approved by the Institutional Review Board of Ren Ji Hospital, School of Medicine, Shanghai Jiao Tong University.
Colony formation assay
Single-cell suspension was plated at a density of 1,000 cells per plate in 6-well plates. The culture medium was changed every 3 days. After 10-14 days, the colonies were washed twice with PBS, fixed with 10% methanol, and stained with 0.25% crystal violet (Beyotime, C0121). Colonies with more than fifty cells were counted under a microscope.
RNA sequencing analysis
RNA-sequencing experiment was performed to identify the potential molecular mechanism. In brief, total RNA from sh-Ctrl, sh-LINC01559 or sh-UNC5B-AS1 BxPC-3 cells was extracted by Trizol. RNAseq was performed by Sinotech Genomics (Shenzhen, China). Gene expression was calculated using FPKM method. The edgeR software package was used to analyze the difference in gene expression between groups. Multiple hypothesis test corrections were performed after calculating the p-value. The threshold of p-value is determined by controlling false discovery rate (FDR). Kyoto Encyclopedia of Genes and Genomes (KEGG) was used for enrichment of differentially expressed genes.
Animal experiment
Nude mice (male, 6-week old) were used for subcutaneous xenograft experiment. Mice were maintained under a specific pathogen-free condition with free access to food and water. All experimental procedures were approved by the Research Ethics Committee of East China Normal University. Mice received subcutaneous injections of 1 × 10⁶ sh-Ctrl, sh-LINC01559 or sh-UNC5B-AS1 BxPC-3 cells. Four weeks later, all mice were sacrificed, and tumor tissues were isolated and tumor weight was determined.
Statistical analysis
Statistical analyses were conducted using R/Bioconductor packages, SPSS version 18 (SPSS, Inc., Chicago, IL), and GraphPad Prism 7 (version 5.04, La Jolla, CA). Quantitative data are expressed as means ± SD. Log rank test and Kaplan-Meier curves were used to analyze the survival distributions. Correlation analysis was determined using the Spearman's test. A two tailed t test was used to identify significant differences incomparisons unless otherwise stated. Statistical significance was defined as a P value less than 0.05.
Results
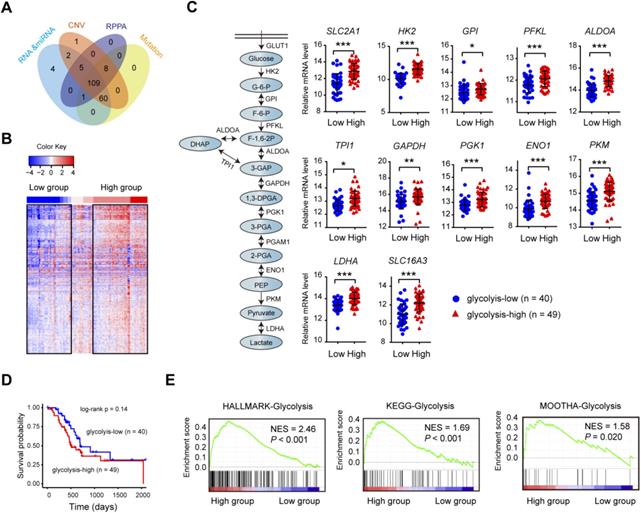
Consensus clustering identifies PDAC glycolysis status
The matched DNA mutations, copy number alterations, expression profiles of mRNA and lncRNA data on 109 clinically-annotated PDAC were obtained from The Cancer Genome Atlas (TCGA) data portal and subjected for further analysis (Fig. 1A). Unsupervised hierarchical cluster was performed in PDAC samples using K-mean equal to 12 and euclidean distance metrics. Clusters containing the 12 glycolysis-signature transcripts (SLC2A1, HK2, GPI, PFKP, ALDOA, ALDOC, PGK1, ENO1, ENO2, PKM, LDHA, and SLC16A3) were used for resampling-based hierarchical clustering of the same samples using ConsensusClusterPlus v.1.16.0 (Fig. 1B). The consensus clustering led to the identification of two transcriptional PDAC subtypes: glycolyis-low (n = 40) and glycolysis-high (n = 49) (Supplementary Table 1). Expectedly, many key glycolytic components including SLC2A1, HK2, PKM, and LDHA had significantly elevated mRNA expression level in the glycolysis-high subtype (Fig. 1C). Despite no statistical difference was found, patients in glycolysis-high group showed a poor prognosis compared with the glycolyis-low group (Fig. 1D). Gene set enrichment analysis (GSEA) showed that three independent glycolysis gene expression signatures (Hallmark, KEGG and MOOTHA) were consistently enriched in the glycolysis-high groups (Fig. 1E). To validate the confidence of this classification approach, we further performed similar analysis using two independent data sets from Gene Expression Omnibus (GEO). As a result, the result obtained from TCGA cohort was also reproducible in GSE15471 and GSE16515 (Supplementary Fig. 1). Collectively, the above findings indicate that our classification model was built on meaningful data in the context of aerobic glycolysis.
Consensus clustering identifies PDAC glycolysis status. (A) PDAC patients (n = 109) with genomic and molecular profiling data were selected for grouping analysis. (B) Heat maps of 109 PDAC samples clustered in glycolysis-low and glycolysis-high groups. (C) Expression comparison of glycolytic genes withinthe glycolysis-low and glycolysis-high groups. (D) Kaplan-Meier curve analysis (log-rank test) of the survival rate between glycolysis-low and glycolysis-high groups. (E) Gene set enrichment analysis (GSEA) on three independent glycolysis gene sets across the glycolysis-low and glycolysis-high samples. NES, normalized enrichment score (NES); false discovery rate (FDR) was set at 0.25. *p < 0.05; **p < 0.01; ***p < 0.001.
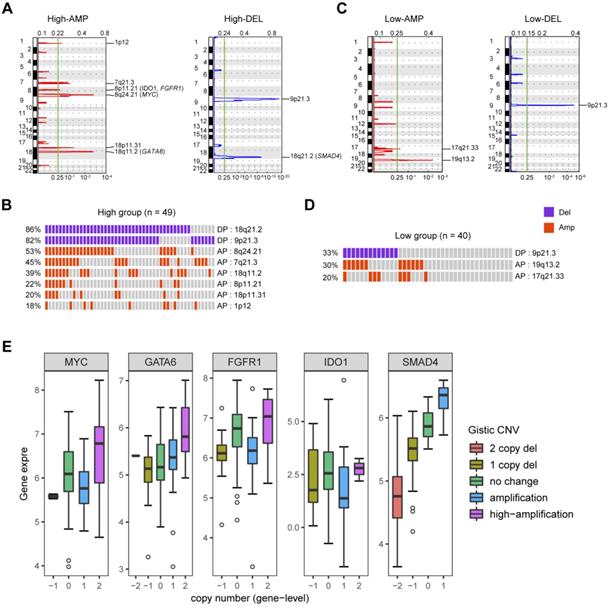
Glycolysis-related gene copy number variations in PDAC
To identify gene copy number variations (CNVs) related to PDAC glycolysis, we compared the SNP microarray data of glycolysis-high samples to those with lower glycolysis. Significant focal gains and deletions (q < 0.25) were identified in the majority of PDAC samples. In detail, amplifications of 1p12 (18%), 7q21.3 (45%), 8p11.21 (21%), 8q24.21 (20%), 18p11.31 (20%), and 18q11.2 (39%) along with deletions of 9p21.3 (82%) and 18q21.2 (86%) were enriched in the glycolysis-high samples (Fig. 2A and 2B). In contrast, amplifications of 19q13.2 (30%) and 17q21.33 (20%) along with deletions of 9p21.3 (33%) were distributed in glycolysis-low samples (Fig. 2C and 2D). GISTIC analysis showed a number of recurrent events containing known oncogenic drivers in the glycolysis-high group. These include amplifications of MYC (8q24.2), GATA6 (18q11.2), FGFR1 (8p11.21), and IDO1 (8p11.21) as well as deletion of SMAD4 (18q21.2) (Fig. 2A; Supplementary Table 2-5). Integrated analysis showed that copy number variations in GATA6 and SDMA4 were closely associated with their gene expression level in PDAC (Fig. 2E).
CNVs related to PDAC glycolysis. (A) Specific copy number profiles (gains in red and losses in blue) for glycolysis-high PDAC samples. (B) Significant CNVs from the glycolysis-high group. Each rectangle represents a PDAC subject. (C) Specific copy number profiles (gains in red and losses in blue) for glycolysis-low PDAC samples. (D) Significant CNVs from the glycolysis-low group. Each rectangle represents a PDAC subject. (E) Association of CNVs and gene expression in MYC, GATA6, FGFR1, IDO1, and SMAD4.
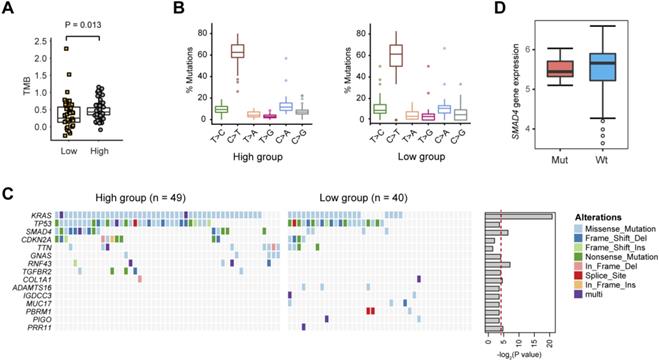
Glycolysis-related gene mutations in PDAC
Next, we evaluated the somatic mutational signatures in the 89 PDAC samples to identify significantly recurring mutations implicated in PDAC glycolysis. As a result, we found a higher total mutation burden (TMB) in glycolysis-high samples compared with that in the glycolysis-low group (Fig. 3A; Wilcoxon rank sum test, P = 0.013). No significant difference in the mutation type frequency between the two groups was noticed (Fig. 3B). Consistent with previous reports, significant recurrent mutations were identified in KRAS (73.0%), TP53 (61.8%), SMAD4 (21.3%), and CDKN2A (15.7%). In these genes, KRAS and SMAD4 mutations were significantly enriched in glycolysis-high samples (Fig. 3C). Notably, mutations in RNF43 gene (5/49, 10.2%), GNAS gene (5/49, 10.2%) and TGFBR2 gene (5/49, 10.2%) were specifically distributed in the glycolysis-high group. Moreover, mutations in ADAMTS16 (3/40, 7.5%), MUC17 (3/40, 7.5%), IGDCC3 (2/40, 5.0%), PBRM1 (3/40, 7.5%) and PIGO (2/40, 5.0%) genes were exclusively present in the glycolysis-low group (Fig. 3C). In PDAC, KRAS mutations have been well documented to be essential for anabolic glucose metabolism [16]. Loss of SMAD4 enhances PDAC glycolysis by inducing PGK1 upregulation [17]. However, mutations in SMAD4 did not confer a significant effect on the expression level of SMAD4 in PDAC (Fig. 3D).
Gene mutations related to PDAC glycolysis. (A) The tumor mutation burden (TMB) withinthe glycolysis-low and glycolysis-high groups. (B) The percentage of six substitution subtypes (C>A, C>G, C>T, T>A, T>C, and T>G) within the glycolysis-low and glycolysis-high groups. (C) Oncoprint of the frequently mutated genes related to PDAC glycolysis.
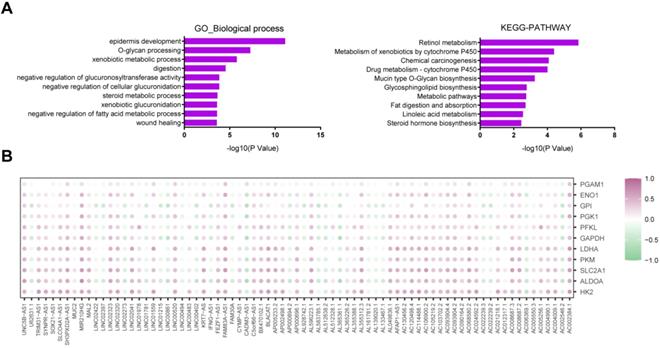
LncRNAs related to PDAC glycolysis
Significant transcriptional alterations were observed between the glycolysis-high and glycolysis-low groups. As expected, differentially expressed mRNAs were significantly enriched in metabolism-related pathways as revealed by GO and KEGG analysis (Fig. 4A). By comparing the RNA sequencing data, we identified 53 significantly up-regulated and 24 down-regulated lncRNAs with a log2 (fold change) lager than 2 or less than -2 (Supplementary Fig. 2 and Table 1). By correlation analysis, we found that most of these lncRNAs had a close correlation with glucose transporter SLC2A1 and glycolytic enzymes (HK2, ALDOA, PKM, LDHA, GAPDH, PFKL, PGK1, GPI, ENO1, and PGAM1) (Fig. 4B).
LncRNAs related to PDAC glycolysis. (A) GO and KEGG analysis of glycolysis-related differentially expressed genes. (B) Expression correction analysis between all of the differentially expressed lncRNAs and glycolytic genes (HK2, ALDOA, SLC2A1, PKM, LDHA, GAPDH, PFKL, PGK1, GPI, ENO1, and PGAM1) in PDAC. Correlation was determined using the Spearman's test.
Differentially expressed glycolysis-related lncRNAs in PDAC
| LncRNA | logFC | P-Value | LncRNA | logFC | P-Value | LncRNA | logFC | P-Value |
|---|---|---|---|---|---|---|---|---|
| FEZF1-AS1 | 3.07 | 1.39E-06 | BX470102.1 | 2.15 | 9.96E-12 | AC103702.2 | 2.00 | 0.001228 |
| UNC5B-AS1 | 2.98 | 3.46E-14 | AC093904.2 | 2.14 | 6.40E-09 | FAM30A | -2.79 | 1.41E-09 |
| AP002498.1 | 2.83 | 2.55E-08 | AP000696.1 | 2.13 | 1.13E-06 | LINC00402 | -2.77 | 1.43E-10 |
| AC002384.1 | 2.83 | 1.67E-09 | AC105219.2 | 2.12 | 3.13E-08 | AL139020.1 | -2.67 | 1.20E-07 |
| LINC01559 | 2.65 | 2.12E-09 | AC005256.1 | 2.12 | 4.82E-07 | AC002546.2 | -2.65 | 1.51E-08 |
| AP005233.2 | 2.52 | 1.40E-07 | LINC00483 | 2.12 | 5.02E-05 | LINC02397 | -2.64 | 1.96E-08 |
| CYMP-AS1 | 2.47 | 1.04E-05 | MIR210HG | 2.12 | 8.57E-12 | LINC01781 | -2.63 | 2.22E-07 |
| SH3PXD2A-AS1 | 2.46 | 1.18E-11 | AC068580.2 | 2.11 | 4.85E-08 | LINC00494 | -2.42 | 5.23E-08 |
| SOX21-AS1 | 2.46 | 1.13E-06 | AC004990.1 | 2.11 | 2.27E-08 | LINC02273 | -2.41 | 1.31E-11 |
| FAM83A-AS1 | 2.44 | 3.83E-06 | LINC01978 | 2.10 | 6.38E-11 | AL365361.1 | -2.41 | 7.99E-13 |
| AC021218.1 | 2.40 | 7.02E-08 | AL512328.1 | 2.10 | 1.67E-06 | LINC00861 | -2.41 | 2.10E-11 |
| AL355388.1 | 2.37 | 6.46E-09 | MAL2 | 2.10 | 9.35E-13 | CADM3-AS1 | -2.39 | 5.22E-11 |
| AL049836.1 | 2.35 | 1.40E-10 | TRIM31-AS1 | 2.10 | 2.46E-11 | AL928742.1 | -2.37 | 4.12E-07 |
| AC130456.2 | 2.31 | 7.86E-09 | AL365226.2 | 2.09 | 0.005693 | IFNG-AS1 | -2.35 | 2.36E-09 |
| AC090164.2 | 2.31 | 2.38E-06 | AC120498.4 | 2.07 | 8.10E-08 | AL583785.1 | -2.31 | 5.18E-09 |
| AL355312.3 | 2.30 | 1.46E-09 | SYNPR-AS1 | 2.07 | 3.49E-09 | AC022239.2 | -2.25 | 3.02E-06 |
| LINC02323 | 2.29 | 7.72E-14 | AC106900.2 | 2.06 | 3.65E-06 | LINC02422 | -2.17 | 3.31E-06 |
| LINC00520 | 2.28 | 9.81E-08 | AC024592.2 | 2.05 | 6.70E-11 | AC022239.3 | -2.14 | 3.74E-06 |
| AFAP1-AS1 | 2.28 | 2.87E-05 | AC012317.1 | 2.05 | 3.52E-07 | AL161781.2 | -2.14 | 1.00E-07 |
| AC005550.3 | 2.25 | 0.000365 | LINC02041 | 2.04 | 3.06E-09 | AL133467.1 | -2.10 | 1.85E-10 |
| C5orf66-AS1 | 2.22 | 1.78E-06 | AC008687.2 | 2.04 | 9.28E-08 | U62631.1 | -2.10 | 1.13E-07 |
| AC008687.3 | 2.22 | 3.28E-08 | KRT7-AS | 2.02 | 7.29E-11 | LINC01215 | -2.07 | 5.59E-06 |
| SLCO4A1-AS1 | 2.22 | 2.63E-09 | AC114488.1 | 2.02 | 3.43E-11 | AL512638.2 | -2.06 | 1.39E-09 |
| AC093904.4 | 2.21 | 3.41E-07 | LINC02320 | 2.02 | 3.39E-08 | AP000894.2 | -2.05 | 5.39E-06 |
| AC004009.1 | 2.18 | 1.59E-05 | MUC2 | 2.01 | 0.022248 | AC006369.1 | -2.05 | 6.67E-07 |
| BLACAT1 | 2.15 | 1.26E-09 | AL596223.1 | 2.01 | 5.64E-12 |
Role of LINC01559 and UNC5B-AS1 in PDAC glycolysis
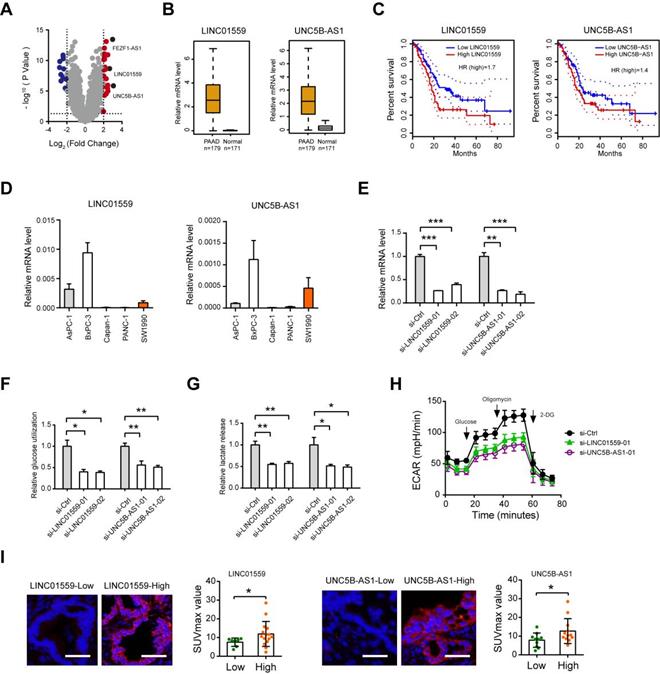
Among the identified lncRNAs, FEZF1-AS1, LINC01559 and UNC5B-AS1 were the top 3 reported lncRNAs (Fig. 5A). Moreover, FEZF1-AS1 has been demonstrated to promote the glycolytic phenotypes of colorectal cancer by regulating PKM2 signaling [18]. From the therapeutic point of view, we therefore verified the roles of LINC01559 and UNC5B-AS1, which have been implicated in several oncogenic processes but not involved in glycolysis [19-23]. Data from the TCGA + GTEx portal showed that LINC01559 and UNC5B-AS1 were highly expressed in the tumor tissues (n = 179) compared with normal pancreas samples (n = 171) (Fig. 5B). Kaplan-Meier curve analysis revealed that elevated expression of LINC01559 and UNC5B-AS1 predicts a poor prognosis in PDAC patients (Fig. 5C). To determine whether LINC01559 and UNC5B-AS1 regulate PDAC glycolysis, we performed loss-of-function study in BxPC3 cells, which show higher endogenous level of LINC01559 and UNC5B-AS1 (Fig. 5D). Two specific siRNAs against LINC01559 and UNC5B-AS1 efficiently blocked their expression level (Fig. 5E). Notably, LINC01559 and UNC5B-AS1 significantly inhibited the glycolytic activity of BxPC-3 cells as demonstrated by reduced glucose utilization (Fig. 5F), lactate production (Fig. 5G), and extracellular acidification rate (Fig. 5H). Moreover, in a cohort of 22 PDAC patients who received preoperative18F-FDG PET/CT, we found that the SUVmax was considerably higher in specimens with high LINC01559 or UNC5B-AS1 expression than that in the low expression group (Fig. 5I). LINC01559 and UNC5B-AS1 expression were also closely correlated with the mRNA level of many glycolytic components in the glycolysis pathway (Supplementary Fig. 3), suggesting a regulatory role of LINC01559 and UNC5B-AS1 in PDAC glycolysis.
Regulatory role of LINC01559 and UNC5B-AS1 in PDAC glycolysis. (A) Volcano plot showed thedifferentially expressed lncRNAs between glycolysis-high and glycolysis-low group. (B) TCGA and GTEx database data showed the expression level of LINC01559 and UNC5B-AS1 in PDAC and their normal counterparts. (C) Kaplan-Meier analysis showed the overall survival of PDAC patients based on LINC01559 and UNC5B-AS1 expression. (D) Real-time qPCR analysis showed LINC01559 and UNC5B-AS1 expression level in PDAC cell lines. (E) Real-time qPCR analysis of siRNA-mediated knockdown efficiency of LINC01559 and UNC5B-AS1 in BxPC-3 cells. (F-H) Quantification of glucose uptake (F), lactate production (G), and extracellular acidification rate (H) in si-LINC01559, si-UNC5B-AS1, and si-Ctrl BxPC-3 cells. (I) Representative photographs FISH analysis in PDAC patients with preoperative 18F-FDG PET/CT scans; scale bar: 50 µm. The correlation between LINC01559 or UNC5B-AS1 expression and the SUVmax was analyzed. *p < 0.05; **p < 0.01; ***p < 0.001.
Genetic silencing of LINC01559 and UNC5B-AS1 inhibits tumor growth in PDAC
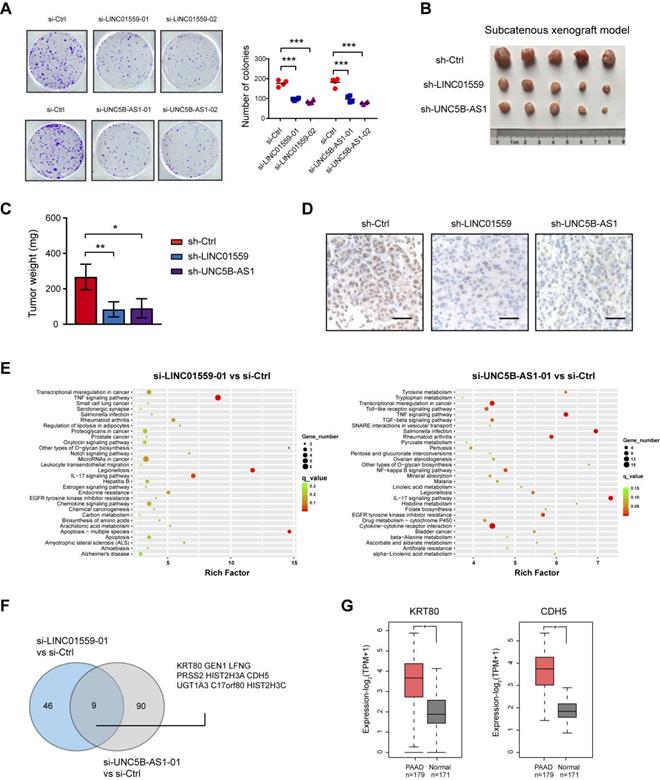
Increased aerobic glycolysis provides abundant cellular buildings to favor rapid cancer cell proliferation [24]. In this study, we revealed that either LINC01559 or UNC5B-AS1 knockdown resulted in significant downregulation in anchorage-dependent growth of PDAC cells (Fig. 6A). To test the in vivo effect of LINC01559 and UNC5B-AS1 knockdown on tumor growth, a subcatenous xenograft model was generated. As a result, stably knockdown of LINC01559 or UNC5B-AS1 significantly retarded tumor burden as evidenced by tumor weight and the proliferation index Ki67 (Fig. 6B-D). Moreover, we performed RNA sequencing to identify the gene expression profiles altered by LINC01559 and UNC5B-AS1. KEGG enrichment analysis of differentially expressed showed that LINC01559 or UNC5B-AS1 knockdown contributed to alterations in several signaling pathways, such as TNF signaling pathway, IL-17 signaling pathway, and transcriptional misregulation in cancer (Fig. 6E). Comparative analysis revealed that 9 differentially expressed genes were consistently downregulated by LINC01559 or UNC5B-AS1 knockdown (Fig. 6F and Supplementary Table 6-7), including genes that have been involved in the diverse oncogenic processes but not previously reported to be related to glycolysis. Notable genes include KRT80 and CDH5 [25, 26], which are suspected to function as tumor promoters in human cancers and are highly expressed in PDAC (Fig. 6G).
Genetic silencing of LINC01559 and UNC5B-AS1 inhibits tumor growth in PDAC. (A) The effect of LINC01559 or UNC5B-AS1 knockdown on BxPC-3 cell proliferation was measured by plate colony formation assay. (B) A subcatenous xenograft model showed the effect of LINC01559 or UNC5B-AS1 knockdown on the in vivo tumor growth of PDAC (n=5). (C) Measurement of tumor weight in sh-Ctrl, sh-LINC01559 andsh-UNC5B-AS1 groups. (D) IHC analysis of Ki67 in sh-Ctrl, sh-LINC01559 and sh-UNC5B-AS1 tumor tissues. (E) KEGG enrichment of differentially expressed genes upon LINC01559 or UNC5B-AS1 knockdown in BxPC-3 cells. (F) Venn diagram showed differentially expressedgenes upon LINC01559 and UNC5B-AS1 knockdown in BxPC-3 cells. (G) TCGA and GTEx database data showed the expression level of KRT80 and CDH5 in PDAC and their normal counterparts. *p < 0.05; **p < 0.01; ***p < 0.001.
Discussion
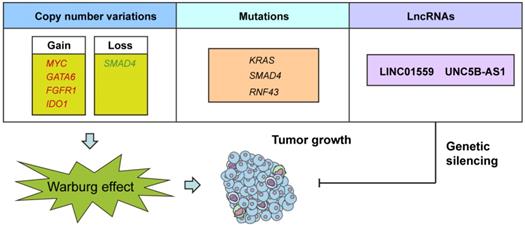
In the current study, we made a number of important observations concerning genomic alterations and lncRNAs in the glycolytic phenotype in PDAC (Fig. 7). First, we found that several CNVs and mutations preferentially enriched in glycolysis-low or glycolysis-high samples. Second, we identified, many previously unstudied lncRNA as being associated with PDAC glycolysis and upregulated in PDAC tissues. Third, we found that inhibition of LINC01559 or UNC5B-AS1 expression resulted in decreased glycolysis and PDAC cell proliferation. To the best of our knowledge, this is the first report of deciphering any lncRNA involved in the regulation of aerobic glycolysis in PDAC.
A schematic diagram shows genomic and lncRNA landscapes of aerobic glycolysis in PDAC. Gene copy number variations (CNVs) in MYC, GATA6, FGFR1, IDO1, and SMAD4, gene mutations in KRAS, SMAD4, and RNF43, and dysregulation of LncRNAs, especially LINC01559 and UNC5B-AS1 were closely associated with PDAC glycolysis. Knockdown of LINC01559 or UNC5B-AS1 significantly inhibited tumor growth in PDAC.
CNV profiling of human tumors has uncovered recurrent patterns of DNA amplifications and deletions across diverse cancer types. Compelling evidence revealed that metabolic stress acts as a selective pressure underlying the recurrent CNAs observed in human cancers [27]. In this study, our result highlights the previous unprecedented regulatory role of GATA6, FGFR1, IDO1, and SMAD4 in the metabolic reprogramming of PDAC. Actually, GATA6 has been reported to direct hepatocellular carcinoma cells to glycolytic metabolism and fosters tumorigenicity, self-renewal and metastasis by transcriptional regulation of PKM2 expression [28]. Aberrant activation of the FGFR1 signaling pathway is sufficient to enhance the Warburg effect through differential regulation of LDHA and LDHB in prostate cancer [29]. Interestingly, IDO1 plays important roles in maintaining the pluripotency of primed human embryonic stem cells by upregulating glycolysis. Moreover, SMAD4 promotes diabetic nephropathy by reducing glycolysis via direct interaction with PKM2 [30]. However, whether aerobic glycolysis is regulated by these CNVs in PDAC warrants further investigation. In addition, detailed functional and mechanism characterization are encouraged to verify these highlights.
In PDAC, KRAS mutation is critical to control tumor metabolism through promotion of glucose uptake and channeling of glucose intermediates into the hexosamine biosynthesis and the nonoxidative arm of pentose phosphate pathway [16]. Consistently, we confirmed the driver role of KRAS mutation in glucose metabolism. Moreover, our findings emphasize the importance of frequently mutated genes SMAD4, GNAS, RNF43, TGFBR2, and PBRM1 in modulating PDAC glycolytic phenotypes. Recently, Liang et al. showed that the glycolytic enzyme PGK1 is transcriptionally repressed by SMAD4 and SMAD4 inactivation in PDAC induces PGK1 upregulation to enhance glycolysis and aggressive tumor behaviors [31]. Specifically, SMAD4 may also interact with hypoxia-inducible factor 1α (HIF1α) to regulate target genes to suppress a glycolytic phenotype [32]. Additionally, PBRM1 is known to be important for driving renal clear cell carcinoma through the regulation of hypoxia response genes, PI3K signaling, and glucose uptake [33]. These studies support our findings regarding the recurrent gene mutations involved in glycolytic metabolism. However, additional verification should be carried out to yield insight into these mutations shaping tumor glycolysis.
LINC01559 has been identified as a potential non-invasive biomarker of renal cell carcinoma and is reported to accelerate pancreatic cancer cell proliferation and invasion through enhancing YAP activity, and UNC5B-AS1 is associated with tumourigenesis and metastasis of papillary thyroid cancer [21, 23, 34]. Our results suggest that LINC01559 and UNC5B-AS1 are novel regulators of aerobic glycolysis in PDAC. Given the close expression correlation between LINC01559 and UNC5B-AS1 and nearly all glycolytic genes (glucose transporter and glycolytic enzymes), we postulate a mechanism of chromatin organization and transcriptional regulation mediated by LINC01559 and/or UNC5B-AS1 to promote aerobic glycolysis. Consistent with this notion, genetic silencing of LINC01559 or UNC5B-AS1 led to transcriptional misregulation in cancer. Apart from LINC01559 and UNC5B-AS1, many differentially expressed LncRNAs were predicted to result in aerobic glycolysis, such as SH3PXD2A-AS1, SOX21-AS1, and FAM83A-AS1. Future studies may unravel the regulatory role of these candidates on the Warburg metabolism in PDAC.
In conclusion, our integrated analysis of the molecular landscape of PDAC aerobic glycolysis has yielded important insights into the biology of this deadly disease. Our observations raise the novel regulatory roles of recurrent somatic gene mutations and copy number alterations in PDAC metabolic reprogramming. In addition, targeting dysregulated lncRNAs, especially LINC01559 and UNC5B-AS1, may represent a potential therapeutic strategy by inhibiting aerobic glycolysis in PDAC.
Abbreviations
PDAC: Pancreatic ductal adenocarcinoma; SUVmax: maximum standard uptake value; SCNAs: somatic copy number alterations; LncRNA: long non-coding RNA; GEO: Gene Expression Omnibus; TCGA: The Cancer Genome Atlas; ECAR: extracellular acidification rate.
Supplementary Material
Supplementary figures and tables.
Acknowledgements
We thank Dr. Xueli Zhang for her comments that improve the final version of the manuscript. The research was supported by grants from Shanghai Sailing Program (No: 19YF1445700), National Natural Science Foundation of China (81902370, 81701374 and 81701945), and Shanghai Municipal Health Commission (201940506).
Authors' contributions
Conception and design: S.H. Jiang, Z.G. Zhang; Development of methodology: L.L. Zhu, Q. Yang; Acquisition of data: L.L. Zhu, Z. Wu, Q. Yang, Y.S. Jiang, R.K. Li, W.T. Qin, S.H. Jiang; Analysis and interpretation of data: L.L. Zhu, Q. Yang, J. L, Y.H. Wang, X. Wang, X. Xing, S.H. Jiang; Writing, review, and/or revision of the manuscript: L.L. Zhu, Y.W. Sun, S.H. Jiang, Z.G. Zhang; Administrative, technical, or material support: Q. Yang, S.H. Jiang, Z.G. Zhang. All authors read and approved the final manuscript.
Competing Interests
The authors have declared that no competing interest exists.
References
1. Rahib L, Smith BD, Aizenberg R, Rosenzweig AB, Fleshman JM, Matrisian LM. Projecting cancer incidence and deaths to 2030: the unexpected burden of thyroid, liver, and pancreas cancers in the United States. Cancer research. 2014;74:2913-21
2. Waddell N, Pajic M, Patch AM, Chang DK, Kassahn KS, Bailey P. et al. Whole genomes redefine the mutational landscape of pancreatic cancer. Nature. 2015;518:495-501
3. Bailey P, Chang DK, Nones K, Johns AL, Patch AM, Gingras MC. et al. Genomic analyses identify molecular subtypes of pancreatic cancer. Nature. 2016;531:47-52
4. Kamisawa T, Wood LD, Itoi T, Takaori K. Pancreatic cancer. Lancet. 2016;388:73-85
5. Vander Heiden MG, Cantley LC, Thompson CB. Understanding the Warburg effect: the metabolic requirements of cell proliferation. Science. 2009;324:1029-33
6. Hanahan D, Weinberg RA. Hallmarks of cancer: the next generation. Cell. 2011;144:646-74
7. Cairns RA, Harris IS, Mak TW. Regulation of cancer cell metabolism. Nature reviews Cancer. 2011;11:85-95
8. Khalaf N, Wolpin BM. Metabolic Alterations as a Signpost to Early Pancreatic Cancer. Gastroenterology. 2019;156:1560-3
9. Dang CV. MYC on the path to cancer. Cell. 2012;149:22-35
10. Schmitt AM, Chang HY. Long Noncoding RNAs in Cancer Pathways. Cancer cell. 2016;29:452-63
11. Tay Y, Rinn J, Pandolfi PP. The multilayered complexity of ceRNA crosstalk and competition. Nature. 2014;505:344-52
12. Arnes L, Liu Z, Wang J, Maurer C, Sagalovskiy I, Sanchez-Martin M. et al. Comprehensive characterisation of compartment-specific long non-coding RNAs associated with pancreatic ductal adenocarcinoma. Gut. 2018
13. Deng SJ, Chen HY, Zeng Z, Deng S, Zhu S, Ye Z. et al. Nutrient Stress-Dysregulated Antisense lncRNA GLS-AS Impairs GLS-Mediated Metabolism and Represses Pancreatic Cancer Progression. Cancer research. 2019;79:1398-412
14. Jiang SH, Zhu LL, Zhang M, Li RK, Yang Q, Yan JY. et al. GABRP regulates chemokine signalling, macrophage recruitment and tumour progression in pancreatic cancer through tuning KCNN4-mediated Ca(2+) signalling in a GABA-independent manner. Gut. 2019;68:1994-2006
15. Jiang SH, Li J, Dong FY, Yang JY, Liu DJ, Yang XM. et al. Increased Serotonin Signaling Contributes to the Warburg Effect in Pancreatic Tumor Cells Under Metabolic Stress and Promotes Growth of Pancreatic Tumors in Mice. Gastroenterology. 2017;153:277-91 e19
16. Ying H, Kimmelman AC, Lyssiotis CA, Hua S, Chu GC, Fletcher-Sananikone E. et al. Oncogenic Kras maintains pancreatic tumors through regulation of anabolic glucose metabolism. Cell. 2012;149:656-70
17. Liang C, Shi S, Qin Y, Meng Q, Hua J, Hu Q. et al. Localisation of PGK1 determines metabolic phenotype to balance metastasis and proliferation in patients with SMAD4-negative pancreatic cancer. Gut. 2020;69:888-900
18. Bian Z, Zhang J, Li M, Feng Y, Wang X, Zhang J. et al. LncRNA-FEZF1-AS1 Promotes Tumor Proliferation and Metastasis in Colorectal Cancer by Regulating PKM2 Signaling. Clinical cancer research: an official journal of the American Association for Cancer Research. 2018;24:4808-19
19. Wang L, Bo X, Yi X, Xiao X, Zheng Q, Ma L. et al. Exosome-transferred LINC01559 promotes the progression of gastric cancer via PI3K/AKT signaling pathway. Cell death & disease. 2020;11:723
20. Chen X, Wang J, Xie F, Mou T, Zhong P, Hua H. et al. Long noncoding RNA LINC01559 promotes pancreatic cancer progression by acting as a competing endogenous RNA of miR-1343-3p to upregulate RAF1 expression. Aging. 2020;12:14452-66
21. Lou C, Zhao J, Gu Y, Li Q, Tang S, Wu Y. et al. LINC01559 accelerates pancreatic cancer cell proliferation and migration through YAP-mediated pathway. Journal of cellular physiology. 2020;235:3928-38
22. Wang H, Su H, Tan Y. UNC5B-AS1 promoted ovarian cancer progression by regulating the H3K27me on NDRG2 via EZH2. Cell biology international. 2020;44:1028-36
23. Wang Y, Bhandari A, Niu J, Yang F, Xia E, Yao Z. et al. The lncRNA UNC5B-AS1 promotes proliferation, migration, and invasion in papillary thyroid cancer cell lines. Human cell. 2019;32:334-42
24. Shukla SK, Purohit V, Mehla K, Gunda V, Chaika NV, Vernucci E. et al. MUC1 and HIF-1alpha Signaling Crosstalk Induces Anabolic Glucose Metabolism to Impart Gemcitabine Resistance to Pancreatic Cancer. Cancer cell. 2017;32:71-87 e7
25. Li C, Liu X, Liu Y, Liu X, Wang R, Liao J. et al. Keratin 80 promotes migration and invasion of colorectal carcinoma by interacting with PRKDC via activating the AKT pathway. Cell death & disease. 2018;9:1009
26. Mao XG, Xue XY, Wang L, Zhang X, Yan M, Tu YY. et al. CDH5 is specifically activated in glioblastoma stemlike cells and contributes to vasculogenic mimicry induced by hypoxia. Neuro-oncology. 2013;15:865-79
27. Graham NA, Minasyan A, Lomova A, Cass A, Balanis NG, Friedman M. et al. Recurrent patterns of DNA copy number alterations in tumors reflect metabolic selection pressures. Molecular systems biology. 2017;13:914
28. Tan HW, Leung CO, Chan KK, Ho DW, Leung MS, Wong CM. et al. Deregulated GATA6 modulates stem cell-like properties and metabolic phenotype in hepatocellular carcinoma. International journal of cancer. 2019;145:1860-73
29. Liu J, Chen G, Liu Z, Liu S, Cai Z, You P. et al. Aberrant FGFR Tyrosine Kinase Signaling Enhances the Warburg Effect by Reprogramming LDH Isoform Expression and Activity in Prostate Cancer. Cancer research. 2018;78:4459-70
30. Li J, Sun YBY, Chen W, Fan J, Li S, Qu X. et al. Smad4 promotes diabetic nephropathy by modulating glycolysis and OXPHOS. EMBO reports. 2020;21:e48781
31. Liang C, Shi S, Qin Y, Meng Q, Hua J, Hu Q. et al. Localisation of PGK1 determines metabolic phenotype to balance metastasis and proliferation in patients with SMAD4-negative pancreatic cancer. Gut. 2019
32. Papageorgis P, Cheng K, Ozturk S, Gong Y, Lambert AW, Abdolmaleky HM. et al. Smad4 inactivation promotes malignancy and drug resistance of colon cancer. Cancer research. 2011;71:998-1008
33. Chowdhury B, Porter EG, Stewart JC, Ferreira CR, Schipma MJ, Dykhuizen EC. PBRM1 Regulates the Expression of Genes Involved in Metabolism and Cell Adhesion in Renal Clear Cell Carcinoma. PloS one. 2016;11:e0153718
34. Chen B, Wang C, Zhang J, Zhou Y, Hu W, Guo T. New insights into long noncoding RNAs and pseudogenes in prognosis of renal cell carcinoma. Cancer cell international. 2018;18:157
Author contact
![]() Corresponding authors: State Key Laboratory of Oncogenes and Related Genes, Shanghai Cancer Institute, Ren Ji Hospital, School of Medicine, Shanghai Jiao Tong University, 800 Dongchuan Road, Shanghai 200240, P.R. China. Phone: +86-021-34206022; E-mail: shjiangorg (Shu-Heng Jiang) or yangqin200954com (Qin Yang).
Corresponding authors: State Key Laboratory of Oncogenes and Related Genes, Shanghai Cancer Institute, Ren Ji Hospital, School of Medicine, Shanghai Jiao Tong University, 800 Dongchuan Road, Shanghai 200240, P.R. China. Phone: +86-021-34206022; E-mail: shjiangorg (Shu-Heng Jiang) or yangqin200954com (Qin Yang).