Impact Factor ISSN: 1449-2288
- Issue 12; 2026
- Issue 11; 2026
- Issue 10; 2026
- Issue 9; 2026
- Issue 8; 2026
- Volume 22; 2026
- Past Issues
- Advance Articles
- Editorial Board
- Cover Images
- Index & Coverage
- Cover Suggestion
- Special Issues
Introduction
Materials and methods
Results
Discussion
Abbreviations
Supplementary Material
Acknowledgements
References

 Global reach, higher impact
Int J Biol Sci 2021; 17(4):957-971. doi:10.7150/ijbs.52591 This issue Cite
Research Paper
Silencing PRSS1 suppresses the growth and proliferation of gastric carcinoma cells via the ERK pathway
Dongmei Ye1,3*, Yuxuan Li1*, Heliang Zhang1, Zhiwei Zhou4, Yujie Tang4, Peng Wu5, Qiang Zhao2 ![]() , Zhiwei Zhang1
, Zhiwei Zhang1 ![]()
1. Cancer Research Institute of Hengyang Medical College, University of South China; Key Laboratory of Cancer Cellular and Molecular Pathology in Hunan Province, Hunan Hengyang 421001, China.
2. Department of Pathology, The First Affiliated Hospital of University of South China, Hunan Hengyang 421001, Hunan Province China.
3. Department of Pathology, Third Affiliated Hospital of Nanchang University, Nanchang, Jiangxi Province 330008, China.
4. Clinical Medicine of Hengyang Medical College, University of South China, Hengyang 421001, Hunan Province, China.
5. Department of Critical Care Medicine, Hengyang Maternal and Child Health Hospital, Hengyang, 421001, Hunan Province, China.
*These authors contributed equally to this work.
Received 2020-10-2; Accepted 2021-1-2; Published 2021-3-1
Abstract

Background: Gastric carcinoma (GC) is one of the most common malignant tumors and seriously threatens human life and health.
Methods: In the present study, 243 differentially expressed proteins in GC were identified using laser capture microdissection (LCM) combined with isotopically labeled quantitative proteomics technology. The expression of serine protease 1 (PRSS1) protein was analyzed by immunohistochemistry and Western blot. MTT and colony formation assays were employed to determine the effect of PRSS1 expression on the growth and proliferation of GC cells. Then, we observed the expression of miR-146a-5p in GC by qRT-PCR. A dual luciferase assay was performed to determine whether PRSS1 is a target gene of miR-146a-5p. We also explored the influence of miR-146a-5p expression on PRSS1 expression and on the growth and proliferation of GC cells. Finally, Western blotting was used to analyze the effect of PRSS1 expression on the activation of the ERK signaling pathway.
Results: We confirmed that PRSS1 expression was significantly increased and was positively correlated with the differentiation, tumor size and lymph node metastasis of GC. Subsequently, we found that overexpression of PRSS1 promoted the growth and proliferation of cells, whereas silencing PRSS1 expression inhibited the growth and proliferation of MGC803 cells by inhibiting activation of the ERK signaling pathway via reductions in PAR-2 activation. MiR-146a-5p targets PRSS1 and suppresses the growth and proliferation of MGC803 cells.
Conclusions: miR-146a-5p targets PRSS1 and suppresses the growth and proliferation of MGC803 cells. Silencing PRSS1 expression inhibits the ERK signaling pathway by reducing PAR-2 activation, resulting in suppressed growth and proliferation of MGC803 GC cells.
Keywords: gastric carcinoma, proteomics, PRSS1, miR-146a-5p, ERK, PAR-2
Introduction
Gastric carcinoma (GC) is one of the most common malignancies, ranking fifth in global incidence among all malignancies and third in cancer-associated mortality [1,2]. However, the majority of cases of GC are usually not diagnosed until an advanced stage; therefore, the outcome is often poor with a 5-year survival rate of no more than 30%, including among patients who have undergone surgery [3]. It is key to improve the 5-year survival rate and quality of life of patients for the early diagnosis and management of GC. Therefore, it is worthwhile to explore methods and biomarkers for the early diagnosis of GC. However, specific and sensitive molecular markers for the early diagnosis of GC have been poorly defined.
The development of proteomics technology has provided a new way to research molecular markers for the early diagnosis of GC [4]. Laser capture microdissection (LCM) technology is one of the best methods for separating cells from tissues and obtaining high-purity tissues [5]. Isobaric tags for relative and absolute quantitation (iTRAQ) technology is beneficial for comparative analysis of abundance in mass spectrometry and has advantages relating to quantitative and differential expression results. The quadrupole time-of-flight tandem mass spectrometer (Q-TOF MS/MS) is suitable for the analysis of trace molecules. This machine is significantly better than traditional techniques for not only its resolution, accuracy and sensitivity but also its ability to determinate proteins with very low molecular weight, extreme pH and low abundance [6].
The PRSS1 gene is located on human chromosome 7 and encodes 247 amino acids, comprising cationic trypsin 1. Recent studies have shown that the expression of PRSS1 protein is significantly increased in pancreatic cancer, colorectal cancer and cervical cancer and may be involved in the pathological process of tumor progression [7-9]. MicroRNAs (miRNAs) are a type of noncoding RNA widely found in eukaryotes. They mainly recognize the 3′-UTR of their target mRNA to either degrade the mRNA or inhibit its translation [10]. MiR-146a-5p is dysregulated in a variety of cancers and plays an important role in the development of cancer [11,12]. Previous studies reported that miR-146a-5p is dysregulated in GC [13]; however, the signaling mechanisms need further research. Protease-activated receptor-2 (PAR-2) is a seven-transmembrane G protein-coupled receptor consisting of 397 amino acid residues that is expressed in a variety of tumor cells. It has been reported that various proteases can exert hydrolytic activity and activate PAR-2 [14], which consequently affects tumor proliferation, metastasis and angiogenesis through the ERK pathway [15]. However, it remains unclear whether PAR-2 activation affects the proliferation of gastric cancer cells.
In this study, we identified differentially expressed proteins in LCM-purified gastric mucosal epithelial cancerous tissues using iTRAQ labeling and 2D LCMS/MS and selectively verified a subset of the differentially expressed proteins with consistent results. Among them, PRSS1 protein was significantly overexpressed, which was positively correlated with the differentiation, tumor size and lymph node metastasis of GC. Subsequently, PRSS1 is a target gene of miR-146a-5p. Finally, we found that knockdown of PRSS1 expression inhibited activation of the ERK signaling pathway by reducing PAR-2 activation, resulting in suppressed proliferation of GC MGC803 cells.
Materials and methods
Patients
We collected 20 matched pairs of fresh normal gastric mucosa (NGM), atypical hyperplasia (AH), poorly differentiated gastric adenocarcinoma (GPDAC) and lymph node metastasis adenocarcinoma (LMGAC) tissues for LMC (Supplementary Table 1). In addition, 81 pairs of GC and adjacent normal formalin-fixed paraffin-embedded tissues were collected for immunohistochemical (IHC) staining with a PRSS1 antibody. Tissue chips made from 141 GC specimens were used for IHC staining with a PAR-2 antibody. All samples were diagnosed in the Department of Pathology of the First Affiliated Hospital of University of South China. All samples were obtained from patients with GC with approval of the medical ethics committee.
Laser capture microdissection (LCM)
Tissue samples were removed from liquid nitrogen and sliced into 8-µm-thick frozen sections using a cryostat device carrier (Leica Biosystems GmbH, Wetzlar, NJ). Frozen tissue sections were stained with methyl green and placed on an LCM (Leica LMD6, Leica Microsystems GmbH). The target tissues were outlined on the display and automatically cut from the slice with the laser. We collected the target tissues in a tube containing 2-3 µl of protease inhibitor (Roche Diagnostics, Basel, Switzerland) and stored them at -80 °C.
Protein extraction and isobaric tags for relative and absolute quantitation (iTRAQ) labeling
Total protein from LMC-treated tissues was extracted using lysis buffer (CW2333S, Cwbiotech, Beijing, China) following the manufacturer's protocol. The total proteins from NGM, AH, GPDAC and LMGAC tissue samples were labeled with different iTRAQ reagents (Thermo Fisher Scientific, Waltham, MA, USA) according to the manufacturer's instructions. Four labeled lysates were mixed and lyophilized before they were desalted. Then, the samples were dissolved in deionized water containing 0.1% formic acid (FA, Tedia Company, Fairfield, OH, USA) and eluted three times with Sep-Pak C18 1 cc Vac cartridges (Waters Corporation, Milford, MA, USA). The cleaning solution was collected and lyophilized to obtain the final samples.
2D LC-ESI-MS/MS analysis and identification of differentially expressed proteins
The samples marked with iTRAQ were dissolved in cation-exchange (SCX) buffer for SCX separation. The four samples containing mesenchymal proteins from NGM, AH, GPDAC and LMGAC tissues were mixed and loaded into a polysulfoethyl column and segregated by an LC-20AD high-performance liquid chromatography (HPLC) system (Shimadzu Corporation, Kyoto, Japan) following the manufacturer's instructions. Next, the products were concentrated by vacuum centrifugation for reverse-phase HPLC-mass spectrometry (MS) analysis. The samples were dissolved in 50 µl of 5% ACN containing 0.1% FA and loaded into a Zorbax 300SB-C18 column (Agilent Technologies, Santa Clara, CA, USA) according to the manufacturer's instructions. The data were analyzed using QSTAR-XL (Applied Biosystems, Thermo Fisher Scientific) and tandem MS (MS/MS). Finally, the IPI human database (version 3.45, URL: http://www.ebi.ac.uk/IPI) was searched for protein information, the confidence level was set as >95%, and the ion peak areas of m/z 114 and 118 were integrated.
Cell line and cell culture
GC cell lines (SGC7901, BGC823, MGC803) and the immortalized gastric epithelial cell line GES-1 were obtained from Cancer Research Institute of the University of South China for the present study. HEK293T cells were obtained from the ATCC (American Type Culture Collection, Manassas, VA). Cells were cultured in either RPMI 1640 (HyClone) medium containing 10% fetal bovine serum (HyClone) or serum-free keratinocyte medium (K-SFM, Gibco, Thermo Fisher Scientific, Waltham, MA, USA) in a humidified 5% (v/v) CO2 atmosphere at 37 °C.
Plasmids
The PRSS1 interference vector pcDNA6.2TM-GW/EmGFP-miR-PRSS1 (miR-PRSS1), high expression vector pcDNA3.1-PRSS1 and corresponding negative control (NC) plasmids (pcDNA6.2TM-GW/EmGFP-miR (PRSS1-NC) and pcDNA3.1-NC, respectively) were purchased from Shanghai Invitrogen. PRSS1-WT and PRSS1-MUT vectors were constructed by Fenghui Biological. The sequences of all the vectors were confirmed by Sangon Biotech.
Transfection
Transfections were performed with Lipofectamine 2000 Reagent (Invitrogen) according to the manufacturer's protocol. MGC803 cells were seeded in a 6-well plate at 1×10⁵/well. We transfected the interference vector pcDNA6.2™-GW/EmGFP-miRi-PRSS1 and the pcDNA6.2™-GW/EmGFP-miRi NC vector into MGC803 cells to construct MGC803/miRi-PRSS1 (low expression of PRSS1) and MGC803/miRi NC cells, respectively. As the same time, GES-1 cells were seeded in a 6-well plate at 1×10⁵ cells/well. We transfected pcDNA3.1-PRSS1 and pcDNA3.1 NC into GES-1 cells to construct PRSS1-overexpressing and NC cells, respectively. The transfection efficiency was observed by fluorescence microscopy and Western blot analysis.
Western-blot analysis
Total cellular proteins were separated via SDS-PAGE through 12% gels and transferred to polyvinylidene difluoride membranes. The membranes were blocked with QuickBlock™Blocking Buffer for Western blot (P0252, Beyotime, Shanghai, China) for 10 minutes and incubated with primary antibodies targeting PRSS1 (ab200996, 1:1000, Abcam, UK), HSP90α/β (1:500, Santa Cruz Biotechnology, USA), TGM2 (1:1000, CST, USA), SerpinA3 (1:1000, Santa Cruz Biotechnology, USA), P180 (1:500, Aibixin, Shanghai, China), PCNA (ab137867, 1:1000, Wanleibio, Shanghai, China), ERK1/ERK2 (ab184699, 1:5000, Abcam, UK), ERK1/ERK2 (ab76299, 1:5000, Abcam, UK), or β-actin (1:1000, Sigma-Aldrich; Merck KGaA, Darmstadt, Germany) at 4 °C overnight. Fluorescent secondary antibody (1:5000; Santa Cruz Biotechnology) was then added to the membranes for 2 hours. The protein bands were detected by a gel imaging analysis system (ODYSSEY Sa, LI-COR, USA).
Immunohistochemical staining
Samples were fixed with 10% formalin, and 4-µm-thick paraffin sections were baked in a 58 °C incubator for 2 hours. The immunohistochemical staining procedure was performed following the S-P kit instructions (Maixin, Fujian, China). The cells were incubated with antibodies targeting PRSS1 (ab200996, 1:1000, Abcam, UK), PCNA (ab137867, 1:500, Wanleibio, Shanghai, China), and PAR-2 (ab1809, 1:100, Abcam, UK) overnight at 4 °C, which were then detected by adding DAB. Finally, the cells were observed under a microscope (BX53, Olympus, Japan).
Quantitative reverse transcription polymerase chain reaction (qRT-PCR)
Total RNA from cells was isolated using TRIzol reagent (Invitrogen, USA) according to the manufacturer's protocol. We synthesized complementary DNA using the All-in-One™ FIST-Strand cDNA miRNA Synthesis Kit (QP013, GeneCopoeia, USA), and RT-PCR was performed using All-in-One™ miRNA qRT-PCR (QP015, GeneCopoeia, Rockville, MD, USA) and BeyoFastTM SYBR Green qRT-PCR Detection kits (Beyotime Biotechnology, Shanghai, China). Primers targeting miR-146a-5p (HmiRQP0196), U6 (HmiRQP9001) and PRSS1 (HQP015083) were purchased from GeneCopoeia. The primers for the GAPDH gene were synthesized by Sangon Biotech as follows: 5′-AGGTCGGTGTGAACGGATTTG-3′ (forward) and 5′-GGGGTCGTTGATGGCAACA-3′ (reverse).
MTT assay
Cells were seeded into 96-well plates at 2×10³ cells/well. The number of viable cells was detected by the MTT method according to the manufacturer's instructions (Molecular Probes, Eugene, OR, USA) every 24 hours in triplicate. The OD values were measured at 570 nm with a microplate reader (17260, BIO-RAD, USA).
Colony formation assay
The cells were suspended before they were seeded in a six-well plate at 1×10³ cells/well at 37 °C for 2 weeks. The colonies were fixed with methanol for 25 min and then stained with 0.4% crystal violet for 30 minutes at room temperature (E607309, BBI, Shanghai, China). The number of cell colonies was counted under a microscope (TS100, Nikon, Japan) and analyzed.
Soft agar clone formation assay
Cells were seeded into semisolid agar K-SFM medium [base layer, 0.6% (w/v); upper layer, 0.3% (w/v)] at a density of 5×10⁴ cells/well in 6-well plates. After 2-week incubation at 37 °C with 5% (v/v) CO2, the number and size of colonies (≥50 cells as one colony) were observed and analyzed.
Immunocytochemical staining
Cell slides were prepared and fixed with 4% paraformaldehyde for 30 min. The immunocytochemical staining procedure was the same as that used for IHC according to the S-P kit instructions (Maixin, Fujian, China). The cells were incubated with antibodies targeting proliferating cell nuclear antigen (PCNA) (ab137867, 1:500, Wanleibio, Shanghai, China) and PAR-2 (ab1809, 1:100, Abcam, UK) overnight at 4 °C and stained by adding DAB. Finally, the cells were observed under a microscope (BX53, Olympus, Japan).
Luciferase reporter assay
PRSS1-WT and PRSS1-MUT are vectors containing the recombinant wild-type and mutant form of PRSS1, respectively. All vectors were confirmed by sequencing (Sangon Biotech). HEK 293T cells were seeded into 24-well plates at a density of 5×10⁴ cells/well and cotransfected with the PRSS1-WT or PRSS1-MUT plasmids and the miR-146a-5p mimics or NC using LipoFilter transfection reagent (HB-TRLF-1000, Hanheng, Shanghai, China). Luciferase activity was measured by a dual-luciferase reporter assay system (Lux-T020, BLT, Guangzhou, China) after 48 hours of transfection following the manufacturer's instructions. Relative luciferase activity was expressed as the fold-change after normalization to Renilla luciferase activity. Recombinant expression vectors were confirmed by sequencing (Sangon Biotech).
Statistical analysis
Statistical analyses were performed using GraphPad Prism 8 software. Data are expressed as the means±standard deviation (M±SD). The results of the immunohistochemical staining were analyzed by the Kruskal-Wallis H test, and Fisher's exact probability test was used for pairwise comparisons. One-way ANOVA was used to compare the means of samples between groups. The MTT experiment results were statistically analyzed using two-way ANOVA. Student's t-test was performed when the variance between groups was similar, and the correlation test used was Spearman's correlation analysis. *P<0.05, **P<0.01, and ***P<0.001 were considered to indicate a statistically significant difference.
Results
Identification of differentially expressed proteins during human gastric mucosal carcinogenesis by Proteomics
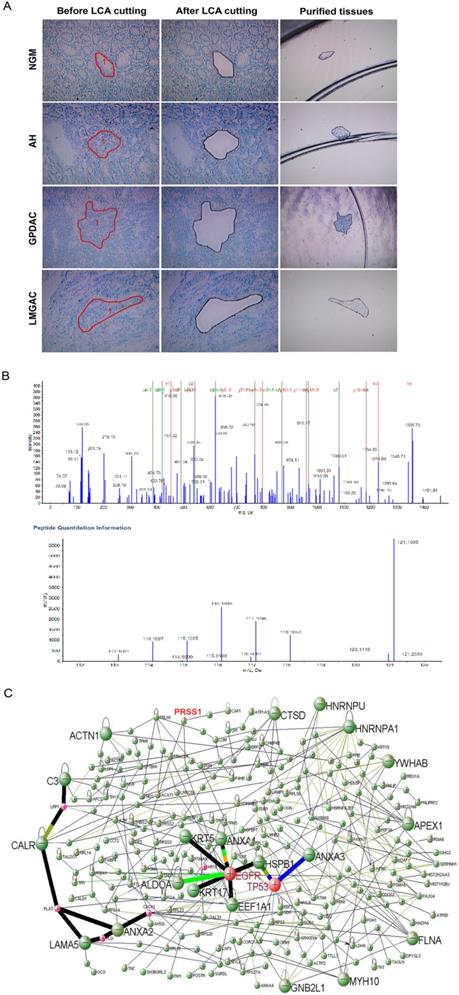
To explore differentially expressed proteins related to gastric mucosa carcinogenesis, we used LCM technology to extract proteins from 20 normal gastric mucosa (NGM), atypical hyperplasia (AH), poorly differentiated gastric adenocarcinoma (GPDAC) and lymph node metastasis adenocarcinoma (LMGAC) tissues (Figure 1A). A total of 243 differentially expressed proteins were identified by iTRAQ labeling, two-dimensional liquid chromatography separation and Q-TOF MS/MS mass spectrometry (the Life Science Research Center of Fudan University). The MS/MS map of PRSS1 peptides is shown in Figure 1B. There were significant differences in the levels of the PRSS1, TGM2, SerpinA3, P180 and HSP90α/β proteins, and their expression gradually increased in NGM, AH, GPDAC and LMGAC tissues (Table 1). We constructed a regulatory network of gastric mucosa carcinogenesis-related proteins via DAVID Online Bioinformatics Analysis Software (http://david.abcc.ncifcrf.gov) (Figure 1C).
Identification of differentially expressed proteins during human gastric mucosal carcinogenesis by proteomics analysis. (A) LCM of purified NGM, AH, GPDAC and LMGAC tissues. (B) MS/MS maps for identifying peptides of PRSS1 and relative quantitative information of PRSS1 expression in four different tissues. (C) A regulatory network of gastric mucosa carcinogenesis-related proteins. LCM, laser capture microdissection; NGM, normal gastric mucosa; AH, atypical hyperplasia; GPDAC, poorly differentiated gastric adenocarcinoma; LMGAC, lymph node metastasis adenocarcinoma.
Differentially expressed proteins during human gastric mucosa epithelial carcinogenesis
| No. | Accession# | Protein Name | AH vs. NGM | GPDAC vs. NGM | LMGAC vs. NGM | GPDAC vs. AH | LMGAC vs. AH | LMGAC vs. GPDAC |
|---|---|---|---|---|---|---|---|---|
| 1 | IPI00465084.6 | Desmin | ↓0.098 | ↓0.024 | ↓0.023 | ↓0.123 | ↓0.016 | |
| 2 | IPI00027720.1 | PnLIP Pancreatic triacylglycerol lipase precursor | ↓0.229 | ↓0.024 | ↓0.177 | ↓0.107 | ↓0.138 | |
| 3 | IPI00020987.1 | PRELP Prolargin precursor | ↓0.153 | ↓0.025 | ↓0.175 | ↓0.163 | ↓0.142 | |
| 4 | IPI00009826.2 | Carboxypeptidase B precursor | ↓0.087 | ↓0.027 | ↓0.063 | ↓0.253 | ↓0.425 | |
| 5 | IPI00025476.1 | AMY1B Pancreatic alpha-amylase precursor | ↓0.449 | ↓0.028 | ↓0.115 | ↓0.061 | ↓0.256 | ↓0.240 |
| 6 | IPI00878546.1 | Protein disulfide isomerase family A, member 2 | ↓0.065 | ↓0.030 | ↓0.093 | ↓0.461 | ↓0.322 | |
| 7 | IPI00009823.3 | Carboxypeptidase A1 precursor | ↓0.163 | ↓0.053 | ↓0.328 | ↓0.411 | ||
| 8 | IPI00021885.1 | FGA Isoform 1 of Fibrinogen alpha chain precursor | ↓0.316 | ↓0.069 | ↓0.131 | ↓0.219 | ↓0.413 | ↓0.530 |
| 9 | IPI00005924.4 | PnLIPRP2 pancreatic lipase-related protein 2 | ↓0.051 | ↓0.084 | ↓0.136 | ↓0.608 | ↓0.619 | |
| 10 | IPI00010796.1 | P4HB Protein disulfide-isomerase precursor | ↓0.175 | ↓0.089 | ↓0.506 | ↓0.637 | ||
| ... | ... | ... | ... | ... | ... | ... | ... | ... |
| 24 | IPI00218320.4 | TPM3 Isoform 3 of Tropomyosin alpha-3 chain | ↓0.205 | ↓0.608 | ↑1.047 | ↓0.581 | ||
| 25 | IPI00026271.5 | Ribosomal protein S14 | ↓0.174 | ↓0.223 | ↓0.555 | ↓0.402 | ||
| 26 | IPI00219217.3 | L-lactate dehydrogenase B chain | ↓0.119 | ↓0.227 | ↓0.134 | ↓0.421 | ↓0.319 | |
| 27 | IPI00515087.2 | chymotrypsinogen B2 | ↓0.550 | ↓0.236 | ↓0.525 | ↓0.429 | ↓0.449 | |
| 28 | IPI00298497.3 | Fibrinogen beta chain precursor | ↓0.363 | ↓0.240 | ↓0.402 | ↓0.661 | ↓0.343 | ↓0.597 |
| 29 | IPI00856098.1 | p180/ribosome receptor | ↓0.555 | ↓0.242 | ↓0.614 | ↓0.437 | ↓0.247 | ↓0.394 |
| 30 | IPI00298547.3 | PARK7 Protein DJ-1 | ↓0.192 | ↓0.249 | ↓0.324 | |||
| 31 | IPI00550991.3 | SERPINA3 | ↓0.242 | ↓0.250 | ↓0.154 | ↓0.329 | ↓0.131 | ↓0.234 |
| 32 | IPI00004457.3 | AOC3 Membrane copper amine oxidase | ↓0.214 | ↓0.261 | ↓0.429 | ↓0.242 | ↓0.256 | |
| 33 | IPI00218914.5 | Retinal dehydrogenase 1 | ↓0.182 | ↓0.268 | ↓0.343 | ↓0.238 | ↓0.237 | ↓0.207 |
| 34 | IPI00010133.3 | Coronin-1A | ↓0.353 | ↓0.281 | ↓0.586 | ↓0.510 | ↓0.167 | |
| 35 | IPI00015614.3 | PRSS3 Isoform A of Trypsin-3 precursor | ↓0.273 | ↓0.288 | ↓0.143 | ↑2.014 | ||
| ... | ... | ... | ... | ... | ... | ... | ... | ... |
| 190 | IPI00646304.4 | PPIB peptidylprolyl isomerase B precursor | ↑2.489 | ↑4.325 | ↑1.820 | ↑2.148 | ↑2.377 | |
| 191 | IPI00744692.1 | TALDO1 Transaldolase | ↑2.312 | ↑4.365 | ↑1.570 | ↑3.597 | ||
| 192 | IPI00414283.5 | fibronectin 1 isoform 4 preproprotein | ↑1.959 | ↑4.365 | ↑2.228 | ↑2.466 | ||
| 193 | IPI00398778.3 | PLEC1 plectin 1 isoform 10 | ↑1.871 | ↑4.406 | ↑10.765 | ↑7.586 | ||
| 194 | IPI00815665.1 | PRSS1 protein | ↑4.966 | ↑4.446 | ↑7.253 | ↑15.276 | ↑4.966 | ↑3.076 |
| 195 | IPI00218918.5 | Annexin A1 | ↑4.487 | ↑2.831 | ↑3.631 | |||
| 196 | IPI00021766.5 | RTN4 Isoform 1 of Reticulon-4 | ↑3.221 | ↑4.529 | ↑3.253 | ↑20.512 | ↑4.328 | ↑16.596 |
| 197 | IPI00215911.3 | APEX1 DNA-(apurinic or apyrimidinic site) lyase | ↑4.656 | ↑2.051 | ↑6.252 | ↑2.754 | ↑2.270 | |
| 198 | IPI00607708.3 | LDHA Isoform 2 of L-lactate dehydrogenase A chain | ↑6.918 | ↑4.656 | ↑12.134 | ↑10.375 | ||
| 199 | IPI00796333.1 | ALDOA 45 kDa protein | ↑6.026 | ↑4.742 | ↑2.786 | ↑1.939 | ↑5.861 | |
| 200 | IPI00025512.2 | Heat shock protein beta-1 | ↑2.208 | ↑4.786 | ↑4.831 | ↑4.487 | ||
| 201 | IPI00186711.3 | PLEC1 plectin 1 isoform 6 | ↑3.515 | ↑4.786 | ↑2.443 | ↑4.446 | ↑2.270 | ↑1.959 |
| 202 | IPI00021827.3 | DEFA3 Neutrophil defensin 3 precursor | ↑4.831 | ↑2.512 | ↑2.512 | ↑3.212 | ↑1.923 | |
| ... | ... | ... | ... | ... | ... | ... | ... | ... |
| 216 | IPI00218733.6 | Superoxide dismutase | ↑4.462 | ↑6.546 | ↑5.754 | ↑4.656 | ||
| 217 | IPI00219038.9 | H3F3B Histone H3.3 | ↑1.837 | ↑6.607 | ↑3.597 | |||
| 218 | IPI00000105.4 | Major vault protein | ↑4.128 | ↑6.855 | ↑2.629 | ↑4.699 | ↑4.207 | |
| 219 | IPI00465431.7 | LGALS3 Galectin-3 | ↑7.112 | ↑6.918 | ↑2.466 | ↑2.805 | ||
| 220 | IPI00414676.6 | Heat shock protein HSP 90 | ↑3.664 | ↑7.379 | ↑3.311 | ↑40.179 | ↑18.030 | ↑2.228 |
| 221 | IPI00019502.3 | Myosin-9 | ↑4.525 | ↑7.586 | ↑3.342 | ↑7.112 | ↑3.133 | ↑2.270 |
| 222 | IPI00887678.1 | LOC654188 similar to peptidylprolyl isomerase A-like | ↑4.920 | ↑7.656 | ↑12.134 | ↑1.770 | ↑6.855 | |
| 223 | IPI00178926.2 | immunoglobulin J chain | ↑2.512 | ↑7.727 | ↑1.629 | ↑40.551 | ↑8.551 | ↑4.742 |
| 224 | IPI00871843.1 | TGM2 | ↑7.112 | ↑7.870 | ↑3.631 | ↑3.736 | ↑3.470 | ↑2.168 |
| 225 | IPI00289862.3 | Secernin-1 | ↑1.959 | ↑7.870 | ↑1.660 | ↑2.148 | ↑4.742 | |
| 226 | IPI00018219.1 | TGFBI Transforming growth factor-beta-induced protein ig-h3 precursor | ↑1.542 | ↑8.241 | ↑17.701 | ↑29.923 | ||
| 227 | IPI00027230.3 | HSP90B1 Endoplasmin precursor | ↑4.742 | ↑8.395 | ↑1.995 | ↑2.512 | ↑4.207 | |
| 228 | IPI00027463.1 | Protein S100-A6 | ↑3.076 | ↑8.395 | ↑2.911 | ↑2.729 | ↑2.884 | |
| 229 | IPI00450768.7 | type I cytoskeletal 17 | ↑2.228 | ↑8.710 | ↑2.333 | ↑3.908 | ↑3.733 | |
| 230 | IPI00449920.1 | IGHV3OR16-13 cDNA FLJ90170 fis | ↑2.089 | ↑9.120 | ↑2.014 | ↑4.365 | ↑4.529 | |
| 231 | IPI00293276.10 | LOC284889; MIF Macrophage migration inhibitory factor | ↑28.314 | ↑9.376 | ↑4.831 | ↑2.355 | ↑1.941 | |
| ... | ... | ... | ... | ... | ... | ... | ... | ... |
| 235 | IPI00028030.3 | COMP Cartilage oligomeric matrix protein precursor | ↑1.660 | ↑12.023 | ↑3.192 | ↑8.930 | ↑55.463 | ↑3.767 |
| 236 | IPI00002745.1 | Cathepsin Z precursor | ↑8.551 | ↑12.706 | ↑6.546 | ↑4.241 | ↑1.941 | |
| 237 | IPI00853163.1 | TYMP 46 kDa protein | ↑5.200 | ↑13.677 | ↑2.630 | |||
| 238 | IPI00329573.9 | COL12A1 Isoform 1 of Collagen alpha-1(XII) chain precursor | ↑4.267 | ↑14.997 | ↑4.366 | ↑19.055 | ↑5.620 | ↑13.804 |
| 239 | IPI00022892.2 | Thy-1 membrane glycoprotein precursor | ↑16.749 | ↑9.290 | ↑1.614 | ↑1.803 | ||
| 240 | IPI00009867.3 | type II cytoskeletal 5 | ↑7.047 | ↑17.865 | ↑2.535 | |||
| 241 | IPI00642455.2 | Thrombospondin 2 | ↑25.586 | ↑1.500 | ↑62.517 | ↑3.664 | ↑17.061 | |
| 242 | IPI00399007.5 | IGHG2 Putative uncharacterized protein DKFZp686I04196 (Fragment) | ↑33.113 | ↑17.701 | ↑34.995 | ↑18.707 | ||
| 243 | IPI00410241.2 | POSTN Periostin, osteoblast specific factor | ↑11.376 | ↑37.325 | ↑3.281 | ↑8.096 |
No, protein number; Accession#, protein IPI number in the database; NGM, normal gastric mucosa; AH, atypical hyperplasia; GPDAC, poorly differentiated gastric adenocarcinoma; LMGAC, lymph node metastasis adenocarcinoma; AH vs. NGM, GPDAC vs. NGM, LMGAC vs. NGM, GPDAC vs. AH, LMGAC vs. AH, and LMGAC vs. GPDAC represent the ratios of protein expression between the two indicated tissues.
Expression and clinical significance of PRSS1 in GC
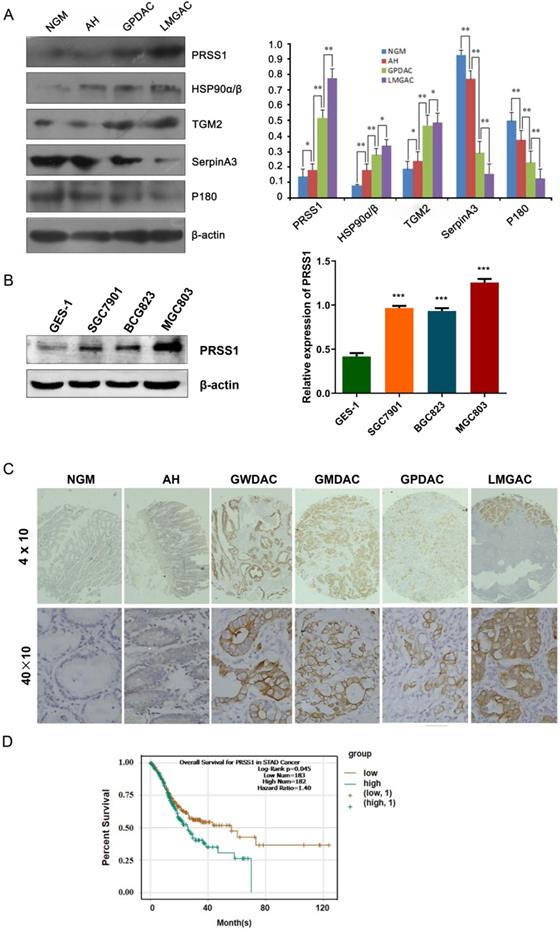
To further confirm the quantitative proteomics results, we detected the expression levels of some of the differentially expressed proteins in 20 NGM, AH, GPDAC, and LMGAC tissues by Western blot. The results of the Western blot analysis were consistent with those of the quantitative proteomics analysis (Figure 2A). Having demonstrated that, we evaluated the expression and clinical significance of PRSS1 in GC. Western blot and IHC staining analyses indicated that PRSS1 was highly expressed in GC cells and tissues (Figure 2B, 2C and Table 2). Subsequently, we explored the correlation between PRSS1 expression and the clinicopathological status of GC patients. According to statistical analysis, PRSS1 overexpression was positively correlated with the differentiation, tumor size and lymph node metastasis of GC (Table 3). Then, we predicted the clinical significance of PRSS1 in patient prognosis. As shown in Figure 2D, there was poor overall survival (OS) of patients with high expression of PRSS1. Therefore, PRSS1 may be a potential marker for the early diagnosis and prognosis of GC.
PRSS1 expression in gastric carcinoma
| Protein | n | Score | ||
|---|---|---|---|---|
| Negative (-) | Positive (+-++) | Strongly positive (+++) | ||
| PRSS1 | ||||
| NGM | 34 | 30 | 4 | 0 |
| AH | 26 | 20 | 5 | 1 |
| GWDAC | 5 | 2 | 3 | 0 |
| GMDAC | 17 | 6 | 5 | 6 |
| GPDAC | 59 | 15 | 20 | 24 |
| LMGAC | 55 | 10 | 18 | 27 |
NGM, normal gastric mucosa; AH, atypical hyperplasia; GC, gastric carcinoma; GWDAC, well differentiated gastric adenocarcinoma; GMDAC, moderately differentiated gastric adenocarcinoma; GPDAC, poorly differentiated gastric adenocarcinoma; LMGAC, lymph node metastasis adenocarcinoma.
Expression and clinical significance of PRSS1 in GC. (A) Western blotting was performed to detect the expression of PRSS1, HSP90α/β, TGM2, SerpinA3 and P180 in purified NGM, AH, GPDAC and LMGAC tissues. (B) PRSS1 was highly expressed in GC cells. (C) Immunohistochemical staining analysis indicated that PRSS1 was highly expressed in tissues. (D) Patients with high expression of PRSS1 had poor overall survival. GC, gastric cancer; SD, standard deviation. Data are shown as the means ± SD. *P<0.05, **P<0.01, ***P<0.001.
Association of PRSS1 expression with demographic and clinical characteristics of patients with gastric carcinoma
| Group | Cases (n) | Positive rate of PRSS1 (%) |
|---|---|---|
| Sex | ||
| Male | 56 | 71.43 |
| Female | 25 | 68 |
| NGM | 34 | 13.33 |
| AH | 26 | 23.08 |
| GC | ||
| GWDAC | 5 | 60 |
| GMDAC | 17 | 64.71 |
| GPDAC | 59 | 74.58* |
| Tumor size | ||
| >3.0 cm | 49 | 65.31 |
| ≤3.0 cm | 32 | 81.25* |
| Lymph node metastasis | ||
| No | 26 | 18.18 |
| Yes | 55 | 81.82** |
| TNM staging | ||
| I-II | 32 | 56.25 |
| III-IV | 49 | 81.62** |
NGM, normal gastric mucosa; AH, atypical hyperplasia; GC, gastric carcinoma; GWDAC, well differentiated gastric adenocarcinoma; GMDAC, moderately differentiated gastric adenocarcinoma; GPDAC, poorly differentiated gastric adenocarcinoma; LMGAC, lymph node metastasis adenocarcinoma; *P<0.05, **P <0.01.
Effect of PRSS1 expression on the growth and proliferation of GC cells
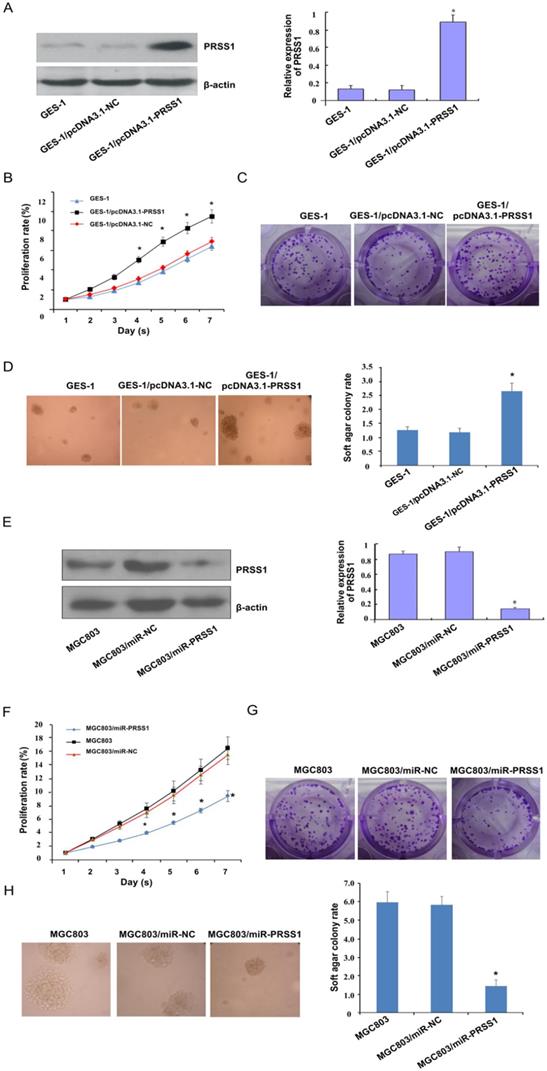
Subsequently, we investigated the effect of PRSS1 expression on the growth and proliferation of GC cells. A GES-1 cell line with ectopic expression of PRSS1 (GES-1/pcDNA3.1-PRSS1) and an MGC803 cell line with knockdown of PRSS1 expression (MGC803/miR-PRSS1) were established (Figure 3A and 3E). We performed MTT, colony formation and soft agar colony formation experiments to examine the changes in the proliferation of GES-1/pcDNA3.1-PRSS1 cells and GC MGC803/miR-PRSS1 cells. The MTT assays showed that overexpression of PRSS1 significantly increased the growth of GES-1 cells, whereas downregulation of PRSS1 significantly inhibited the growth of MGC803 cells (Figure 3B and 3F). In the colony formation and soft agar assays, the colony-forming ability of GES-1 cells was significantly increased after upregulation of PRSS1 expression; in contrast, the colony-forming ability of MGC803 cells was significantly reduced after downregulation of PRSS1 expression (Figure 3C-D and 3G-H). The results indicated that increased expression of PRSS1 promoted cell growth and proliferation, and silencing PRSS1 expression inhibited the growth and proliferation of MGC803 cells.
Effect of PRSS1 expression on the growth and proliferation of GC cells. (A) The expression level of PRSS1 protein was significantly increased in GES-1/pcDNA3.1-PRSS1 cells. (B-D) Overexpression of PRSS1 significantly increased the growth and proliferation of GES-1 cells. (E) The expression level of PRSS1 protein in MGC803/miR-PRSS1 cells was significantly decreased. (F-G) Knockdown of PRSS1 expression significantly decreased the growth and proliferation of MGC803 cells. GES-1, immortalized gastric mucosal epithelial cells; GC, gastric cancer. Data are shown as the means ± SD, *P<0.05.
MiR-146a-5p targets PRSS1 and inhibits MGC803 cell growth and proliferation
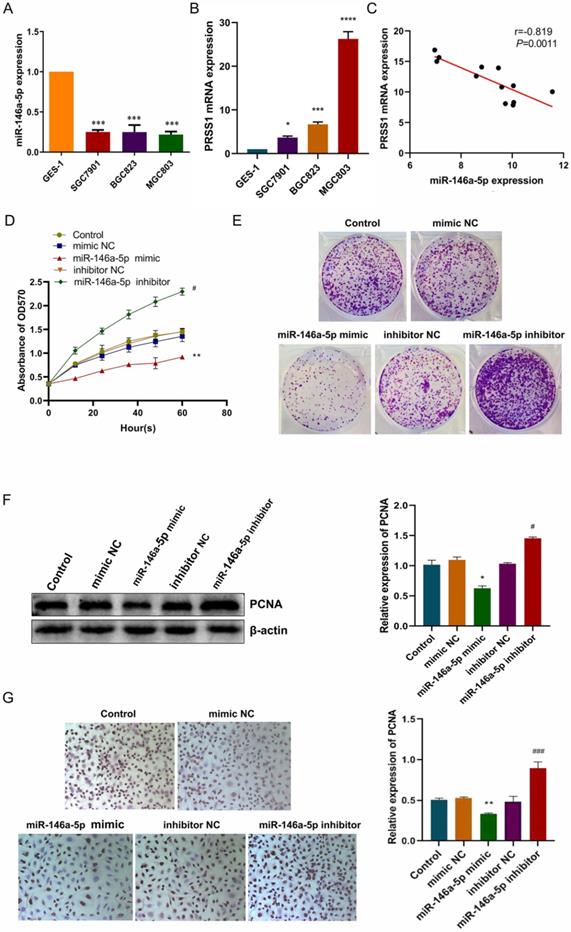
Next, we used miwalk and miRanda bioinformatics software to find whether miR-146a-5p has a potential binding site with PRSS1. We confirmed that miR-146a-5p expression was significantly decreased in GC cells (Figure 4A) while PRSS1 mRNA was significantly increased in the same cells (Figure 4B). The expression level of miR-146a-5p was negatively correlated with PRSS1 mRNA expression as measured by qRT-PCR (Figure 4C). To investigate whether miR-146a-5p affects the growth and proliferation of MGC803 cells, we transfected miR-146a-5p mimic, mimic NC, inhibitor, and inhibitor NC into MGC803 cells and found that the growth and colony-forming ability of MGC803 cells were significantly reduced after miR-146a-5p expression was upregulated. Conversely, the growth and colony-forming ability of MGC803 cells were significantly increased after miR-146a-5p expression was downregulated (Figure 4D-E). At the same time, Western blot analysis showed that miR-146a-5p mimic reduced the protein expression of proliferating cell nuclear antigen (PCNA), while the miR-146a-5p inhibitor increased PCNA expression (Figure 4F). The immunocytochemistry (ICC) results were consistent with the Western blot results (Figure 4G).
MiR-146a-5p targets PRSS1 and inhibits MGC803 cell growth and proliferation. (A) MiR-146a-5p expression was significantly decreased in GC cells. (B) PRSS1 mRNA expression was significantly increased in GC cells. (C) The expression level of miR-146a-5p was negatively correlated with PRSS1 mRNA expression as indicated by qRT-PCR. (D-E) The effects of MGC803 cells transfected with miR-146a-5p mimic or miR-146a-5p inhibitor on growth and colony-forming ability were determined by the MTT and colony forming assays. (F-G) Western blot and ICC analyses showed that miR-146a-5p mimic reduced PCNA protein expression while miR-146a-5p inhibitor increased PCNA expression. Data are shown as the means ± SD. *P<0.05, **P<0.01, ***P<0.001; #P<0.05, ###P<0.001.
PRSS1 mRNA is a direct target of miR-146a-5p
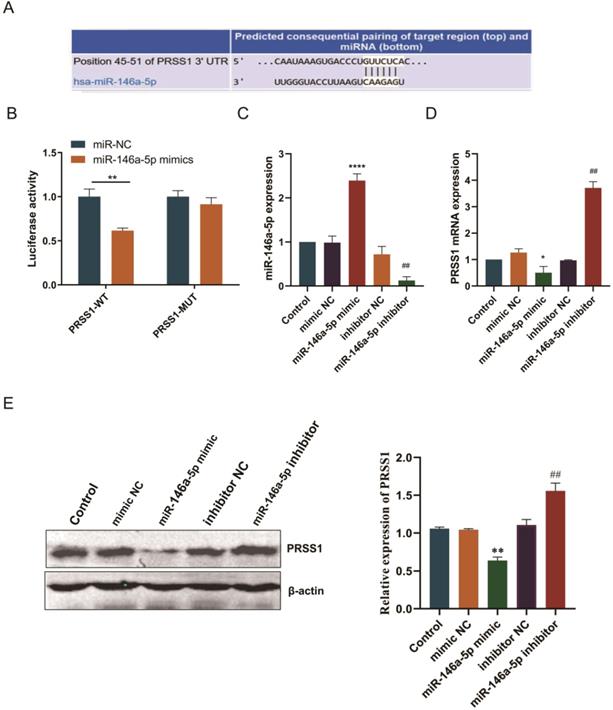
Subsequently, we predicted the binding site of miR-146a-5p to PRSS1 mRNA via the TargetScan database (Figure 5A). To confirm this finding, we performed a luciferase reporter experiment to verify whether miR-146a-5p directly targets PRSS1 mRNA. First, we constructed luciferase reporters containing the wild-type and mutant sequences of the PRSS1 3′UTR. We cotransfected miR-146a-5p mimic or NC with each luciferase reporter gene into HEK 293T cells and measured luciferase activity. The results indicated a significant reduction in luciferase activity when wild-type PRSS1 (PRSS1-WT) was cotransfected with miR-146a-5p. However, there was a significant increase in luciferase activity when mutant PRSS1 (PRSS1-MUT) was cotransfected with miR-146a-5p (Figure 5B). In addition, we further confirmed the results of the luciferase assays by qRT-PCR and Western blot analysis. Our data demonstrated that the miR-146a-5p mimic significantly downregulated the expression of PRSS1 mRNA and protein, while the miR-146a-5p inhibitor upregulated the expression of PRSS1 mRNA and protein (Figure 5C-E). Therefore, PRSS1 is a direct target gene of miR-146a-5p, and miR-146a-5p inhibits the growth and proliferation of GC by downregulating the expression of PRSS1.
PRSS1 is a direct target gene of miR-146a-5p. (A) The TargetScan database was used to predict the binding site of miR-146a-5p to PRSS1. (B) Luciferase assay of HEK 293T cells cotransfected with miR-146a-5p mimic, miR-146a-5p mimic NC and a luciferase reporter containing the wild-type 3′UTR of PRSS1 (PRSS1-3′UTR-wt) or mutated miR-146a-5p binding sites on the 3′UTR (PRSS1-3′UTR-mut). (C-D) qRT-PCR was performed to detect the expression changes of miR-146a-5p and PRSS1 mRNA in MGC803 cells transfected with miR-146a-5p mimic and miR-146a-5p inhibitor, respectively. (E) The effect of miR-146a-5p mimic or miR-146a-5p inhibitor on PRSS1 protein expression in MGC803 cells was determined by Western blot. Data are shown as the means ± SD. *P<0.05, **P<0.01, ***P<0.001; #P<0.05, ##P<0.01.
PRSS1 affects cell proliferation via the PAR-2-activated ERK signaling pathway
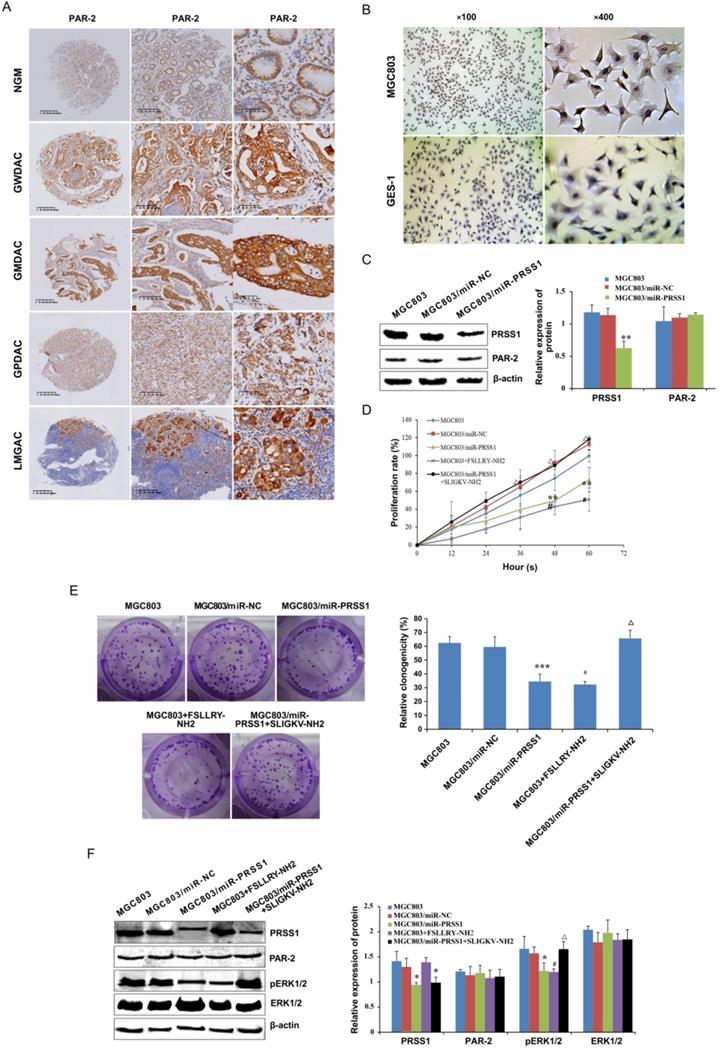
In searching for the molecular mechanism downstream of PRSS1 that affects GC MGC803 cell proliferation, we found that PAR-2 was highly expressed in well-differentiated, moderately differentiated and poorly differentiated gastric adenocarcinoma and lymph node metastatic cancer tissues compared with normal gastric mucosa (Figure 6A, Table 4) as measured by IHC. The expression of PAR-2 in GC tissues was associated with TNM stage and lymph node metastasis (Table 5). Moreover, compared with GES-1 cells, MGC803 GC cells showed high expression of PAR-2 (Figure 6B). We transfected the miR-PRSS1 interference plasmid into MGC803 cells to silence the expression of PRSS1, but there was no significant difference in the expression of PAR-2 (Figure 6C). Then, we treated MGC803 cells with FSLLRY-NH2 (PAR-2 inhibitor) and SLIGKV-NH2 (PAR-2 agonist) and observed cell growth and proliferation as well as measured the levels of phosphorylated ERK1/2. The results indicated that cell growth and proliferation and the levels of phosphorylated ERK1/2 in MGC803/miR-PRSS1 cells were significantly reduced compared those in with MGC803 and MGC803/miR-NC cells (Figure 6D-F). Additionally, cell growth, proliferative ability and levels of phosphorylated ERK1/2 were reduced in MGC803 cells treated with FSLLRY-NH2 (Figure 6D-F). Interestingly, when SLIGKV-NH2 was added to MGC803/miR-PRSS1 cells, cell growth, proliferative ability and phosphorylated ERK1/2 levels were restored (Figure 6D-F). However, we found that the changes in PRSS1 expression and the addition of either FSLLRY-NH2 or SLIGKV-NH2 did not affect the expression level of PAR-2 protein (Figure 6F). The results suggest that knockdown of PRSS1 expression inhibits ERK signaling pathway activation by reducing PAR-2 activation, resulting in weakened growth and proliferation of MGC803 cells.
PAR-2 expression in gastric carcinoma
| Groups | Cases (n) | PAR-2 (n) | PAR-2 positive rate (%) | |||
|---|---|---|---|---|---|---|
| Negative (-) | Weakly positive (+) | Moderately positive (++) | Strongly positive (+++) | |||
| NGM | 59 | 46 | 6 | 5 | 2 | 22.03 |
| GWDAC | 8 | 2 | 1 | 3 | 2 | 75.00* |
| GMDAC | 29 | 3 | 4 | 5 | 17 | 89.66* |
| GPDAC | 104 | 6 | 13 | 27 | 58 | 94.23* |
| LMGAC | 53 | 3 | 4 | 12 | 34 | 94.34* |
NGM, normal gastric mucosa; GWDAC, well-differentiated gastric adenocarcinoma; GMDAC, moderately differentiated gastric adenocarcinoma; GPDAC, poorly differentiated gastric adenocarcinoma; LMGAC, lymph node metastasis adenocarcinoma. *Compared with normal gastric mucosa, P=0.0418.
Association between PAR-2 and clinicopathological characteristics in gastric carcinoma
| Variables | Cases (n) | PAR-2 positive rate (%) | P value |
|---|---|---|---|
| Sex | P=0.7461 | ||
| Male | 90 | 91.11 | |
| Female | 51 | 94.12 | |
| Ages | P=1.0000 | ||
| ≤60 | 58 | 93.10 | |
| >60 | 83 | 91.57 | |
| Tumor differentiation | P=0.1568 | ||
| Well/moderately differentiated | 37 | 86.48 | |
| Poorly differentiated | 104 | 94.23 | |
| TNM staging | P=0.0001 | ||
| I-II | 29 | 72.41 | |
| III-IV | 112 | 97.32 | |
| Lymph node metastasis | P=0.0122 | ||
| No | 30 | 80.00 | |
| Yes | 111 | 95.50 |
GC, gastric carcinoma. *P<0.05, statistically significant.
PRSS1 affects cell proliferation via the PAR-2-activated ERK signaling pathway. (A) The expression of PAR2 protein was analyzed in GC tissues by immunohistochemistry analysis. (B) PAR-2 was highly expressed in MGC803 GC cells compared to GES-1 cells. (C) The effect of PRSS1 knockdown on PAR-2 protein expression in MGC803 cells. (D-E) The effect of FSLLRY-NH2 (PAR-2 inhibitor) and SLIGKV-NH2 (PAR-2 agonist) on the growth and proliferation of MGC803 GC cells was determined by MTT and colony formation assays. (F) Western blotting was performed to detect the expression levels of phosphorylated ERK1/2, PRSS1 and PAR2 in MGC803/miR-PRSS1 cells, MGC803 cells treated with FSLLRY-NH2 (PAR-2 inhibitor), and MGC803/miR-PRSS1 cells treated with SLIGKV-NH2 (PAR-2 agonist). Data are shown as the means ± SD, *P<0.05, **P<0.01, ***P<0.001; #P<0.05, ##P<0.01; ΔP<0.05.
Discussion
Improving the 5-year survival rate and quality of life of patients is key for the early diagnosis and management of GC. There is an urgent need to identify of specific and sensitive molecular markers for the early diagnosis of GC. The development of proteomics technology has provided a new way to research molecular markers for the early diagnosis of GC [4]. In this study, we identified differential PRSS1 proteins in gastric mucosal epithelial cancerous tissue via iTRAQ labeling and 2D LCMS/MS.
A previous report showed that PRSS1 may be an oncogene for pancreatic tumors [16]. Recent studies have shown that the PRSS1 protein is important in the development of pancreatic, colorectal and cervical cancer [7-9]. However, whether and how the PRSS1 protein is involved in the progression of GC is unknown. In the present study, we confirmed that PRSS1 was highly expressed in GC, which was positively correlated with tumor differentiation, tumor size, TNM stage and lymph node metastasis of GC and was associated with poor prognosis. Cell abnormalities and unchecked proliferation are hallmark features of malignant tumors [17]. Moreover, we found that PRSS1 overexpression promoted cell growth and proliferation, while the opposite result was obtained when PRSS1 expression was knocked down. Therefore, PRSS1 may play an oncogenic role in GC and be involved in the process of GC. However, the underlying mechanism by which PRSS1 affects GC is poorly understood.
MicroRNAs are small noncoding RNAs that regulate the expression of target genes through posttranscriptional modification and are involved in tumor progression [18]. Previous studies have reported that miR-146a-5p is involved in the occurrence and development of multiple tumors [11,19]. Other reports have demonstrated that miR-146a-5p expression levels are significantly reduced in GC, which inhibits the proliferation, migration and invasion of GC [20,21]. However, some studies have shown that miR-146a-5p is highly expressed in GC and promotes the progression of GC [22,23]. In our study, we confirmed that miR-146a-5p expression is significantly reduced in GC, and increasing the expression of miR-146a-5p inhibits the growth and proliferation of GC cells. In contrast, we observed a decrease in cell growth and proliferation in MGC803 cells lacking miR-146a-5p expression. In addition, PRSS1 is a direct target gene of miR-146a-5p. Our data indicated that miR-146a-5p targets PRSS1 and inhibits the growth and proliferation of MGC803 cells.
PAR-2, a member of the family of protease-activated receptors widely distributed on the surface of human cells, is mainly activated by proteases [24]. According to the PAR-2 activation mechanism, there are multiple modulators of PAR-2 activity that are commonly used: the PAR-2 agonist SLIGKV-NH2 and the PAR-2 inhibitor FSLLRY-NH2 [25]. These regulators are powerful tools for PAR-2-related research. PAR-2 is highly expressed in GC and may be associated with GC proliferation and angiogenesis [26,27]. Chen reported that PAR-2 activation plays a key role in maintaining tumor cell proliferation [28]. In our cell proliferation assays, both knockdown of PRSS1 expression and inhibition of PAR-2 activity effectively inhibited MGC803 cell growth and proliferation; however, the growth and proliferative ability of MGC803/miR-PRSS1 cells treated with the PAR-2 agonist SLIGKV-NH2 was completely restored. This suggested that low expression of PRSS1 leads to a decrease in the PAR-2 activation level in MGC803 cells, indicating that PRSS1 plays an important role in maintaining cell growth and proliferation in a PAR-2-dependent manner.
PRSS1, a T cell receptor protein, is an important molecule for tumor signal transduction and activity regulation. PRSS1 activates receptors or ligands on the cell surface and is involved in cell growth, proliferation, differentiation and migration through the MAPK/ERK signaling pathway [29-31]. The ERK signaling pathway is a classic pathway of the mitogen-activated protein kinase (MAPK) family [32], which is mainly responsible for transmitting extracellular signals to the nucleus and regulating cell proliferation, differentiation, metastasis and survival [33]. Activated PAR-2 is involved in ERK signaling and mediated tumor cell proliferation [34]. However, the function of the ERK signaling pathway in GC needs further study. Phosphorylated ERK1/2 is an important marker of ERK signaling pathway activation [35]. In the present study, we confirmed that knockdown of PRSS1 expression significantly inhibited the activation of the ERK signaling pathway, and the inhibitory effect was comparable to that of MGC803 cells treated with FSLLRY-NH2. Interestingly, when MGC803/miR-PRSS1 cells were incubated with SLIGKV-NH2, the level of phosphorylated ERK1/2 was completely restored. Our data indicated that knockdown of PRSS1 expression prevents the activation of the ERK signaling pathway by reducing PAR-2 activation in MGC803 cells. This is consistent with previous reports that PAR-2 activation may affect ERK signaling pathway activation [36].
Together, our data demonstrate that PRSS1 protein expression was significantly increased in GC and was positively correlated with differentiation, tumor size, and lymph node metastasis. In addition, PRSS1 is a target gene of miR-146a-5p. MiR-146a-5p targets PRSS1 and suppresses the growth and proliferation of MGC803 cells. Silencing PRSS1 expression inhibits ERK signaling pathway activation by reducing PAR-2 activation, resulting in suppressed growth and proliferation of MGC803 cells. Further research and attention on PRSS1 will help us better understand the occurrence and progression of GC and provide novel evidence for the identification of biomarkers or potential targets for the early treatment of GC.
Abbreviations
GC: gastric carcinoma; LCM: laser capture microdissection; PRSS1: serine protease 1; iTRAQ: isobaric tags for relative and absolute quantitation; Q-TOF MS/MS: quadrupole time-of-flight tandem mass spectrometry; PAR-2: protease-activated receptor-2; NGM: normal gastric mucosa; AH: atypical hyperplasia; GPDAC: poorly differentiated gastric adenocarcinoma; LMGAC: lymph node metastasis adenocarcinoma; IHC: immunohistochemistry; ICC: immunocytochemistry; NC: negative control; MAPK: mitogen-activated protein kinase; PRSS1-WT: wild-type PRSS1; PCNA: proliferating cell nuclear antigen; miR-PRSS1: pcDNA6.2TM-GW/EmGFP-miR-PRSS1; PRSS1-NC: negative control plasmid pcDNA6.2TM-GW/EmGFP-miR; FSLLRY-NH2: PAR-inhibitor; SLIGKV-NH2: PAR-2 agonist.
Supplementary Material
Supplementary tables.
Acknowledgements
Our study was supported by the Hunan Provincial Groundbreaking Platform Open Fund of University of China (NO. 18K076), the Doctoral Research Fund of University of South China (NO. 2016XQD21), the University of South China and Horizontal Cooperation Project of Yueyang Maternal and Child Health Hospital (NO. 2018KHX43), the Hunan Provincial Health Department Project (No. B2019119), Hunan Science and Technology Innovation Project (NO. 2018SK51601) and the Natural Science Foundation of Hunan Province (NO. 20JJ4083).
Author contributions
Dongmei Ye and Heliang Zhang: conducting the main experiments in this work. Yujie Tang and Zhiwei Zhou: performing the research and data analysis. Dongmei Ye and Yuxuan Li: writing the manuscript. Qiang Zhao and Zhiwei Zhang: conceiving and designing the study; providing financial support. All authors read and approved the final manuscript.
Competing Interests
The authors have declared that no competing interest exists.
References
1. Bray F, Ferlay J, Soerjomataram I, Siegel RL, Torre LA, Jemal A. Global cancer statistics 2018: GLOBOCAN estimates of incidence and mortality worldwide for 36 cancers in 185 countries. CA Cancer J Clin. 2018;68:394-424
2. Ferlay J, Soerjomataram I, Dikshit R, Eser S, Mathers C, Rebelo M. et al. Cancer incidence and mortality worldwide: sources, methods and major patterns in GLOBOCAN 2012. Int J Cancer. 2015;136:E359-86
3. Katai H, Ishikawa T, Akazawa K, Isobe Y, Miyashiro I, Oda I. et al. Five-year survival analysis of surgically resected gastric cancer cases in Japan: a retrospective analysis of more than 100,000 patients from the nationwide registry of the Japanese Gastric Cancer Association (2001-2007). Gastric Cancer. 2018;21:144-54
4. Subbannayya Y, Mir SA, Renuse S, Manda SS, Pinto SM, Puttamallesh VN. et al. Identification of differentially expressed serum proteins in gastric adenocarcinoma. J Proteomics. 2015;127:80-8
5. Bongiovanni M, Molinari F, Eszlinger M, Paschke R, Barizzi J, Merlo E. et al. Laser capture microdissection is a valuable tool in the preoperative molecular screening of follicular lesions of the thyroid: an institutional experience. Cytopathology. 2015;26:288-96
6. Cao W, Ye LH, Cao J, Xu JJ, Peng LQ, Zhu QY. et al. Quantitative analysis of flavanones from citrus fruits by using mesoporous molecular sieve-based miniaturized solid phase extraction coupled to ultrahigh-performance liquid chromatography and quadrupole time-of-flight mass spectrometry. J Chromatogr a. 2015;1406:68-77
7. Zeng K, Liu QC, Lin JH, Lin XH, Zhuang ZH, Gao F. et al. Novel mutations of PRSS1 gene in patients with pancreatic cancer among Han population. Chin Med J (Engl). 2011;124:2065-7
8. Koskensalo S, Hagstrom J, Louhimo J, Stenman UH, Haglund C. Tumour-associated trypsin inhibitor TATI is a prognostic marker in colorectal cancer. Oncology. 2012;82:234-41
9. Song JY, Bae HS, Koo DH, Lee JK, Jung HH, Lee KW. et al. Candidates for tumor markers of cervical cancer discovered by proteomic analysis. J Korean Med Sci. 2012;27:1479-85
10. Iacona JR, Monteleone NJ, Lutz CS. miR-146a suppresses 5-lipoxygenase activating protein (FLAP) expression and Leukotriene B4 production in lung cancer cells. Oncotarget. 2018;9:26751-69
11. Bleau AM, Redrado M, Nistal-Villan E, Villalba M, Exposito F, Redin E. et al. miR-146a targets c-met and abolishes colorectal cancer liver metastasis. Cancer Lett. 2018;414:257-67
12. Cui Y, She K, Tian D, Zhang P, Xin X. miR-146a Inhibits Proliferation and Enhances Chemosensitivity in Epithelial Ovarian Cancer via Reduction of SOD2. Oncol Res. 2016;23:275-82
13. Yao Q, Tu C, Lu D, Zou Y, Liu H, Zhang S. Clinicopathological significance of the microRNA-146a/WASP-family verprolin-homologous protein-2 axis in gastric cancer. Cancer Sci. 2017;108:1285-92
14. Nakanuma S, Tajima H, Okamoto K, Hayashi H, Nakagawara H, Onishi I. et al. Tumor-derived trypsin enhances proliferation of intrahepatic cholangiocarcinoma cells by activating protease-activated receptor-2. Int J Oncol. 2010;36:793-800
15. Kularathna PK, Pagel CN, Mackie EJ. Tumour progression and cancer-induced pain: a role for protease-activated receptor-2? Int J Biochem Cell Biol. 2014;57:149-56
16. Szmola R, Sahin-Toth M. Uncertainties in the classification of human cationic trypsinogen (PRSS1) variants as hereditary pancreatitis-associated mutations. J Med Genet. 2010;47:348-50
17. Hanahan D, Weinberg RA. Hallmarks of cancer: the next generation. Cell. 2011;144:646-74
18. Li Y, Wang YW, Chen X, Ma RR, Guo XY, Liu HT. et al. MicroRNA-4472 Promotes Tumor Proliferation and Aggressiveness in Breast Cancer by Targeting RGMA and Inducing EMT. Clin Breast Cancer. 2019
19. Ali S, Ahmad A, Aboukameel A, Ahmed A, Bao B, Banerjee S. et al. Deregulation of miR-146a expression in a mouse model of pancreatic cancer affecting EGFR signaling. Cancer Lett. 2014;351:134-42
20. Hou Z, Xie L, Yu L, Qian X, Liu B. MicroRNA-146a is down-regulated in gastric cancer and regulates cell proliferation and apoptosis. Med Oncol. 2012;29:886-92
21. Luo Z, Li X, Zhao Z, Yang X, Xiao S, Zhou Y. MicroRNA-146a affects the chemotherapeutic sensitivity and prognosis of advanced gastric cancer through the regulation of LIN52. Oncol Lett. 2017;13:1386-92
22. Xiao B, Zhu ED, Li N, Lu DS, Li W, Li BS. et al. Increased miR-146a in gastric cancer directly targets SMAD4 and is involved in modulating cell proliferation and apoptosis. Oncol Rep. 2012;27:559-66
23. Kim DH, Chang MS, Yoon CJ, Middeldorp JM, Martinez OM, Byeon SJ. et al. Epstein-Barr virus BARF1-induced NFkappaB/miR-146a/SMAD4 alterations in stomach cancer cells. Oncotarget. 2016;7:82213-27
24. Sheng J, Deng X, Zhang Q, Liu H, Wang N, Liu Z. et al. PAR-2 promotes invasion and migration of esophageal cancer cells by activating MEK/ERK and PI3K/Akt signaling pathway. Int J Clin Exp Pathol. 2019;12:787-97
25. Jiang Y, Yau MK, Lim J, Wu KC, Xu W, Suen JY. et al. A Potent Antagonist of Protease-Activated Receptor 2 That Inhibits Multiple Signaling Functions in Human Cancer Cells. J Pharmacol Exp Ther. 2018;364:246-57
26. Ammendola M, Sacco R, Vescio G, Zuccala V, Luposella M, Patruno R. et al. Tryptase mast cell density, protease-activated receptor-2 microvascular density, and classical microvascular density evaluation in gastric cancer patients undergoing surgery: possible translational relevance. Therap Adv Gastroenterol. 2017;10:353-60
27. Caruso R, Pallone F, Fina D, Gioia V, Peluso I, Caprioli F. et al. Protease-activated receptor-2 activation in gastric cancer cells promotes epidermal growth factor receptor trans-activation and proliferation. Am J Pathol. 2006;169:268-78
28. Chen J, Xie L, Zheng Y, Liu C. Effects of silenced PAR-2 on cell proliferation, invasion and metastasis of esophageal cancer. Oncol Lett. 2017;14:4115-21
29. Liu J, Zhang HX. A comprehensive study indicates PRSS1 gene is significantly associated with pancreatitis. Int J Med Sci. 2013;10:981-7
30. Sand PG. Mutations in PRSS1 put into perspective. Int J Med Sci. 2014;11:389-90
31. Schnur A, Beer S, Witt H, Hegyi P, Sahin-Toth M. Functional effects of 13 rare PRSS1 variants presumed to cause chronic pancreatitis. Gut. 2014;63:337-43
32. Dhillon AS, Hagan S, Rath O, Kolch W. MAP kinase signalling pathways in cancer. Oncogene. 2007;26:3279-90
33. Yang SH, Sharrocks AD, Whitmarsh AJ. MAP kinase signalling cascades and transcriptional regulation. Gene. 2013;513:1-13
34. Michel N, Heuze-Vourc'H N, Lavergne E, Parent C, Jourdan ML, Vallet A. et al. Growth and survival of lung cancer cells: regulation by kallikrein-related peptidase 6 via activation of proteinase-activated receptor 2 and the epidermal growth factor receptor. Biol Chem. 2014;395:1015-25
35. Chang F, Steelman LS, Lee JT, Shelton JG, Navolanic PM, Blalock WL. et al. Signal transduction mediated by the Ras/Raf/MEK/ERK pathway from cytokine receptors to transcription factors: potential targeting for therapeutic intervention. Leukemia. 2003;17:1263-93
36. McLarty JL, Melendez GC, Brower GL, Janicki JS, Levick SP. Tryptase/Protease-activated receptor 2 interactions induce selective mitogen-activated protein kinase signaling and collagen synthesis by cardiac fibroblasts. Hypertension. 2011;58:264-70
Author contact
![]() Corresponding authors: Prof. Qiang Zhao, Department of Pathology, The First Affiliated Hospital of University of South China, Hunan Hengyang 421001, Hunan Province, P.R. China, E-mail: 749341806com. Prof. Zhiwei Zhang, Cancer Research Institute of Hengyang Medical College, University of South China; Key Laboratory of Cancer Cellular and Molecular Pathology of Hunan, 28 Changsheng Road, Hengyang, Hunan 421001, P.R. China. E-mail: nhdxzzwcom. Tel: 13975497643.
Corresponding authors: Prof. Qiang Zhao, Department of Pathology, The First Affiliated Hospital of University of South China, Hunan Hengyang 421001, Hunan Province, P.R. China, E-mail: 749341806com. Prof. Zhiwei Zhang, Cancer Research Institute of Hengyang Medical College, University of South China; Key Laboratory of Cancer Cellular and Molecular Pathology of Hunan, 28 Changsheng Road, Hengyang, Hunan 421001, P.R. China. E-mail: nhdxzzwcom. Tel: 13975497643.