Impact Factor ISSN: 1449-2288
- Issue 11; 2026
- Issue 10; 2026
- Issue 9; 2026
- Issue 8; 2026
- Issue 7; 2026
- Volume 22; 2026
- Past Issues
- Advance Articles
- Editorial Board
- Cover Images
- Index & Coverage
- Cover Suggestion
- Special Issues
Introduction
Materials and Methods
Results
Discussion
Abbreviations
Supplementary Material
Acknowledgements
References

 Global reach, higher impact
Int J Biol Sci 2022; 18(1):1-14. doi:10.7150/ijbs.64167 This issue Cite
Research Paper
Dysregulation of Transglutaminase type 2 through GATA3 defines aggressiveness and Doxorubicin sensitivity in breast cancer
Gianluca Aguiari1, Francesca Crudele2, Cristian Taccioli3, Linda Minotti2, Fabio Corrà2, Jeffrey W. Keillor4, Silvia Grassilli2,5, Carlo Cervellati2, Stefano Volinia2,5, Carlo M. Bergamini1, Nicoletta Bianchi2 ![]()
1. Department of Neuroscience and Rehabilitation, University of Ferrara, Ferrara, Italy.
2. Department of Translational Medicine, University of Ferrara, Ferrara, Italy.
3. Department of Animal Medicine, Production and Health (MAPS), University of Padua, Padua, Italy.
4. Department of Chemistry and Biomolecular Sciences, University of Ottawa, Ottawa, Canada.
5. Laboratory for Advanced Therapy Technologies (LTTA), Via Fossato di Mortara 70, 44124 Ferrara FE, Italy.
Received 2021-6-22; Accepted 2021-9-30; Published 2022-1-1
Abstract

The role of transglutaminase type 2 in cell physiology is related to protein transamidation and signal transduction (affecting extracellular, intracellular and nuclear processes) aided by the expression of truncated isoforms and of two lncRNAs with regulatory functions.
In breast cancer TG2 is associated with disease progression supporting motility, epithelial-mesenchymal transition, invasion and drug resistance. The aim of his work is to clarify these issues by emphasizing the interconnections among TGM2 variants and transcription factors associated with an aggressive phenotype, in which the truncated TGH isoform correlates with malignancy. TGM2 transcripts are upregulated by several drugs in MCF-7, but only Doxorubicin is effective in MDA-MB-231 cells. These differences reflect the expression of GATA3, as demonstrated by silencing, suggesting a link between this transcription factor and gene dysregulation. Of note, NC9, an irreversible inhibitor of enzymatic TG2 activities, emerges to control NF-ĸB and apoptosis in breast cancer cell lines, showing potential for combination therapies with Doxorubicin.
Keywords: Transglutaminase variants, breast cancer, GATA3, drug resistance, NC9
Introduction
Alteration of gene expression by exon skipping or use of alternative polyadenylation and splicing sites occurs frequently in cancer. In the case of breast cancer (BrCa), the affected transcripts include Breast Cancer 1 suppressor and Epidermal Growth Factor Receptor 2 (HER2) [1], along with Transglutaminase type 2 (TG2) [2], which is reported to be present at higher levels in cancer and in surrounding stroma [3] and is involved in cancer survival, spheroid production [4], resistance to chemotherapy, emergence of stem cells and epithelial-mesenchymal transition (EMT) [5-7].
The recent discovery of variants with imbalanced enzyme activities is consistent with the multiple functions of the Transglutaminase 2 gene (TGM2), whose expression is highly modulated by retinoic acid and other regulatory factors including TNF-α, TGF-β, NF-κB, EGF, cytokines and interleukins. Consequently, alterations of the TG2 system can affect various pathways that seem to implicate TGF-β and NF-ĸB in positive feedback loops through reciprocal mechanisms of activation [8], triggering either cell survival or death. These short remarks give reasons for our interest in the expression of the TG2 variants in BrCa cell lines of different malignancy, and their sensitivity to drugs.
The considerable size of TGM2 and its rapidly repeated activation promote pausing of RNApol II at checkpoints along the gene during the elongation process, leading to generation of altered transcripts [9]. The different isoforms encoded by TGM2 include defective TGH2 and TGH, or alternatively spliced variants tTGv1 and tTGv2, producing shorter isoforms at their C-terminal domains, affecting functions of GTP-binding/hydrolysis and nuclear translocation [10-12]. Additional transcripts contain different 5'-UTR sequences, such as the variants 5 and X1, and others lack exon II or III. Finally, TGM2 generates two long non-coding RNAs (lncRNA), TG2-lncRNA encoded from the first intron and the last exons variant (LEV) containing the terminal 3 exons and the 3'-UTR of the gene [13,14]. The interest in TGM2 transcription is supported by the evidence that isoforms are distinctly involved in EMT, tumor invasion and metastasis [6,15,16]. In addition, the full-length TG2 protein supports cell survival, while the truncated TGH isoform leads to apoptosis in response to drug administration and alteration of their relative levels drives the cells towards drug-resistance [17].
In several types of cancer, drug-sensitivity can be restored using combined therapy with inhibitors of NF-ĸB, a known activator of TGM2 expression [18], and inhibition of TG2 enhances antitumor efficacy of pharmacological molecules [19]. More recently a transcriptomic study about the anticancer effects of 3-O-acetyl-β-Boswellic acid on MDA-MB-231 cells includes TGM2 among the downregulated targets affecting growth, proliferation and metastasis of triple negative cancer cells [20]. The role of TG2 in BrCa is further underlined by the use of short hairpin RNAs. Implantation of MDA-MB-231 cells into nude mice treated with Docetaxel produced tumors of smaller size in the group submitted to RNA interference, suggesting major antitumor effects derived by the combined therapies [21].
Some chemotherapeutic agents interact with nucleic acid sequences. This interesting aspect concerns the mechanism of action of Doxorubicin (Doxo), which is able to bind selectively DNA interfering with chromatin packaging and leading to modulation of transcription [22,23], with an increased production of alternatively truncated polyadenylated variants, as described for Topoisomerase II and other genes that regulate the cell cycle [24]. Note that Doxo induces persistent activation of TG2 in association with cell survival and transamidation activity of the full-length enzyme, which is crucial in Doxo-resistant phenotypes [25].
Our study on BrCa cell lines serves the purpose to provide a model to unravel the modulation of altered TGM2 transcriptional variants following pharmacological exposure and to study the effects of their changes in association with transcription factor interactions, among them GATA3 looks to play a pivotal role. We think that the different expression of altered TGM2 transcripts should be investigated as predictive marks to drive combined treatments towards improving efficacy and overcoming chemo-resistance.
Materials and Methods
BrCa Cell culture and drug treatments
Experiments were carried out on the human hormone responsive MCF-7 and T47D epithelial cell lines (ER+/PR+/HER2-), and on the triple-negative MDA-MB-231 from adenocarcinoma cells that differently from the others display a mesenchymal-like phenotype. All cell lines derive from strains obtained from American Type Culture Collection (Rockville, MD, USA). MCF-7 cells were cultured in Dulbecco's modified Eagle's medium (DMEM, GE-Healthcare, Milano, Italy) supplemented with 10% foetal bovine serum (FBS) and 2 mM L-glutamine (Sigma-Aldrich, St. Louis, MO, USA), T47D in RPMI supplemented as described above, and MDA-MB-231 in L15 medium, 2 mM Glutamine and 15% FBS. Antibiotic solutions were added to the cultures at concentration of 50 U/ml penicillin and 50 μg/ml streptomycin (Sigma-Aldrich), incubated at 37°C under an atmosphere of 5% CO2 in humidified air. MDA-MB-231 were plated at a density of 2x10⁵ and MCF-7 and T47D at 3x10⁵ cells/cm2. Cells were treated with the anticancer drugs (purchased from Chemietek, Indianapolis, IN, USA) dissolved in 0.1% DMSO and employed at the final concentrations of 1 µM AZD5363, 1 µM BYL719, 1 µM Gefitinib, 2 μM Doxo, 0.1 µM Docetaxel and 1 µM XL765. Notably, AZD5363 is an inhibitor of PKB/AKT isoforms, BYL719 inhibits specifically the PI3K α-isoform, Gefitinib targets Epidermal Growth Factor Receptor tyrosine kinases, Doxo binds DNA inhibiting the activity of Topoisomerase II, Docetaxel binds tubulin and induces cell-cycle arrest at the G2/M phase in addition to inhibit Vascular Endothelial Growth Factor, while XL765 is a reversible ATP-competitive inhibitor of pan-Class I PI3Kα, β, γ, δ and mTORC1/mTORC2.
In synergic treatment, the TG2 inhibitor NC9 was added at 30 μM, after 24 h of administration of 0.2, 0.5 or 2 μM Doxo, in double combination for additional 16 h, until the cells were assayed for apoptosis using Annexin V, for cytotoxicity using Cell&Viability kit and Cell Cycle Kit by the MUSE cell analyzer (Luminex Corporation, Austin, TX, USA). At the end of treatment, TG2 was analysed by Western blot using a specific antibody Ig036 (Zedira, Darmstadt, Germany) recognizing both TG2 and TGH, as reported [14].
Extraction of RNA and quantification of gene expression by reverse transcription and quantitative PCR reactions
About 3×10⁶ cells, collected by centrifugation for 10 min at 1200 rpm at 4 °C, were washed three times in phosphate buffered saline (PBS, ThermoFisher Scientific, Invitrogen, Monza, Italy) and total RNA was extracted by TRI Reagent®, following instructions provided in the manufacturer's protocol (Sigma-Aldrich). Reverse transcription was performed using 1 µg of total RNA and TaqMan® Reverse Transcription Reagents kit (ThermoFisher Scientific) with primers and conditions of quantitative polymerase chain reaction (qPCR) reported in Franzese et al. [14] using hypoxanthine phosphoribosyl transferase 1 (HPRT1) as reference gene [26]. Fold change was determined by comparing the threshold cycle relative value (CT) of target gene with that of the amplified HPRT1 reference to obtain ΔCT value. To quantify the increase we employed the differences between ΔCT of the treated and untreated samples, the negative exponent in the formula 2-ΔCT to express target modulation, and the 2-ΔΔCT to quantify fold change in a comparative manner.
Arrested-PCR at putative regulatory target sequences by in vitro incubation with Doxo
Target sequences of both TGM2 promoter and intron 10 are reported in Supplementary Table 1 along with the size of PCR products and primers of each template used. Exonic HPRT1 fragment was employed as a negative control. PCR fragments were incubated 10 min with increasing concentrations of Doxo (1, 5, 10, 25 and 50 μM), then amplified by PCR with SYBR® Green Master Mix (ThermoFisher Scientific) and products were checked by electrophoresis in 1% agarose gel with 40 mM Tris-acetate, 1 mM EDTA (TAE) buffer, pH 8.3.
GATA3 silencing and induction by Doxo
The silencing of MCF-7cells already expressing GATA3 was performed without stimulation by Doxo, which instead was employed at 2 μM for 18 h to induce GATA3 in the MDA-MB-231 cells. Before silencing, medium was removed from each well and 800 μl of antibiotic and FBS free-medium were added along with 200 μl of siRNA transfection solution. For silencing, BrCa cells seeded according to the protocol of Dharma FECT (Carlo Erba Reagents, Milan, Italy) were transfected with siRNA against GATA3 transcript (Individual ON-TARGETplus GATA3 siRNA, cat. FE5J003781060002) and negative control siRNA (siRNA neg, cat. FE5D0013200120). The lyophilized siRNAs were resuspended at 5 μM concentration and diluted to 100 nM final concentration [27] for experiments in 12-wells plates (4 cm2/well). After 8 h of incubation FBS was added and 48 h later RNA was extracted and GATA3 expression was analyzed by reverse transcription and quantitative polymerase chain reaction (RT-qPCR) using 150 nM primers (FGATA3Ex, 5'-CAGCACAGAAGGCAGGGAG-3' and RGATA3Ex, 5'-TCTGACAGTTCGCACAGGAC-3') and PowerUp™ SYBR® Green Master Mix (ThermoFisher Scientific, Invitrogen, Monza, Italy) in 20 µl of reaction mixture.
Datasets from GEO for TGM2 gene expression analysis
For our study of TGM2 gene expression, we extracted data from public GEO datasets and analyzed them using HumanExon1_0ST Affymetrix. This array panel is formed by specific probes distributed along the whole genome, allowing rigorous quantification of the expression of all altered transcripts.
The first dataset (access number GSE58598, available on-line at https://www.ncbi.nlm.nih.gov/geo/query/acc.cgi?acc=GSE58598, 18 August 2021) employed in this study includes FFPE tissue derived from biopsies. The epithelial and stromal cells were obtained using Laser Capture Microdissection from BrCa of patients. The second dataset (access number GSE16732, available on-line at https://www.ncbi.nlm.nih.gov/geo/query/acc.cgi?acc=GSE16732) includes samples derived from 40 types of BrCa cell lines. These included 16 ER+ cell lines (ZR75-30, ZR75-1, BT474, MDA-MB-361, UACC812, SUM44, MCF-7, T47-D, CAMA-1, BT483, MDA-MB-415, MDA-MB-330, MPE600, SUM52, MDA-MB-134VI, MDA-MB-175VIII); 8 ER-/HER2+ cell lines (EVSA-T, OCUB-F, SK-BR-3, SK-BR-5, SUM190, SUM225, MDA-MB-453, UACC893) and 16 ER-/PR-/HER2- triple negative cell lines (MDA-MB-468, BT20, DU4475, HCC1937, MDA-MB-436, SUM185, SUM229, Hs578T, OCUB-M, MDA-MB-157, MDA-MB-231, SUM1315, SUM149, SUM159, BT549, SK-BR-7).
The TGM2 gene expression analysis of these datasets was performed by normalizing signal intensity (NI) for each specific probe of the variants and comparing them among the samples, as described by Minotti et al. [28].
Results
Overexpression of TGH transcript as mark of aggressive phenotype
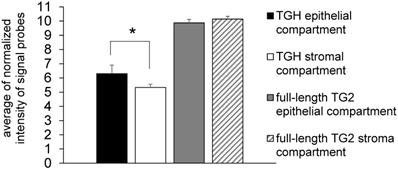
Since many chemotherapeutic agents trigger dysregulated transcription of genes involved in cell cycle [24], we have focussed our studies on the levels of TGM2 transcripts in BrCa taking into account the cell distribution of the TG2 transcripts. In preliminary experiments we analyzed gene expression in samples derived from epithelial (n= 6) and stromal (n= 4) components of formalin-fixed paraffin-embedded (FFPE) tissue sections by means of the accessible dataset of GEO (GSE58598, as detailed above) using the Affymetrix GeneChip® Human Exon 1.0 ST array. The expression of full-length TG2 transcript did not display differences between epithelial and stromal compartments, while TGH mRNA significantly diverged with higher expression in the epithelial compartment (p<0.02) (Figure 1).
Expression of full-length TG2 and TGH in epithelial and stromal tissues. Analysis with HumanExon1_0ST Affymetrix array of the transcripts from dataset GSE58598 is quantified on the base of Normalized Intensity (NI), in FFPE samples derived from biopsies of patients affected by BrCa (epithelial n=6, stromal n=4). p<0.02 is marked by an asterisk for TGH, calculated with GraphPad Prism 6, using unpaired t test two-tailed comparing the epithelial vs. stromal compartment.
We have further extended the analysis of full-length TG2 and TGH to BrCa taking into account the cell lines MCF-7 (ER+/PR+/HER2-) that can be induced to EMT by drug treatments assuming mesenchymal features, and MDA-MB-231, representative of triple negative signature (ER-/PR-/HER2-), invasive and highly aggressive. Data from RT-qPCR analysis showed higher levels of both transcripts in MDA-MB-231 cells compared to MCF-7 cells at 48 h of culture (Figure 2A), in agreement with the greater content of TG2 protein evidenced by Western blot in the triple negative cells (panels of Figure 2A).
Analysis of TGM2 expression in BrCa cells with different phenotypes. In panel A are presented the values of proteins analysed by Western blot, the canonical TG2 isoform of 78 kDa evidenced using mouse monoclonal antibody against β barrel 1 domain (Ig036, Zedira, Germany) and actin as reference; in addition, the full-length TG2 and TGH transcripts were quantified by RT-qPCR comparing MDA-MB-231 to MCF-7 cells as reference sample. Fold increase was evaluated using 2-∆∆CT with HPRT1 as housekeeping gene and p<0.05 calculated with GraphPad Prism 6, using unpaired t test two-tailed. Panels B, C, D report gene expression analysis from the GSE29682 dataset of GEO database clustered in ER+, ER-/HER2+ and triple negative phenotypes. Full-length TG2 and TGH transcripts are quantified on the base of Normalized Intensity (NI) of probe signal recognizing the specific variant as obtained with the HumanExon1_0ST Affymetrix array. The mean values are represented by a bar and each cell line is represented by a point. P values for the full-length TG2 and TGH were calculated with GraphPad Prism 6 comparing the 3 groups to each other. For TGH the comparison ER+ vs. triple negative has p<0.006 using unpaired t test two-tailed, while ER-/HER2+ vs. triple negative has p<0.035 using unpaired t test and Welch's correction.
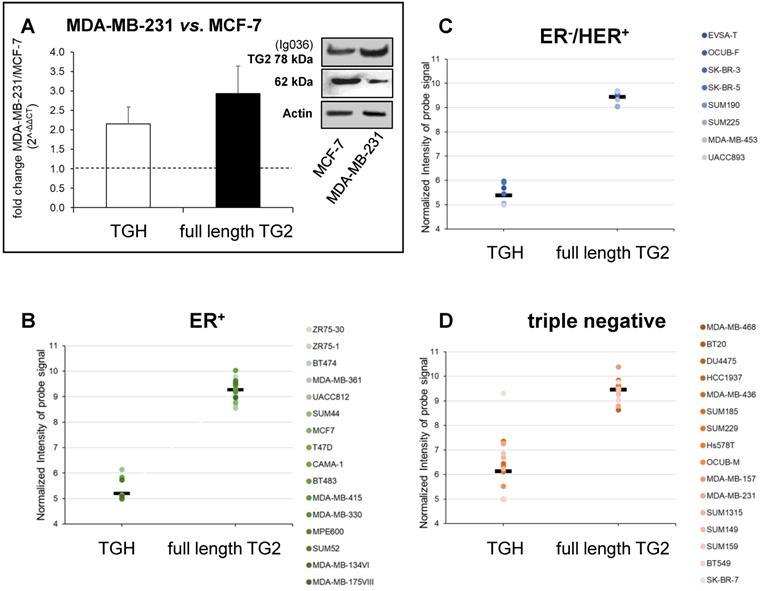
To verify any association between upregulation of TGM2 and aggressive phenotype, we extended the investigation to consider gene expression profiles extracted from the GSE16732 dataset of 40 cell lines [29,30] (including the 16 ER+, 8 ER-/HER2+ and 16 ER-/PR-/HER2- cell lines as defined in Material and Methods section) characterized by a different expression of diagnostic markers routinely employed in histological typing of the tumour. Differences in the levels of the full-length TG2 transcript were moderate within the different samples, while TGH, less expressed than full-length TG2, significantly accumulated in triple negative cells. This was verified by the normalized values of the specific probe recognizing TGH that increased progressively from 5.199 ± 0.09 in ER+ cell lines (above average in 3/16, Figure 2B), to 5.387 ± 0.133 in ER-/HER2+ (increased in 5/8, Figure 2C), and finally in triple negative phenotype with the highest value of 6.137 ± 0.302 (increased in 9/16, Figure 2D). These differences of TGH expression were statistically significant, with p<0.006 when comparing the ER+ vs. triple negative phenotype (determined by GraphPad Prism 6 using unpaired t test assuming two-tailed Gaussian distribution and the same SD in the populations) and p<0.035 when comparing ER-/HER2+ vs. triple negative phenotype (applying Welch's correction). We underline that among the sixteen triple negative cell lines, six derived from primary tumours (BT20, HCC1937, Hs578T, SUM149, SUM159, BT549) had no significantly different expression of TGH transcript when compared to those isolated from pleural effusion having metastatic origin.
Induction of TGM2 transcription by chemotherapeutic drugs in MCF-7 and MDA-MB-231 cells. Specific effects of Doxo on TGM2 promoter and sequences in intron 10
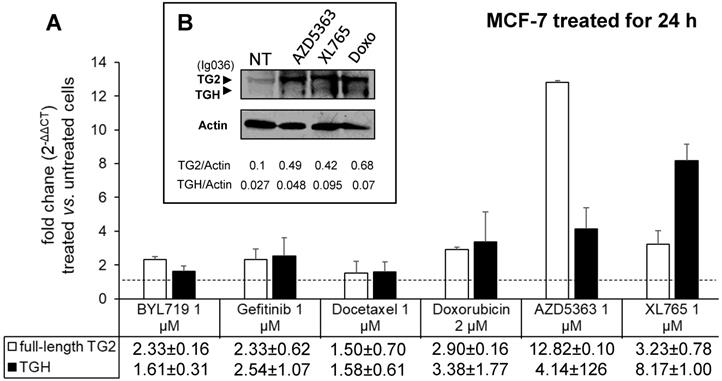
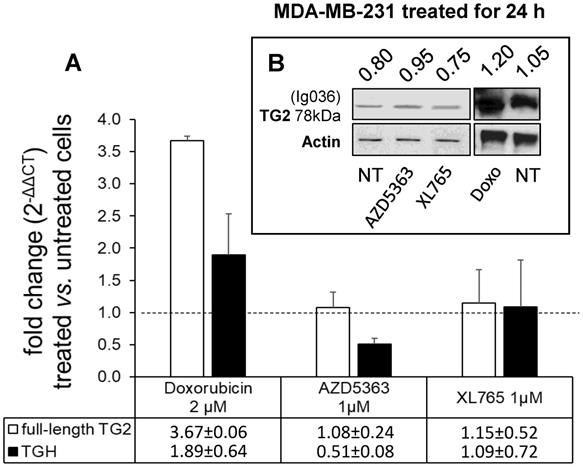
To evaluate the drug sensitivity of the dysregulated expression of TG2 variants in ER+ and in triple negative BrCa cell lines, we performed experiments on MCF-7 and MDA-MB-231 cells. In the first instance, we exposed MCF-7 cells for 24 h to anticancer drugs with different mechanisms of action (AZD5363, BYL719, Gefitinib, Doxo, Docetaxel, and XL765 each at its IC50 concentration) quantifying the levels of full-length TG2 and TGH by RT-qPCR and we detected an increase of transcripts following treatment with all drugs (Figure 3). In parallel, we noted higher levels of TG2 protein after these treatments in this type of cells that easily evolve towards EMT. The most significant effects were observed for AZD5363, XL765 and Doxo, which also increased a band corresponding to TGH by Western blot. We performed an analogous study on the triple negative MDA-MB-231 cells (which have significantly higher basal starting levels of TG2) using the more active compounds AZD5363, XL765 and Doxo). The results demonstrated that only Doxo was able to induce the expression of both TGM2 transcripts and that the amount of TG2 protein varied slightly after 24 h of exposure (Figure 4).
Analysis of TGM2 expression in MCF-7 cells treated with anticancer drugs. In A, after treatment with the listed compounds for 24 h, fold increases of full-length TG2 and TGH mRNAs were quantified by RT-qPCR using 2-∆∆CT with HPRT1 as reference gene and compared to cells treated with solvent (0.1% DMSO) as control. Average value and SD were calculated from n= 3 independent experiments (ANOVA, p<0.05). In B, protein levels of full-length TG2 and TGH are reported with the ratio values, obtained by exposure to the most effective drugs and analyzed by Western Blot using mouse monoclonal antibody against β barrel 1 domain (Ig036, Zedira, Germany) and actin as reference.
Analysis of TGM2 expression in MDA-MB-231 cells treated with anticancer drugs. In A, after treatment with the listed compounds for 24 h, fold increase of full-length TG2 and TGH transcripts were quantified by RT-qPCR using 2-∆∆CT with HPRT1 as reference gene and compared to cells treated with solvent (0.1% DMSO) as control. Average value and SD were calculated from n= 3 independent experiments (ANOVA, p<0.05). In B, protein amount of full-length TG2 is reported with the ratio value calculated with respect to actin as reference, analyzed by Western Blot using mouse monoclonal antibody against β barrel 1 domain (Ig036, Zedira, Germany).
We have further focused our study on the effects of Doxo with respect to the transcriptional expression of TG2 isoforms because its mechanism of action involves recognition of specific DNA sequences and interference at transcription binding sites that could lead to occurrence of altered transcripts [22,24], as well as the suppression of transcriptional/duplication processes through inhibition of Topoisomerase II.
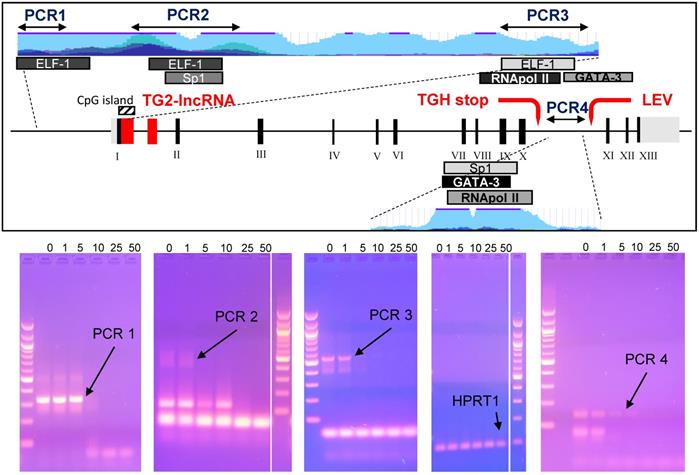
Studies on epigenetic modifications at TGM2 promoter in several types of cancer have demonstrated that the methylation status [31,32] and Myc-mediated histone deacetylation modify the expression of the gene [33]. Among the reliable Doxo target sequences, we investigated four putative regulatory regions of TGM2 that are epigenetically silenced in BrCa [34] and contain consensus sequences for transcription factors associated with Doxo-resistance through SNPs at the promoter [35]. Among them, the PCR1 template (332 bp) contains an ELF-1 site (chr20:36,797,343-36,797,618 GRCh37/hg19) directly involved, while the PCR2 (578 bp) includes Sp1 (chr20:36,796,357-36,796,792 GRCh37/hg19), which displays only a regulatory role, and an additional ELF-1 site (chr20:36,796,361-36,796,696 GRCh37/hg19). The region denoted fragment PCR3 (549 bp), across TG2-lncRNA in the intron 1, includes the transcription start site, a third ELF-1, RNApol II and GATA3 sites (chr20:36,793,632-36,794,015 GRCh37/hg19) in addition to a CpG island (chr20:36,793,550-36,793,867 GRCh37/hg19) [14]. The last PCR4 fragment (141 bp) is inside the intron 10, located after the splicing site and contained consensus sequence target of GATA3 (chr20:36,763,169-36,763,309 GRCh37/hg19), also recognized by a RNApol II site in other type of cancer [14].
We tested in vitro interference by Doxo incubation on these PCR products for 10 min before amplification [36], using progressively increasing concentrations of 1, 5, 10, 25 and 50 μM. We have chosen exonic HPRT1 fragment as a negative control to determine the specificity of the DNA-binding drug. PCR products, primers and sizes are summarised in Supplementary Table 1. Doxo inhibited the amplification of the DNA templates PCR1, PCR2, PCR3 and PCR4, but not of the HPRT1 fragment (Figure 5, bottom panel). Appreciable effects were observed on PCR1 and PCR4 with reduction of intensity at 5 μM, and on PCR2 and PCR3 at as low as 1 μM. These results suggest that Doxo affects the in vitro elongation process. Highly interesting are the effects on PCR3 containing CpG island, subject to methylation by DNA methyltransferase I known to be inhibited by Doxo, the activity of which was recently reported to alter profile of cell survival genes [37].
In the box the TGM2 gene map, with the numbered exons in Black, while in Red the TG2-lncRNA within the intron 1, the stop codon generating the truncated variant TGH and the start of transcription of another lncRNA named LEV. The portions of the gene amplified by arrested-PCR were enlarged with positions of the selected transcription factors and CpG island, as well as H3K27Ac marks (light blue). In Blue, regions corresponding to the arrested-PCR1, -PCR2, -PCR3 of TGM2 regulatory regions, and -PCR4 of intron 10. In the bottom, the PCR amplifications without preincubation with drug (0), or carried out following 10 min incubation with 1, 5, 10, 25 and 50 μM of Doxo. Amplification conditions are specified in Material and Methods and described in Supplementary Table 1. The PCR amplified from an exonic region of HPRT1 was used as negative control to test Doxo-binding. Electrophoretic migration was performed in 2% agarose gel in TAE-Buffer. Molecular size marker used is 100 bp DNA ladder (New England Biolabs, MA, USA).
Our selected regulatory regions were analysed using ChIP-sequencing datasets from ENCODE carried out on MCF-7 cells to verify the presence of binding sites for the nuclear factors indicated in Figure 5. In the relevant data summarised in Supplementary Figure 1, we identified high signal peaks of enriched-reads mapping to sequences recognized by RNApol II, adjacent to a less pronounced one for GATA3 present in the PCR3 fragment. The same genomic region is recognized by di- and tri-methylated H3K4 in correspondence with the CpG island encoding TG2-lncRNA, inside the intron 1 close to the transcription starting point, where H3K4me2 is associated to transcriptional activation of genes promoting DNA repair deriving from genotoxic stress [38,39].
An additional GATA3 binding site, shown in Supplementary Figure 2, displayed remarkably high enrichment at the GATA3 binding site in the intron 10 (PCR4 sequence), in a regulatory region downstream the alternative stop codon generating TGH and upstream of the start of the second LEV lncRNA, already described in other types of cancers by Franzese et al. [14]. This latter GATA3 consensus element is evolutionarily conserved and corresponds with enrichment peaks evidencing histone marks like H3K4me1 or H3K27ac, the last requiring additional factors to coordinate enhancer functions [40]. The signal intensity of this second peak at the intron 10 (PCR4) is in agreement with its higher recognition by GATA3 than that located in the intron 1 near the start of transcription (PCR3). This later position will be also targeted by GATA3 in the presence of major levels of expression of the factor.
GATA3 interferes with accumulation of TG2 isoforms
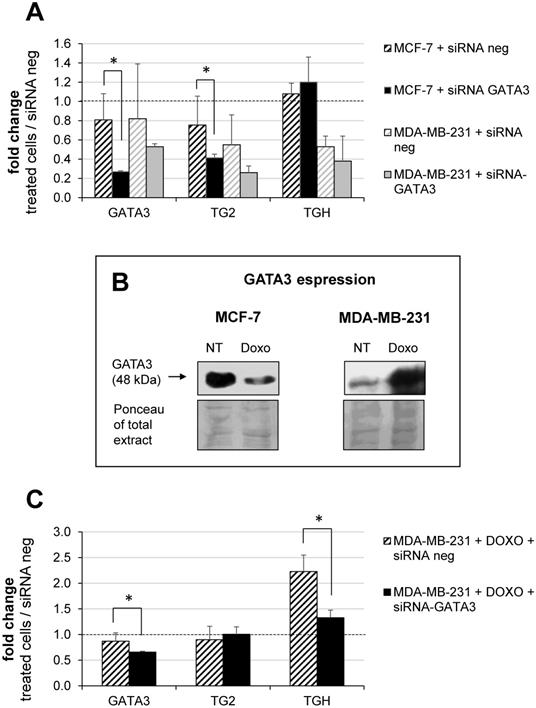
Building on our previous report on the TGM2 in other tumours and on the effects of retinoic acid which involves GATA3 [14], we decided to investigate the modulation of the TGM2 response because GATA3 interacts both with the promoter and additional binding/pausing sites within the intron 10. In BrCa, expression of GATA3 correlates with tumour differentiation, as it is more expressed in MCF-7 [41] and controls invasiveness of MDA-MB-231 cells [42-44]. In this perspective, we have analyzed whether the levels of TG2 and TGH change after silencing of GATA3 using siRNA compared to treatment with siRNA negative control. Data quantified with respect to a set of other siRNA neg samples are reported in Figure 6A, from which it emerges that GATA3 silencing was significantly effective only in the MCF-7 cells. This correlated with a decline in the amount of full-length TG2 transcript, but not in TGH, according with lower affinity of the consensus sequence in intron 1 than that inside the intron 10, which displays high signal in the enrichment peak (comparison between Supplementary Figure 1 and 2). This evidence confirms the persistence of GATA3 at that position and the zone of the stalling of RNApol II, promoting the use of alternative stop site upstream coding TGH. In contrast, MDA-MB-231 cells contain very low basal-levels of GATA3, so silencing cannot be performed. For these reasons, we have verified GATA3 expression in the presence or in the absence of Doxo (Figure 6B, in the box). Our findings indicated that the amount of GATA3 protein decreased after treatment in MCF-7, but was markedly increased after exposure to the drug in MDA-MB-231 cells (Figure 6B). Thus, silencing GATA3 in MDA-MB-231 under stimulation with Doxo significantly reduced TGH expression without affecting the level of full-length TG2 (Figure 6C), whose promoter was stably demethylated and insensitive to the pharmacological action. Also, CpG island at intron 1 results completely demethylated [35] and the regulating elements in that position will be more accessible to other transcriptional control factors.
Modulation of GATA3 expression by siRNA molecules. In A, silencing of GATA3 using 100 nM of specific and negative control siRNA carried out in MCF-7 and MDA-MB-231 cells. RT-qPCR analysis of GATA3, full-length TG2 and TGH mRNAs evaluated referring to another sample treated with siRNA neg, taken as control. Formula 2-∆∆CT and HPRT1 as reference gene were used to obtain the fold change. p<0.01 indicated with asterisk was calculated using GraphPad Prism 6, unpaired t test two-tailed (n= 3 independent experiments). In B, Western blot analysis of extract from MCF-7 and MDA-MB-231 cells untreated or treated with 2 μM Doxo. GATA3 was detected by hybridization with rabbit monoclonal antibody ([EPR16651] ChIP grade ab199428 purchased from Abcam). Ponceau S stain is shown to compare the protein amounts in the extracts. In C, silencing of GATA3 using 100 nM of specific and siRNA neg carried out in MDA-MB-231 cells pre-treated with 2 μM Doxo (as reported in Material and Methods). Quantification by RT-qPCR of GATA3, full-length TG2 and TGH mRNAs was evaluated referring to another set of samples treated with siRNA neg. HPRT1 was used as reference gene to apply formula 2-∆∆CT. Fold change was reported and p<0.001 indicated with asterisk was calculated using GraphPad Prism 6, unpaired two-tailed t test (n= 4 independent experiments).
Effects of Doxo-mediated TG2 induction were limited by NC9 inhibitor
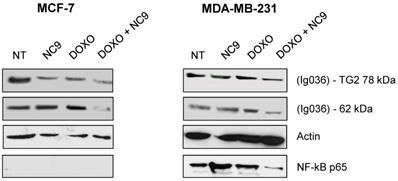
Experiments with NC9 were performed on BrCa cells to verify whether the action of Doxo depends on an accumulation of TG2 as in other types of cancers [45-49]. In this approach NC9 was added at 30 μM concentration (Ki value) for 16 h, after 24 h of treatment with Doxo for a total exposure time of 40 h. In this way we studied the effects of this drug combination on the expression of NF-ĸB in MCF-7 and MDA-MB-231 cells. Firstly, analysing TG2 protein by Western Blot under conditions allowing discrimination of molecular weight differences, we were able to observe an accumulation of the canonical isoform (78 kDa), but also of an additional band corresponding to the weight of the truncated TGH (62 kDa), with high intensity in cells induced by Doxo, using an antibody reactive against both isoforms (Figure 7). The combined use of Doxo and NC9 decreased both isoforms in each type of cell. Regarding NF-ĸB p65, it decreased effectively in MDA-MB-231 cells, which contain high levels of this factor, in agreement with its role in supporting inflammation in this specific type of tumour, while no conclusion can be reached in MCF-7 in which this factor is undetectable.
Effects of treatment with NC9 and Doxo on NF-ĸB expression. Exposure to Doxo was carried out during 40 h. At 24 h the NC9 was added at 30 μM concentration, and treatment was continued for additional 16 h. Western blot analyses were carried out in MCF-7 and MDA-BM-231 cells (right left panel respectively). The electrophoretic run was optimized to discriminate possible full-length TG2 of 78 kDa with a specific Ab directed to terminal carboxy portion of the protein (Ig037, Zedira, Germany) and TGH as additional band of 62 kDa evidenced by using of mouse monoclonal antibody against β barrel 1 domain (Ig036, Zedira, Germany). In addition, NF-ĸB p65 was recognized by an antibody from Santa Cruz Biotechnology (Milan, Italy) in the same samples, but it was not detected in MCF-7 because of the low level of expression. Actin was employed as control.
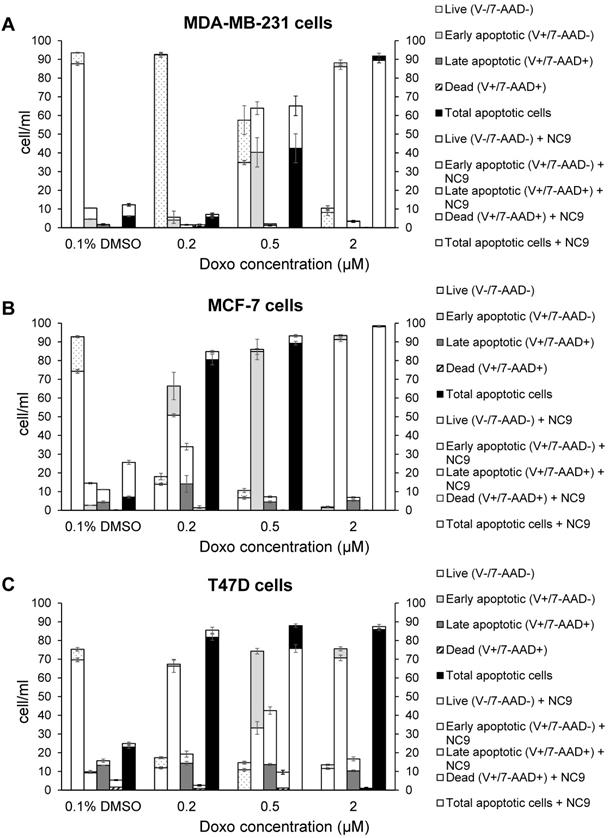
Likewise, we performed experiments to analyse apoptosis, since it has been reported that Doxo promotes and TG2 prevents apoptosis in epidermal growth factor activated BrCa cell lines [50], as well as an increase of TG2 has been associated with drug-resistance [52]. We analyzed the effects of NC9 on apoptosis induced using several Doxo concentrations, in the presence or absence of the TG2 inhibitor, by assaying after 40 h, of which the last 16 h represent combined treatment. The different phases of apoptosis were detected with Annexin V kit in the triple negative MDA-MB-231 and in ER+/PR+/HER2-MCF-7 and T47D cell lines, both of which can develop drug-resistance. Along the dilution points of Doxo we observed that its double-combination with NC9 drove MDA-MB-231 cells to apoptosis by increasing early apoptosis (+23.55% at 0.5 μM Doxo+30 μM NC9, Figure 8A), while it enhanced late apoptosis in both MCF-7 cells (+19.90% at 0.2 μM Doxo+30 μM NC9, Figure 8B) and T47D cells (+28.8% at 0.5 μM Doxo+30 μM NC9, Figure 8C), under conditions in which the cells were normally highly viable (not less than 10% difference compared to untreated) (Supplementary Figure 3). A decrease of viability was more evident in the T47D cells, but at combined treatment of NC9 at 2 μM Doxo, in which it achieved 37%. Overall, we can conclude that the effects of the combined treatment pushes towards apoptosis some cells that could escape from Doxo therapy. Parallel analysis of cell cycle displayed that double-treatment had different effects depending on the type of cells. In MDA-MB-231 cells, double treatment increased the percentage of cells in G0/G1 with a reduction also of those in S phase, but it almost completely stopped MCF-7 in G2/M. In T47D cells, the addition of NC9 showed an increase of percentage of cells with an accumulation in cycle phase more like MDA-MB-231 cells (Supplementary Figure 4).
Effects of NC9 on apoptosis of Doxo treated BrCa cells. Doxo administration and NC9 treatment were performed under the exact same conditions as in Figure 7. Apoptotic effects were evaluated with Annexin V and MUSE cell analyzer (Luminex Corporation) in MDA-MB-231 (A), MCF-7 (B) and T47D (C) cells. In the charts Live (Annexin V-/7-ADD-), early apoptotic (Annexin V+/7-ADD-), Late apoptotic (Annexin V+/7-ADD+) and dead (Annexin V+/7-ADD+) cells are indicated for each sample. White histograms represent samples treated also with NC9.
Discussion
Involvement of TG2 in BrCa, postulated since 1996 [51], has been confirmed by many reports supporting the relevant role of the enzyme in promoting EMT, metastatic progression [16] and drug resistance [4,52]. Since the mechanisms underlying these pathological processes and the relationship of TG2 with transcriptional factors that regulate gene expression and other players supporting these networks have not been sufficiently elucidated, we have tried to highlight interconnections among all these elements. A main point we have considered is the distribution of TG2 isoforms in BrCa cell lines, in relationship with the degree of malignancy. The truncated transcript TGH accumulates in triple negative MDA-MB-231 cells, typically actively transcribing with elevated proliferation rate [2], and higher TG2 protein than MCF-7 cells. This specific accumulation of the truncated isoform TGH likely depends on the stall/interference of RNApol II during transcription, promoting the use of an alternative polyadenylation site along the TGM2 gene, as already described for other types of cancer cells [14]. We have expanded the investigation to a great number of BrCa lines (about 40) confirming that the TGH variant accumulates heavily in the triple negative phenotype, deriving from primary tumours (BT20, HCC1937, Hs578T, SUM149, SUM159, BT549) or metastatic cells isolated from pleural effusions (MDA-MB-231, MDA-MB-436, SUM185, SUM229, SUM1315) that display an aggressive behaviour. In this context, the ratio between full-length TG2 and TGH isoforms could be a relevant feature of actively proliferating cells.
In this perspective we have further analysed the effects of chemotherapeutic agents on the expression of TG2 and of the variant TGH. All the employed drugs upregulated both transcripts in MCF-7 cells, especially AZ5363 [53], XL765 [54] and Doxo which also induced a significant increase of the coded isoforms, as appreciable in western bot analysis. In the case of MDA-MB-231 cells only Doxo induces TGM2 transcripts, but we did not observe a further increase in the protein aliquot considering the high levels already present. This drug is largely used in the treatment of solid tumours, but it is known that Doxo induces persistent activation of TG2 in association with cell survival and resistance to therapy [25].
Considering the mechanism of Doxo, it binds selective DNA sequences affecting methylation at CpG islands also at selected genes associated to cell survival [37] and interfering with activity of Topoisomerase II, producing truncated variants [22-24]. Since our results are in line with interference of Doxo with the TGM2 gene, we scrutinized involvement of transcriptional factors with regulatory functions, considering that Doxo resistant cells do not display TGM2 silencing associated with demethylation events [34]. We focussed on some specific promoter regions, including targets of methylation/acetylation and sequences recognized by factors associated with Doxo-resistance [35] and at a portion of intron 10 located after the stop codon leading to truncated TGH [14] in experiments of in vitro arrested-PCR carried out in the presence of the drug. The results demonstrated that Doxo inhibited the amplification of mimic templates.
Of special interest is the presence of GATA3 sites both in the transcription starting region and in the intron 10 close to sites for RNApol II, which suggests a possible co-action of GATA3 and Doxo in the regulation of this gene [43]. To clarify this point, we silenced GATA3 in MCF-7 cells (which already express this factor) and in MDA-MB-231 upon stimulation with Doxo, because these cells express very low levels unless treated. Under these conditions, siRNA against GATA3 downregulates the full-length TG2 in MCF-7 cells and TGH in MDA-MB-231 cells (which are hypomethylated at the TGM2 promoter and present high levels of TGH). All these data confirm a relationship among Doxo, GATA3 and the TGM2 expression, by one side influencing GATA3 (which becomes downregulated in MCF-7 and upregulated in MDA-MB-231 cells) by the other modulating the levels of transglutaminase isoforms, which likely act in transducing downstream cascade(s).
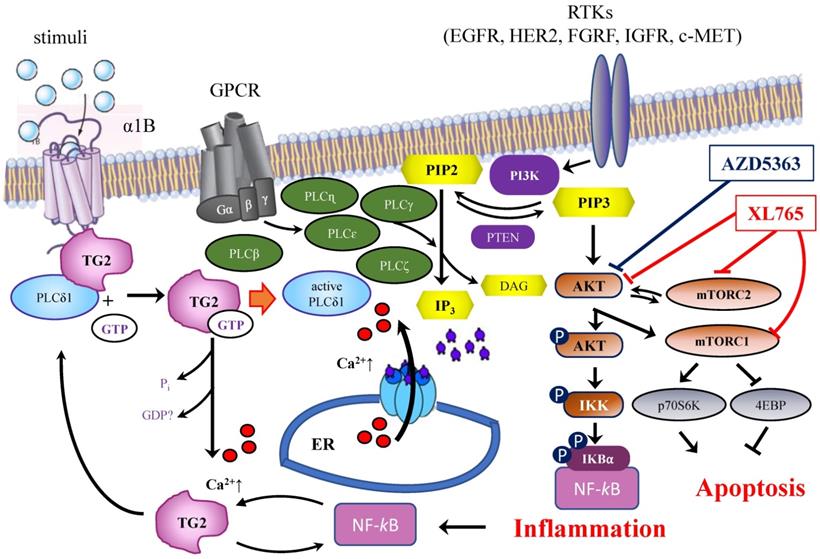
A correlation between TGM2 gene and tumour behaviour has been proposed in several studies on ovarian [17] and pancreatic tumours [19] in a variety of experimental systems [21]. The results suggested that the downregulation of TG2 can reverse EMT and modulate the sensitivity of BrCa toward anticancer drugs. These line of experimental evidences were supported using inhibitors mainly directed against the transamidating activity of TG2, but in some instances also affecting the G-protein signalling [50]. This is the case of the well-known irreversible inhibitor NC9, which has been shown to prevent nuclear translocation of TG2 and increase its proteasome-mediated degradation [55], altering conformation of TG2 enzyme thus blocking both catalytic activity and intracellular GTP-binding [47,56]. The latter feature of NC9 is particularly relevant, if we consider that the TGH isoform of the enzyme is still capable of hydrolysing GTP, albeit with low binding efficiency [12]. NC9 has been shown to irreversibly block both functions, especially in cancer types [45,47-49,55,56]. Our data demonstrated that the choice to use NC9 in combined treatments proved effective, driving MDA-MB-231 cells to early apoptosis and MCF-7 and T47D cells to late apoptosis, limiting the progression of cell cycle but inducing accumulation of cells in different phases, depending on the type of cell, while also decreasing NF-ĸB in MDA-MB-231 cells. In agreement with data from other types of cancer, NC9 attenuated NF-ĸB-mediated inflammation promoted by TG2 upregulation under stimulus by ATRA, opposing its nuclear translocation [55]. Analogously, it has been reported that in MDA-MB-231 cells and in MCF-7 cell resistant to Doxo, the activation of NF-ĸB correlates with TG2 inhibition by siRNA, increasing IĸBα with accumulation of NF-ĸB in the cytosol [18]. Notably, BrCa is known to be supported by the inflammatory processes [18] and NF-ĸB itself promotes overexpression of TGM2 by a positive feedback loop and by TG2-mediated production of interleukins [8,57]. Hence TG2 inhibitors can provide an advantage to control the enzymatic activity, when this condition occurs, as in the case of BrCa treatment with chemotherapeutic agents, like AZD5363 or XL765, interfering with pathways involving TG2 (Figure 9). In our studies, the responses to AZD5363 and to XL765 were different in MDA-MB-231 and MCF-7 cells, likely related to the different mechanisms of action of these compounds [53,58]. The relationship between aggressive phenotype in triple negative BrCa cells and the PLCδ1 pathway has been also associated with poor prognosis, highlighting its value as therapeutic target [58]. Our observations in several triple negative cell lines suggest a correlation between these features and an unbalanced ratio among TG2 isoforms, whose functional activity must be better defined.
Schematic representation of the interrelations among TG2, PLCδ1 and PIP2/PIP3 signaling pathways and target proteins of ADZ5363 and XL765 anticancer agents.
TG2 is an important predictive and prognostic factor [4,59] and analysis of the gene expression profile of TGM2 can be useful to test potential effects for evaluation of efficacy/resistance to therapy in patients with BrCa, performing predictive in vitro experiments before setting up in vivo administration. Here, we propose that the monitoring of TGM2 variants and the use of appropriate strategies to suppress TGM2 expression (with antisense-RNA or RNA interference), and the use of enzyme inhibitors, can improve through a combined action the effects of common anticancer agents. In this perspective, inhibition TG2 could represent a therapeutic strategy to drive the cells to apoptosis and to oppose drug-resistance [50,60]. This might open the way to a fruitful field of investigation for novel therapeutic combinations, in which TG2 inhibition could be associated with integrin [61] and mTOR inhibitors [62] or strategies targeting transcription factors, for instance directed to GATA3, effective against mRNA [63] or the DNA-binding activity of this factor [64].
Abbreviations
BrCa: breast cancer; CT: threshold cycle; Doxo: Doxorubicin; EMT: epithelial-mesenchymal transition; FFPE: formalin-fixed paraffin-embedded; FBS: foetal bovine serum; HER2: Epidermal Growth Factor Receptor 2; HPRT: hypoxanthine phosphoribosyltransferase 1; LEV: last exons variant; lncRNA: long non-coding RNA; NI: normalized signal intensity; RT-qPCR: reverse transcription and quantitative polymerase chain reaction; siRNA neg (siRNA negative control); TG2: Transglutaminase type 2; TGM2: Transglutaminase 2 gene.
Supplementary Material
Supplementary figures and table.
Acknowledgements
We thank LTTA, Research and Technology Transfer Laboratory accredited by Emilia Romagna Region for the support and Co.Pe.Go. (Soc.Coop.O.P.) for liberal voluntary contribution to this study.
Funding
This work was supported by: N. Bianchi is supported by FAR2019 (prot. FAR1938794) and FAR2020 (prot. FAR2057432); C.M. Bergamini is supported by grants FAR2019 and FAR2020; C. Taccioli has been supported by the by the University of Padova through the M.A.P.S department under the program BIRD2021 prot. BIRD213010.
Data Availability
All data are available within this manuscript, and in the listed GSE of GEO as indicated.
Author Contributions
C.M.B. and N.B. conceptualization; G.A., C.M.B., and N.B, data curation; F.C., and L.M. formal analysis; G.A., J.W.K. and N.B. investigation; F.C., L.M., F.C. and S.G. methodology; C.M.B. and N.B. writing-original draft; C.C., C.T. and J.W.K., writing-review and editing; G.A. and S.V. resources; C.T., C.M.B., S.V., and N.B. funding acquisition; N.B., supervision.
ORCID
- Gianluca Aguiari, https://orcid.org/0000-0002-0007-0805;
- Francesca Crudele, https://orcid.org/0000-0003-4638-9122;
- Cristian Taccioli, https://orcid.org/0000-0003-2995-5612;
- Linda Minotti, https://orcid.org/0000-0003-2116-8411;
- Fabio Corrà, https://orcid.org/0000-0002-6803-0797;
- Jeffrey W. Keillor, https://orcid.org/0000-0002-8133-6862;
- Silvia Grassilli, https://orcid.org/0000-0001-8502-4498;
- Carlo Cervellati, https://orcid.org/0000-0003-4777-6300;
- Stefano Volinia, https://orcid.org/0000-0003-0910-3893;
- Carlo M. Bergamini, https://orcid.org/0000-0002-9430-8625;
- Nicoletta Bianchi, https://orcid.org/0000-0001-9280-6017.
Competing Interests
The authors have declared that no competing interest exists.
References
1. Martínez-Montiel N, Anaya-Ruiz M, Pérez-Santos M, Martínez-Contreras RD. Alternative splicing in breast cancer and the potential development of therapeutic tools. Genes (Basel). 2017Oct;8(10):217-231
2. Lai TS, Greenberg CS. TGM2 and implications for human disease: role of alternative splicing. Front Biosci (Landmark Ed). 2013Jan1;18:504-519
3. Assi J, Srivastava G, Matta A, Chang MC, Walfish PG, Ralhan R. Transglutaminase 2 overexpression in tumor stroma identifies invasive ductal carcinomas of breast at high risk of recurrence. PLoS One. 2013Sep;8(9):e74437-e74447
4. Eckert RL. Transglutaminase 2 takes center stage as a cancer cell survival factor and therapy target. Mol Carcinog. 2019Jun;58(6):837-853
5. Fisher ML, Adhikary G, Xu W, Kerr C, Keillor JW, Eckert RL. Type II transglutaminase stimulates epidermal cancer stem cell epithelial-mesenchymal transition. Oncotarget. 2015Aug;6(24):20525-20539
6. Kumar A, Gao H, Xu J, Reuben R, Yu D, Mehta K. Evidence that aberrant expression of tissue transglutaminase promotes stem cell characteristics in mammary epithelial cells. PLoS One. 2011Jun;6(6):e20701-e20710
7. Agnihotri N, Kumar S, Mehta K. Tissue transglutaminase as a central mediator in inflammation-induced progression of breast cancer. Breast Cancer Res. 2013Feb;15(1):202-211
8. Brown KD. Transglutaminase 2 and NF-κB: an odd couple that shapes breast cancer phenotype. Breast Cancer Res Treat. 2013Jan;137(2):329-336
9. Wada Y, Ohta Y, Xu M, Tsutsumi S, Minami T, Inoue K, Komura D, Kitakami J, Oshida N, Papantonis A. et al. A wave of nascent transcription on activated human genes. Proc Natl Acad Sci USA. 2009Oct;106(43):18357-18361
10. Eckert RL, Kaartinen MT, Nurminskaya M, Belkin AM, Colak G, Johnson GVW, Mehta K. Transglutaminase regulation of cell function. Physiol Rev. 2014Apr;94(2):383-417
11. Bergamini CM, Collighan RJ, Wang Z, Griffin M. Structure and regulation of type 2 transglutaminase in relation to its physiological functions and pathological roles. Adv Enzymol Relat Areas Mol Biol. 2011;78:1-46
12. Király R, Demény M, Fésüs L. Protein transamidation by transglutaminase 2 in cells: a disputed Ca2+-dependent action of a multifunctional protein. FEBS J. 2011Dec;278(24):4717-4739
13. Bianchi N, Beninati S, Bergamini CM. Spotlight on the transglutaminase 2 gene: a focus on genomic and transcriptional aspects. Biochemical J. 2018May;475(9):1643-1667
14. Franzese O, Minotti L, Aguiari G, Corrà F, Cervellati C, Ferrari C, Volinia S, Bergamini C, Bianchi N. Involvement of non-coding RNAs and transcription factors in the induction of Transglutaminase isoforms by ATRA. Amino Acids. 2019Sep;51(9):1273-1288
15. Tee E, Marshall GM, Liu PY, Xu N, Haber M, Norris MD, Iismaa SE, Liu T. Opposing effects of two tissue transglutaminase protein isoforms in neuroblastoma cell differentiation. J Biol Chem. 2010Feb;285(6):3561-3567
16. Huang L, Xu AM, Liu W. Transglutaminase 2 in cancer. Am J Cancer Res. 2015Aug;5(9):2756-2776
17. Hwang JY, Mangala LS, Fok JY, Lin YG, Merritt WM, Spannuth WA, Nick AM, Fiterman DJ, Vivas-Mejia PE, Deavers MT. et al. Clinical and biological significance of tissue transglutaminase in ovarian carcinoma. Cancer Res. 2008Jul;68(14):5849-5858
18. Kim DS, Park SS, Nam BH, Kim IH, Kim SY. Reversal of drug resistance in breast cancer cells by transglutaminase 2 inhibition and nuclear factor-kappaB inactivation. Cancer Res. 2006Nov15;66(22):10936-10943
19. Lee J, Yakubov B, Ivan C, Jones DR, Caperell-Grant A, Fishel M, Cardenas H, Matei D. Tissue Transglutaminase activates cancer-associated fibroblasts and contributes to Gemcitabine resistance in pancreatic cancer. Neoplasia. 2016Nov;18(11):689-698
20. Mazzio EA, Lewis CA, Soliman KFA. Transcriptomic profiling of MDA-MB-231 cells exposed to Boswellia Serrata and 3-O-Acetyl-B-boswellic acid; ER/UPR mediated programmed cell death. Cancer Genomics Proteomics. 2017 Nov-Dec. 2017;14(6):409-425
21. He W, Sun Z, Liu Z. Silencing of TGM2 reverses epithelial to mesenchymal transition and modulates the chemosensitivity of breast cancer to docetaxel. Exp Ther Med. 2015Oct;10(4):1413-1418
22. Pérez-Arnaiz C, Busto N, Leal JM, García B. New insights into the mechanism of the DNA/doxorubicin interaction. J Phys Chem B. 2014Oct;10(4):1288-1295
23. Dutertre M, Sanchez G, De Cian MC, Barbier J, Dardenne E, Gratadou L, Dujardin G, Le Jossic-Corcos C, Corcos L, Auboeuf D. Cotranscriptional exon skipping in the genotoxic stress response. Nat Struct Mol Biol. 2010Nov;17(11):1358-1366
24. Yang F, Teves SS, Kemp CJ, Henikoff S. Doxorubicin, DNA torsion, and chromatin dynamics. Biochimica e Biophysica Acta. 2014Jan;1845(1):84-89
25. Cho SY, Jeong EM, Lee JH, Kim HJ, Lim J, Kim CW, Shin DM, Jeon JH, Choi K, Kim IG. Doxorubicin induces the persistent activation of intracellular transglutaminase 2 that protects from cell death. Mol Cells. 2012Mar;33(3):235-241
26. de Kok JB, Roelofs RW, Giesendorf BA, Pennings JL, Waas ET, Feuth T, Swinkels DW, Span PN. Normalization of gene expression measurements in tumor tissues: comparison of 13 endogenous control genes. Lab Invest. 2005Jan;85(1):154-159
27. Stojic L, Niemczyk M, Orjalo A, Ito Y, Ruijter AE, Uribe-Lewis S, Joseph N, Weston S, Menon S, Odom DT. et al. Transcriptional silencing of long noncoding RNA GNG12-AS1 uncouples its transcriptional and product-related functions. Nat Commun. 2016Feb;7:10406-10420
28. Minotti L, Baldassari F, Galasso M, Volinia S, Bergamini CM, Bianchi N. A long non-coding RNA inside the type 2 transglutaminase gene tightly correlates with the expression of its transcriptional variants. Amino Acids. 2018Apr;50(3-4):421-438
29. Subik K, Lee JF, Baxter L, Strzepek T, Costello D, Crowley P, Xing L, Hung MC, Bonfiglio T, Hicks DG. et al. The expression patterns of ER, PR, HER2, CK5/6, EGFR, Ki-67 and AR by immunohistochemical analysis in breast cancer cell lines. Breast Cancer. 2010May;4:35-41
30. Dai X, Cheng H, Bai Z, Li J. Breast cancer cell line classification and its relevance with breast tumor subtyping. J Cancer. 2017Sep;8(16):3131-3141
31. Chekhun VF, Lukyanova NY, Kovalchuk O, Tryndyak VP, Pogribny IP. Epigenetic profiling of multidrug-resistant human MCF-7 breast adenocarcinoma cells reveals novel hyper- and hypomethylated targets. Mol Cancer Ther. 2007Mar;6(3):1089-98
32. Huynh TT, Sultan M, Vidovic D, Dean C, Cruickshank BM, Lee K, Loung CY, Holloway RW, Hoskin DW, Waisman DM. et al. Retinoic acid and arsenic trioxide induce lasting differentiation and demethylation of target genes in APL cells. Sci Rep. 2019Jul;9(1):9414-9427
33. Liu T, Tee AE, Porro A, Smith SA, Dwarte T, Liu PY, Iraci N, Sekyere E, Haber M, Norris MD. et al. Activation of tissue transglutaminase transcription by histone deacetylase inhibition as a therapeutic approach for Myc oncogenesis. Proc Natl Acad Sci USA. 2007Nov;104(47):18682-18687
34. Ai L, Kim WJ, Demircan B, Dyer LM, Bray KJ, Skehan RR, Massoll NA, Brown KD. The transglutaminase 2 gene (TGM2), a potential molecular marker for chemotherapeutic drug sensitivity, is epigenetically silenced in breast cancer. Carcinogenesis. 2008Mar;29(3):510-518
35. Xie X, Hanson C, Sinha S. Mechanistic interpretation of non-coding variants for discovering transcriptional regulators of drug response. BMC Biol. 2019Jul;17(1):62-79
36. Passadore M, Bianchi N, Feriotto G, Mischiati C, Giacomini P, Piva R, Gambari R. Differential effects of distamycin analogues on amplification of human gene sequences by polymerase-chain reaction. Biochem J. 1995 Jun;308( Pt 2)(Pt 2):513-519
37. Dejeux E, Rønneberg JA, Solvang H, Bukholm I, Geisler S, Aas T, Gut IG, Børresen-Dale AL, Lønning PE, Kristensen VN. et al. Research DNA methylation profiling in doxorubicin treated primary locally advanced breast tumours identifies novel genes associated with survival and treatment response. Mol Cancer. 2010Mar;9:68-81
38. Barski A, Cuddapah S, Cui K, Roh TY, Schones DE, Wang Z, Wei G, Chepelev I, Zhao K. High-resolution profiling of histone methylations in the human genome. Cell. 2007May;129(4):823-837
39. Wang S, Meyer DH, Schumacher B. H3K4me2 regulates the recovery of protein biosynthesis and homeostasis following DNA damage. Nat Struct Mol Biol. 2020Dec;27(12):1165-1177
40. Zhang T, Zhang Z, Dong Q, Xiong J, Zhu B. Histone H3K27 acetylation is dispensable for enhancer activity in mouse embryonic stem cells. Genome Biol. 2020Feb;21(1):45-52
41. Adomas AB, Grimm SA, Malone C, Takaku M, Sims JK, Wade PA. Breast tumor specific mutation in GATA3 affects physiological mechanisms regulating transcription factor turnover. BMC Cancer. 2014Apr;14:278-292
42. Tarasewicz E, Oakes RS, Aviles MO, Straehla J, Chilton KM, Decker JT, Wu J, Shea LD, Jeruss JS. Embryonic stem cell secreted factors decrease invasiveness of triple-negative breast cancer cells through regulome modulation. Cancer Biol Ther. 2018Apr;19(4):271-281
43. Kim KS, Kim J, Oh N, Kim MY, Park KS. ELK3-GATA3 axis modulates MDA-MB-231 metastasis by regulating cell-cell adhesion-related genes. Biochem Biophys Res Commun. 2018Apr;498(3):509-515
44. Katsuyamaa M, Ibib M, Iwatab K, Matsumotob M, Yabe-Nishimurab C. Clioquinol increases the expression of interleukin-8 by down-regulating GATA-2 and GATA-3. Neurotoxicology. 2018Jul;67:296-304
45. Jambrovics K, Uray IP, Keillor JW, Fésüs L, Balajthy Z. Benefits of Combined All-Trans Retinoic Acid and Arsenic Trioxide Treatment of Acute Promyelocytic Leukemia Cells and Further Enhancement by Inhibition of Atypically Expressed Transglutaminase 2. Cancers. 2020Mar;12(3):648-662
46. Adhikary G, Grun D, Alexander HR, Friedberg JS, Xu W, Keillor JW, Kandasamy S, Eckert RL. Transglutaminase is a mesothelioma cancer stem cell survival protein that is required for tumor formation. Oncotarget. 2018Oct;9(77):34495-34505
47. Kerr C, Szmacinski H, Fisher ML, Nance B, Lakowicz JR, Akbar A, Keillor JW, Wong TL, Godoy-Ruiz R, Toth EA. et al. Transamidase site-targeted agents alter the conformation of the transglutaminase cancer stem cell survival protein to reduce GTP binding activity and cancer stem cell survival. Oncogene. 2017May;36(21):2981-2990
48. Gundemir S, Monteagudo A, Akbar A, Keillor JW, Johnson GVW. The complex role of transglutaminase 2 in glioblastoma proliferation. Neuro Oncol. 2017Feb1;19(2):208-218
49. Shinde A, Paez JS, Libring S, Hopkins K, Solorio L, Wendt MK. Transglutaminase-2 facilitates extracellular vesiclemediated establishment of the metastatic niche. Oncogenesis. 2020Feb;9(2):16-28
50. Antonyak MA, Miller AM, Jansen JM, Boehm JE, Balkman CE, Wakshlag JJ, Page RL, Cerione RA. Augmentation of tissue transglutaminase expression and activation by epidermal growth factor inhibit doxorubicin-induced apoptosis in human breast cancer cells. J Biol Chem. 2004Oct;279(40):41461-41467
51. Hettasch JM, Bandarenko N, Burchette JL, Lai TS, Marks JR, Haroon ZA, Peters K, Dewhirst MW, Iglehart JD, Greenberg CS. Tissue transglutaminase expression in human breast cancer. Lab Invest. 1996Nov;75(5):637-645
52. Herman JF, Mangala LS, Mehta K. Implications of increased tissue transglutaminase (TG2) expression in drug-resistant breast cancer (MCF-7) cells. Oncogene. 2006May;25(21):3049-3058
53. Davies BR, Greenwood H, Dudley P, Crafter C, Yu DH, Zhang J, Li J, Gao B, Ji Q, Maynard J. et al. Preclinical pharmacology of AZD5363, an inhibitor of AKT: pharmacodynamics, antitumor activity, and correlation of monotherapy activity with genetic background. Mol Cancer Ther. 2012Apr;11(4):873-887
54. Yu P, Laird AD, Du X, Wu J, Won KA, Yamaguchi K, Hsu PP, Qian F, Jaeger CT, Zhang W. et al. Characterization of the activity of the PI3K/mTOR inhibitor XL765 (SAR245409) in tumor models with diverse genetic alterations affecting the PI3K pathway. Mol Cancer Ther. 2014May;13(5):1078-9101
55. Jambrovics K, Uray IP, Keresztessy Z, Keillor JW, Fésüs L, Balajth Z. Transglutaminase 2 programs differentiating acute promyelocytic leukemia cells in all-trans retinoic acid treatment to inflammatory stage through NF-κB activation. Haematologica. 2019Mar;104(3):505-515
56. Keillor JW, Apperley KYP, Abdullah Akbar A. Inhibitors of tissue transglutaminase. Trends Pharmacol Sci. 2015Jan;36(1):32-40
57. Oh K, Lee OY, Park Y, Seo MW, Lee DS. IL-1β induces IL-6 production and increases invasiveness and estrogen-independent growth in a TG2-dependent manner in human breast cancer cells. BMC Cancer. 2016Sep;16(1):724-735
58. Huang SP, Liu PY, Kuo CJ, Chen CL, Lee WJ, Tsai YH, Lin YF. The Gαh-PLCδ1 signaling axis drives metastatic progression in triple-negative breast cancer. J Hematol Oncol. 2017Jun;10(1):114-127
59. Kyparidou E, Athanasiadis A, Xydakis E, Papadakou M, Panagos G. Correlation of tissue transglutaminase expression on breast cancer tissue with time to relapse, overall survival, and clinical and molecular prognostic factors: a preliminary report. J BUON. 2005 Jan-Mar;10(1):81-87
60. Budillon A, Carbone C, Di Gennaro E. Tissue transglutaminase: a new target to reverse cancer drug resistance. Amino Acids. 2013Jan;44(1):63-72
61. Subbaram S, Dipersio CM. Integrin α3β1 as a breast cancer target. Expert Opin Ther Targets. 2011Oct;15(10):1197-1210
62. Leung EY, Kim JE, Askarian-Amiri M, Joseph WR, McKeage MJ, Baguley BC. Hormone resistance in two MCF-7 breast cancer cell lines is associated with reduced mTOR signaling, decreased glycolysis, and increased sensitivity to cytotoxic drugs. Front Oncol. 2014Sep;4:221-230
63. Greulich T, Hohlfeld JM, Neuser P, Lueer K, Klemmer A, Schade-Brittinger C, Harnisch S, Garn H, Renz H, Homburg U. et al. A GATA3-specific DNAzyme attenuates sputum eosinophilia in eosinophilic COPD patients: a feasibility randomized clinical trial. Respir Res. 2018Apr;19(1):55-65
64. Nomura S, Takahashi H, Suzuki J, Kuwahara M, Yamashita M, Sawasaki T. Pyrrothiogatain acts as an inhibitor of GATA family proteins and inhibits Th2 cell differentiation in vitro. Sci Rep. 2019Nov;9(1):17335-17347
Author contact
![]() Corresponding author: Prof. Nicoletta Bianchi, PhD. Department of Translational Medicine, University of Ferrara, Via Fossato di Mortara 70, 44124 Ferrara, Italy. E-mail: nicoletta.bianchiit (N.B.).
Corresponding author: Prof. Nicoletta Bianchi, PhD. Department of Translational Medicine, University of Ferrara, Via Fossato di Mortara 70, 44124 Ferrara, Italy. E-mail: nicoletta.bianchiit (N.B.).